


Abstract
To unveil the underlying risk structures in complex industrial systems, this paper proposes a hybrid analytical framework that integrates BERTopic modeling, a large language model (LLM), and social network analysis (SNA). This framework aims to extract systemic safety intelligence from unstructured accident reports. It first employs BERTopic to identify latent causal topics based on 745 Chinese accident investigation reports and utilizes DeepSeek-V3.1 (LLM) for semantic refinement and causal mapping of these topics. Subsequently, a semantic network of causal keywords based on positive pointwise mutual information (PPMI) is constructed, and its topological structure is analyzed using SNA methods. The study identifies and analyzes five major risk communities: confined spaces, fire, mining, construction, and road traffic. It reveals that accident causation exhibits the small-world characteristics of multi-factor coupling and non-linearity, with core risk nodes concentrated in systemic inducements such as organizational management and compliance deficiencies. The results demonstrate that this framework effectively identifies the latent systemic risk patterns embedded within the texts, providing methodological support for developing sustainable safety management mechanisms based on design for safety.
1. Introduction
Against the backdrop of rapidly advancing urbanization and increasingly complex industrial activities, the degree of risk coupling in production processes continues to intensify. Safety management consequently faces greater uncertainty and systemic pressure. According to statistics from the Ministry of Emergency Management of the People’s Republic of China, a total of 19,884 production safety accidents occurred nationwide in 2025, resulting in 18,261 fatalities [1]. Although the total number of accidents is declining, their severity and associated losses continue to highlight the challenges of safety governance in complex systems. Therefore, integrating safety management with the Sustainable Development Goals (SDGs) is critical. This integration not only advances the vision of zero casualties but is also essential for enhancing the long-term resilience of socio-economic systems and ensuring sustainable development [2,3].
In this context, the modernization of safety management requires an efficient feedback mechanism to systematically convert archived accident data into capabilities for preventative risk identification and governance. Accident investigation reports detail the sequence, causes, and consequences of events. They serve as essential knowledge repositories for identifying accident evolution mechanisms, categorizing risk patterns, and preventing recurrence [4]. Traditional methods have primarily relied on expert experience and classic accident causation frameworks to analyze these reports. For example, Wang et al. [5] manually analyzed 30 chemical explosion accidents based on the Swiss Cheese Model to reveal the propagation paths of management defects, while Wu and Sun [6] conducted a qualitative comparative analysis (QCA) on 37 underground engineering accident reports. Although these approaches provide in-depth insights into accident mechanisms, their high cognitive demands typically restrict sample sizes to a few dozen.
However, with the advancement of digital safety management, the accumulation of accident investigation reports has formed a massive repository of safety big data. Confronted with vast quantities of unstructured textual resources, relying solely on manual case-by-case analysis makes it difficult to cover the entire dataset and conduct in-depth mining within a limited timeframe. To overcome sample size limitations, statistical Natural Language Processing (NLP) techniques have been widely applied to automatically identify causal topics. Traditional probabilistic topic models, such as Latent Dirichlet Allocation (LDA), were the early mainstream choices. Hu et al. [7] utilized the LDA model to mine causal topics in coal mine gas explosion accidents; Wang et al. [8] conducted association rule analysis on 245 cement production accidents and also employed LDA to extract risk categories; similarly, Wang et al. [9] applied LDA for topic categorization in petrochemical HAZOP data. However, LDA is fundamentally based on the “Bag-of-Words” assumption, which focuses primarily on the co-occurrence of words and struggles to capture deep semantic contexts. To address this limitation, deep learning-based semantic topic modeling has emerged. Compared to LDA, the BERTopic model introduces an embedding layer from pre-trained language models, effectively preserving contextual semantics within a vector space. When analyzing the organizational vulnerability of construction projects, Zhang et al. [10] replaced traditional methods with BERTopic to more accurately aggregate risk descriptions with similar semantics. Moreover, Nanyonga et al. [11] found that BERTopic outperforms traditional models in extracting coherent and context-sensitive topics from complex aviation safety narratives. Likewise, Andrade and Walsh [12] applied this method to unstructured wildfire incident reports, achieving hazard classification without predefining topic numbers and enabling finer-grained causal factor identification. To further enhance the trustworthiness of such data-driven applications, Kumar et al. [13] developed an uncertainty-aware decision support system that integrates text narratives with conformal prediction for reliable accident code classification.
With the increasing complexity of modern industrial systems, modern systems theory defines safety as an emergent property arising from the interactions among system components [14]. Merely identifying isolated risk factors is insufficient to reveal the complex nonlinear coupling relationships within the system. An increasing number of researchers have combined text mining with social network analysis (SNA) to construct association networks among risk factors. Besklubova et al. [15] and Eteifa and El-adaway [16] primarily focused on quantifying factor interactions and identifying root causes within the construction industry. Jing et al. [17] and Wang et al. [18] employed topological metrics to identify core–periphery structures and key nodes in coal mine and air traffic control safety networks, thereby advancing research from fragmented factor identification toward systemic causal analysis. Meanwhile, Pan et al. [19] and Yang et al. [20] transformed unstructured reports into weighted, directed networks, revealing the chain propagation structures and typical risk pathways in subway and maritime accidents. Emphasizing the importance of integrating deep semantic context and extracting hierarchical system drivers, Liu et al. [21] incorporated BERT and tree-augmented naive Bayes to construct visualized risk analysis networks. Building on this network perspective, Liu et al. [22] and Kamil et al. [23] also suggested that uncovering the hierarchical penetration mechanisms of risks and systematically establishing the hierarchy of critical safety drivers may be important for translating underlying incident data into actionable governance measures.
In recent years, Large Language Models (LLMs) have created new possibilities for the textual analysis of safety accidents. Wei et al. [24] and Du and Chen [25] utilized LLMs to extract critical risk factors and spatiotemporal data from maritime and coal mine accident reports, respectively. Building on this extraction capability, researchers have further leveraged LLMs to structure domain knowledge. Ding et al. [26] and Huang et al. [27] utilized LLMs to assist in constructing accident risk knowledge graphs for subway and maritime operations, while Abellanosa et al. [28] highlighted the potential of integrating LLMs with knowledge management to advance construction Job Hazard Analysis (JHA). In addition, Liu et al. [29] and Taubert et al. [30] demonstrated the capacity of LLMs for complex reasoning through advanced prompt engineering strategies. Liu et al. [29] adopted Chain-of-Thought (CoT) prompting combined with the HFACS model to enable automated reasoning about human factors in general aviation accidents. Taubert et al. [30] utilized few-shot CoT prompting to transform fragmented safety texts from complex industrial environments into structured risk intelligence. Although LLMs offer promising semantic and reasoning capabilities, their application to large-scale accident datasets remains constrained by computational cost, processing time, and reproducibility concerns.
A synthesis of these advancements suggests an evolving methodological trajectory in accident report analysis, moving from manual interpretation toward topic mining, semantic modeling, and LLM-assisted reasoning. These developments have expanded the possibility of transforming unstructured accident narratives into more systematic forms of safety intelligence. Nevertheless, several gaps remain in relation to systemic risk identification and sustainable safety governance across industries and scenarios. First, existing approaches still face a trade-off between scalability and causal interpretability. Manual analyses are difficult to apply efficiently to large-scale text corpora, whereas fully automated or LLM-based approaches may not consistently preserve deeper causal logic, computational efficiency, and result stability at the corpus level. Second, more systematic human–machine collaborative frameworks are still needed to integrate topic modeling with the semantic reasoning capabilities of LLMs for accident causation analysis. Third, cross-industry systemic risk structures remain underexplored from a network-topology perspective, which may limit the identification of hazard hierarchies and broader drivers of critical safety.
To address these gaps, the primary objective of this study is to develop a hybrid analytical framework for improving the extraction of lessons learned and supporting the identification of systemic hazards from accident reports. Specifically, this study addresses three research questions:
- (1)
- How can topic modeling and LLMs be integrated to support the extraction of causal safety intelligence from large-scale unstructured accident reports?
- (2)
- What risk communities and internal interaction patterns can be identified across different high-risk industrial scenarios?
- (3)
- What systemic risk structures may underlie these accidents, and how might their topological characteristics inform sustainable safety management?
To this end, this study develops a hybrid BERTopic–LLM–SNA framework. Based on 745 accident investigation reports, the framework uses LLMs to map and refine BERTopic-generated topics in relation to accident causation theories, with the aim of constructing a semantically informed network representation. It then applies SNA to examine risk communities and their interconnections within the corpus. The study seeks to provide a more systematic basis for understanding systemic risks and to offer potentially useful insights for long-term safety management.
2. Data and Methodology
The research framework is shown in Figure 1. It is composed of four parts: data foundation, hazard extraction, network analysis, and sustainable safety management application.
Figure 1.
Research framework.
2.1. Data Collection and Preprocessing
2.1.1. Data Sources
Data for this study were obtained from the official websites of the Ministry of Emergency Management of the People’s Republic of China and the emergency management departments of 32 provincial-level administrative divisions. The data span the period from 2008 to 2024. A total of 745 accident investigation reports were collected using a combination of web crawlers and manual retrieval. These reports were compiled in strict accordance with relevant Chinese administrative regulations, ensuring their high authority and standardization. A comprehensive accident investigation report comprises six core sections: an overview of the involved entities, the accident sequence and rescue operations, casualties and direct economic losses, causes and nature of the accident, determination of responsibility with handling suggestions, and prevention and rectification measures. After removing extraneous prefatory text in each report, a corpus for accident causation analysis containing approximately seven million Chinese characters was constructed. Given the uneven public availability of accident investigation reports across years and regions, the dataset is more suitable for identifying the overall structural characteristics of accident causation than for making robust temporal comparisons. Accordingly, the present study focuses on the aggregate network structure based on the full available corpus.
To determine the sectoral distribution of the dataset, a statistical analysis of accident categories was conducted based on the report titles. As shown in Figure 2, the top five accident categories are traffic accidents, fire and explosion, poisoning and asphyxiation, collapse, and falls from heights. These categories cumulatively account for 82.42% of the total sample.
Figure 2.
Frequency and cumulative percentage distribution of accident categories in the dataset (N = 745).
2.1.2. Text Preprocessing
The Chinese writing system does not feature explicit word boundary markers, which distinguishes it from languages like English that use spaces to separate words. As a result, serialized word segmentation is carried out on the text using the Jieba segmentation tool. Since accident investigation reports are unstructured texts containing a significant number of industry-specific terms, this study incorporates professional safety terminology from sources such as the Sogou Cell Thesaurus [31], the Tsinghua University Open Chinese Lexicon [32], and open-source Chinese NLP resources available on GitHub.
Accident investigation reports frequently contain negative expressions. Standard Chinese stop-word filtering often strips away these critical negative semantics. For instance, “not implemented” might be erroneously segmented into “implemented,” resulting in a complete semantic inversion. To mitigate this, a negation whitelist was established. During preprocessing, negative prefixes were either preserved or merged with subsequent terms (a process denoted as fuse_negations) to maintain the logical integrity of accident causation.
We built a custom stop-word list by aggregating resources from the Harbin Institute of Technology, the Machine Intelligence Laboratory at Sichuan University, and Baidu. The corpus was cleaned by filtering out non-contributory text, including place names, ethnic names, and special symbols.
2.2. BERTopic
2.2.1. Model Principles and Architecture
This study employs the BERTopic topic model to mine latent causes from accident investigation report texts. Latent Dirichlet Allocation (LDA) models rely on the Bag-of-Words assumption. They ignore word order and contextual semantics and face severe data sparsity issues when processing short texts. In contrast, BERTopic is a modular topic modeling algorithm [33]. It effectively captures contextual dependencies and latent semantics within accident texts by combining the deep semantic representation capabilities of pre-trained LLMs with advanced clustering algorithms.
Every accident report was segmented into paragraphs in accordance with the linguistic characteristics of Chinese accident texts. Each paragraph was then treated as an independent document for modeling. On this basis, Qwen3-Embedding-0.6 B [34] was selected as the document embedding model to transform unstructured accident texts into high-dimensional semantic vectors. Combining a lightweight 0.6 B design with the Chinese semantic representation strengths of the Qwen architecture, this model effectively balances computational efficiency with the quality of vector representations for accident investigation reports.
For vector dimensionality reduction, the Uniform Manifold Approximation and Projection (UMAP) algorithm was employed, which preserves global features while maintaining local data structure [35]. Following this, the HDBSCAN algorithm [36] was used to cluster the reduced vectors. Unlike traditional methods, HDBSCAN avoids the need for a pre-defined topic count and automatically filters noise. This makes it well-suited for the complex data found in accident investigation reports. Topic keywords were extracted via c-TF-IDF, and the Maximal Marginal Relevance (MMR) algorithm was then used to re-rank candidate words. By weighing term relevance against diversity, MMR mitigates the semantic redundancy common in standard extraction, yielding topic words that offer both broader coverage and clearer interpretability [33].
2.2.2. Key Parameter Settings
The key parameters were determined with reference to the characteristics of the corpus, the modeling logic of BERTopic, the interpretability of the resulting topics, as well as topic coherence and the proportion of noise points.
In the UMAP dimensionality reduction stage, the number of neighbors (n_neighbors) was set to 10 to capture local semantic neighborhoods while preserving sufficient global structure among paragraphs. The number of components (n_components) was set to 5 to retain the core semantic information while reducing clustering instability caused by high-dimensional sparsity. The minimum distance (min_dist) between points was set to 0.03 so that semantically similar paragraphs remained relatively compact in the reduced space, which is beneficial for subsequent density-based clustering.
In the HDBSCAN stage, the minimum cluster size (min_topic_size) was set to 30 to prevent the generation of overly fragmented topics, ensuring that each retained topic represents a statistically stable and highly interpretable accident-causation pattern (i.e., requiring at least 30 related paragraphs). The minimum number of samples (min_samples) was set to 1 in order to maximize the retention of valid text segments and reduce excessive exclusion of sparse but meaningful paragraphs as noise.
During topic representation, the top 20 keywords were retained for each topic. The MMR algorithm was then applied to optimize vocabulary diversity. MMR mitigates the overrepresentation of general terms, thereby allowing for the extraction of a broader range of specific causal keywords.
2.2.3. Topic Model Evaluation Metrics
To quantitatively evaluate the clustering quality and interpretability of the BERTopic model, the topic coherence metric () was employed [37]. is computed based on a Boolean sliding window, normalized pointwise mutual information (NPMI), and an indirect cosine similarity measure with arithmetic mean aggregation. For a topic represented by its top keywords, , and the context vector of keyword is defined as follows:
where denotes the context vector of keyword , and in the setting. The centroid of all context vectors is defined as follows:
where denotes the centroid of all context vectors, and is the total number of top keywords in the topic. The topic coherence score is calculated as follows:
where denotes the topic coherence score, and represents the cosine similarity between the context vector of keyword and the centroid vector. The normalized pointwise mutual information between two keywords is defined as follows:
where denotes the co-occurrence probability of keywords and estimated within the Boolean sliding window; and denote the occurrence probabilities of keywords and , respectively; is a small smoothing constant introduced to avoid undefined logarithmic values; and denotes the natural logarithm.
2.3. LLM Optimization of Topics and Keywords
2.3.1. Model Configuration and Prompt Engineering
The DeepSeek-V3.1 model was selected for this study and accessed via the API. The temperature parameter was set to 0.1, and the output was enforced in JSON format to ensure determinism and reproducibility. The prompt engineering followed a structured framework encompassing role setting, task definition, and constraint conditions.
2.3.2. Topic Filtering
To identify valid topics with causal attributes from the candidates, an LLM was employed to assess whether the candidate topics generated by BERTopic contained causally meaningful information. These topics were then mapped to the 4 M theory framework (Man, Machine, Medium, Management) [38,39]. Topics reflecting unsafe acts, unsafe conditions of machinery, environmental hazards, or management defects were classified as valid causal topics. Conversely, topics presenting primarily non-causal background information or those lacking a clear causal classification were labeled as None and excluded.
Given the interconnected and complex nature of accident causation, a single topic often involves multiple 4 M subcategories (e.g., management defects inducing human errors). Therefore, this study prioritized the reliability of the binary classification between valid causal topics and noise topics, rather than the uniqueness of subcategory division. The full prompt template used for topic classification is provided in Appendix A. For evaluation, a manually annotated validation set containing 20% of topics that were randomly sampled was constructed.
2.3.3. Keyword Filtering
To construct a semantic network of accident-causation vocabulary, keywords within valid causal topics were further screened at the semantic level. Because BERTopic-generated keywords often contain a mixture of causally relevant and non-causal vocabulary, directly using them in network construction would introduce noisy edges and reduce structural interpretability. Therefore, for each valid topic, the LLM was instructed to retain only those terms from the BERTopic keyword list that were directly relevant to accident causation while excluding technical terms with weak causal relevance, general industry expressions, and overly generic nouns. After deduplication, a unique set of causal terms was obtained for subsequent network construction.
To improve screening consistency, a few-shot learning strategy was adopted. Specifically, ten manually verified examples were embedded in the prompt as in-context demonstrations. Each example consisted of an original BERTopic keyword list and its corresponding human-screened results, namely, the subset of keywords manually retained as causally relevant. In this way, the model was provided with explicit guidance on which terms should be retained and which should be discarded. During inference, the model was provided with the 4 M classification result, the topic keyword list, and representative documents for each valid topic, and was instructed to select only those terms from the original keyword list that were directly relevant to accident causation. To ensure that all retained terms were grounded in the original BERTopic output, a code-based post-processing step was applied after model inference to remove any output term that did not appear in the original keyword list. Finally, keyword screening performance was evaluated by comparing the overlap between the LLM-screened keyword set and the manually screened set. The full prompt template used for keyword filtering is provided in Appendix B.
2.4. Construction and Analysis of the Accident Causation Network
2.4.1. Network Construction
To mitigate statistical bias caused by the varying lengths of accident investigation reports, specific rules were applied to the construction of the co-occurrence matrix. If two causal keywords appear in the same report, their co-occurrence frequency is recorded as 1, regardless of how many times they repeat within the text. Additionally, the co-occurrence of a keyword with itself was excluded. Traditional co-occurrence analysis typically uses the raw frequency of two words appearing in the same text unit as the association strength. However, in accident investigation corpora, high-frequency general terms and templated expressions often introduce numerous weak, interpretively poor connections, thereby obscuring truly significant causal associations. Therefore, this study introduced positive pointwise mutual information (PPMI) to quantify the specificity of semantic associations by calculating the ratio of the actual co-occurrence probability of keywords to their expected probability under the assumption of independence [40]. The formula is as follows:
where and represent two distinct keywords in the accident corpus, and , , and follow the same probability definitions as those given above.
Based on the PPMI calculations, a threshold was set to retain only edges satisfying the condition, thereby filtering out weak associations and noise. The retained keyword co-occurrence relationships were then represented as an undirected weighted network , where denotes the set of accident causation keywords (nodes), and denotes the set of co-occurrence relationships satisfying the threshold condition (edges). The edge weights were defined by the corresponding PPMI values, and the resulting weighted adjacency matrix was denoted by , where represents the PPMI weight between nodes and . Through this mapping process, unstructured textual co-occurrence data were transformed into a computable network structure for subsequent visualization and structural analysis using Gephi 0.10.1.
2.4.2. Community Detection
Accident causation factors often exhibit clustering characteristics, meaning specific combinations of causes tend to jointly lead to certain types of accidents. To identify these potential risk subgroups, the Louvain algorithm [41] was adopted for community detection within the PPMI semantic network. The Louvain algorithm is a heuristic method based on modularity optimization. Its core objective is to partition the network into tightly knit communities, where the density of edges within communities is significantly higher than the density of edges between them.
2.4.3. Social Network Analysis
To elucidate the evolutionary mechanisms of accident causation from a systems theory perspective, we quantified the network using the following topological metrics:
- (1)
- Weighted Degree
Distinct from simple degree centrality, weighted degree incorporates PPMI edge weights to measure the intensity of relationships. This metric identifies core causation nodes. A higher weighted degree indicates that a factor not only co-occurs frequently but also exhibits strong semantic associations with other factors, serving as a central hub within the network. The weighted degree of a node is defined as the sum of the weights of all its connected edges, which is formulated as follows:
where denotes the weighted degree of node , represents the weight of the edge between nodes and in the weighted adjacency matrix , and is the total number of nodes in the network.
- (2)
- Network Density
Except for weighted degree, which was computed from the weighted adjacency matrix , the remaining structural metrics were calculated based on the thresholded unweighted network derived from the retained edges. Network density gauges the overall saturation of connections within the causation network. A higher density implies a more tightly coupled system where risk factors are extensively interconnected, thereby increasing the number of potential pathways for accident propagation. For an undirected network with nodes and edges, the network density is defined as follows:
where represents the network density, with values in the interval [0, 1]; is the actual number of edges present in the network; is the total number of nodes; and represents the theoretical maximum number of possible edges.
- (3)
- Transitivity
Transitivity measures the local clustering tendency of the network, specifically the trend toward closed triangles (i.e., if A is related to B, and B to C, then A is likely related to C). Higher transitivity implies more complex chain reaction paths among causes, increasing the likelihood of risk diffusion and reinforcement within a localized range. The formula is as follows:
where is the number of closed triangles in the network, and is the total number of connected triplets.
- (4)
- Degree Centralization
Degree centralization measures the tendency of the entire network toward centralization, reflecting whether it is dominated by a few core nodes. High centralization implies that a minority of key factors control the majority of risk propagation paths, concentrating system vulnerability within these hub nodes. This metric is calculated based on the difference between the degree centrality of individual nodes and the maximum degree centrality in the network, with the formula as follows:
where is the degree centralization of the network; is the degree centrality of node ; is the maximum observed value of degree centrality in the network; and the denominator represents the theoretical maximum possible value of the sum of these differences.
- (5)
- K-Core Decomposition
K-core decomposition was used to identify densely connected core subgraphs in the causation network. Unlike network density, weighted degree, and transitivity, -core is not a single scalar metric but a subgraph-based structural definition. For a given network , the -core is defined as the maximal subgraph in which every node has degree at least . This property can be formally expressed as follows:
where denotes the degree of node within the subgraph . The coreness of node , denoted by , is defined as the maximum value of such that node belongs to the corresponding -core:
By recursively removing nodes whose degrees are less than , -core decomposition reveals progressively more cohesive substructures of the network. In this study, it was used to identify the core causal subgraphs and major risk transmission patterns underlying accident occurrence.
3. Results and Discussion
3.1. Evaluation of the Hybrid Analysis Framework
3.1.1. Effectiveness of the BERTopic–LLM Pipeline
This study initially evaluated the efficacy of the constructed BERTopic-LLM hybrid framework in processing unstructured safety intelligence. Traditional qualitative analysis is constrained by the cognitive load of manual coding, whereas purely statistical models often fail to capture complex causal logic. As shown in Figure 1, by integrating the clustering capabilities of BERTopic with the semantic reasoning of the DeepSeek-V3.1, we established a standardized knowledge extraction pipeline.
Table 1 presents the experimental results. The BERTopic model initially generated 474 latent topics. The clustering quality of the model was assessed using the score. Setting the diversity parameter of the MMR model to 0.3 increased the diversity of topic descriptors, yielding a score of 0.46 while maintaining the outlier noise ratio at 28% [42]. Subsequently, DeepSeek-V3.1 was incorporated to perform causal reasoning and noise filtering, utilizing the 4 M theory as the semantic framework. This process resulted in the retention of 401 valid causal topics and 559 key causal keywords.
Table 1.
Topics and keywords extracted from accident investigation reports.
In the binary classification task for causal topics, this synergistic framework achieved a Precision of 92.31%, a Recall of 98.63%, and an F1-Score of 95.36%. Regarding the more fine-grained keyword screening task, the model utilized a few-shot Learning strategy. It achieved a Precision of 71.72%, a Recall of 67.62%, and an F1-Score of 69.61% in retaining causal terms while eliminating general terms.
This study leverages the reasoning capabilities of LLMs to achieve automated cleaning of latent topics. Although the F1-Score for keyword screening was lower than that for topic classification, the retained causal terms were further refined in the subsequent network construction stage using a baseline PPMI threshold of 0.7. Consequently, a high-confidence semantic association structure was formed, providing reliable input for the topological analysis of the accident causation network. The rationale and structural robustness of this threshold are further examined in Section 3.1.2.
Under this framework, the LLM is required to read only the representative passages generated by BERTopic for each topic, rather than the entire corpus of accident investigation reports. Compared to direct full-text input, this strategy reduces input volume by approximately 96%, thereby lowering model inference costs and enhancing the feasibility and sustainability of large-scale analysis. Crucially, this human–machine synergistic paradigm fundamentally reduces the marginal cost of knowledge discovery, enabling the continuous monitoring of massive volumes of reports.
3.1.2. Sensitivity Analysis of PPMI Thresholds
A sensitivity analysis was conducted to assess the appropriateness of the 0.7 PPMI threshold and the structural robustness of the identified systemic risks, as shown in Table 2. The baseline dataset, after LLM-based keyword screening, contained 559 keywords and 9,722,156 total co-occurrences.
Table 2.
Sensitivity analysis of network structure across different PPMI thresholds.
Despite the marked reduction in the number of retained edges, the topology of the network remained stable. Across all three threshold settings, community detection consistently identified five risk communities. Although the 0.9 threshold removed nearly 70% of the edges present at the 0.5 level, the overall community pattern persisted. This confirms that the modular structure is not an artifact of threshold selection, but captures stable associative relationships within the accident data.
Methodologically, the 0.7 threshold provides an appropriate balance between inclusiveness and interpretability. A lower threshold (0.5) retains numerous weak ties that can obscure primary causal pathways, while a stricter threshold (0.9) over-sparsifies the network, potentially severing bridging connections between core nodes. Therefore, 0.7 was selected to preserve the essential topological backbone while ensuring structural clarity for subsequent analysis.
3.2. Topological Analysis of the Accident Causation Network
3.2.1. Global Network Properties
As indicated by the sensitivity analysis, PPMI ≥ 0.7 was adopted as the benchmark threshold to filter weak associations and preserve the essential topological structure of the network. The global network properties are shown in Table 3.
Table 3.
Key metrics of the global network.
The average degree of the network is 71.54, indicating that each causal keyword has strong semantic associations with approximately 72 other keywords. This suggests that accidents are not linear evolutions of single factors, but rather complex couplings of multiple factors within specific spatiotemporal contexts. The degree centralization is 0.32, revealing the existence of some hub nodes. However, the network is not highly dominated by any single node, presenting a relatively decentralized, multi-center structure. A transitivity coefficient of 0.41, combined with a relatively low density (0.15), indicates a tendency for causal factors to form tight groups or clusters. These small-world properties are consistent with findings of Zhou et al. [43] in metro construction accident networks and Wang et al. [18] in air traffic control safety risk analysis. This structural characteristic also provides a statistical basis for the subsequent identification of risk communities in specific scenarios.
3.2.2. Community Detection and Analysis
This study utilized Gephi software to visualize the PPMI-based causal term semantic network. In the network, nodes correspond to accident causation keywords, while edges represent significant semantic associations between nodes after threshold screening. Consistent with the sensitivity analysis, the network was partitioned into five risk communities using the Louvain algorithm (Figure 3). These correspond to five high-risk scenarios: confined spaces, fire, mining, construction, and road traffic. The weighted degree rankings of causal nodes within each community (as shown in Table 4) reveal distinct accident causation mechanisms in different scenarios. For a dynamic exploration of the global topology, please refer to Supplementary Materials.
Figure 3.
Visualization of the modularity analysis of the PPMI-based causal term semantic network. Different colors represent the distinct communities.
Table 4.
Top 30 key nodes by weighted degree in each community.
To elucidate the interplay between systemic and scenario-specific risks, this study visualized each community from dual perspectives (Figure 4, Figure 5, Figure 6, Figure 7 and Figure 8). In the global topological view (a), node size is proportional to the weighted degree within the global network. In the local community view (b), node size corresponds to the weighted degree within the specific community, highlighting the dominant causal factors for that scenario. Furthermore, edge weights in view (b) are defined by PPMI values, where thicker edges indicate stronger semantic associations between nodes.
- (1)
- Community 1 (Confined Space): Physical instability with regulatory violations
Figure 4.
Visualization results of the causal network for Community 1 (Confined Space): (a) Topological layout of the community within the global network; (b) Internal network structure of the community.
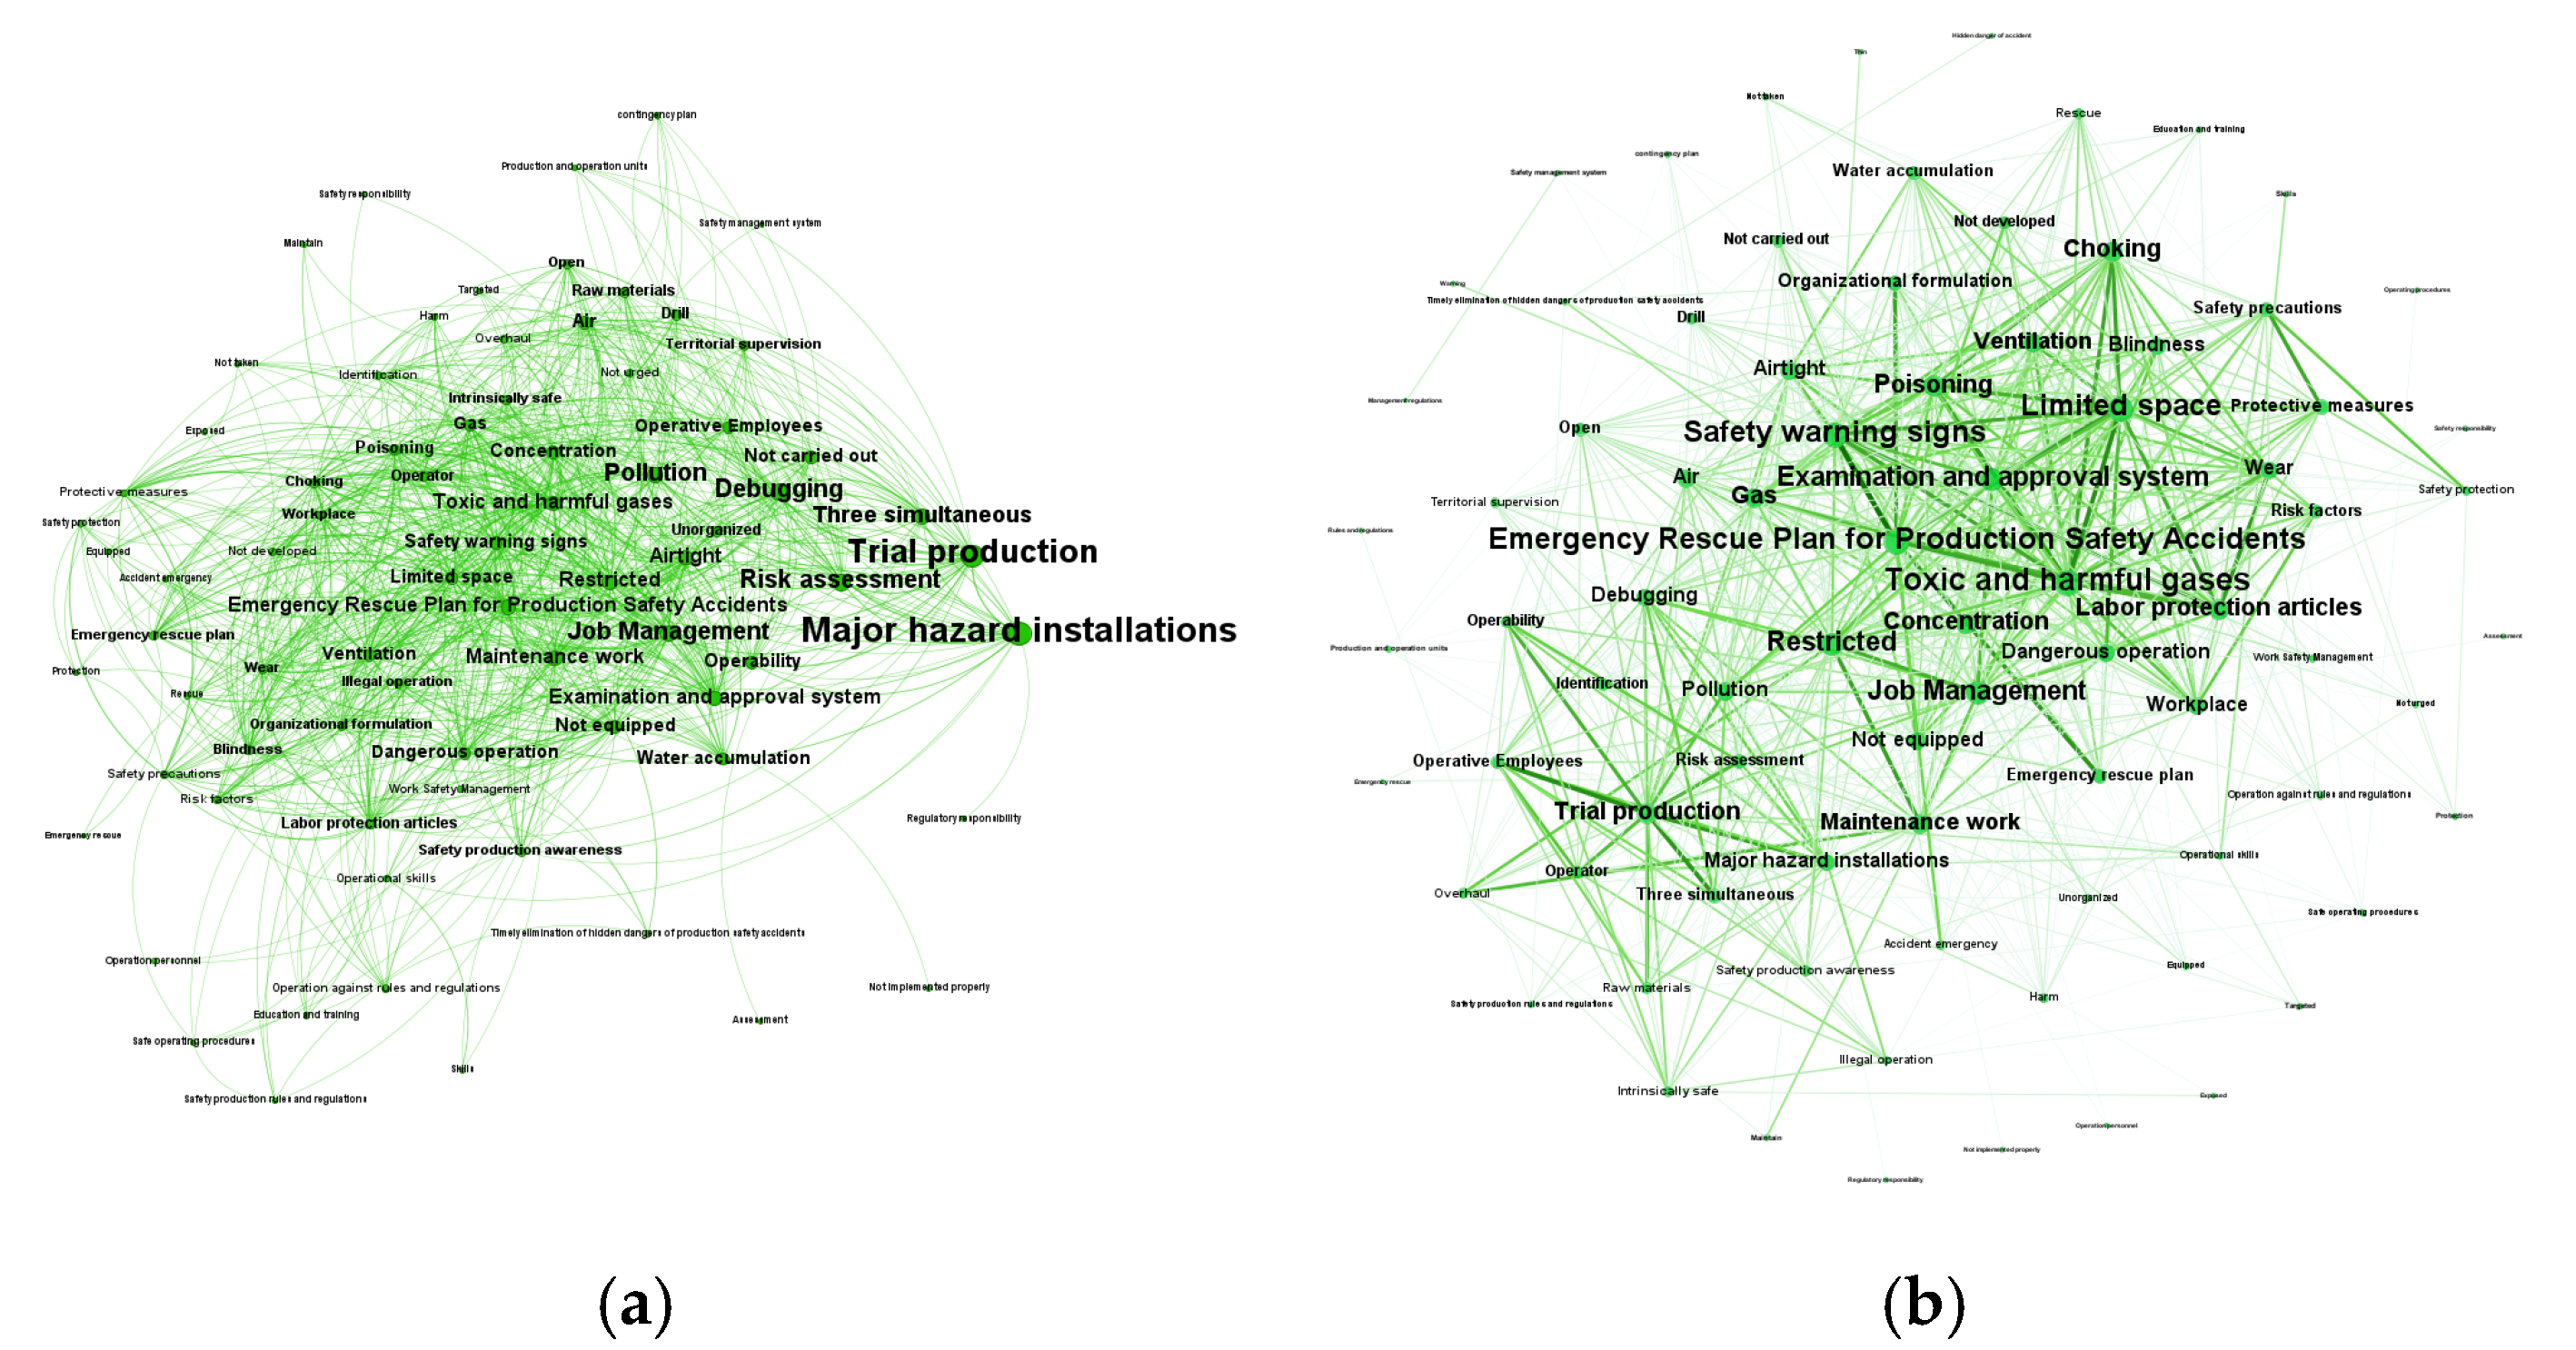
As illustrated in Figure 4b, the core nodes “Toxic and harmful gases”, “Ventilation”, and “Labor protection articles” demonstrate high co-occurrence. This indicates that accidents often originate from abnormalities in environmental parameters within a “Limited space”. This reveals that accidents are often driven by the coupling of environmental abnormalities within a confined space and personnel violations (e.g., lack of ventilation or labor protection articles), which ultimately results in poisoning and choking.
Key causal nodes, including “Emergency Rescue Plan for Production Safety Accidents”, “Safety warning signs”, and the “Examination and approval system”, reveal systemic defects in the enterprise’s safety management system at a deeper level. In terms of operational management, this is characterized by the failure to set conspicuous “Safety warning signs” for confined spaces, the failure to equip personnel with appropriate protective gear, and the failure to implement ventilation and protection measures. At the institutional level, it reflects that “Safety production rules and regulations” and “Safe operating procedures” related to confined spaces are unsound, “Education and training” is inadequate, and the “Emergency Rescue Plan for Production Safety Accidents” is missing.
To sum up, Community 1 maps a production safety accident resulting from the multi-link coupling of inherent environmental risks, absence of management systems, loss of behavioral control, and failure of emergency response.
The nodes “Trial production” and “Major hazard installations” appear most prominent in size within Figure 4a. However, in Figure 4b, they do not occupy the central position of the network. Instead, they are situated outside the core causal group formed by “Toxic and harmful gases” and “Limited space”, aggregating at the bottom of the network to form a new edge connection cluster. This structural arrangement suggests that the influence of “Trial production” and “Major hazard installations” is significant within the global network, and they essentially constitute the backbone architecture of the risk network. They function as key hubs connecting different functional communities and serve as common driving factors for risk evolution and accident occurrence across diverse operational scenarios.
- (2)
- Community 2 (Fire Safety): Absence of intrinsically safe conditions and emergency failure
Figure 5.
Visualization results of the causal network for Community 2 (Fire Safety): (a) Topological layout of the community within the global network; (b) Internal network structure of the community.
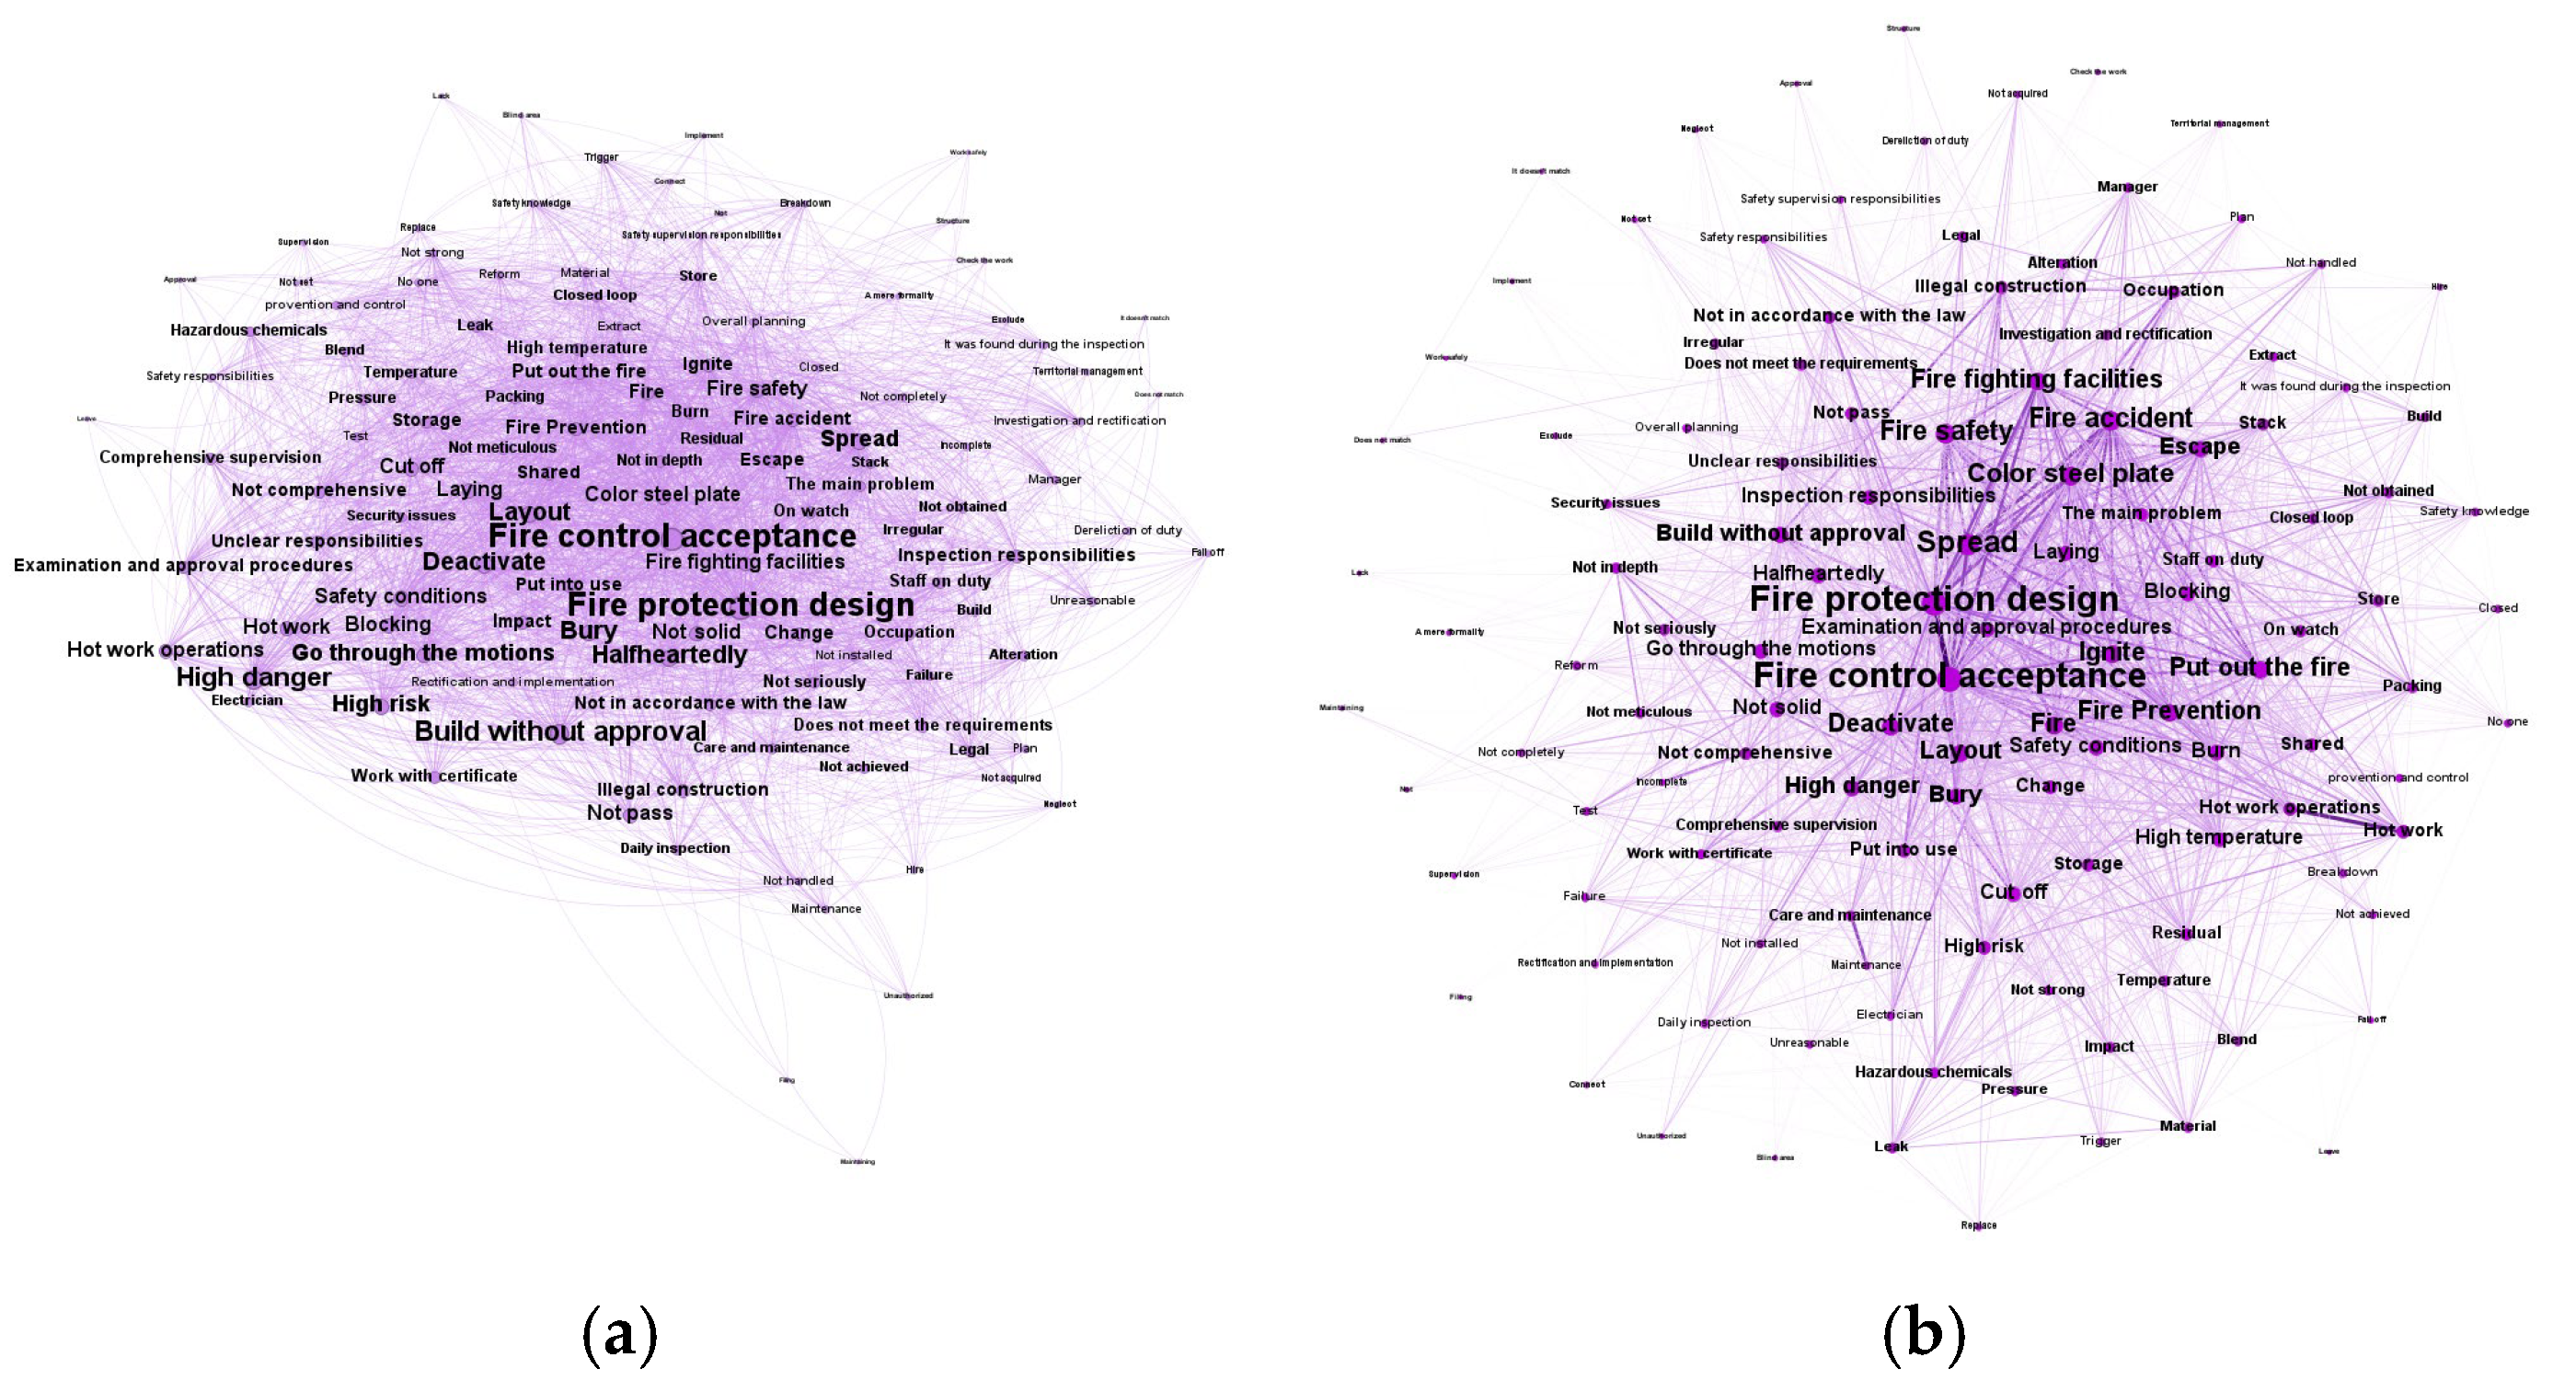
In Figure 5, the prominence of the nodes “Fire control acceptance” and “Fire protection design” suggests that deficiencies in intrinsically safe conditions, especially at the design and acceptance stages, were salient features in many of the reported fire cases. These venues often involve illegal construction or unauthorized expansion and renovation. Due to the absence of fire design review, completion acceptance, and fire control acceptance, these buildings suffer from inherent defects in spatial layout and physical separation, failing to meet the required safety conditions.
An analysis of the evolutionary paths of associated nodes, such as “Firefighting facilities”, “Deactivate”, and “Escape”, indicates that the systemic failure of the fire safety management system is a key driver for the escalation from initial fire to catastrophic accident. On one hand, fixed firefighting facilities are often found in a state of long-term deactivation, damaged, or left in manual mode due to improper maintenance, preventing effective control of early-stage fires. On the other hand, because the contingency plan is missing and drills become a mere formality, personnel generally lack self-rescue capabilities. They often miss the optimal escape window by attempting to retrieve personal belongings or choosing incorrect evacuation routes.
The prominent nodes “Build without approval”, “Halfheartedly”, and “Go through the motions” in Figure 5a reflect fragmented supervision and declining administrative efficacy, allowing “Build without approval” and illegal operations to evade oversight. Unclear boundaries in safety and fire protection duties between departments, combined with special rectifications that go through the motions, cause deep-seated risks and management loopholes to accumulate and amplify.
Overall, Community 2 reflects a multi-factor coupling disaster mechanism driven by defects in engineering intrinsically safe conditions, management system failure, behavioral deviation, and insufficient governance.
As shown in Table 4, the node “Color steel plate” ranks high in weighted degree, offering direction for targeted governance. Its high ranking stems primarily from numerous fire cases where Expanded Polystyrene (EPS) or Polyurethane (PU) was illegally used in the core or insulation of the color steel plate. These materials possess low ignition points and high burn rates, releasing massive amounts of toxic smoke during combustion, which is the primary cause of rapid fire spread in many accidents.
- (3)
- Community 3 (Mining): Concealed hazards and the illusion of compliance
Figure 6.
Visualization results of the causal network for Community 3 (Mining): (a) Topological layout of the community within the global network; (b) Internal network structure of the community.
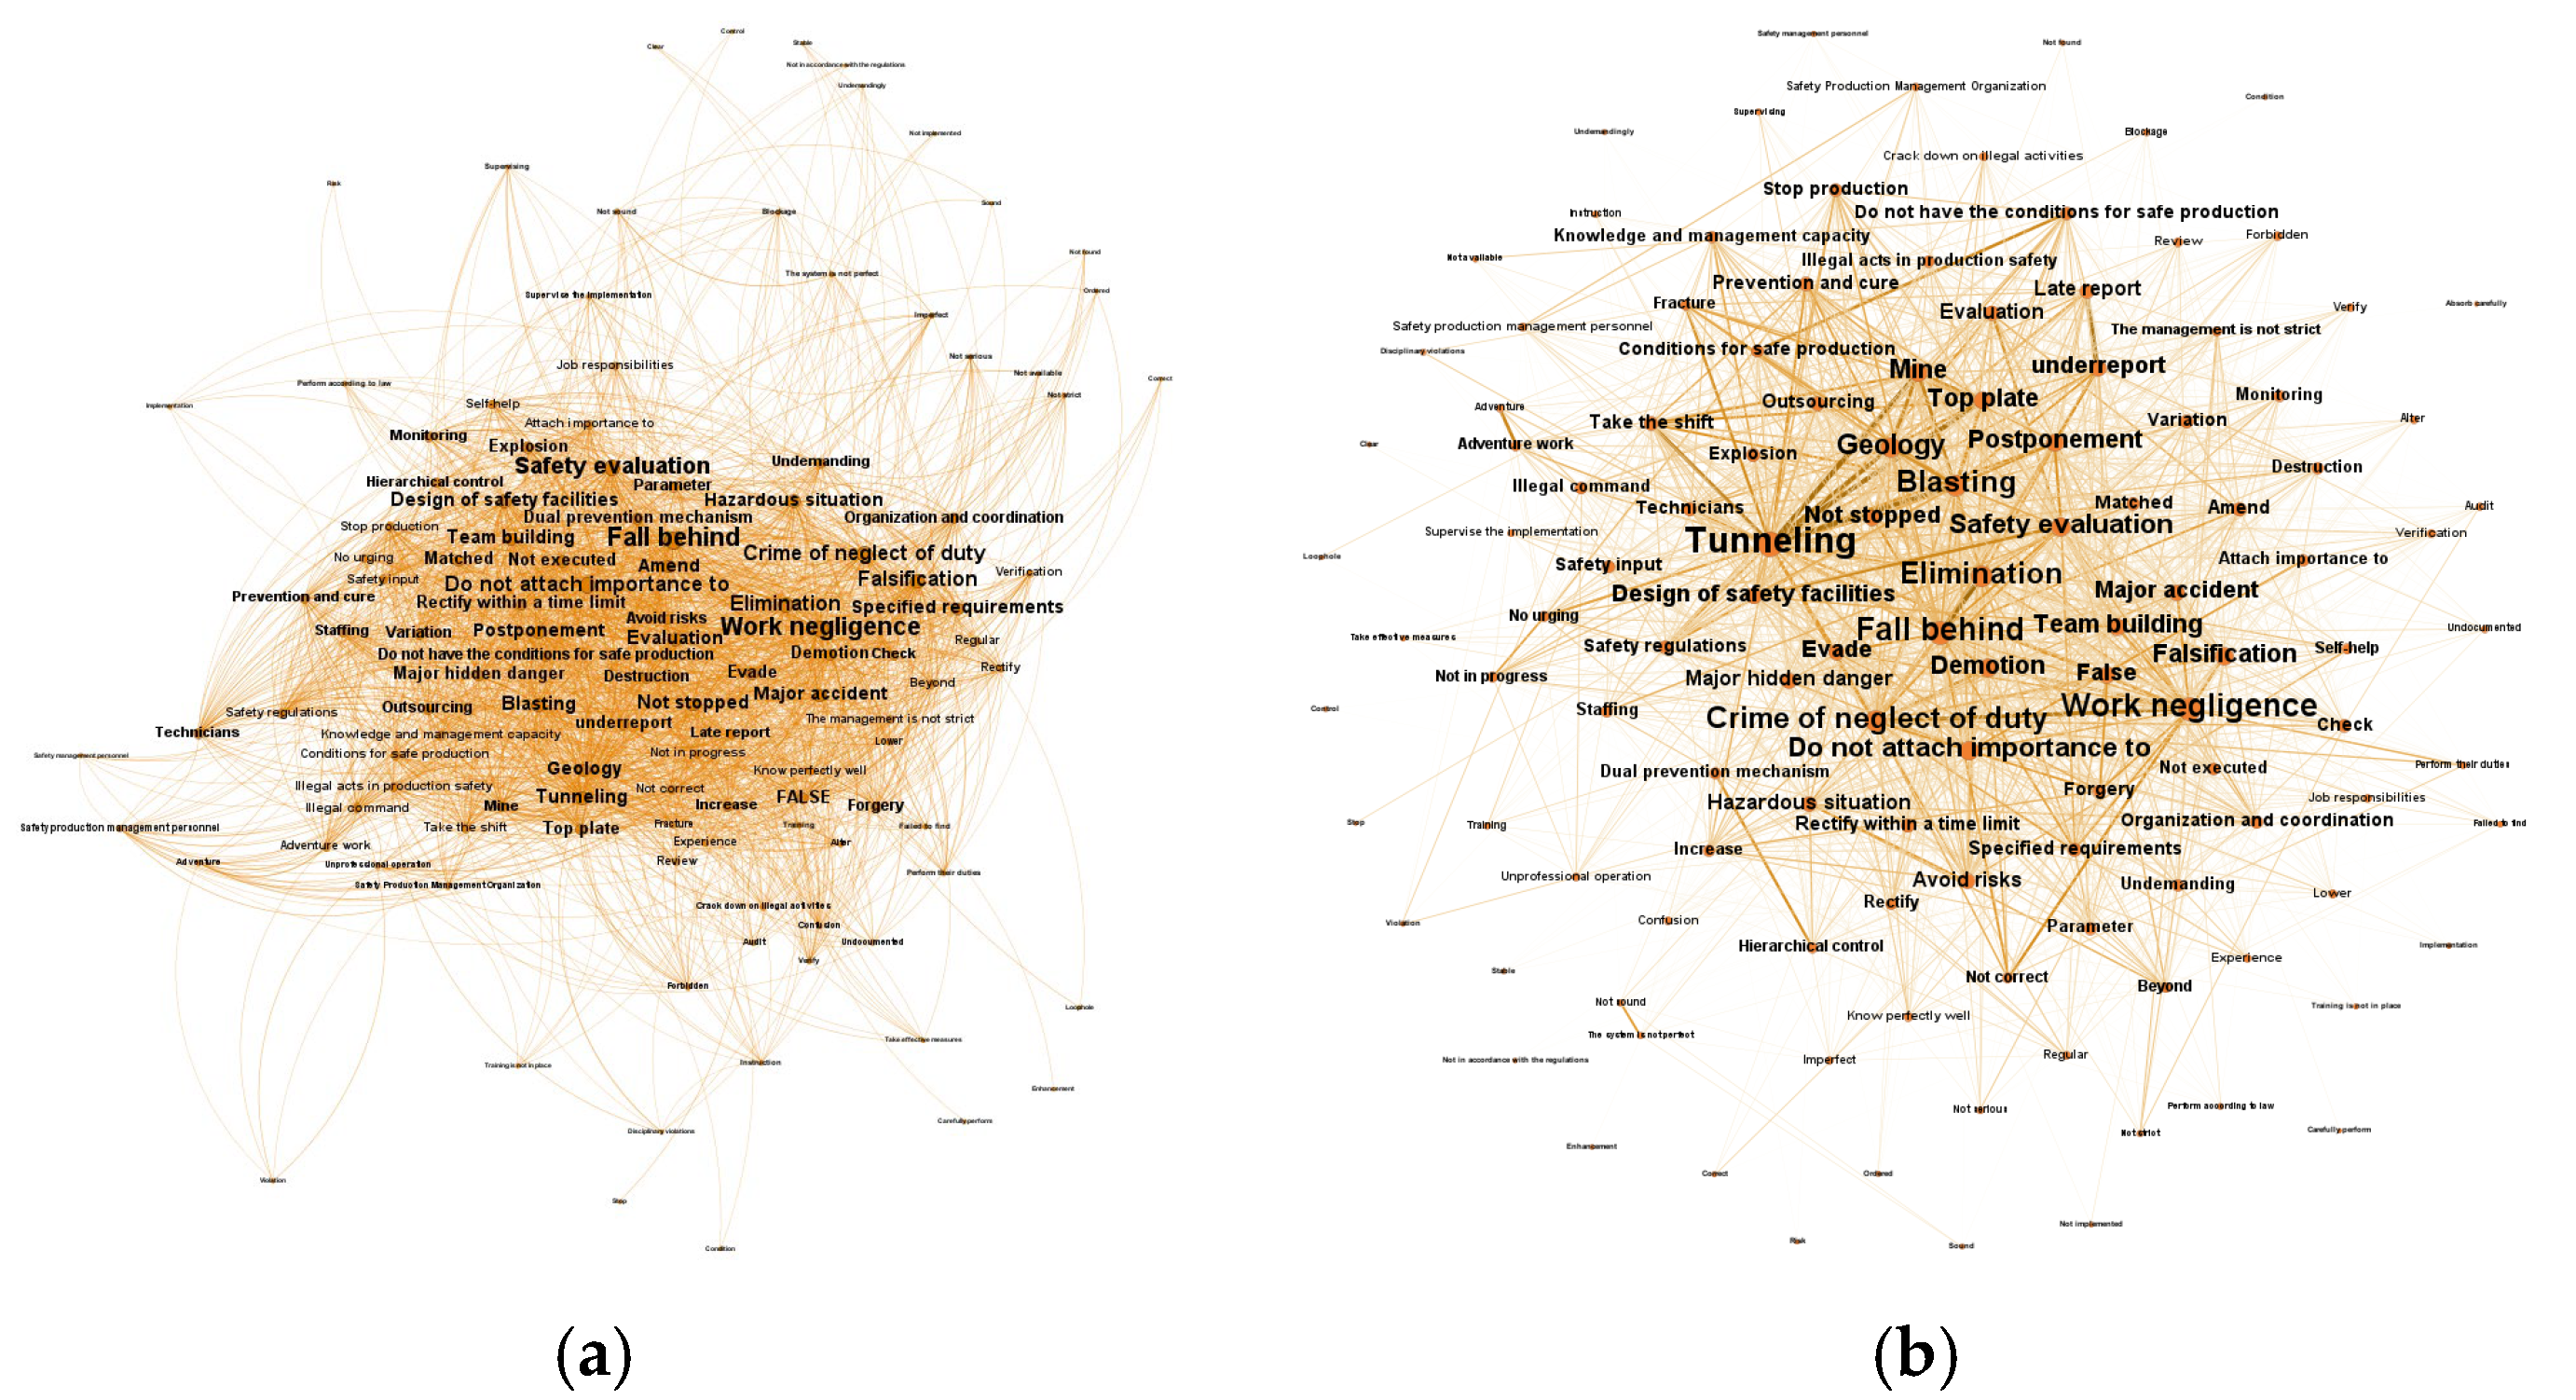
The core nodes “Tunneling”, “Geology”, “Mine”, “Top plate”, and “Blasting” are closely interconnected in Figure 6. This connectivity indicates that mining accidents often stem from inadequate investigation, verification, and dynamic governance of concealed hazards, specifically water accumulation in old goafs, complex geological structures, and instability in the structural planes of the roof strata. During the tunneling phase, mandatory procedures for advanced exploration and the management of abnormal precursors are frequently neglected. Similarly, during the extraction phase, insufficient control over the stope structure and support conditions allows hazards such as water inrush, roof falls, and collapse to escalate into sudden accidents under disturbance. As a high-risk operation, blasting is characterized by critical deficiencies, including the use of uncertified personnel, inadequate evacuation measures, and the omission of hole-sealing or post-blast inspections. These failures create ignition sources in flammable and explosive gas environments. Meanwhile, violations such as cross-boundary mining and the unauthorized removal of seals to sustain production force the system to operate beyond its designed safety limits for extended periods, increasing both the probability and severity of accidents.
The global view in Figure 6a uncovers profound systemic drivers. The prominence of nodes like “Fall behind”, “Work negligence”, “Safety evaluation”, “Elimination”, and “Falsification” collectively highlight a deficiency in intrinsically safe conditions masked by an illusion of compliance. In terms of equipment, the continued use of machinery slated for elimination and obsolete processes, coupled with inadequate and unreliable safety devices, directly compromises intrinsic safety. Within the evaluation process, failures to conduct on-site surveys or the issuance of fraudulent reports allow mines lacking essential safety measures to pass acceptance checks. As a result, market access and supervision depend on distorted information, creating a structural risk where apparent compliance conceals actual insecurity. Furthermore, the presence of nodes “Underreport” and “Late report” in Table 4 highlights an erosion of regulatory enforcement and lags in emergency response. Multiple accidents demonstrate that regulatory bodies often fail to verify conditions on-site or halt illegal activities, often adopting a passive or laissez-faire approach. Additionally, the practices of underreporting and late reporting directly lead to rescue delays and obstructed emergency coordination.
In summary, mining safety accidents result from the confluence of multiple factors, including the absence of technical controls, operational misconduct, governance system failure, and delayed regulatory response.
- (4)
- Community 4 (Construction): Organizational fragmentation and breakdown of the responsibility chain
Figure 7.
Visualization results of the causal network for Community 4 (Construction): (a) Topological layout of the community within the global network; (b) Internal network structure of the community.
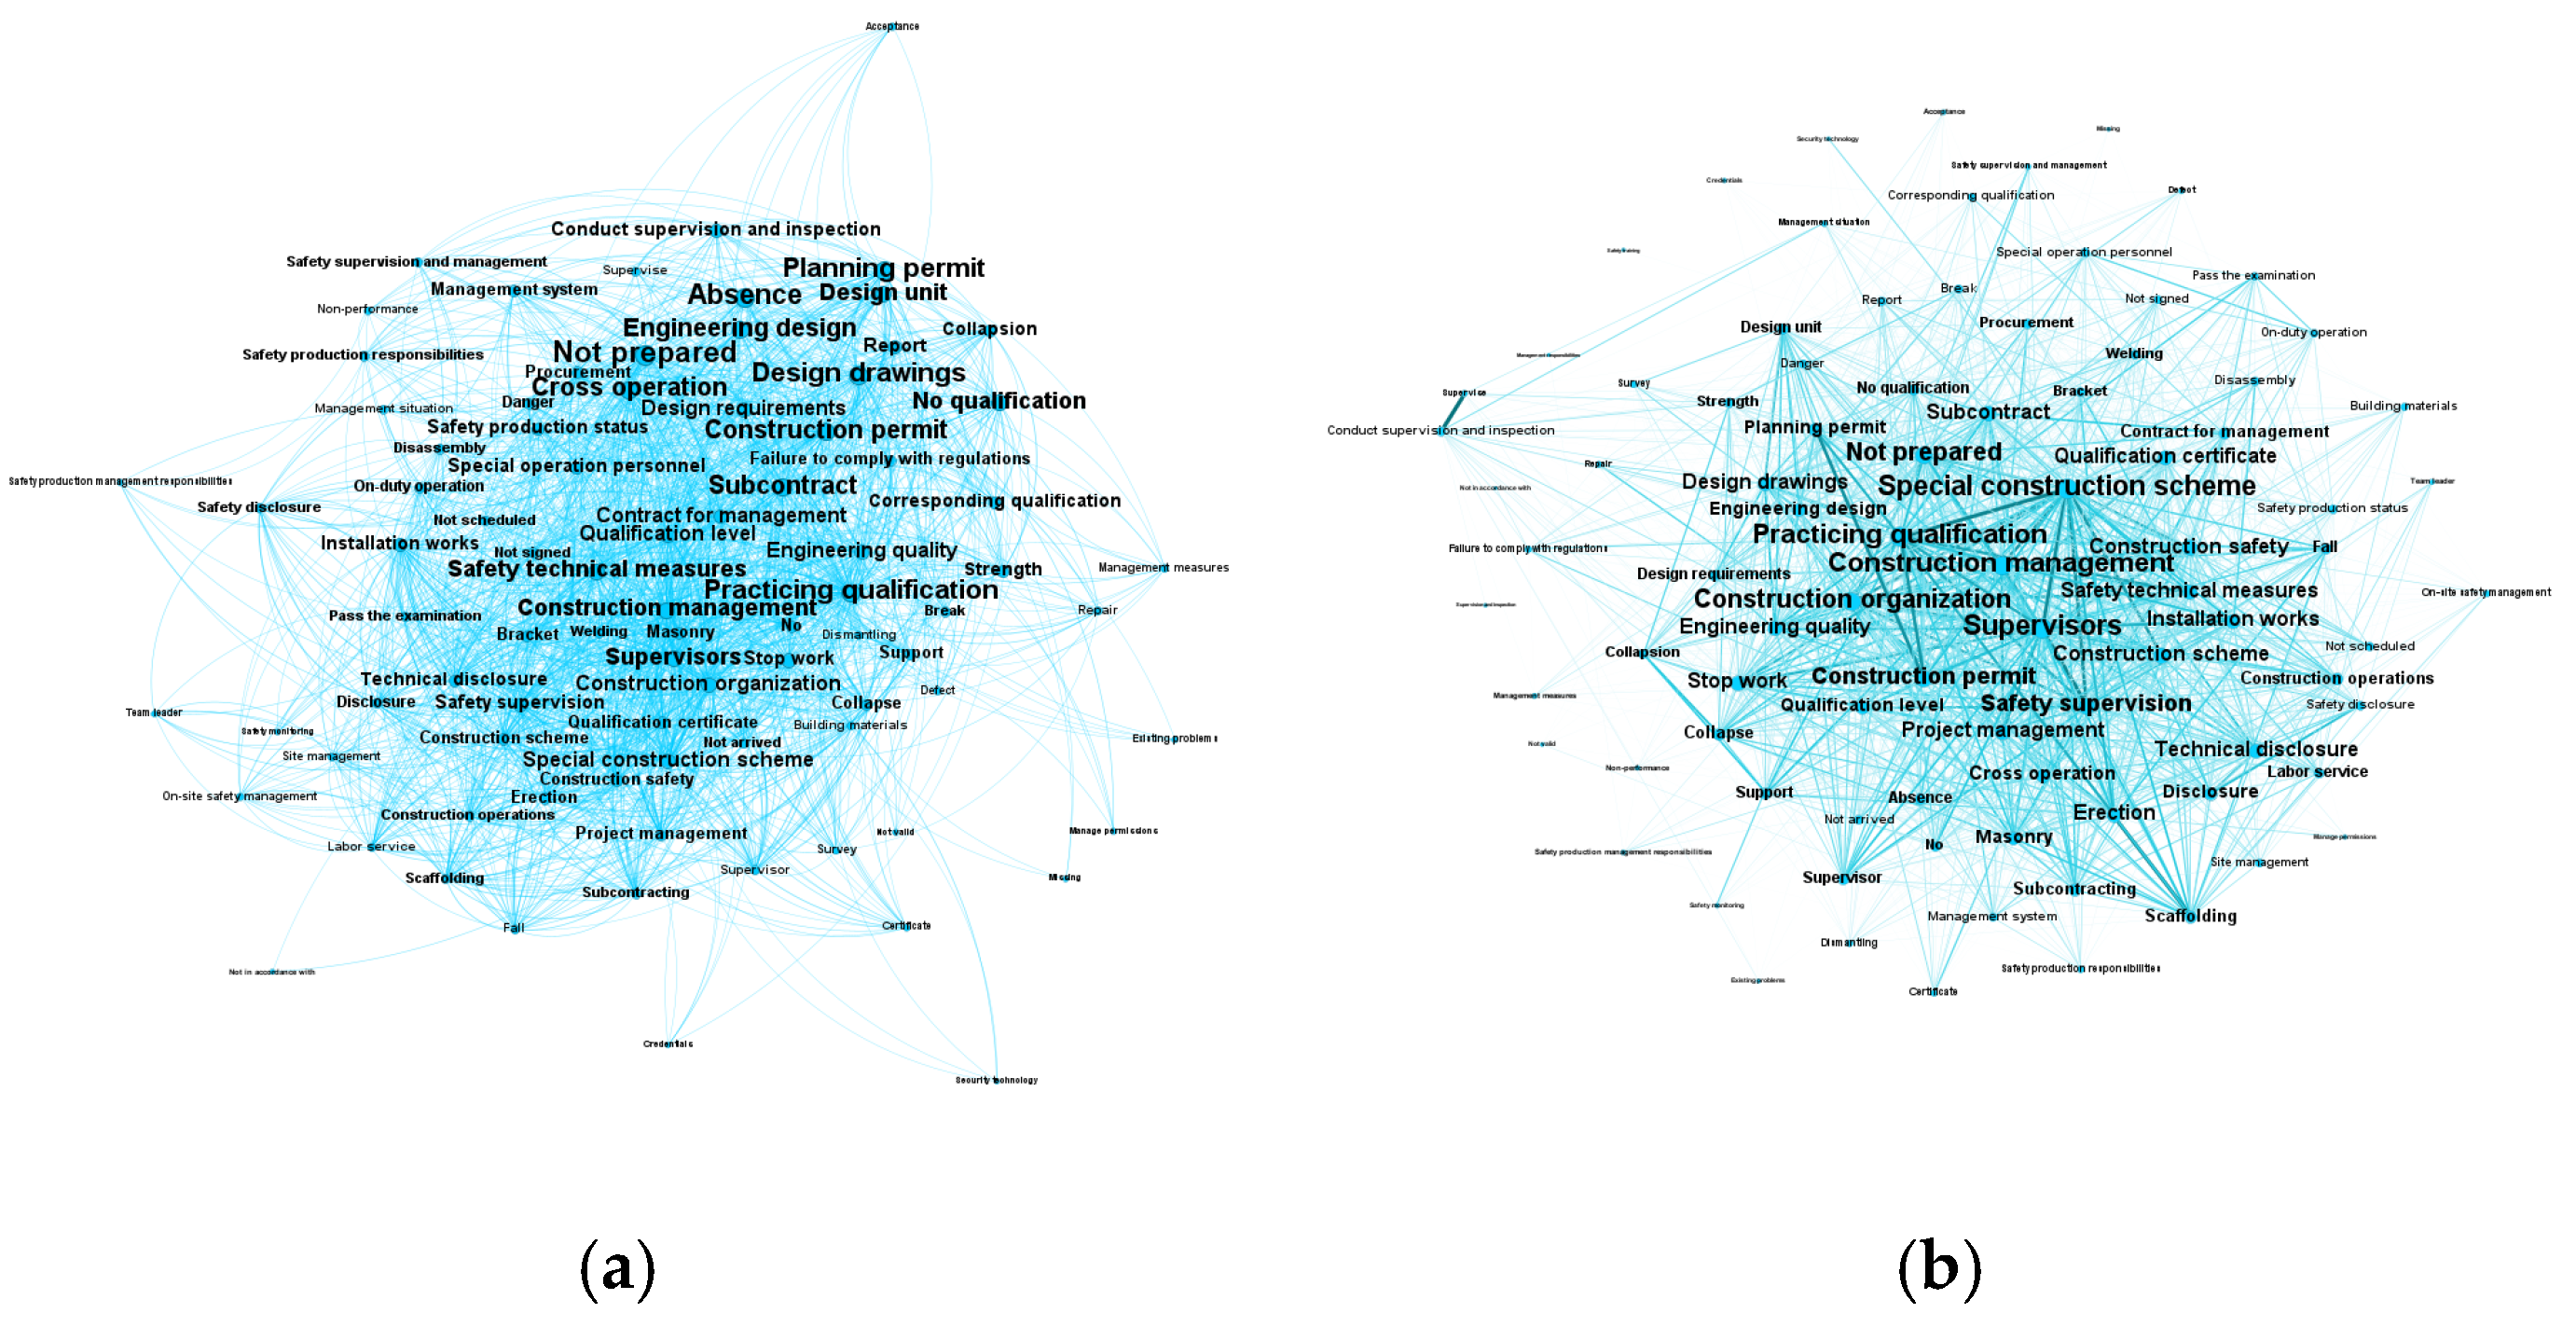
“Special construction scheme”, “Supervisors”, and “Practicing qualification” are the three management-related nodes with the highest weighted degree in Table 4. Combined with the network structure analysis in Figure 7, it is evident that the key nodes in Community 4 reveal typical characteristics of management factors in construction accidents. These core nodes occupy significantly high-weight positions in the network, indicating systemic weaknesses in the organizational management system regarding compliance review, technical support, and on-site supervision.
In the dimension of organizational qualification and licensing, the main manifestation is compliance failure and the weakening of the safety production responsibility chain. Nodes such as “Construction permit” and “Planning permit” indicate that accident projects commonly involve “Build without approval” violations. These projects start construction without legal administrative permission, thereby evading safety supervision and access review by administrative authorities. Nodes like “Practicing qualification” and “Qualification certificate” reveal that key safety management personnel lack the corresponding “Practicing qualification”, and special operation personnel work without certificates, leading to a lack of basic safety operation and risk identification capabilities. Nodes such as “Subcontract” and “Subcontracting” reflect that contracting units engage in illegal subcontracting and multi-level subcontracting, which severs the safety responsibility chain. General contractors fail to perform on-site management duties after non-compliantly transferring work to entities lacking safe production conditions.
Nodes including “Special construction scheme”, “Not prepared”, “Safety technical measures”, and “Design drawings” collectively reflect the failure of technical and scheme management. Construction units arbitrarily change designs, fail to build according to qualified drawings, or use unreviewed design drawings, directly leaving hidden dangers in the engineering structure. According to relevant regulations, dangerous parts of the project must have a special construction scheme prepared with matching safety technical measures. However, in practice, schemes for some projects remain unprepared or fail to pass the approval and demonstration process, resulting in a lack of technical guidance and disorderly conduct on-site.
The process control dimension mainly involves the absence of supervision and execution failure. Nodes like “Supervisors” and “Safety supervision” indicate that supervision units fail to perform their duties. They do not conduct continuous on-site supervision for dangerous operations or strictly follow up on identified hidden dangers with rectification orders, leading to a failure of on-site supervision. The “Technical disclosure” node reveals a break in information transmission; frontline workers cannot grasp key process and safety points due to a lack of effective disclosure, causing technical schemes to remain solely on paper without implementation. Furthermore, the “Stop work” node reflects that some construction units ignore orders to stop work for rectification and risk organizing construction before safety hazards are eliminated.
In summary, compliance failure and responsibility chain weakening in the qualification dimension, lack of technical support and disconnection between schemes and the site in the technical dimension, and supervision and execution failure in the process control dimension often act together in a coupled manner to cause construction safety accidents. This is particularly evident in high-risk stages such as “Scaffolding” erection and “Masonry”, as well as under complex “Cross operation” conditions, ultimately manifesting as casualties caused by structural collapse and falls.
- (5)
- Community 5 (Road Traffic): Physiological limits and insufficient vehicle technical compliance
Figure 8.
Visualization results of the causal network for Community 5 (Road Traffic): (a) Topological layout of the community within the global network; (b) Internal network structure of the community.
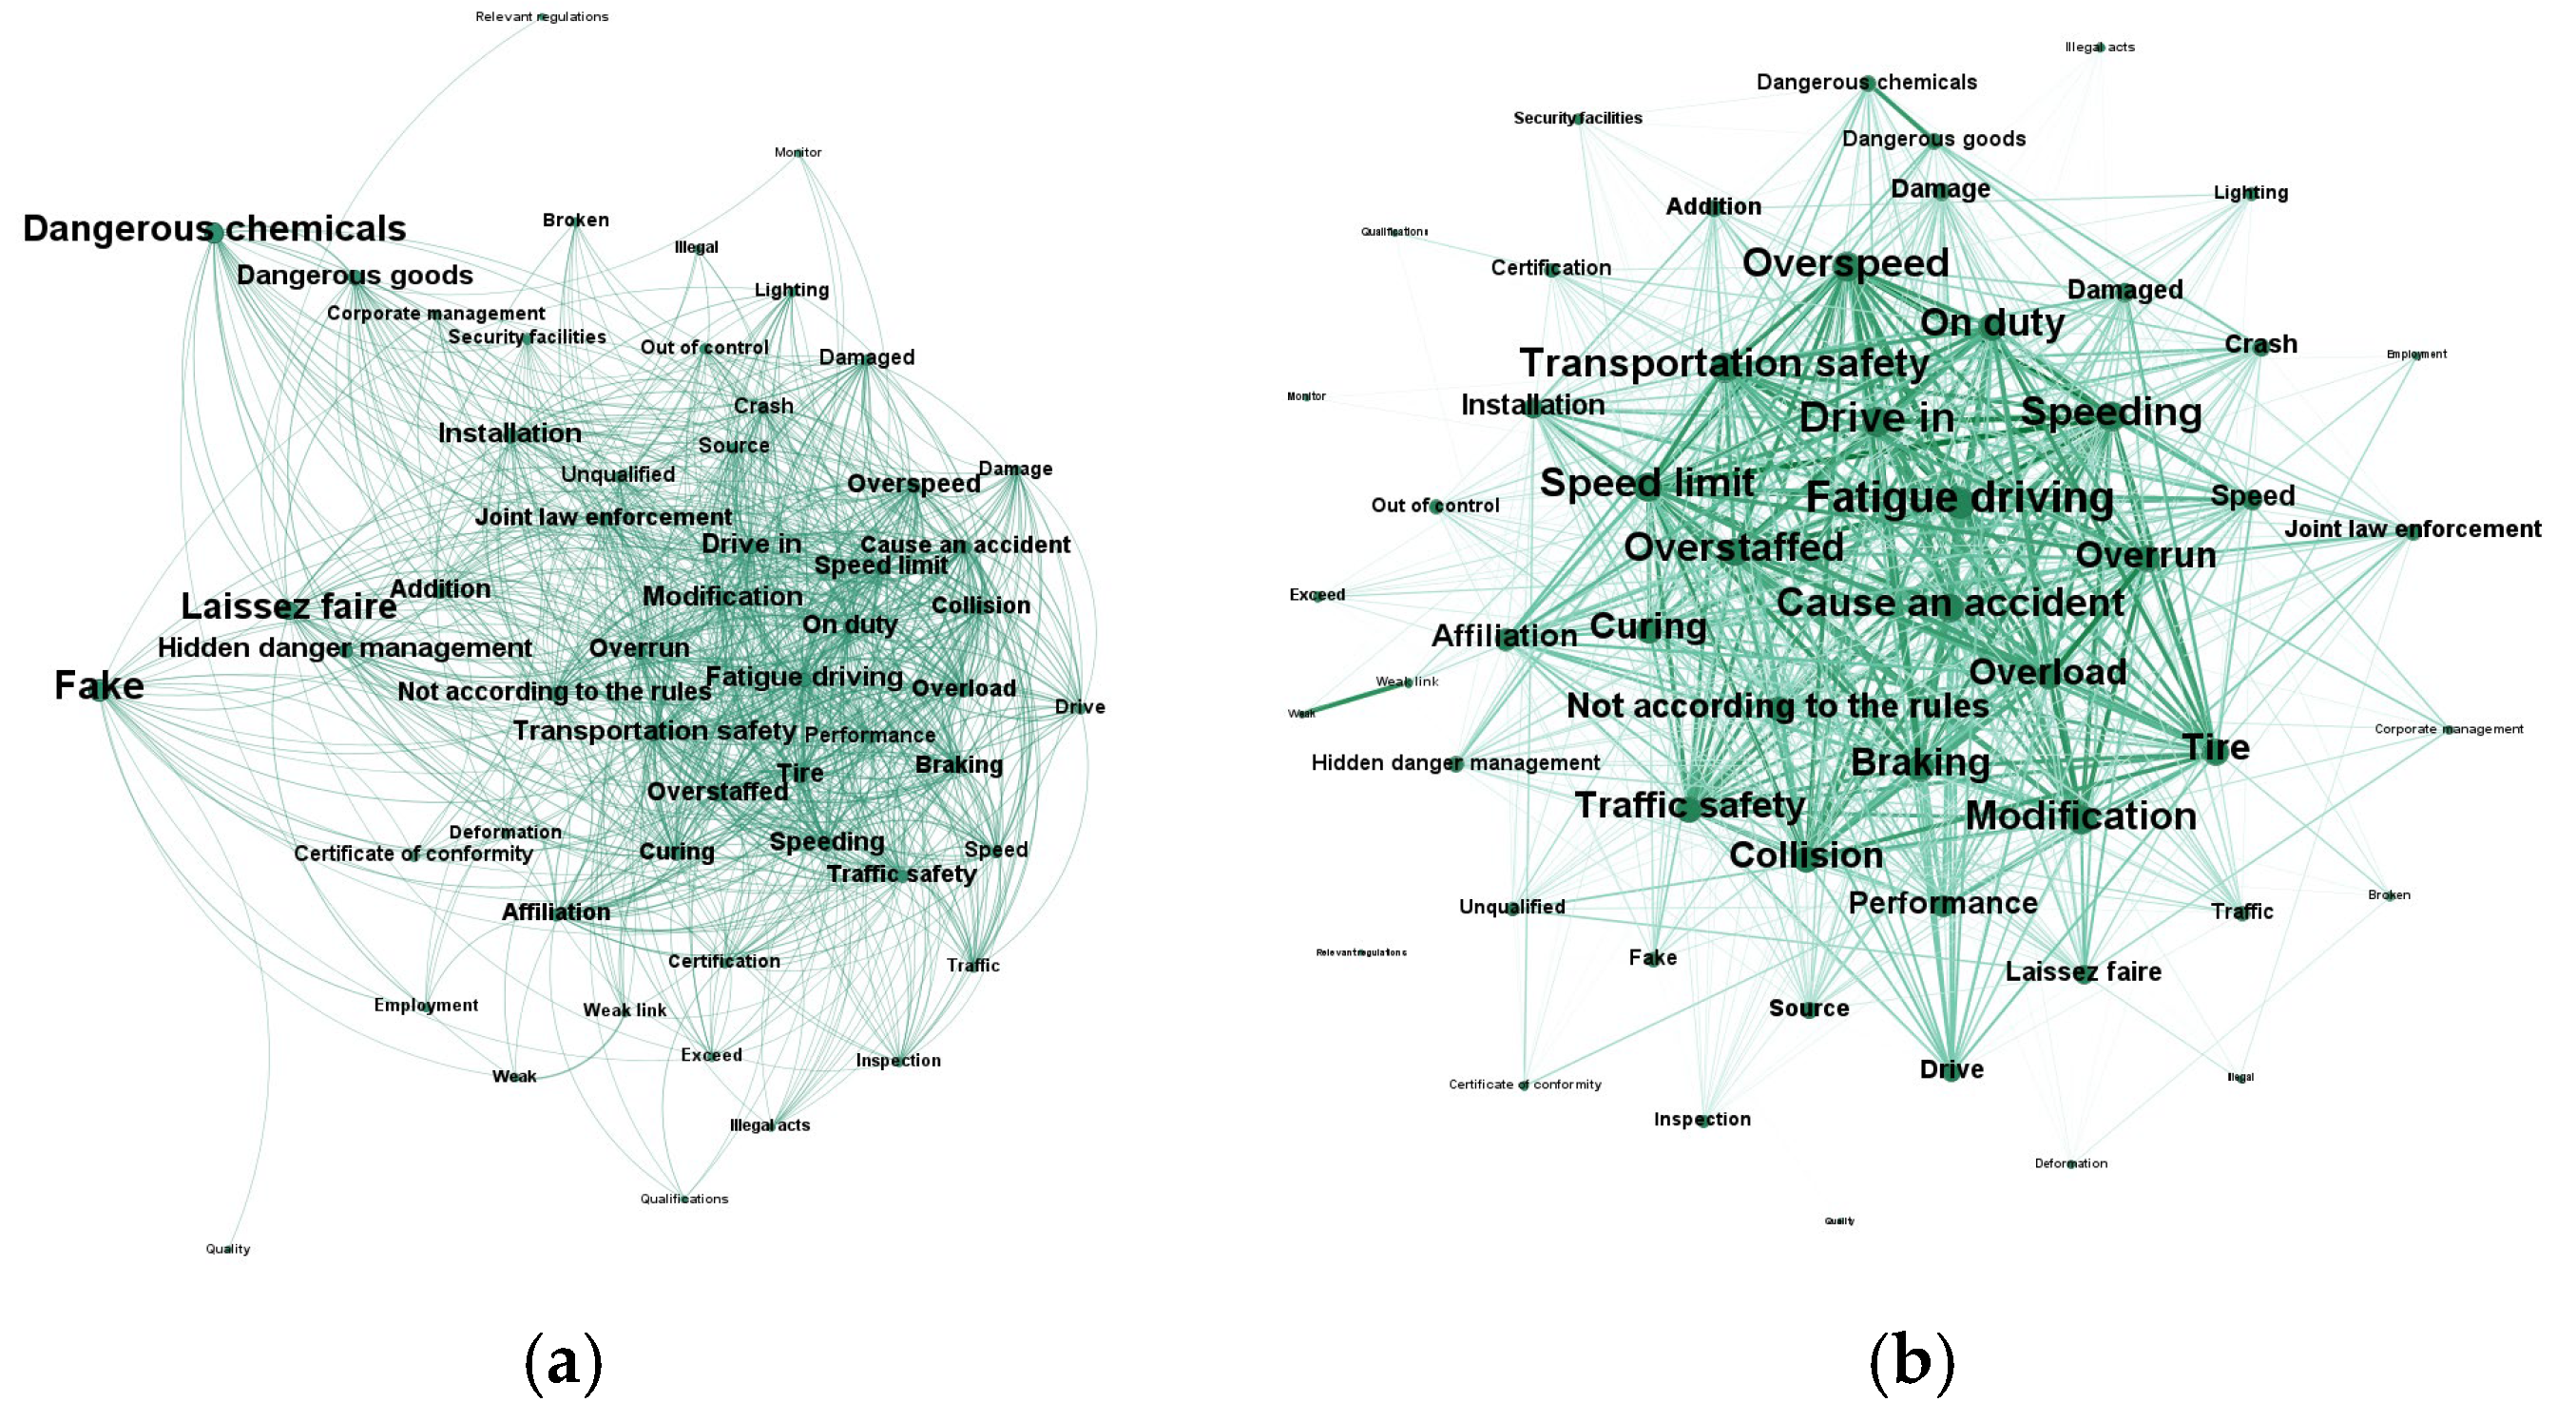
As illustrated in Figure 8, nodes such as “Fatigue driving”, “Overspeed”, “Overload”, and “Braking” are situated at the core of the network and exhibit the densest connections with other nodes. This suggests that the driver’s subjective errors and physiological limitations are key factors in the causation of road traffic accidents. This is primarily manifested as subjective, intentional violations by the driver, such as speeding, unauthorized overstaffing, overloads, and evasion of supervision through technological means (e.g., disabling GPS or blocking cameras). It also includes declines in physiological and psychological functions, commonly exemplified by the impairment of cognitive and reaction abilities due to fatigue driving. Furthermore, a lack of emergency operational skills, such as improper braking or veering into the opposite lane, often directly contributes to accident escalation.
In Figure 8b, the positioning of nodes such as “Modification,” “Installation,” “Tire,” “Curing,” and “Performance” in the transitional layer exposes a critical lack of intrinsic safety and technical compliance. Systems degrade over time due to poor maintenance, yet vehicles continue to operate with these defects. This is exacerbated by profit-motivated illegal modifications, which compromise stability and braking, making accidents far more likely under difficult driving conditions.
Figure 8a highlights a collapse in management responsibility through the aggregation of “Affiliation,” “Fake,” and “Laissez-faire.” The prevalence of the affiliation model means that management is often separated from actual vehicle usage, with companies acting as mere fee collectors rather than safety supervisors. The absence of a dynamic monitoring system leads enterprises to adopt a tacit or laissez-faire approach toward real-time violations such as overspeeding and fatigue driving. Simultaneously, failures in source management allow a large number of non-compliant vehicles and drivers to infiltrate the road transport industry. These failures primarily manifest as overloading at freight sources, security loopholes at passenger hubs, and the falsification of operational records.
Nodes like “On duty”, “Lighting”, and “Dangerous chemicals” further underscore gaps in environmental constraints and enforcement. Regarding road infrastructure, inadequate lighting conditions, delayed pavement curing, and absent protective facilities exacerbate environmental risks. In terms of supervision and law enforcement, the on-road law enforcement forces have insufficient coverage during key periods and on key sections. Moreover, the crackdown on high-risk areas such as hazardous material transportation and illegal operations has been insufficient, failing to create an effective deterrent effect, resulting in the normalization of illegal activities.
In summary, road traffic accidents result from the combined effects of unsafe human behaviors, unsafe vehicle conditions, hazardous road environments, systemic failures in organizational management, and inadequate external regulatory constraints.
It is also worth noting that while “Fake,” “Dangerous chemicals,” and “Laissez-faire” are located away from the core in Figure 8a, their large node size signals their importance. Rather than being unique to transport safety, these represent systemic risks with cross-scenario implications. The management failures denoted by “Fake” and “Laissez-faire” are pervasive across multiple high-risk industries, while “Dangerous chemicals” acts as a critical risk carrier, linking transport safety to broader chemical and fire-related hazards.
The five risk communities identified by the Louvain algorithm (Figure 3) align with the distribution of accident categories presented in Figure 2, indicating that the community partitioning effectively maps to the original accident classifications. Specifically, Community 1 corresponds to the “Poisoning & Asphyxiation” category; Community 5 reflects the “Traffic Accidents” found in the corpus; and Community 2 is consistent with the “Fire & Explosion” category. Community 4 effectively captures the latent causal factors contributing to “Collapse” and “Falling from Heights” accidents, while Community 3 aggregates complex risks associated with underground operations, typified by disaster patterns such as roof falls and water inrush.
3.2.3. Cross-Industry Comparison of Network Topology
Building upon the individual analyses of the five risk communities (Figure 4, Figure 5, Figure 6, Figure 7 and Figure 8), a comparison of their internal topologies provides further insight into mechanisms of accident causation specific to each industry. Although all five communities exhibit a tendency toward a core and periphery structure, they differ substantially in terms of central node attributes, dominant transmission pathways, and the respective contributions of the 4 M factors.
A prominent contrast can be observed between the construction and mining communities (Communities 4 and 3) and the road traffic community (Community 5). In Community 4, the nodes with the highest weighted degrees, such as “Supervisors,” “Special construction scheme,” and “Practicing qualification,” are concentrated primarily in the organizational and managerial dimensions. This indicates that the construction network is governed by a relatively long causal transmission chain in which risks originate from upstream failures in qualification control, permitting, subcontracting, technical planning, and on-site supervision, and are then transmitted downward to frontline operations.
Community 3 (Mining) presents a related but more complex topology. Unlike construction, its central structure is not solely dominated by management failures, but by the coupling of technical hazards and institutional distortion. On the one hand, nodes such as “Tunneling,” “Geology,” “Mine,” and “Blasting” reflect the persistent centrality of operational and geological risks. On the other hand, nodes such as “Safety evaluation,” “Fall behind,” “Falsification,” and “Underreport” indicate that these hazards are embedded in a broader structure of formalistic compliance and regulatory failure. Thus, the mining network also exhibits a relatively extended causal chain, but its defining characteristic is not merely organizational fragmentation; rather, it is the interaction between concealed hazard accumulation and the illusion of compliance.
By contrast, the topological structure of the road traffic network (Community 5) is distinctly different. Its core nodes, including “Fatigue driving,” “Overspeed,” and “Braking,” are concentrated around the interface between humans and machines, indicating that unsafe driving behavior and immediate vehicle control failure occupy the topological center. Compared with the longer causal pathways observed in construction and mining, the road traffic network displays a shorter and more tightly coupled structure, in which accidents are more directly triggered by the breakdown of human physiological limits, unsafe operational decisions, and vehicle technical noncompliance. Management-related factors, such as “Affiliation” and “Laissez-faire,” remain important, but they function more as systemic amplifiers and background drivers than as the most immediate structural center of accident causation.
A further comparison between Confined Space (Community 1) and Fire Safety (Community 2) reveals different modes of environmental dependence. Community 1 is characterized by a coupling topology between humans and the environment, in which behavioral violations, such as inadequate ventilation or the absence of protective equipment, interact directly with the fatal properties of the confined micro environment, particularly toxic and harmful gases. In this structure, environmental abnormality and human misconduct are tightly intertwined, jointly driving the accident process. Community 2, by contrast, exhibits a failure topology spanning design, protection, and emergency response. Its dominant nodes, such as “Fire protection design” and “Fire control acceptance,” indicate that the underlying risk is embedded upstream in the engineering and acceptance stages. The progression from latent design defects to accident consequences is then mediated by the failure of downstream control and mitigation nodes, including “Firefighting facilities,” “Deactivate,” and “Escape.” Therefore, compared with Community 1, Community 2 relies more heavily on structural deficiencies in intrinsic safety and on the collapse of subsequent emergency barriers.
3.3. Core Risk Structure and Systemic Causation
As shown in Figure 9, despite these cross-industry differences in local topological structures, the five communities remain connected by a set of shared systemic risk factors. The -core analysis indicates that the maximum -core subgraph ( = 57) contains 190 nodes, accounting for approximately 40% of all nodes in the network. This subgraph represents the set of causal factors with the highest degree of interdependence and the most profound influence within the system. The complete list of the 190 core nodes, along with an interactive visualization of this subgraph, is provided in the Supplementary Materials.
Figure 9.
Maximum -core ( = 57) subgraph. Different node colors represent the distinct communities.
As illustrated in Figure 9, the maximum -core subgraph aggregates key nodes with high connectivity from different communities, primarily including “Fire protection design”, “Fire control acceptance”, “Fall behind”, “Build without approval”, “Work negligence”, “Major hazard installations”, “Fake”, and “Risk assessment”. These nodes represent systemic management and compliance defects. They radiate outward through complex connections, ultimately linking to specific accident scenario nodes located at the periphery of the subgraph, such as “Fire” and “Mine”. This core-periphery topological characteristic is broadly consistent with the findings of Jing et al. [17] regarding the coal mine accident risk network. That is, the network presents a significant core-periphery structure, where the core region is composed of high-frequency and closely related management risk factors.
Analyzed through the lens of Reason’s Swiss Cheese Model, these high-frequency accident causes situated at the center of the network topology are not active failures at the frontline operational level, but rather latent conditions deep within the system [44]. Resembling inherent holes in the Swiss Cheese Model, these latent conditions persist within the organizational management structure for extended periods, exemplified by inherent defects in fire protection design or procedural violations such as unauthorized construction. While often imperceptible in non-accident states, they serve as the root causes that lead to the gradual failure of the system’s defense mechanisms and ultimately trigger accidents.
The core-periphery connection pattern clearly presented in Figure 9 further empirically validates the hierarchical causation logic proposed by the Human Factors Analysis and Classification System (HFACS) [45]. Nodes located in the -core central region, such as “Fire control acceptance”, “Build without approval”, “Fake”, and “Fall behind”, correspond to organizational influences and unsafe supervision at the top layer of the HFACS framework, constituting the originating causes of the accident evolution process. These management failures in the core layer radiate outward through complex network edges, leading to issues such as weak engineering technical support and loss of control over the working environment (e.g., unclear technical disclosure, lack of protective facilities). Such issues constitute preconditions for unsafe acts within the HFACS framework. Qiu et al. [46] conducted a path analysis of the coal mine accident causation network and highlighted that the regulatory link holds the greatest influence in the causal hierarchy. They also noted that an imperfect regulatory system and unfulfilled responsibilities often serve as the deep-rooted causes of accidents.
Deficiencies at the organizational and environmental levels accumulate layer upon layer and persistently, eventually inducing unsafe acts by frontline operators. When these acts penetrate the system’s defense barriers, they result in accident consequences in specific scenarios such as “Fire”, “Mine”, and “Collapse” at the periphery of the network.
3.4. Closed-Loop Mechanism for Sustainable Safety
Beyond static analysis, the BERTopic-LLM-SNA framework functions as a closed-loop mechanism to support sustainable safety management. It advances safety sustainability through three key dimensions, which are discussed below.
3.4.1. Dynamic Perception
The integrated framework accommodates the continuous growth of accident investigation reports. By identifying representative passages to replace full-text input, the framework mitigates the computational costs associated with LLM inference. This enables the deep mining of massive, unstructured reports. Regulatory authorities can utilize this framework to establish a routine safety intelligence monitoring system. By continuously inputting investigation reports from new accidents, the system dynamically updates the semantic network of causal factors. This process focuses on weight changes among nodes within risk communities, and timely identifies emerging risk factors like new hazards brought about by the introduction of new processes. Consequently, this supports a transition from purely post-event rectification toward continuous and preventative risk monitoring.
3.4.2. Targeted Intervention
The five risk communities identified by the Louvain algorithm correspond closely to the descriptive statistics of the accident investigation reports in the corpus. This alignment highlights distinct accident evolution mechanisms across various scenarios. In confined space incidents, prevention must focus on the coupling of physical environmental factors, such as high concentrations of toxic and hazardous gases, with personnel violations like the failure to wear personal protective equipment. For fire safety, it is essential to control sources of intrinsic safety, such as fire protection design and fire control acceptance, while addressing specific hazards like the non-compliant use of color steel plates. In the construction and mining industries, regulatory efforts should prioritize eliminating illegal practices like unauthorized construction, unlicensed operations, and falsification. Furthermore, it is necessary to restore the broken chain of safety responsibilities that was disrupted due to illegal subcontracting and subcontracting.
3.4.3. K-Core-Based Systemic Governance
The -core analysis reveals the deep-seated core drivers within the accident causation system. The core nodes aggregated within the maximum -core subgraph ( = 57) point to institutional defects and organizational failures. Therefore, it is necessary to strengthen top-level institutional design and source control of compliance. This involves promoting a transition in safety management toward preventative institutional design to eliminate procedural violations and inherent defects. By establishing a lifecycle traceability system for safety assessment, authorities can combat falsification during the evaluation process. This helps reverse the lack of intrinsic safety often concealed by a facade of compliance.
Simultaneously, common driver nodes with cross-scenario impact, such as nodes “Major hazard installations” and “Trial production”, should be prioritized for regulation to prevent local risks from evolving into systemic crises. Ultimately, through the systematic governance of these core causes, the systemic vulnerabilities in organizational defense mechanisms can be continuously repaired. This comprehensively enhances the resilience and recoverability of the socio-economic system against complex coupled risks, preventing major accidents at their root.
3.5. Methodological Comparison and Limitations
A common paradigm in accident text mining is extracting causal factors and then classifying them in order to identify systemic relationships or hierarchical structures. Although the proposed BERTopic-LLM-SNA framework shows potential for identifying systemic risks, comparison with existing approaches remains necessary to clarify its potential contributions as well as its methodological boundaries.
Traditional Latent Dirichlet Allocation (LDA) models generally extract a relatively limited number of topics (typically 10 to 20) and require the topic count to be specified in advance [7,8,47]. In contrast, BERTopic models capture topics at a finer granularity, thereby supporting more fine-grained analysis of accident investigation reports. In our study, the baseline BERTopic model initially uncovered 474 latent topics. Furthermore, our optimized model achieved a high clustering quality with a of 0.46, outperforming the of 0.384 reported by Andrade and Walsh [12] in their analysis of unstructured incident reports. Additionally, Kamil et al. [23] utilized Named Entity Recognition (NER) techniques to extract drivers of critical safety.
However, techniques such as LDA, BERTopic, and NER primarily focus on the extraction of causal factors. Establishing hierarchical relationships among these factors is crucial for understanding accident propagation mechanisms. For example, Wang et al. [8] introduced the 24 Model and relied on manual mapping to hierarchically classify LDA-derived topics. Kamil et al. [23] incorporated Interpretive Structural Modelling (ISM) to hierarchically structure the identified critical safety drivers. Andrade and Walsh [12] manually synthesized 19 hazard categories from 60 valid topics (based on 127 raw BERTopic outputs). Building upon the raw topics generated by BERTopic, the present study introduces the 4 M theory and leverages the reasoning capabilities of an LLM to filter and classify topics. Subsequently, semantic associations among causal factors are established and analyzed using PPMI and SNA. This framework helps reduce manual coding efforts while maintaining relatively good classification performance. Regarding specific LLM applications, Taubert et al. [30] fed full unstructured text data, such as report documents and internal communications, into an LLM, successfully extracting structured risk intelligence using few-shot and CoT prompting engineering. Distinct from full-text input, the present study provides the LLM with context based on representative documents generated by BERTopic. This design reduces token consumption and LLM processing time.
Despite these methodological advancements, certain limitations associated with LLM applications should be acknowledged. The current framework achieved an F1-Score of 95.36% in binary causal topic classification and 69.61% in the keyword screening task. While these metrics indicate relatively good performance, they also suggest remaining error and room for improvement. Furthermore, to ensure result stability, a temperature setting of 0.1 and a mandatory JSON output format were applied when utilizing the LLM for 4 M category screening and causal keyword extraction. This highly deterministic configuration forces the model to output a definitive classification label even when processing ambiguous accident narratives. As pointed out by Kumar et al. [13], most LLMs currently used for accident text classification share this limitation; blindly trusting such models lacking uncertainty-aware mechanisms poses potential risks in safety-critical industrial domains.
4. Conclusions
This study developed a BERTopic-LLM-SNA hybrid framework to mine 745 accident investigation reports, yielding three primary conclusions:
- The framework demonstrates how topic modeling and LLMs can be efficiently integrated to extract causal safety intelligence from large-scale unstructured reports. By performing LLM-driven semantic reasoning exclusively on representative paragraphs rather than full texts, the original input volume was reduced by approximately 96%. This high-fidelity extraction provides a viable pathway for regulatory authorities and enterprises to establish reproducible, low-computational-cost risk monitoring systems.
- This study identified five risk communities across high-risk scenarios, each showing a different accident causation structure within a shared core–periphery pattern. The construction and mining communities are characterized by relatively extended causal chains associated with fragmented organizational management; the road traffic community is marked by tightly coupled human–machine interactions; the confined space community is primarily driven by human–environment interactions; and the fire safety community is largely linked to deficiencies in upstream design. The -core analysis further points to organizational management and compliance defects as the central risk nodes, reflecting the dominance of latent systemic risk structures in the accident causation system.
- 3.
- Based on the research findings, we proposed a closed-loop mechanism for sustainable safety management. By integrating routine intelligence monitoring, differentiated scenario governance, top-level institutional optimization, and whole-process compliance traceability, this mechanism can support earlier identification of recurrent hazards and offer a basis for the further development of more proactive safety tools.
This research offers a rigorous and scientific foundation for policymakers and corporate managers to detect inherent risks, enhance preventive governance, and foster sustainable safety management. More broadly, its application can support the construction of resilient and sustainable industrial infrastructure while promoting safe, secure, and healthy working environments for all workers, thereby contributing to the long-term realization of safe and sustainable development.
However, the present study remains largely dependent on static historical accident texts, and thus cannot fully reflect the dynamic processes through which industrial risks evolve over time and across space. Future research should extend this framework by developing dynamic risk evolution models based on continuous spatiotemporal data to capture the temporal variation and spatial diffusion of risk networks in a more systematic manner. Accident investigation reports are not limited to textual descriptions, but also include valuable multimodal information such as on-site damage photographs, equipment failure schematics, and statistical charts. The incorporation of these heterogeneous data sources would substantially enrich the contextual information available for risk extraction. By further integrating multimodal analysis with machine learning techniques and large language models, future studies could achieve more robust risk perception, cross-modal knowledge fusion, and intelligent inference. This would substantially enhance the framework’s generalizability, interpretability, and practical applicability in complex industrial scenarios.
Supplementary Materials
The following supporting information can be downloaded at: https://www.mdpi.com/article/10.3390/su18083787/s1. To facilitate an in-depth exploration of the complex accident causation network, interactive visualization tools for the semantic networks have been developed and provided as Supplementary Materials. Readers can dynamically explore the global network topology, search for specific risk nodes, and filter causal factors by risk communities through the provided HTML files. The Supplementary Materials include: (1) Interactive Global Accident Causation Network; (2) Interactive Maximum K-Core Subgraph; and (3) Supplementary Data 1, an Excel file containing the complete and specific list of all nodes constituting the maximum -core ( = 57). The interactive HTML files can be accessed and run locally in any standard web browser.
Author Contributions
Conceptualization, L.W. and R.H.; methodology, L.W. and R.H.; formal analysis, L.W. and Y.C.; data curation, J.Z. and H.G.; writing—original draft preparation, L.W.; writing—review and editing, Y.C. and Y.Y.; visualization, L.W. and Y.Y.; project administration, R.H.; funding acquisition, J.Z. and R.H. All authors have read and agreed to the published version of the manuscript.
Funding
This research was funded by the Department of Information Technology Development, Ministry of Industry and Information Technology, PRC (Grant No. ZTZB-23-990-021), and the Key Research and Development Program of Ningxia Hui Autonomous Region (Grant No. 2022BEE02001).
Institutional Review Board Statement
Not applicable.
Informed Consent Statement
Not applicable.
Data Availability Statement
The raw accident investigation reports supporting the conclusions of this article are publicly available from the official websites of the respective Chinese government emergency management departments. The processed dataset generated during the current study is available from the corresponding author upon reasonable request.
Conflicts of Interest
Author Jing Zhan was employed by the company Hunan Zhantong Technology Group Co., Ltd. The remaining authors declare that the research was conducted in the absence of any commercial or financial relationships that could be construed as a potential conflict of interest.
Appendix A
System Prompt
You are an expert in Safety Science, Safety Engineering, and accident analysis. Your task is to classify BERTopic-generated topics derived from accident investigation reports in a precise and professional manner. Please follow the 4M framework strictly and assign each topic to one or more of the following categories: Man, Machine, Medium, Management, or None.
- (1)
- Classification definitions
Man: This category includes unsafe human behaviors such as operational errors, violations, insufficient skills, lack of training, risk-taking behaviors, and fatigue-related actions. Do not assign this category when the text only refers to personnel identity or job position without describing unsafe behavior.
Machine: This category includes equipment defects, mechanical failures, missing safety devices, design flaws, and inadequate maintenance. Do not assign this category when the text merely mentions equipment names without indicating a defect or failure.
Medium: This category includes hazardous environmental conditions such as severe weather, inadequate lighting, poor ventilation, unsafe site conditions, or natural hazards. Do not assign this category when the text contains only neutral environmental descriptions without clear hazard implications.
Management: This category includes management-related deficiencies such as missing procedures, insufficient supervision, inadequate training arrangements, poor emergency preparedness, and unclear responsibilities. Do not assign this category when the text only describes routine management arrangements without indicating a management defect.
None: This category applies to background information, statistical descriptions, legal or regulatory text, and general workflow content that has no direct causal relevance to accident causation. “None” must appear alone and cannot be combined with any other category.
- (2)
- Decision principles
Classification must be based on specific behaviors, defects, failures, or unsafe states, rather than on simple noun mentions.
Pay particular attention to causal indicators such as deficiency, error, failure, absence, omission, insufficiency, or violation.
Distinguish carefully between “human involvement” and “human error.”
Output requirement
Return the result strictly in JSON format: {“classification”: “category1, category2”} or {“classification”: “None”}
User Prompt
Please determine the appropriate 4M category or categories for the following topic based on the information provided below.
Topic name: [TOPIC_NAME]
Topic keywords: [TOPIC_KEYWORDS]
Representative documents: [REPRESENTATIVE_DOCUMENTS]
Please return your classification.
Appendix B
System Prompt
You are an expert in Safety Science and accident causation analysis. Your task is to screen BERTopic-generated topic keywords and retain only those terms that are directly relevant to accident causation.
- (1)
- Screening principles
- ➀
- General exclusion rulesSelect keywords only from the provided keyword list. Do not add, infer, paraphrase, or generate any new terms.Retain terms that explicitly reflect accident causes, hazard mechanisms, or latent deficiencies.Remove terms that are overly general, descriptive, procedural, or unrelated to causal mechanisms.Remove irrelevant technical expressions, industry-generic terms, and common nouns with no clear causal implication.
- ➁
- Examples of causally relevant terms
Human factors: operational error, violation, lack of training, incorrect command, fatigue
Machine factors: equipment aging, safety device failure, design defect
Environmental factors: severe weather, poor ventilation, inadequate lighting
Management factors: missing procedures, inadequate safety training, insufficient supervision
- (2)
- Few-shot examples
The following manually verified examples are provided as in-context demonstrations:
[INSERT FEW-SHOT EXAMPLES]
- (3)
- Additional exclusion rules
Remove technical terms without direct causal implication, such as construction plan, process flow, or equipment model.
Remove terms related to accountability or post-accident handling, such as administrative penalty, disciplinary action, or related expressions.
Output requirement
Return the result strictly in JSON format: {“filtered_keywords”: [“keyword1”, “keyword2”, …]}
If no keyword is causally relevant, return: {“filtered_keywords”: []}
Do not provide any explanation or additional text.
User Prompt Template
Please screen the causally relevant keywords from the following topic information.
4M classification: [4M_CLASSIFICATION]
Topic keywords: [TOPIC_KEYWORDS]
Representative documents: [REPRESENTATIVE_DOCUMENTS]
Please return only the filtered keywords that are directly relevant to accident causation.
Appendix C
Table A1.
List of accident investigation reports in Table 1.
References
- Ministry of Emergency Management of the People’s Republic of China Quarterly Regular Press Conference. Available online: https://www.mem.gov.cn/xw/xwfbh/2026n1y15xwfbh/ (accessed on 5 February 2026).
- United Nations Department of Economic and Social Affairs Goal 8: Promote Sustained, Inclusive and Sustainable Economic Growth, Full and Productive Employment and Decent Work for All. Available online: https://sdgs.un.org/goals/goal8 (accessed on 5 February 2026).
- United Nations Department of Economic and Social Affairs Goal 9: Build Resilient Infrastructure, Promote Inclusive and Sustainable Industrialization and Foster Innovation. Available online: https://sdgs.un.org/goals/goal9 (accessed on 5 February 2026).
- Drupsteen, L.; Guldenmund, F.W. What Is Learning? A Review of the Safety Literature to Define Learning from Incidents, Accidents and Disasters. J. Contingencies Crisis Manag. 2014, 22, 81–96. [Google Scholar] [CrossRef] [Scilit]
- Wang, C.; Lu, B.; Shi, R. Analysis of the Causes and Configuration Paths of Explosion Accidents in Chemical Companies Based on the REASON Model. Sustainability 2024, 16, 9845. [Google Scholar] [CrossRef] [Scilit]
- Wu, X.; Sun, P. Dynamic Analysis and Temporal Governance of Safety Risks: Evidence from Underground Construction Accident Reports. Sustainability 2024, 16, 8531. [Google Scholar] [CrossRef] [Scilit]
- Hu, J.; Huang, R.; Xu, F. Data Mining in Coal-Mine Gas Explosion Accidents Based on Evidence-Based Safety: A Case Study in China. Sustainability 2022, 14, 16346. [Google Scholar] [CrossRef] [Scilit]
- Wang, B.; Wang, Y.; Gong, Y.; Shi, Z. Text Mining and Association Rules-Based Analysis of 245 Cement Production Accidents in a Cement Manufacturing Plant. Int. J. Occup. Saf. Ergon. 2025, 31, 1201–1215. [Google Scholar] [CrossRef] [Scilit]
- Wang, F.; Gu, W.; Bai, Y.; Bian, J. A Method for Assisting the Accident Consequence Prediction and Cause Investigation in Petrochemical Industries Based on Natural Language Processing Technology. J. Loss Prev. Process Ind. 2023, 83, 105028. [Google Scholar] [CrossRef] [Scilit]
- Zhang, Y.; Wang, W.; Mi, L.; Sun, G.; Qiao, L.; Tao, M.; Wang, L. Uncovering the Organizational Vulnerability toward Construction Project Accidents: BERTopic-Based Text Mining Analysis. J. Constr. Eng. Manag. 2025, 151, 04025179. [Google Scholar] [CrossRef] [Scilit]
- Nanyonga, A.; Joiner, K.; Turhan, U.; Wild, G. Semantic Topic Modeling of Aviation Safety Reports: A Comparative Analysis Using BERTopic and PLSA. Aerospace 2025, 12, 551. [Google Scholar] [CrossRef] [Scilit]
- Andrade, S.R.; Walsh, H.S. Machine Learning Framework for Hazard Extraction and Analysis of Trends (HEAT) in Wildfire Response. Saf. Sci. 2023, 167, 106252. [Google Scholar] [CrossRef] [Scilit]
- Kumar, A.; Senapati, A.; Upadhyay, R.; Chatterjee, S.; Bhattacherjee, A.; Samanta, B. An Uncertainty-Aware Decision Support System: Integrating Text Narratives and Conformal Prediction for Trustworthy Accident Code Classification. Process Saf. Environ. Prot. 2025, 204, 108134. [Google Scholar] [CrossRef] [Scilit]
- Leveson, N. A New Accident Model for Engineering Safer Systems. Saf. Sci. 2004, 42, 237–270. [Google Scholar] [CrossRef] [Scilit]
- Besklubova, S.; Li, Y.; Raza, M.H.; Zhong, R.Y. Natural Language Processing and Social Network Analysis Based Framework for Falling Accidents at Construction Sites. Digit. Eng. 2026, 8, 100081. [Google Scholar] [CrossRef] [Scilit]
- Eteifa, S.O.; El-adaway, I.H. Using Social Network Analysis to Model the Interaction between Root Causes of Fatalities in the Construction Industry. J. Manag. Eng. 2018, 34, 04017045. [Google Scholar] [CrossRef] [Scilit]
- Jing, G.; Qin, H.; Jiang, F.; Qin, D.; Zhang, X. Identification of Risk Factors for Coal Mine Accidents Based on Text Mining and Social Network Analysis. Int. J. Occup. Saf. Ergon. 2025, 1–13. [Google Scholar] [CrossRef] [Scilit]
- Wang, Z.; Wang, Y.; Shi, Z.; Zhang, H.; Liu, X. Application of Text Mining and Causal Analysis for Risk Identification in Air Traffic Control Safety Operations. Sci. Rep. 2025, 15, 41294. [Google Scholar] [CrossRef] [Scilit]
- Pan, H.; Huang, H.; Luo, Z.; Wu, C.; Yang, S. Research on Safety Risk Factors of Metro Shield Tunnel Construction in China Based on Social Network Analysis. Eng. Constr. Archit. Manag. 2025, 32, 8114–8144. [Google Scholar] [CrossRef] [Scilit]
- Yang, L.; Liu, J.; Liu, Z.; Zhou, Q.; Liu, Y.; Wang, Y.; Wu, W. From Text to Network: A Framework for Identifying Causal Factors and Risk Propagation Paths in Maritime Accidents. Reliab. Eng. Syst. Saf. 2026, 271, 112282. [Google Scholar] [CrossRef] [Scilit]
- Liu, S.; Shen, J.; Zhang, J. An Integrated Model Combining BERT and Tree-Augmented Naive Bayes for Analyzing Risk Factors of Construction Accident. Kybernetes 2024, 54, 5651–5675. [Google Scholar] [CrossRef] [Scilit]
- Liu, W.; Kang, X.; Ye, Q.; Xie, J. Unraveling Hierarchical Penetration Mechanisms and Coupling Relationships of Safety Risks in Major Transportation Infrastructure Construction Using Text Mining and Complex Networks. Sci. Rep. 2026, 16, 7313. [Google Scholar] [CrossRef] [Scilit]
- Kamil, M.Z.; Khan, F.; Amyotte, P. A Systematic Approach for Identifying Drivers of Critical Safety and Establishing Their Hierarchy. Can. J. Chem. Eng. 2025, 103, 4628–4646. [Google Scholar] [CrossRef] [Scilit]
- Wei, M.; Cui, Y.; Liu, J. Unveiling the Influencing Factors of Maritime Accidents through Data-Driven Approaches: Leveraging Large Language Model Tools. Saf. Sci. 2026, 197, 107116. [Google Scholar] [CrossRef] [Scilit]
- Du, G.; Chen, A. Coal Mine Accident Risk Analysis with Large Language Models and Bayesian Networks. Sustainability 2025, 17, 1896. [Google Scholar] [CrossRef] [Scilit]
- Ding, X.; Hu, Y.; Jin, J. Risk Source Identification and Prevention for Metro Driven by Large Language Models: A New Approach to Enhancing System Reliability and Safety. Reliab. Eng. Syst. Saf. 2026, 268, 111971. [Google Scholar] [CrossRef] [Scilit]
- Huang, Y.; Yan, R.; Zhang, Z. Automated Knowledge Extraction from Marine Accident Reports Using Large Language Models: Graph Construction and Evaluation. Ocean Coast. Manag. 2026, 272, 108015. [Google Scholar] [CrossRef] [Scilit]
- Abellanosa, A.D.; Pereira, E.; Lefsrud, L.; Mohamed, Y. Integrating Knowledge Management and Large Language Models to Advance Construction Job Hazard Analysis: A Systematic Review and Conceptual Framework. J. Saf. Sustain. 2025, 2, 156–170. [Google Scholar] [CrossRef] [Scilit]
- Liu, Q.; Li, F.; Ng, K.K.H.; Han, J.; Feng, S. Accident Investigation via LLMs Reasoning: HFACS-Guided Chain-of-Thoughts Enhance General Aviation Safety. Expert Syst. Appl. 2025, 269, 126422. [Google Scholar] [CrossRef] [Scilit]
- Taubert, E.; Vairo, T.; Reverberi, A.; Pettinato, M.; Fabiano, B. Ai Application in Risk Assessment and Resilience Management of Seveso Plants and Logistics within Industrial Port Environment. Chem. Eng. Trans. 2025, 119, 493–498. [Google Scholar] [CrossRef]
- Sogou Pinyin Method Sogou Cell Thesaurus. Available online: https://pinyin.sogou.com/dict/ (accessed on 5 February 2026).
- Han, S.; Zhang, Y.; Ma, Y.; Tu, C.; Guo, Z.; Liu, Z.; Sun, M. THUOCL: Tsinghua Open Chinese Lexicon. Available online: https://github.com/thunlp/THUOCL (accessed on 5 February 2026).
- Grootendorst, M. BERTopic: Neural Topic Modeling with a Class-Based TF-IDF Procedure. arXiv 2022, arXiv:2203.05794. [Google Scholar]
- Zhang, Y.; Li, M.; Long, D.; Zhang, X.; Lin, H.; Yang, B.; Xie, P.; Yang, A.; Liu, D.; Lin, J.; et al. Qwen3 Embedding: Advancing Text Embedding and Reranking Through Foundation Models. arXiv 2025, arXiv:2506.05176. [Google Scholar] [CrossRef] [Scilit]
- McInnes, L.; Healy, J.; Melville, J. UMAP: Uniform Manifold Approximation and Projection for Dimension Reduction. arXiv 2020, arXiv:1802.03426. [Google Scholar] [CrossRef] [Scilit]
- Campello, R.J.G.B.; Moulavi, D.; Sander, J. Density-Based Clustering Based on Hierarchical Density Estimates. In Proceedings of the Pacific-Asia Conference on Knowledge Discovery and Data Mining; Pei, J., Tseng, V.S., Cao, L., Motoda, H., Xu, G., Eds.; Springer: Berlin/Heidelberg, Germany, 2013; pp. 160–172. [Google Scholar]
- Röder, M.; Both, A.; Hinneburg, A. Exploring the Space of Topic Coherence Measures. In Proceedings of the Eighth ACM International Conference on Web Search and Data Mining; Association for Computing Machinery: New York, NY, USA, 2015; pp. 399–408. [Google Scholar]
- Bowo, L.P.; Furusho, M.; Mutmainnah, W. A New HEART–4m Method for Human Error Assessment in Maritime Collision Accidents. Trans. Navig. 2020, 5, 39–46. [Google Scholar]
- Lee, H.E.; Kang, C. A Multi-Method Risk Assessment Framework to Enhancing the Safety of Urban Underground Private Sewage Treatment Systems. Tunn. Undergr. Space Technol. 2026, 168, 107162. [Google Scholar] [CrossRef] [Scilit]
- Church, K.W.; Hanks, P. Word Association Norms, Mutual Information, and Lexicography. Comput. Linguist. 1990, 16, 22–29. [Google Scholar]
- Blondel, V.D.; Guillaume, J.-L.; Lambiotte, R.; Lefebvre, E. Fast Unfolding of Communities in Large Networks. J. Stat. Mech. Theory Exp. 2008, 2008, P10008. [Google Scholar] [CrossRef] [Scilit]
- Yi, J.; Oh, Y.K.; Kim, J.-M. Unveiling the Drivers of Satisfaction in Mobile Trading: Contextual Mining of Retail Investor Experience through BERTopic and Generative AI. J. Retail. Consum. Serv. 2025, 82, 104066. [Google Scholar] [CrossRef] [Scilit]
- Zhou, Z.; Irizarry, J.; Guo, W. A Network-Based Approach to Modeling Safety Accidents and Causations within the Context of Subway Construction Project Management. Saf. Sci. 2021, 139, 105261. [Google Scholar] [CrossRef] [Scilit]
- Reason, J. Human Error; Cambridge University Press: Cambridge, UK, 1990. [Google Scholar]
- Wiegmann, D.A.; Shappell, S.A. A Human Error Approach to Aviation Accident Analysis: The Human Factors Analysis and Classification System; Routledge: London, UK, 2017. [Google Scholar]
- Qiu, Z.; Liu, Q.; Li, X.; Zhang, J.; Zhang, Y. Construction and Analysis of a Coal Mine Accident Causation Network Based on Text Mining. Process Saf. Environ. Prot. 2021, 153, 320–328. [Google Scholar] [CrossRef] [Scilit]
- Zhao, K.; Wan, L.; Lu, X.; Zhao, J.; Chen, F.; He, M.; Gao, J.; Wang, Q.; Zhang, L.; Zhang, L. Automated Information Mining in Hazardous Chemical Accident Reporting: An Improved Deep Learning Approach. J. Loss Prev. Process Ind. 2025, 97, 105660. [Google Scholar] [CrossRef] [Scilit]
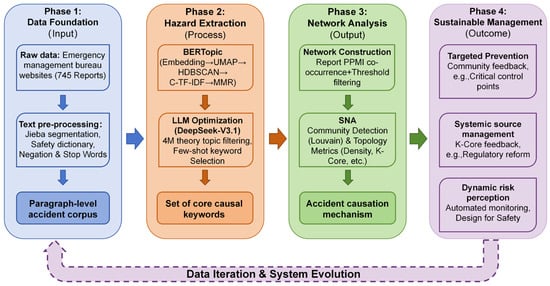
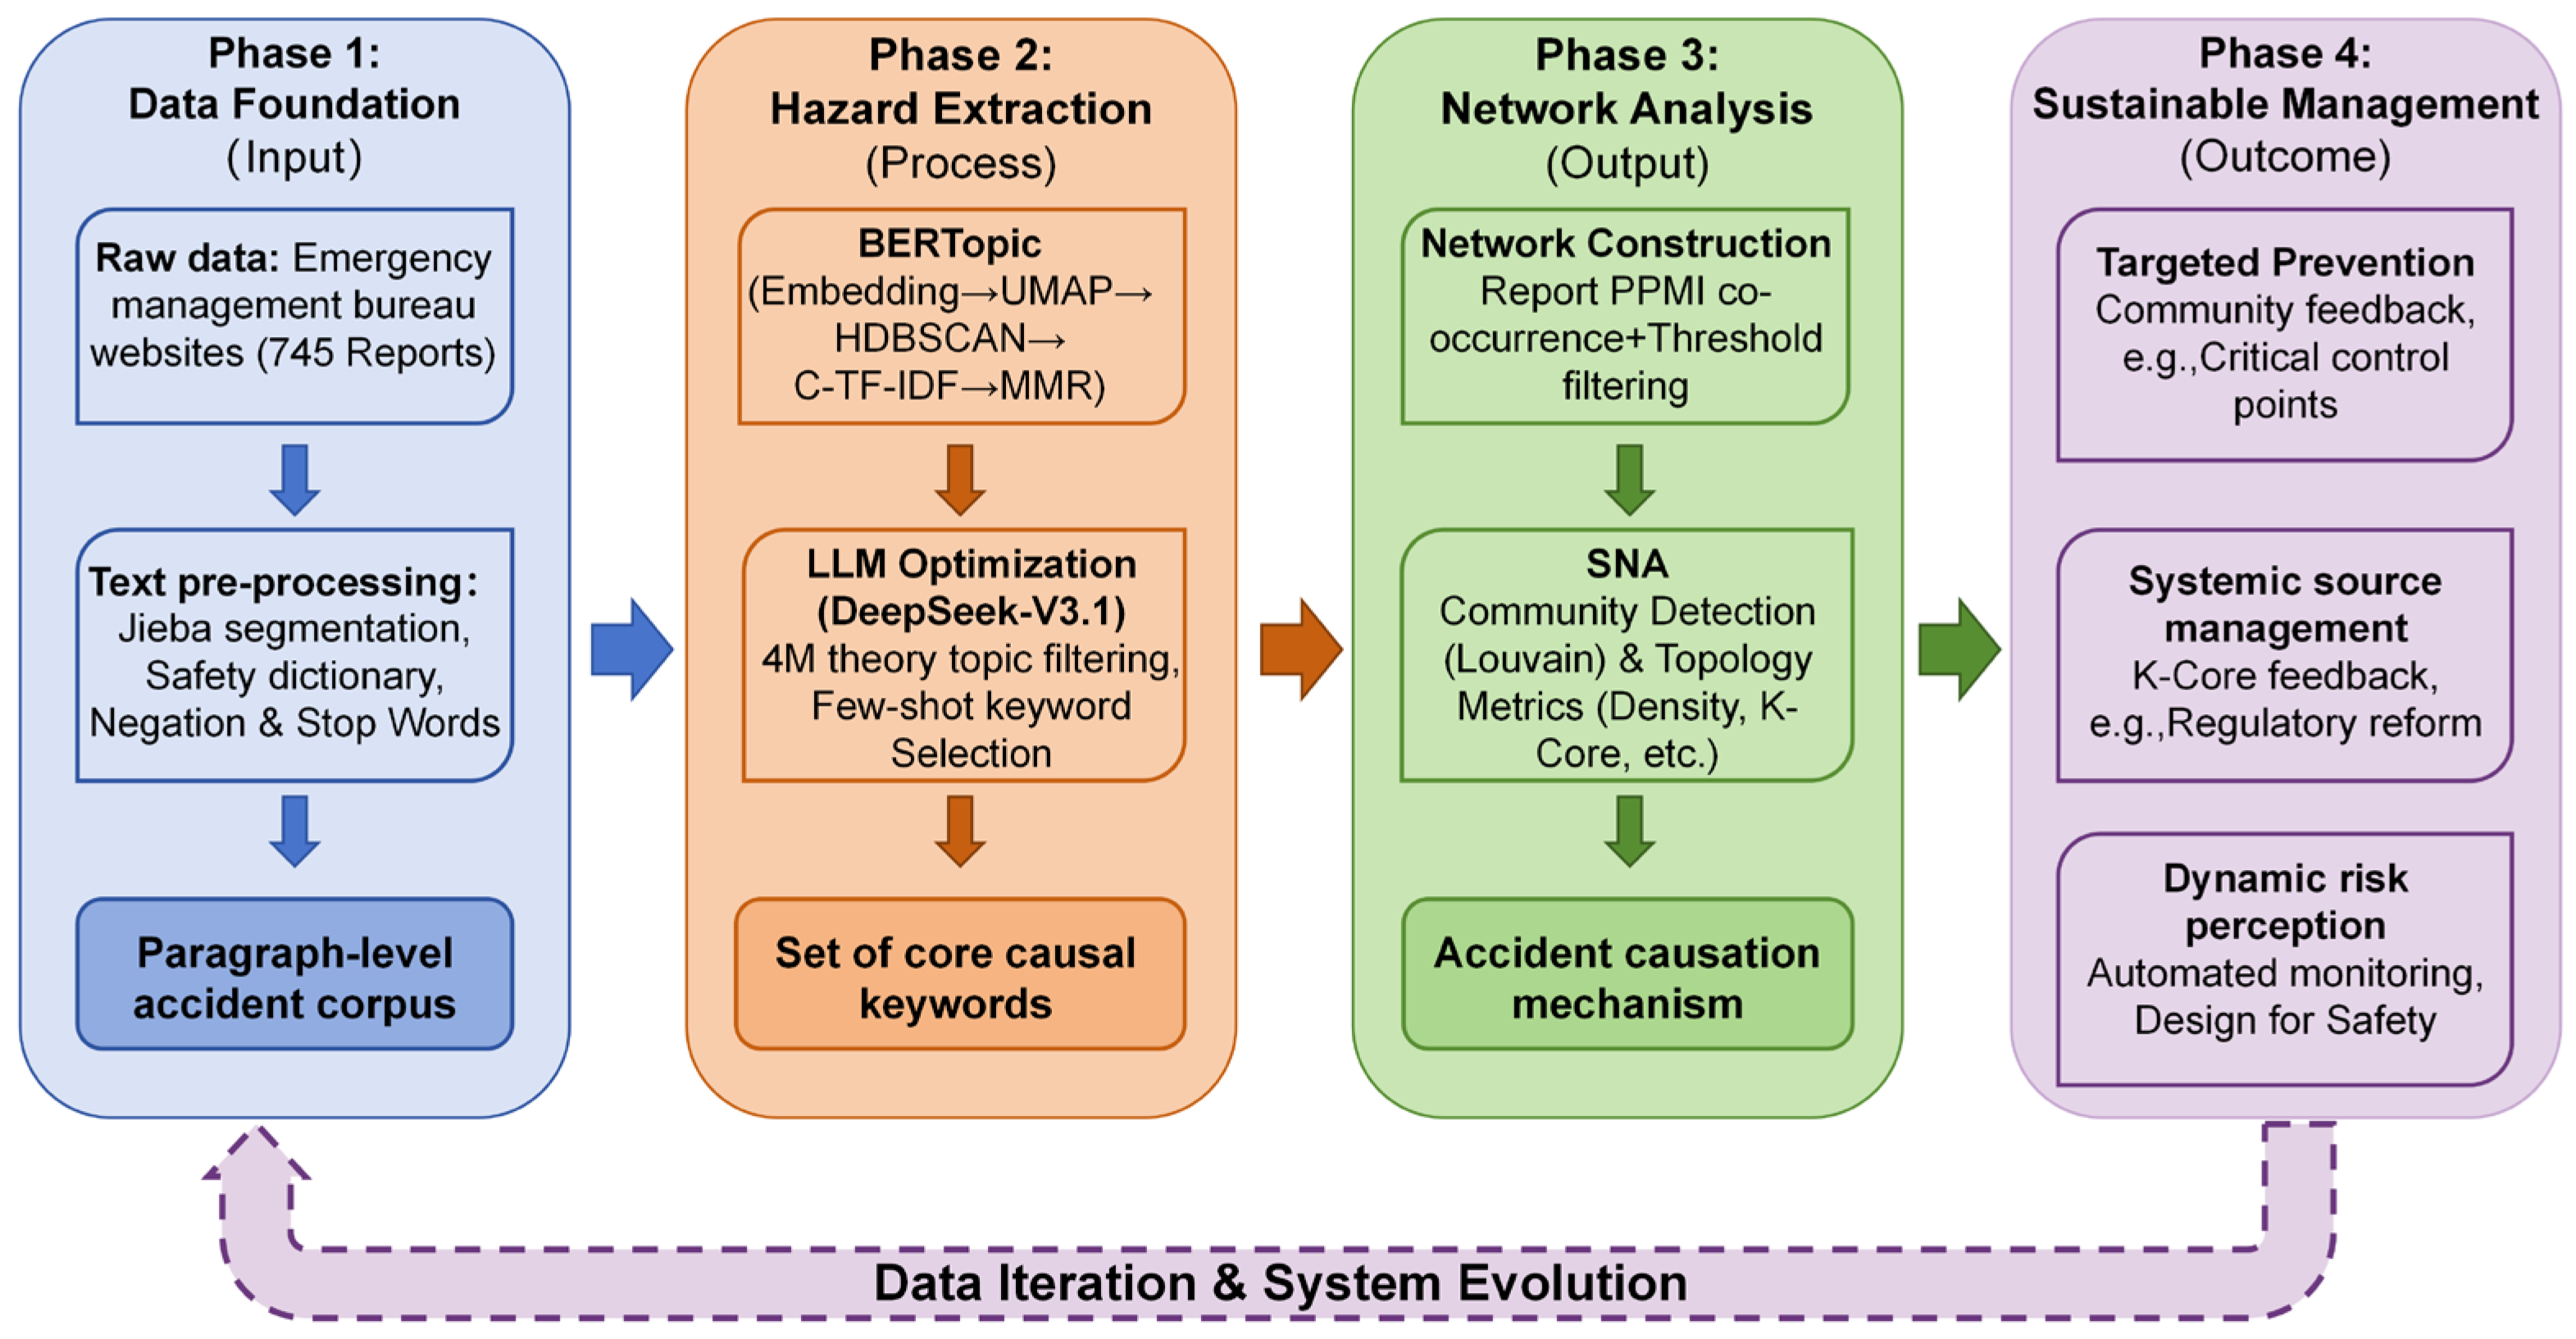
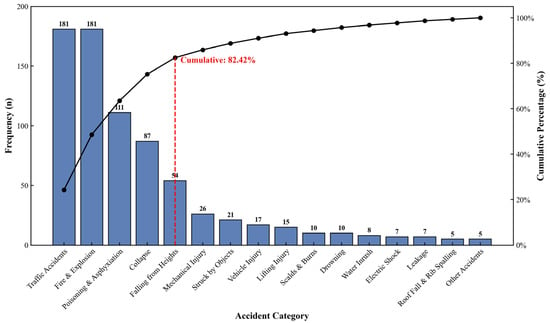
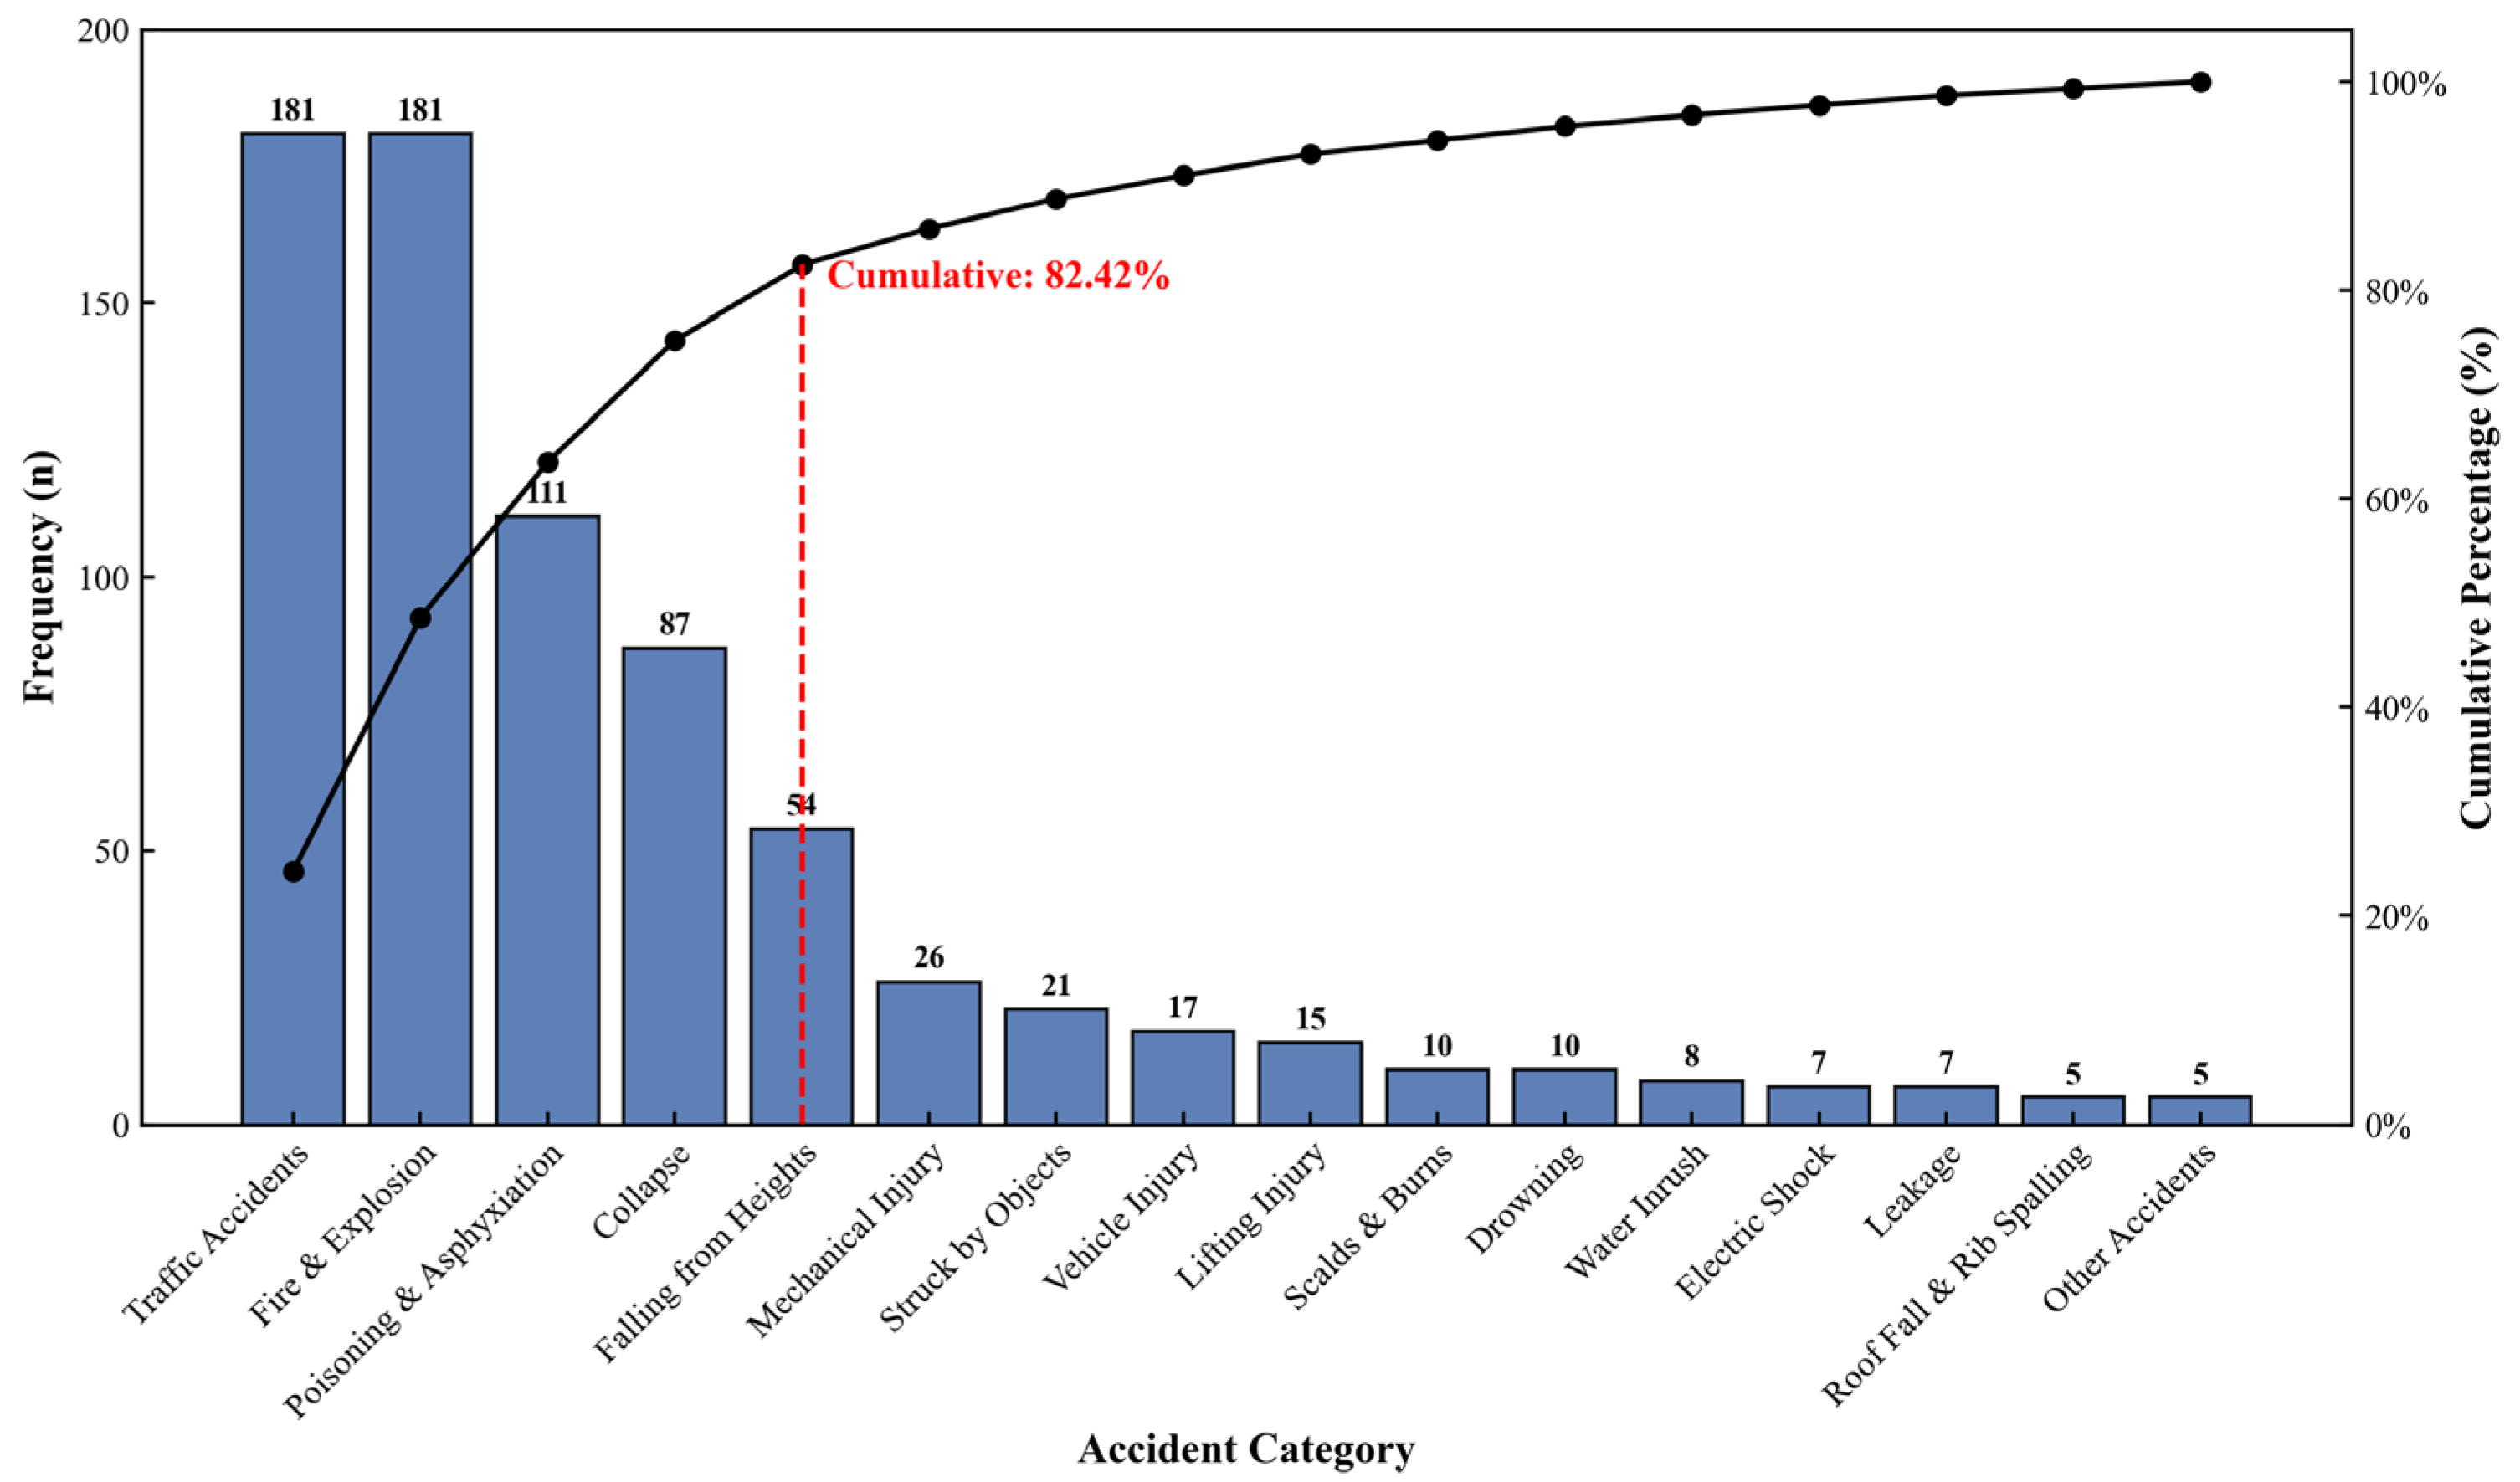
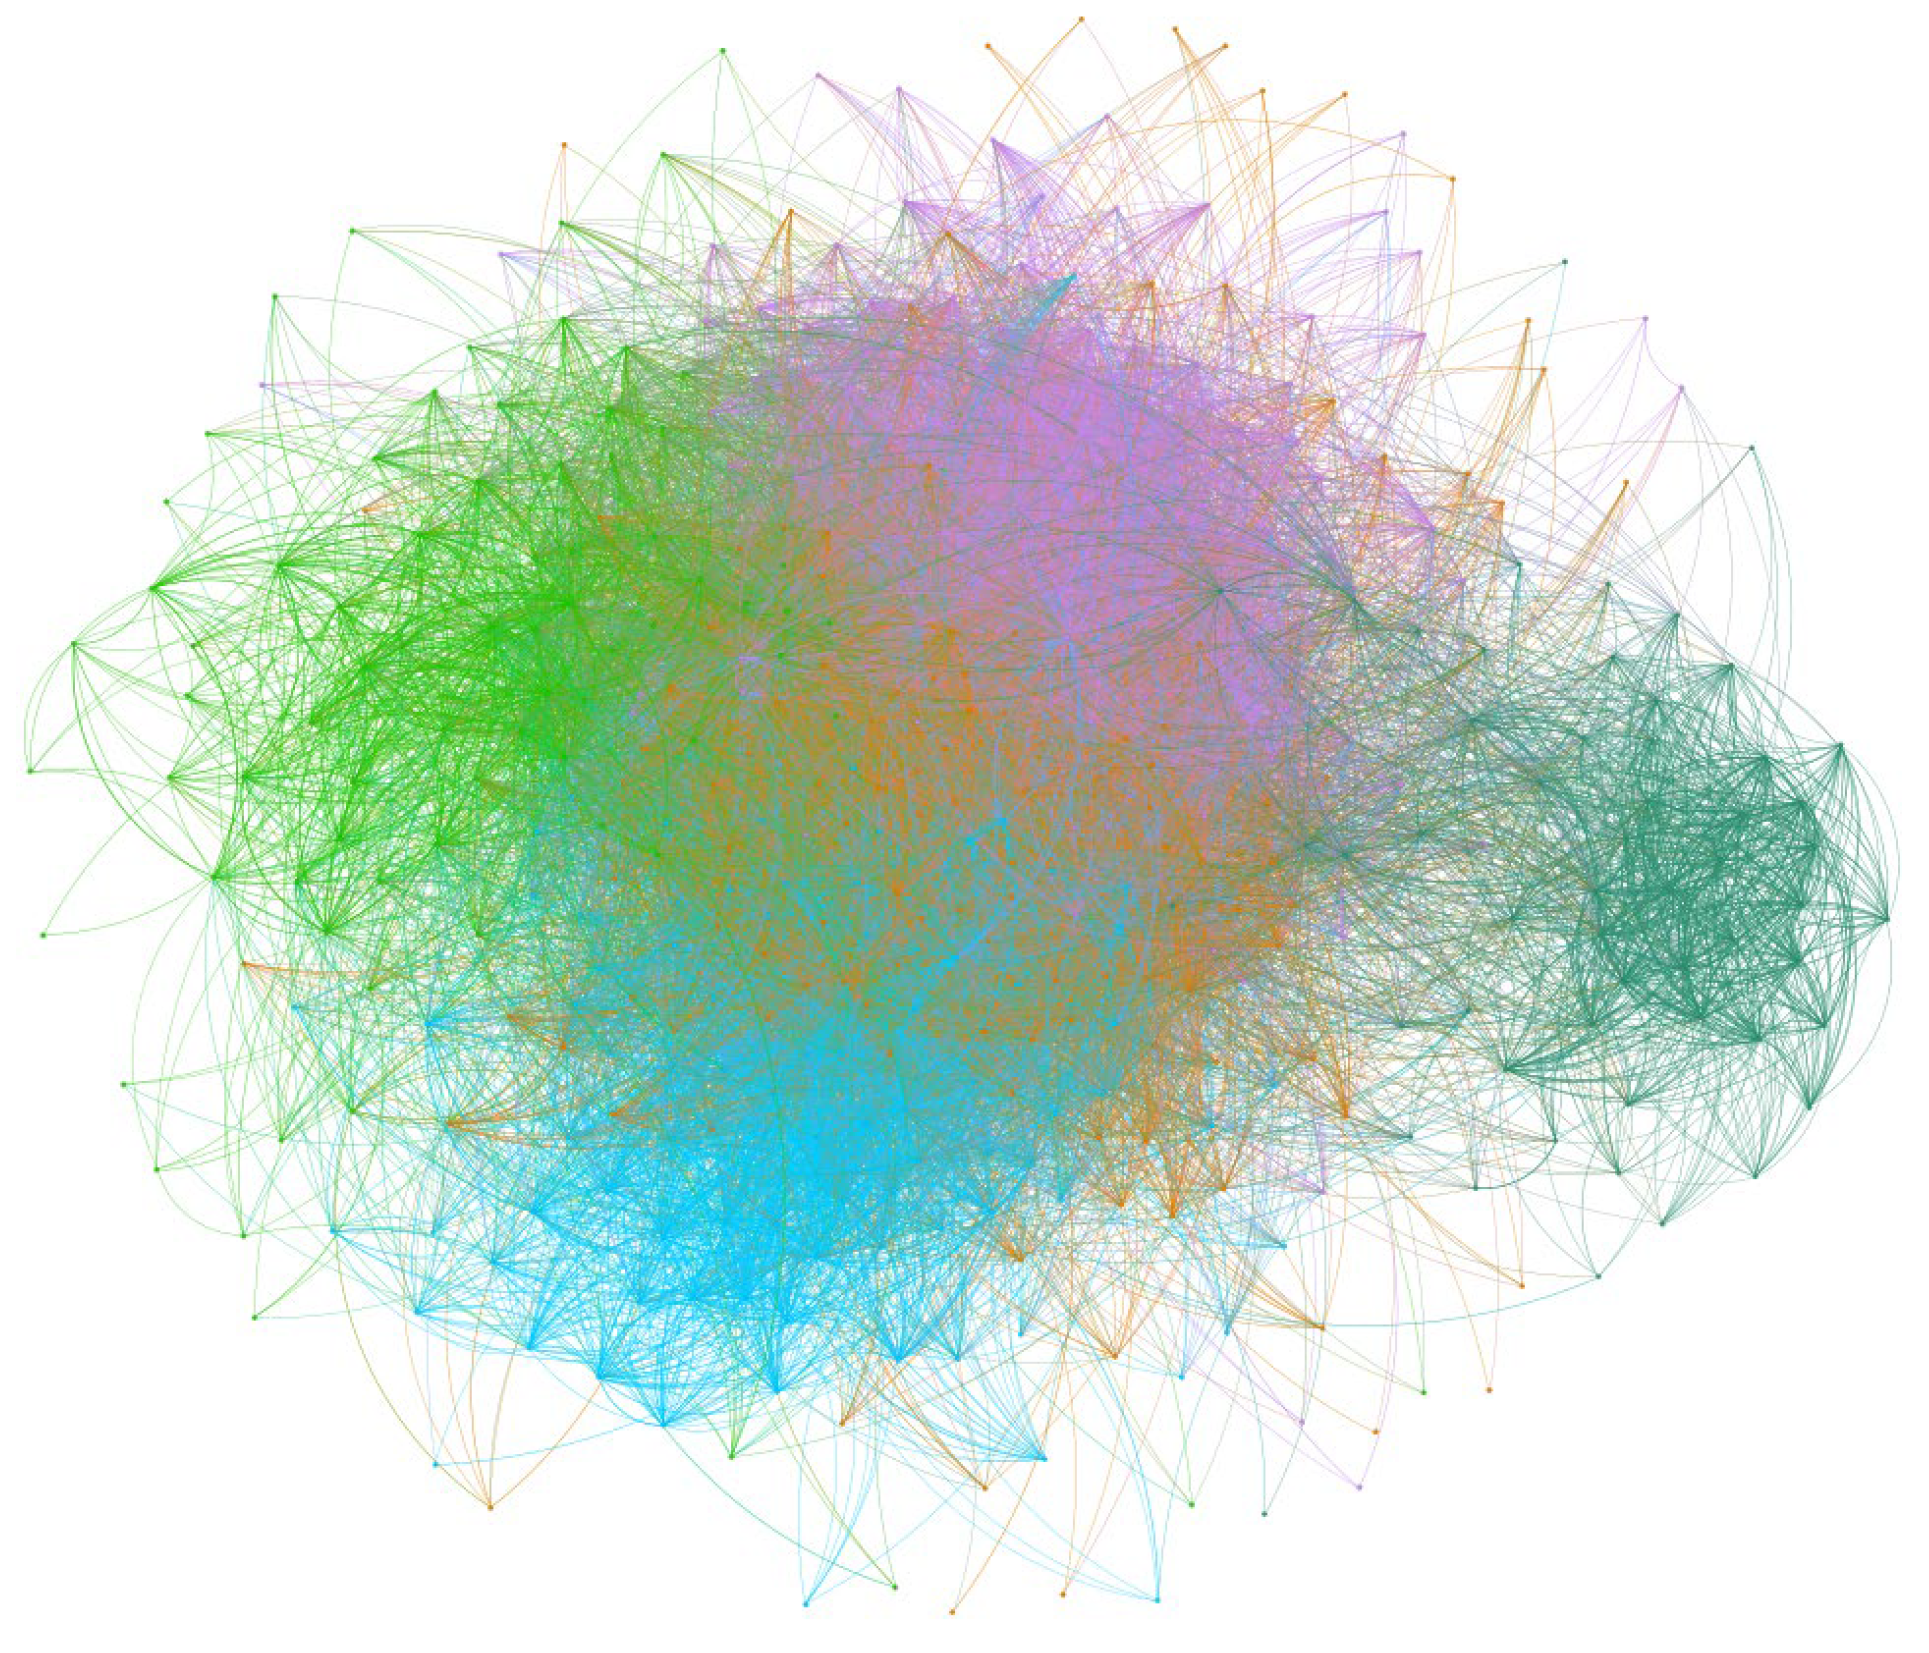
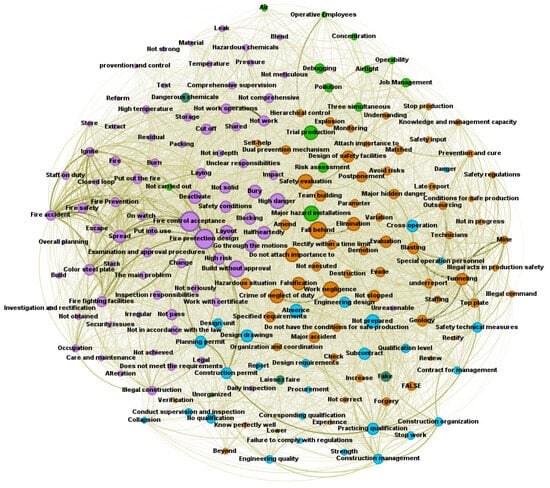
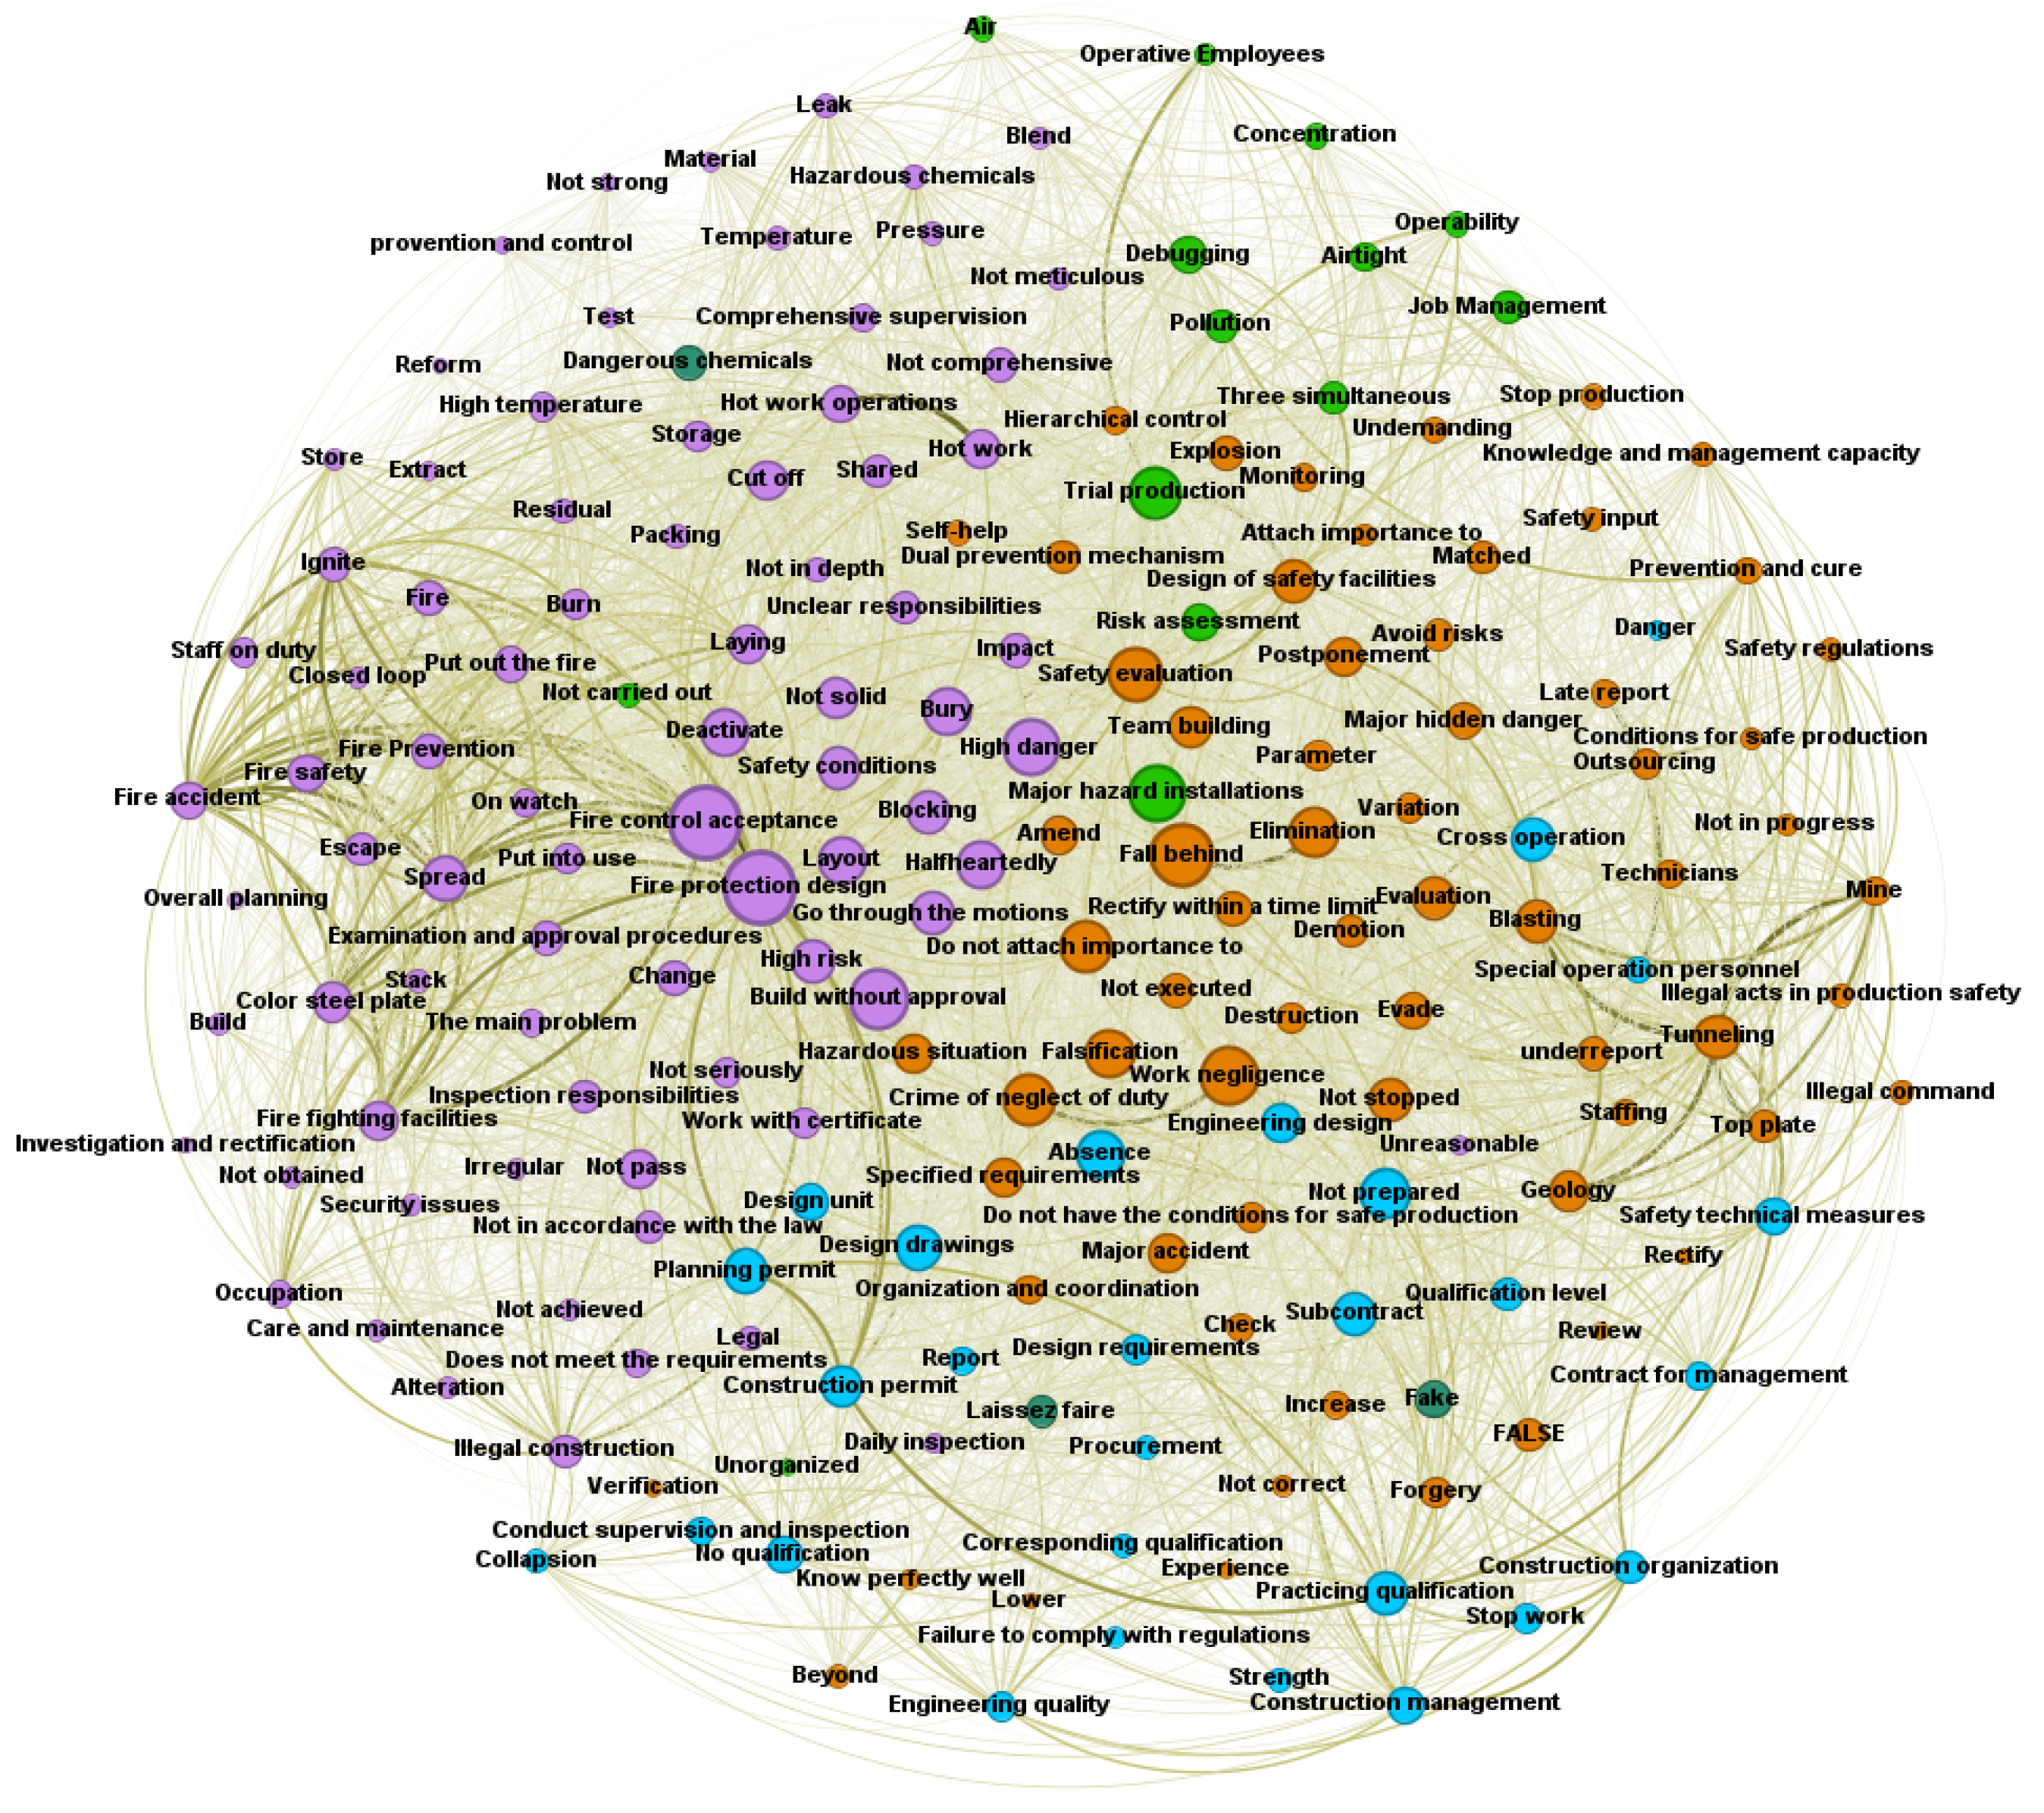

Disclaimer/Publisher’s Note: The statements, opinions and data contained in all publications are solely those of the individual author(s) and contributor(s) and not of MDPI and/or the editor(s). MDPI and/or the editor(s) disclaim responsibility for any injury to people or property resulting from any ideas, methods, instructions or products referred to in the content. |
© 2026 by the authors. Licensee MDPI, Basel, Switzerland. This article is an open access article distributed under the terms and conditions of the Creative Commons Attribution (CC BY) license.