Article

Multi-Dimensional Coupling Perspective on the Compatibility of Ecosystem Service Supply and Demand in Megacities and Future Scenario Simulation: The Case of Shanghai


1
College of Landscape Architecture and Art, Fujian Agriculture and Forestry University, Fuzhou 350002, China
2
School of Arts, Lancaster University, Lancaster LA1 4YW, UK
*
Author to whom correspondence should be addressed.
These authors contributed equally to this work.
Sustainability 2026, 18(5), 2195; https://doi.org/10.3390/su18052195
Submission received: 22 January 2026 / Revised: 18 February 2026 / Accepted: 20 February 2026 / Published: 25 February 2026

Abstract

Amid global climate change and rapid urbanization, megacities such as Shanghai confront prominent ecological challenges. A critical issue is the growing mismatch between the supply of and demand for urban green space (UGS) ecosystem services. This study aims to explore the supply–demand compatibility of Shanghai’s UGS ecosystem services and simulate future scenarios. Guided by the SSP1-2.6 scenario, it integrates the PLUS model, InVEST model, and nSFCA method to conduct dynamic analysis, quantifying supply–demand alignment and identifying imbalance areas. Results show a significant spatial mismatch: high demand but low supply in Shanghai’s inner ring and low demand but high supply in the outer ring. UGS attractiveness presents a core-concentrated and peripheral-diffused pattern by level. By 2030, a coordinated supply framework of “city-level dominance, community-level support, and neighborhood-level supplementation” will form, improving supply–demand alignment, though accessibility gaps persist. The study reveals that urbanization, planning policies, and population–spatial expansion asynchrony drive these patterns, providing scientific decision-making support for optimizing Shanghai’s green space planning and building an ecologically livable city.

1. Introduction

Driven by both global climate change and rapid urbanization, ecological and environmental issues in megacities are becoming increasingly prominent. Urban Green Space (UGS), as the core vehicle for maintaining urban ecological balance and safeguarding residents’ health and well-being, exhibits a dual-emphasized value: On the one hand, UGS delivers irreplaceable ecological benefits by regulating, supplying, cultivating, and supporting multiple ecosystem services. These include curbing soil erosion, safeguarding water resources, preserving biodiversity, and mitigating climate change [1,2]. On the other hand, as residents increasingly demand a higher quality of life, the importance of the leisure, entertainment, wellness, and recreational services provided by UGS has become increasingly prominent, serving as a key pillar for enhancing urban livability and residents’ well-being. Urban green spaces also serve as nature-based solutions (NBS) to mitigate risks and vulnerabilities associated with climate change [3]. Achieving the United Nations Sustainable Development Goals (such as Goal 11) is crucial for providing universal access to safe, inclusive, green, and public spaces [4].
Existing research on environmental justice has primarily focused on the disparate circumstances experienced by different groups, encompassing residents of various urban areas [5] and individuals of differing socioeconomic statuses [6], as well as populations of diverse racial [7], age [8], and gender backgrounds. At the methodological level, some scholars have employed statistical data to evaluate urban green space accessibility (UGSA) patterns [9], with assessment indicators including green space quantity, species community size, and distribution density. Other studies have employed spatial syntax, network analysis, kernel density estimation, and other technical methods to measure spatial proximity [8,10,11]. The core characteristic of such research is that it defines and measures the geographic accessibility of green spaces based solely on supply-side factors, failing to adequately incorporate demand-side dimensions. Meanwhile, some studies have also examined demand-side factors influencing residents’ willingness to use green spaces, such as the distance between green spaces and residential areas, as well as the size and quality of the green spaces themselves. These studies predominantly employ gravity models for analysis [6,12,13]. As an important derivative of the gravity model, the Two-Step Floating Catchment Area Method (2SFCA) and its optimized variants—such as the Gaussian Two-Step Floating Catchment Area Method (G2SFCA) [14], the Kernel Density Two-Step Floating Catchment Area Method [15], and the Huff–Gaussian Two-Step Floating Catchment Area Method (H-G2SFCA) [16]—can simultaneously account for both supply and demand factors in estimation. These factors include spatial distance, population distribution, and green space catchment area coverage. The aforementioned method has been widely applied in assessing the accessibility of urban green spaces and has been proven to demonstrate superior capability in fitting real-world scenarios [17]. Nevertheless, existing research still demonstrates notable multidimensional limitations, as key factors that significantly influence research outcomes have not been systematically incorporated. Specifically, comprehensive demand factors have not been effectively integrated into analytical frameworks; the spatial characteristics and magnitude of accessibility supply–demand imbalances remain difficult to accurately characterize; the differentiated impacts of various travel modes on green space accessibility are often overlooked; and there is a lack of prediction and analysis of green space accessibility under future development scenarios.
However, current traditional static analysis frameworks often fall short in supporting the adaptive planning of future UGS [18,19]. Currently, one-size-fits-all spatial standards, such as per capita green space area, often fail to effectively address challenges posed by spatial and temporal population dynamics and evolving local needs. While it is widely assumed that larger urban settlements should be allocated more green space to accommodate their resident populations [20], the expansion of urban green space frequently lags behind the pace of population growth and urban density increases. This mismatch, in turn, exacerbates the existing disparities in the accessibility of urban green space [21]. Despite their limitations, spatial standards remain essential within top-down spatial planning systems. They provide normative benchmarks and regulatory guidance, safeguarding the fundamental rights of urban residents to a livable daily existence. The release of the latest Coupled Model Intercomparison Project Phase 6 (CMIP6) provides robust global development trajectories that support projections of future ecosystems. The approach proposed by the Intergovernmental Panel on Climate Change (IPCC) predicts the future state of human and natural systems under climate change by coupling Shared Socioeconomic Pathways (SSPs) with Representative Concentration Pathways (RCPs) [22,23]. An increasing number of studies integrate SSP-RCP scenarios with land-use models to predict the spatial and temporal patterns of ES and their drivers [24,25]. Quantitative estimates of key ES are widely adopted through tools such as the InVEST model [26,27,28,29]. Among these, SSP1-2.6—as a representative pathway balancing sustainable development with low greenhouse gas emissions [30]—has been confirmed by multiple studies to effectively mitigate heat-related health risks at both global and regional scales [31,32]. This scenario provides scientifically grounded planning guidance for promoting ecological conservation and enhancing climate resilience in high-density cities like Shanghai [33]. As a mainstream land-use simulation tool, the PLUS model can accurately capture land-use conversion patterns based on historical data, thereby supporting predictions of future green space distribution.
In recent years, with the advancement of global carbon neutrality goals and the increasing frequency of extreme climate events, the synergistic mechanisms between urban green spaces and carbon neutrality, as well as the service effectiveness of green spaces under heatwave conditions, have become frontier research hotspots. In the field of carbon neutrality, studies have shown that urban green spaces play a key role in mitigating climate change through their carbon storage function. Sun et al. [34] evaluated urban green spaces in Beijing and found that their aboveground carbon storage makes a significant contribution to the urban carbon balance. More recent studies further indicate that the carbon sink benefits of park green spaces at multiple scales need to be systematically assessed by integrating vegetation structure, spatial configuration, and land-use types [35,36]. In terms of heatwave adaptation, green spaces have attracted widespread attention as nature-based cooling solutions. Some studies have shown that increasing urban tree canopy coverage to 30% can reduce air temperature by 1.5 °C [37], highlighting the core regulatory role of green spaces during extreme high-temperature events. Meanwhile, Matias et al. [38] emphasized the trade-off between heatwave adaptation and water resource use in Mediterranean urban vegetation. By simulating the evolution of green space ecosystem services in Shanghai under the SSP1-2.6 scenario, this study essentially responds to the core concerns regarding the synergy of green space carbon sinks and heatwave mitigation effectiveness, providing a theoretical background and comparative benchmark for subsequent discussions.
Currently, as a densely populated core node within a vast metropolitan area with extensive construction land, Shanghai faces multiple pressures, including further population concentration, spatial expansion, and intensifying climate risks. Issues such as the encroachment and uneven distribution of UGS have become increasingly prominent [39]. The Shanghai Ecological Space Special Plan (2021–2035) lists the goal of achieving full coverage of a 500 m service radius for parks and green spaces larger than 3000 m2 within the city’s development boundary as a core planning indicator for 2035. The policy intention is highly aligned with the development concepts of a “People’s City” and a “Park City.” On the one hand, through a multi-level green space layout including community parks and micro (pocket) parks, it aims to address the shortage of ecological space in high-density urban areas, enabling residents to “see greenery from their windows and access parks upon leaving their homes,” thereby meeting daily recreation and health needs. On the other hand, this target supports the ecological spatial structure of the city characterized by the “double rings, nine corridors, and ten zones,” strengthening the inclusiveness and equity of green space ecosystem services and supporting the construction of a resilient ecological city. However, this goal faces multiple implementation challenges due to the characteristics of Shanghai’s high-density living environment and practical planning constraints. First, construction land in core urban areas is already saturated, and land resources are scarce, making it difficult to locate green spaces larger than 3000 m2, while high demolition costs further limit implementation; consequently, micro (pocket) parks are often the only feasible supplement, but they struggle to meet comprehensive service demands. Second, Shanghai is promoting population inflow to new towns and population decentralization from old urban areas, leading to dynamic population redistribution, yet green space layouts lack dynamic adjustment mechanisms aligned with population changes, resulting in lagging green space supply in new towns and declining supply–demand matching in old urban areas. Third, although the plan proposes the construction of a greenway network system, some areas still suffer from insufficient greenway connectivity and inadequate public transit station coverage, meaning that green spaces may be spatially reachable but lack practical accessibility. Fourth, while the plan explicitly proposes strategies for improving ecological space quality, it also indirectly reflects significant regional disparities in current green space quality in Shanghai; in some older urban areas, green spaces have outdated facilities and single ecological functions, and even when the 500 m spatial accessibility standard is met, they still fail to satisfy residents’ demand for high-quality ecosystem services. This in return raises a series of core research questions that demand urgent attention: What characteristics does the comprehensive service capacity of UGS exhibit under the current spatial pattern? Under current conditions and the future SSP1-2.6 scenario, how will the supply level and spatial characteristics of UGS ecosystem services change? Can the accessibility and comprehensive capacity of existing UGS services effectively match current and future population demands? Under different development scenarios, what are the adaptive characteristics between the evolution of population demand and changes in ecosystem service supply of UGS, and what are the key areas and underlying causes of supply–demand imbalance? Resolving these issues is crucial for precisely enhancing the effectiveness of UGS planning and safeguarding residents’ well-being. Therefore, studying UGS accessibility, the future evolution of ecosystem services, and shifts in population demand holds significant practical and scientific value. Land-use change (LUCC) plays a major role in shaping the ecosystem service supply of urban green space. The advanced n-step Floating Catchment Area (nSFCA) method enables comprehensive quantification of urban green space service supply based on accessibility, providing robust support for analyzing supply–demand matching relationships. Against this backdrop, integrating land-use simulation, ecosystem service assessment, and nSFCA accessibility analysis emerges as an effective pathway to address these questions.
Compared with existing analytical frameworks for supply–demand matching and coupling coordination of urban green space ecosystem services, the multidimensional coupling perspective constructed in this study achieves three core theoretical advancements. First, it breaks through the limitations of traditional two-dimensional coupling analyses centered on ecological supply and population demand by incorporating transportation accessibility as an independent core dimension, thereby establishing a three-dimensional coupling analysis framework integrating ecological supply, population demand, and transportation accessibility, which compensates for the theoretical deficiency in existing studies that insufficiently consider intermediary dimensions in the transmission of supply–demand relationships. Second, it overcomes the static coupling logic of traditional research by integrating the dynamic driving mechanisms of land-use evolution and future development scenario simulations, enabling full temporal coupling analysis that characterizes current conditions, predicts future trends, and evaluates dynamic supply–demand adaptation, thus addressing the theoretical limitations of static analytical frameworks in supporting adaptive planning of urban green spaces. Third, it surpasses the limitations of single-method or single-model applications by achieving deep integration of multiple models, including land-use simulation, ecosystem service assessment, and accessibility measurement, rather than simple methodological or model aggregation, thereby constructing an integrated coupling analysis framework that unifies elements, methods, and scales and improves the fragmented theoretical system of existing methodological applications. This multidimensional coupling perspective provides a new theoretical analytical approach for studying supply–demand adaptation of green space ecosystem services in megacities and offers valuable practical exploration for expanding research dimensions and promoting methodological innovation in ecosystem service coupling studies.
In summary, this study, grounded in the high-density urban characteristics of Shanghai and guided by the SSP1-2.6 scenario, integrates the PLUS model, InVEST model, and nSFCA methodology. It addresses the core research questions by conducting a dynamic analysis of urban green space ecosystem service supply characteristics and accessibility under future scenarios. The study quantifies the alignment between ecosystem service supply and population demand, identifies areas of supply–demand imbalance, and provides more concrete and effective scientific decision-making support for optimizing Shanghai’s green space planning and building an ecologically livable city. The specific related work is summarized as follows.

2. Research Area and Data

2.1. Research Area

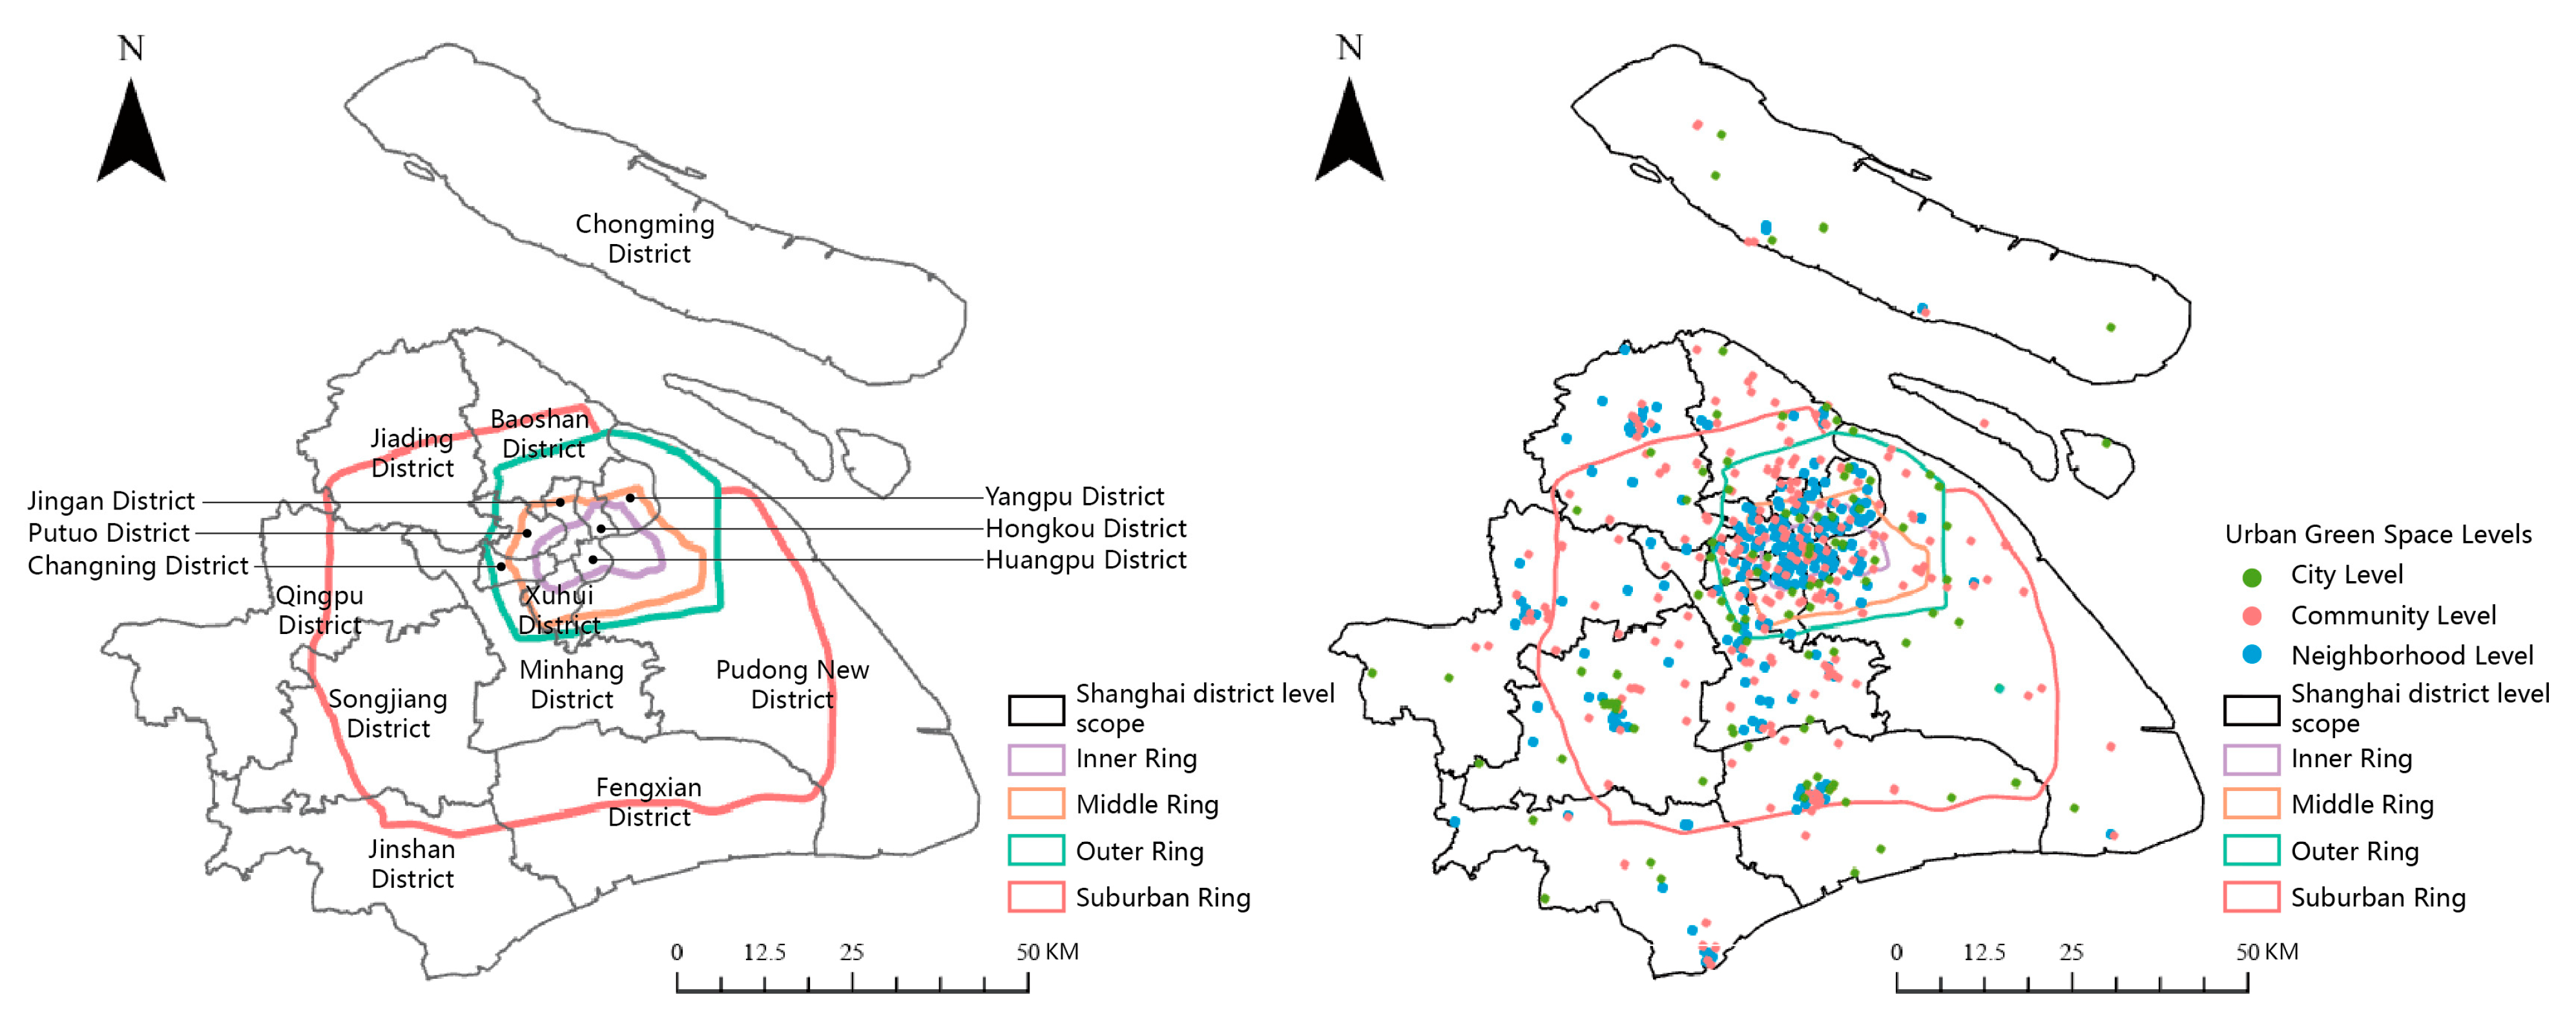
This study focuses on Shanghai, a megacity in eastern China. Against the backdrop of rapid urbanization, Shanghai’s urban expansion and shifts in land-use patterns have led to an imbalance between the supply and demand of ecosystem services [40]. This has exacerbated the urban heat island effect and increased exposure to extreme weather events, posing threats to public health [41]. In recent years, Shanghai has established a multi-tiered, integrated urban green space system through initiatives such as pocket park development, wetland conservation and restoration, and the interconnection of greenway networks. The Shanghai Ecological Space Special Plan (2021–2035) explicitly sets the goal of achieving full coverage of a 500 m service radius for parks and green spaces larger than 3000 m2 within the city’s development boundary. Shanghai’s green space development has continuously improved in both quality and quantity. From 2015 to 2021, the per capita recreational green space increased from 7.6 m2 to 8.8 m2, with the total number of green spaces reaching 532. However, recreational green spaces remain limited, necessitating improvements in service efficiency and scale [42]. This study examined all recreational green spaces (ranging from 0.03 to 434.50 km2 in size) across Shanghai’s 16 districts (Figure 1). These green spaces were rated by the Shanghai Municipal Administration of Greening and City Appearance using a five-star rating system (from five stars to one star), based on multiple factors including park classification, area, facilities, safety, and services. The rating results are published on the official website (http://lhsr.sh.gov.cn/, accessed on 16 December 2025) [43].

2.2. Data Collection and Preprocessing

Based on the scale characteristics and service functions of urban green spaces (UGS), this study categorizes recreational urban green spaces into three tiers: neighborhood-level, community-level, and city-level. Considering that walking and public transportation are the primary modes of travel for residents in large cities to access green spaces for leisure, this study focuses its analysis on these two travel patterns. Using 2020 accessibility data for green spaces across all residential areas in Shanghai, this study systematically examines the supply characteristics, service efficiency, and development status of recreational urban green spaces.
To ensure the accuracy and reliability of research data, this study implemented a rigorous data validation process. The core data required for the study—including the distribution of urban green spaces, residential area locations, road networks, transportation infrastructure, and urban service points (covering roads, public transit routes and stations, urban green spaces, and residential area entrances/exits)—were collected through multiple sources and subjected to cross-validation. Specific data sources include official government databases and authoritative geospatial platforms (such as the Bigemap platform, http://www.bigemap.com/, accessed on 16 December 2025). Discrepancies identified during data verification were resolved through on-site inspections and consultations with local urban planning authorities. This multi-tiered data validation approach significantly enhanced the credibility of the research findings. Following comprehensive data cleansing, a road network optimized for walking and public transit was constructed based on the verified data. This network was further refined into transportation models tailored to different travel modes by integrating actual traffic characteristics and resident travel scenarios.
The shortest travel times for each mode of transportation were calculated using origin–destination (OD) analysis. Specifically, ArcGIS 10.7 software was employed to determine the minimum time cost between residential area entrances/exits and urban green space entrances/exits [13]. This data provides foundational support for subsequent calculations of accessibility threshold times (i.e., maximum acceptable travel times) for urban green spaces at different hierarchical levels. Specifically, the 500 m accessibility target outlined in the Shanghai Ecological Space Special Plan (2021–2035) applies exclusively to neighborhood-level urban green spaces. Travel time thresholds for community-level and city-level green spaces are set based on differences in travel modes and green space hierarchy. The travel threshold time and per capita green space area standards for urban green spaces at various levels comprehensively reference prior research findings on Shanghai’s urban green space service radius [44], as well as relevant domestic and international standards and technical guidelines for urban green space or park system planning. These include the Urban Landscape and Greening Evaluation Standard (GB/T 50563-2010) (China, 2010) [45], Shanghai Urban Park Planning and Construction Guidelines (https://lhsr.sh.gov.cn/ghjhl/, accessed on 16 December 2025), and the Accessible Natural Greenspace Standard (ANGSt) [46]. The population size of each residential area was estimated by calculating the ratio of the total residential floor area in each Shanghai community to the per capita residential floor space [43].

3. Methods

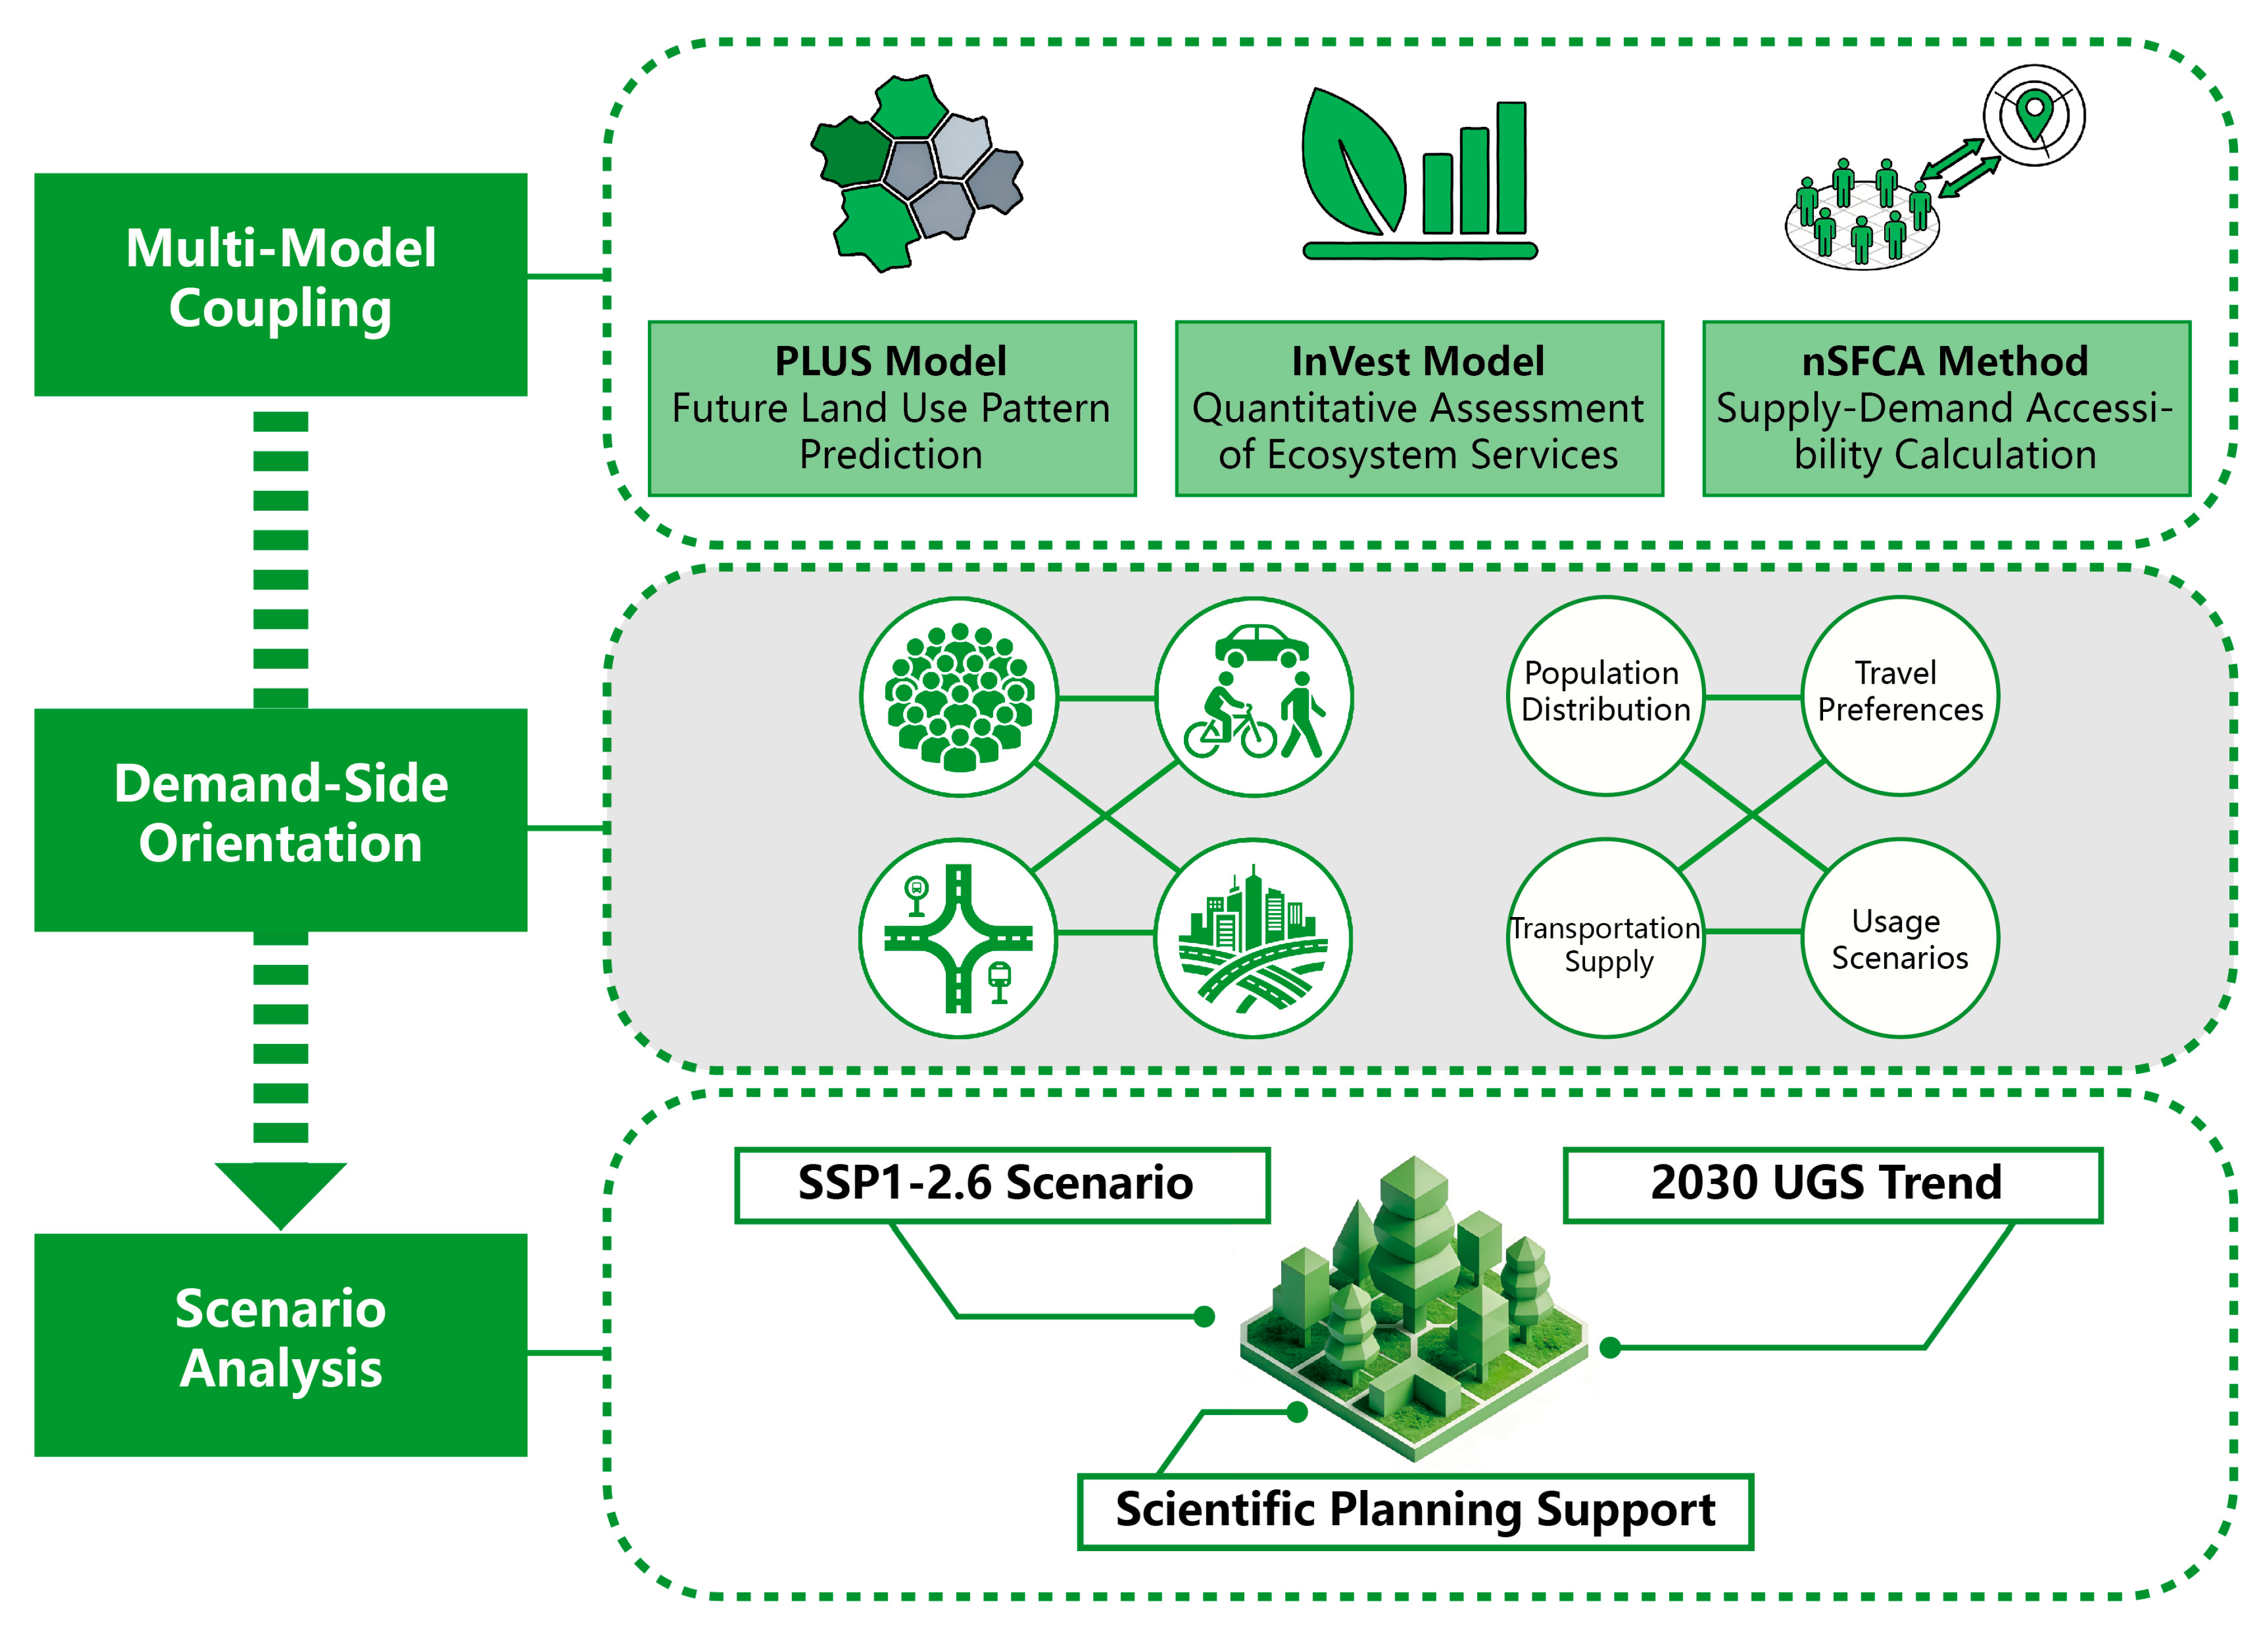
This study established a multidimensional coupled analytical framework that integrates land-use simulation, ecosystem service assessment, and accessibility measurement to investigate the compatibility between supply and demand of ecosystem services in Shanghai’s urban green spaces and their future scenario characteristics. The specific methodology is as follows:
  • Based on land-use/cover change data from 2010 to 2020, the PLUS model was employed to simulate Shanghai’s land use spatial patterns under the SSP1-2.6 scenario for the year 2030. Land-use types were reclassified into six categories: forest, grassland, water bodies, wetland, cropland, and non-vegetation. Model accuracy was validated using the Kappa coefficient, and a 30 m resolution land use map was generated to analyze the evolution characteristics of green spaces.
  • Using the InVEST model, the supply capacity of urban green spaces in 2023 and 2030 was quantitatively assessed for five core ecosystem services: soil retention, water purification, habitat quality, carbon storage, and water yield. Each service module was quantified using corresponding methodologies and formulas, including carbon density calculations, water balance principles, erosion factor measurements, and human activity threat assessments.
  • Building upon this foundation, the integrated urban green space accessibility index (UgsA) was constructed using the n-step Floating Catchment Area method (nSFCA). This index encompasses both walking and public transit modes by integrating three key factors: comprehensive carrying capacity, population demand, and transportation supply. The model incorporates the Huff model to calculate residents’ green space selection probability, employs a Gaussian function to correct for distance impedance effects, and assigns differentiated mode weights based on green space hierarchy (neighborhood, community, and city levels). Simultaneously, the study calculates complementary indices: the Comprehensive Attractiveness Index for Urban Green Spaces, Population Demand Index, and Transportation Supply Index.
By integrating land use simulation, ecosystem service assessment, and accessibility measurement results, this study systematically analyzes the supply–demand matching relationship of ecosystem services provided by urban green spaces in Shanghai (Figure 2).

3.1. Land Use Simulation

To forecast future development, this study employs the PLUS model to simulate land distribution in 2030 based on land use/land cover change (LUCC) data from 2010 to 2020. This study adopts a spatial resolution of 30 m, which not only matches the raster-based computational requirements of the InVEST model for ecosystem service assessment but also aligns with the commonly used resolution in studies of green space spatial patterns at the municipal scale in Shanghai. This resolution balances computational efficiency while accurately capturing the spatial boundaries and distribution characteristics of small-scale green spaces such as neighborhood- and community-level green areas, thereby avoiding the loss or blurring of green space spatial information caused by overly coarse resolution. This study, based on data from 19 CMIP6 model projections by the Yuan Jiacan research group at Fudan University, investigated the disease burden associated with hot and humid weather in Shanghai under different emission scenarios. Results indicate that as a humid megacity, Shanghai experiences significantly increased risks of all-cause, cardiovascular, and respiratory outpatient visits during hot and humid weather, with nighttime risks potentially exceeding daytime levels. Compared to the high-emission scenario SSP5-8.5, maintaining the low greenhouse gas emission pathway SSP1-2.6 by 2100 could effectively prevent 13.05% of heat-related illnesses. This study provides core evidence demonstrating how the SSP1-2.6 pathway safeguards the health of Shanghai residents and aligns with the requirements for building a livable city [47]. To ensure consistency across datasets, land use types were reclassified into six categories: forest, grassland, water bodies, wetlands, cropland, and non-vegetation (including impervious surfaces and unutilized land). Model accuracy was assessed using the Kappa coefficient, and the resulting 30 m land use map served as the foundation for subsequent analyses. Detailed information on scenario settings, model parameters, and modeling factors can be found in Supplementary Material Table S1.

3.2. Assessment of Urban Green Space Ecosystem Service Supply

Based on existing empirical research findings [48,49], this study identified five core provisioning types of urban green space ecosystem services (UGS-ES): soil retention (SR), water purification (WP), habitat quality (HQ), carbon storage (CS), and water yield (WY). This indicator system encompasses the multidimensional ecological benefits of UGS in resource supply assurance, environmental process regulation, and ecological integrity maintenance [50,51]. Moreover, its role in enhancing human well-being and sustaining habitat quality has been extensively validated by the academic community [52,53,54].
Specifically, SR effectively curbs soil erosion and ecosystem degradation, providing support for the biophysical foundation of human settlements while safeguarding habitat ecological integrity [55]; WY and WP play crucial roles in ensuring human water security [56]; HQ reflects the core capacity of ecosystems to support biodiversity and human habitability [57]; and CS, as a critical ecological regulation service, contributes to climate change mitigation through carbon sequestration and storage functions, thereby supporting long-term ecosystem stability [57,58]. To objectively reflect the relative importance of each service and enhance the academic rigor and scientific reliability of the assessment results, this study applies the Analytic Hierarchy Process (AHP) to determine the weights of the five ecosystem services, thereby avoiding biases caused by subjective weighting. The weight calculation process refers to existing related studies [59]. Ultimately, this study employed the InVEST model to conduct quantitative assessments of the aforementioned five ecosystem services under the SSP1-2.6 scenario. The evaluation results lay the foundation for subsequent spatial analyses of ecosystem service (ES) dynamics [60,61]. The rationale for selecting the indicators is detailed in Supplementary Material Table S2.

3.2.1. Carbon Storage

This module assesses regional ecosystem carbon storage based on the spatial distribution patterns, cover types, and corresponding carbon densities of each land use category and automatically generates spatial distribution maps of carbon storage. The final values used in this study are provided in Supplementary Material, Table S3. The formula is as follows:
C S = k = 1 n A k ( C a b o v e + C b e l o w + C s o i l + C d e a d )
In the formula: C S represents total carbon storage, t; A k denotes the area of land category k in the study area, hm2; n is the number of land categories; C a b o v e represents above-ground carbon density; C b e l o w represents below-ground carbon density; C s o i l represents soil organic carbon density; C d e a d represents dead wood and litter carbon density, measured in t/hm2.

3.2.2. Water Yield

In the InVEST model, water yield is defined as the runoff volume across all land use categories. Based on fundamental water balance principles, the annual water yield for each grid cell is precisely quantified by calculating the difference between the annual average precipitation and the actual annual evapotranspiration. The biophysical input tables used in this module are derived from existing studies [23,62] and are included in Supplementary Material, Table S4. The Z-value parameter was determined through iterative calibration and empirical validation, ultimately set to 11.5 [23]. The formula is as follows:
W Y i j = ( 1 A E T i j P i ) P i
In the formula: W Y i j represents the annual average runoff from land use type j in grid cell i , in mm; A E T i j represents the actual annual evapotranspiration from land use type j in grid cell i , in mm; P i represents the annual average precipitation in grid cell i , in mm.

3.2.3. Soil Retention

The module consists of two components: reduced soil erosion, expressed as the difference between potential erosion and actual erosion; and sediment retention, expressed as the product of sediment volume and sediment retention rate, reflecting the reduction in potential erosion at each site [63]. Specific parameters are provided in Supplementary Material, Table S5. The formula is as follows:
S C = R K L S ( 1 C P )
In the formula: S C represents soil retention, t/(hm2·a); R denotes the rainfall erosion index calculated based on precipitation; K is the soil erodibility factor; L S is the terrain factor derived from the slope length factor ( L ) and slope gradient factor ( S ); C represents the vegetation cover factor; P denotes the soil conservation measure factor.

3.2.4. Habitat Quality

The module reflects the impact of human activities on the environment. The higher the intensity of human activities, the greater the threat to habitats, and the lower the quality and level of biodiversity. Habitat quality depends on the relative impact of threats, the sensitivity of habitats to threats, and the distance between habitats and threat sources [64]. The corresponding weights and sensitivity parameters are based on existing literature [65], as detailed in Supplementary Material Tables S6 and S7. The formula is as follows:
D x j = r = 1 R y = 1 Y r ( W r / r = 1 R W r ) r y i r x y β x S j r
In the formula: D x j denotes the habitat degradation index (habitat quality) of grid cell x under land use/cover type j ; R represents the total number of ecological threat factors; W r denotes the weight of threat factor type r ; Y r denotes the quantity of threat factor type r ; r y denotes the quantity or intensity of the r th threat factor at the y th specific threat point; i r x y represents the distance decay function value between grid cell x and threat source point y ; β x indicates the legal protection level of grid cell x ; S j r denotes the sensitivity coefficient of land use/cover type j to the r th threat factor.
H Q x j = H j [ 1 ( D x j z D x j z + k z ) ]
In the formula: H Q x j denotes the habitat quality of grid cell x under land use/cover type j , with values ranging from 0 to 1; H j represents the habitat suitability index for land use/cover type j ; D x j indicates the degree of habitat degradation; k is the semi-saturation constant; z is the exponent parameter, with the model specifying z = 2.5. This formula indicates that habitat quality varies with changes in the habitat suitability index, and when H j = 0, H Q x j = 0.

3.3. Measuring Urban Green Space Supply Levels from an Accessibility Perspective and Its Three Key Elements

To analyze the supply characteristics of urban green spaces from an accessibility perspective, this study integrates three key factors—comprehensive carrying capacity, population demand, and transportation supply—to estimate the accessibility supply levels of green space areas across cities. Subsequently, the n-step Floating Catchment Area method (nSFCA) is employed. Through calculations, the urban green space comprehensive accessibility index (UgsA) is derived to characterize the supply level of urban green spaces. The three key factors—comprehensive carrying capacity, population demand, and transportation supply—were quantified through the Urban Green Space Comprehensive Carrying Capacity Index (UgsCC), the Urban Green Space Population Demand Index (UgsPD), and the Urban Green Space Transportation Supply Index (UgsTS), respectively.

3.3.1. Calculation Method for the Urban Green Space Accessibility Index (UgsA)

The comprehensive accessibility index ( U g s A j ) of urban green space j characterizes the accessibility supply level of that green space. It is calculated by aggregating the accessibility values from all residential points k within the time threshold t 0 range of green space j to that green space. The comprehensive accessibility index ( A i j ) between residential point i and green space j characterizes the accessibility level from each residential point to its corresponding green space. This index encompasses both walking and public transportation modes to reflect travel diversity, and it references relevant Shanghai-based studies to determine the weights of walking and public transportation [66], thereby enhancing the rationality and scientific robustness of the analysis. The calculation formula is as follows:
U g s A j = k t i j t 0 A i j , A i j = 75 % P r o b b i j w G t i j w , t 0 w s j k t i j w t 0 w P r o b b i j w P i + 25 % P r o b b i j p G t i j p , t 0 p s j k t i j p t 0 p P r o b i j p P i , L = 1 50 % P r o b b i j w G t i j w , t 0 w s j k ϵ t i j w t 0 w P r o b i i j w P i + 50 % P r o b b i j p G t i j p , t 0 p s j k t i j p t 0 p P r o b b i j p P i , L = 2 25 % P r o b b i j w G t i j w , t 0 w s j k ϵ t i j w t 0 w P r o b i j w P i + 75 % P r o b b i j p G t i j p , t 0 p s j k t i j p t 0 p P r o b i j p P i , L = 3
In the formula: k represents all residential points i within the service area of green space j (i.e., satisfying t i j t 0 ); t i j denotes the travel time between residential point i and green space j ; t i j w and t i j p represent the travel times for walking and public transportation, respectively. P r o b i j denotes the probability of residents choosing to travel from settlement i to green space j . This indicator, based on the Huff model, quantifies the probability of residents selecting a green space service point by integrating two factors: green space attractiveness and travel distance [67]. Here, P r o b i j w and P r o b i j p respectively represent the probabilities of residents choosing to travel from i to j via walking and public transportation. This study introduces the Gaussian function G as a modified distance impedance coefficient, where G ( t i j w , t 0 w ) and G ( t i j p , t 0 p ) correspond to walking and public transportation modes, respectively. t 0 represents the travel time threshold for urban green spaces, determined based on the service radius and travel mode for different tiers of green spaces. Under this definition, t 0 w and t 0 p respectively denote the travel time thresholds for distance decay effects under walking and public transportation modes; simultaneously, t 0 w also serves as the critical time threshold at which residents abandon walking in favor of public transportation. For trip combinations i j where the walking travel time is below this critical threshold, residents typically disregard travel costs. At this point, the distance impedance coefficient G exhibits no decay effect, and residents will not opt for public transportation. P i represents the population size of settlement i , and S j denotes the area of green space j . The weights for walking and public transportation modes corresponding to different levels of green space ( L ) were determined based on the importance of various travel modes in urban green space commuting in Shanghai, referencing questionnaire survey results from existing research [68].
The formula for calculating P r o b i j p and the coefficient G is as follows:
P r o b i j = M j G t i j , t 0 h t i j t 0 M j G ( t i j , t 0 ) , G ( t i j , t 0 ) = 1 , i f   t i j w t 0 w { e ( 1 2 ) × ( t i j t 0 ) 2 e ( 1 2 ) 1 e ( 1 2 ) } , i f   t i j w > t 0 w   a n d   t i j t 0 0 , i f   t i j > t 0
In the formula: M j represents the attractiveness of urban green space j , quantified based on the star rating of the green space. In this study, the time threshold t 0 w for walking trips is set at 7.5 min (corresponding to a walking distance of 500 m at a walking speed of 4 km/h). Research indicates that 500 m is the distance threshold at which residents are more likely to choose walking over other modes of transportation [11]. This distance also aligns with Shanghai’s target for enhancing the accessibility of urban green spaces.

3.3.2. Definition and Calculation of the Urban Green Space Comprehensive Carrying Capacity Index (UgsCCj)

The comprehensive carrying capacity index ( U g s C C j ) of urban green space j characterizes its overall carrying capacity, calculated based on two key factors: the green space’s attractiveness M j and its visitor capacity. This index is derived from the ratio of green space j ’s area ( S j ) to the per capita suitable area for L level green space ( P c g s a L ), as expressed by the following formula:
U g s C C j = M j S j P c g s a L
The standards for P c g s a in this study are shown in Table 1 and Table 2.

3.3.3. Calculation Method for the Urban Green Space Population Demand Index (UgsPD)

UgsPD represents the population demand for each Urban Green Space (UGS) location. The comprehensive population demand index ( U g s P D j ) for UGS location j is measured by the sum of population demands from all residential locations ( k ) within threshold time t 0 to j that can access UGS supply at location i . Its calculation formula is
U g s P D j = k { t i j t 0 } P i

3.3.4. Calculation Method for the Urban Green Space Transportation Supply Index (UgsTS)

The Comprehensive Transportation Supply Index of Urban Green Space j ( U g s T S j ) is used to characterize the traffic supply level of the green space. Its calculation method is as follows: for all residential areas k within the time threshold t 0 of green space j , superimpose the accessibility traffic supply volume from each residential area i to this green space. The formula is
U g s T S j = k t i j t 0 75 % G t i j w , t 0 w + 25 % G t i j p , t 0 p , L = 1 k t i j t 0 50 % G t i j w , t 0 w + 50 % G t i j p , t 0 p , L = 2 k t i j t 0 25 % G t i j w , t 0 w + 75 % G t i j p , t 0 p , L = 3

4. Results

4.1. Analysis of Supply and Demand Characteristics of Urban Green Space Resources in Shanghai

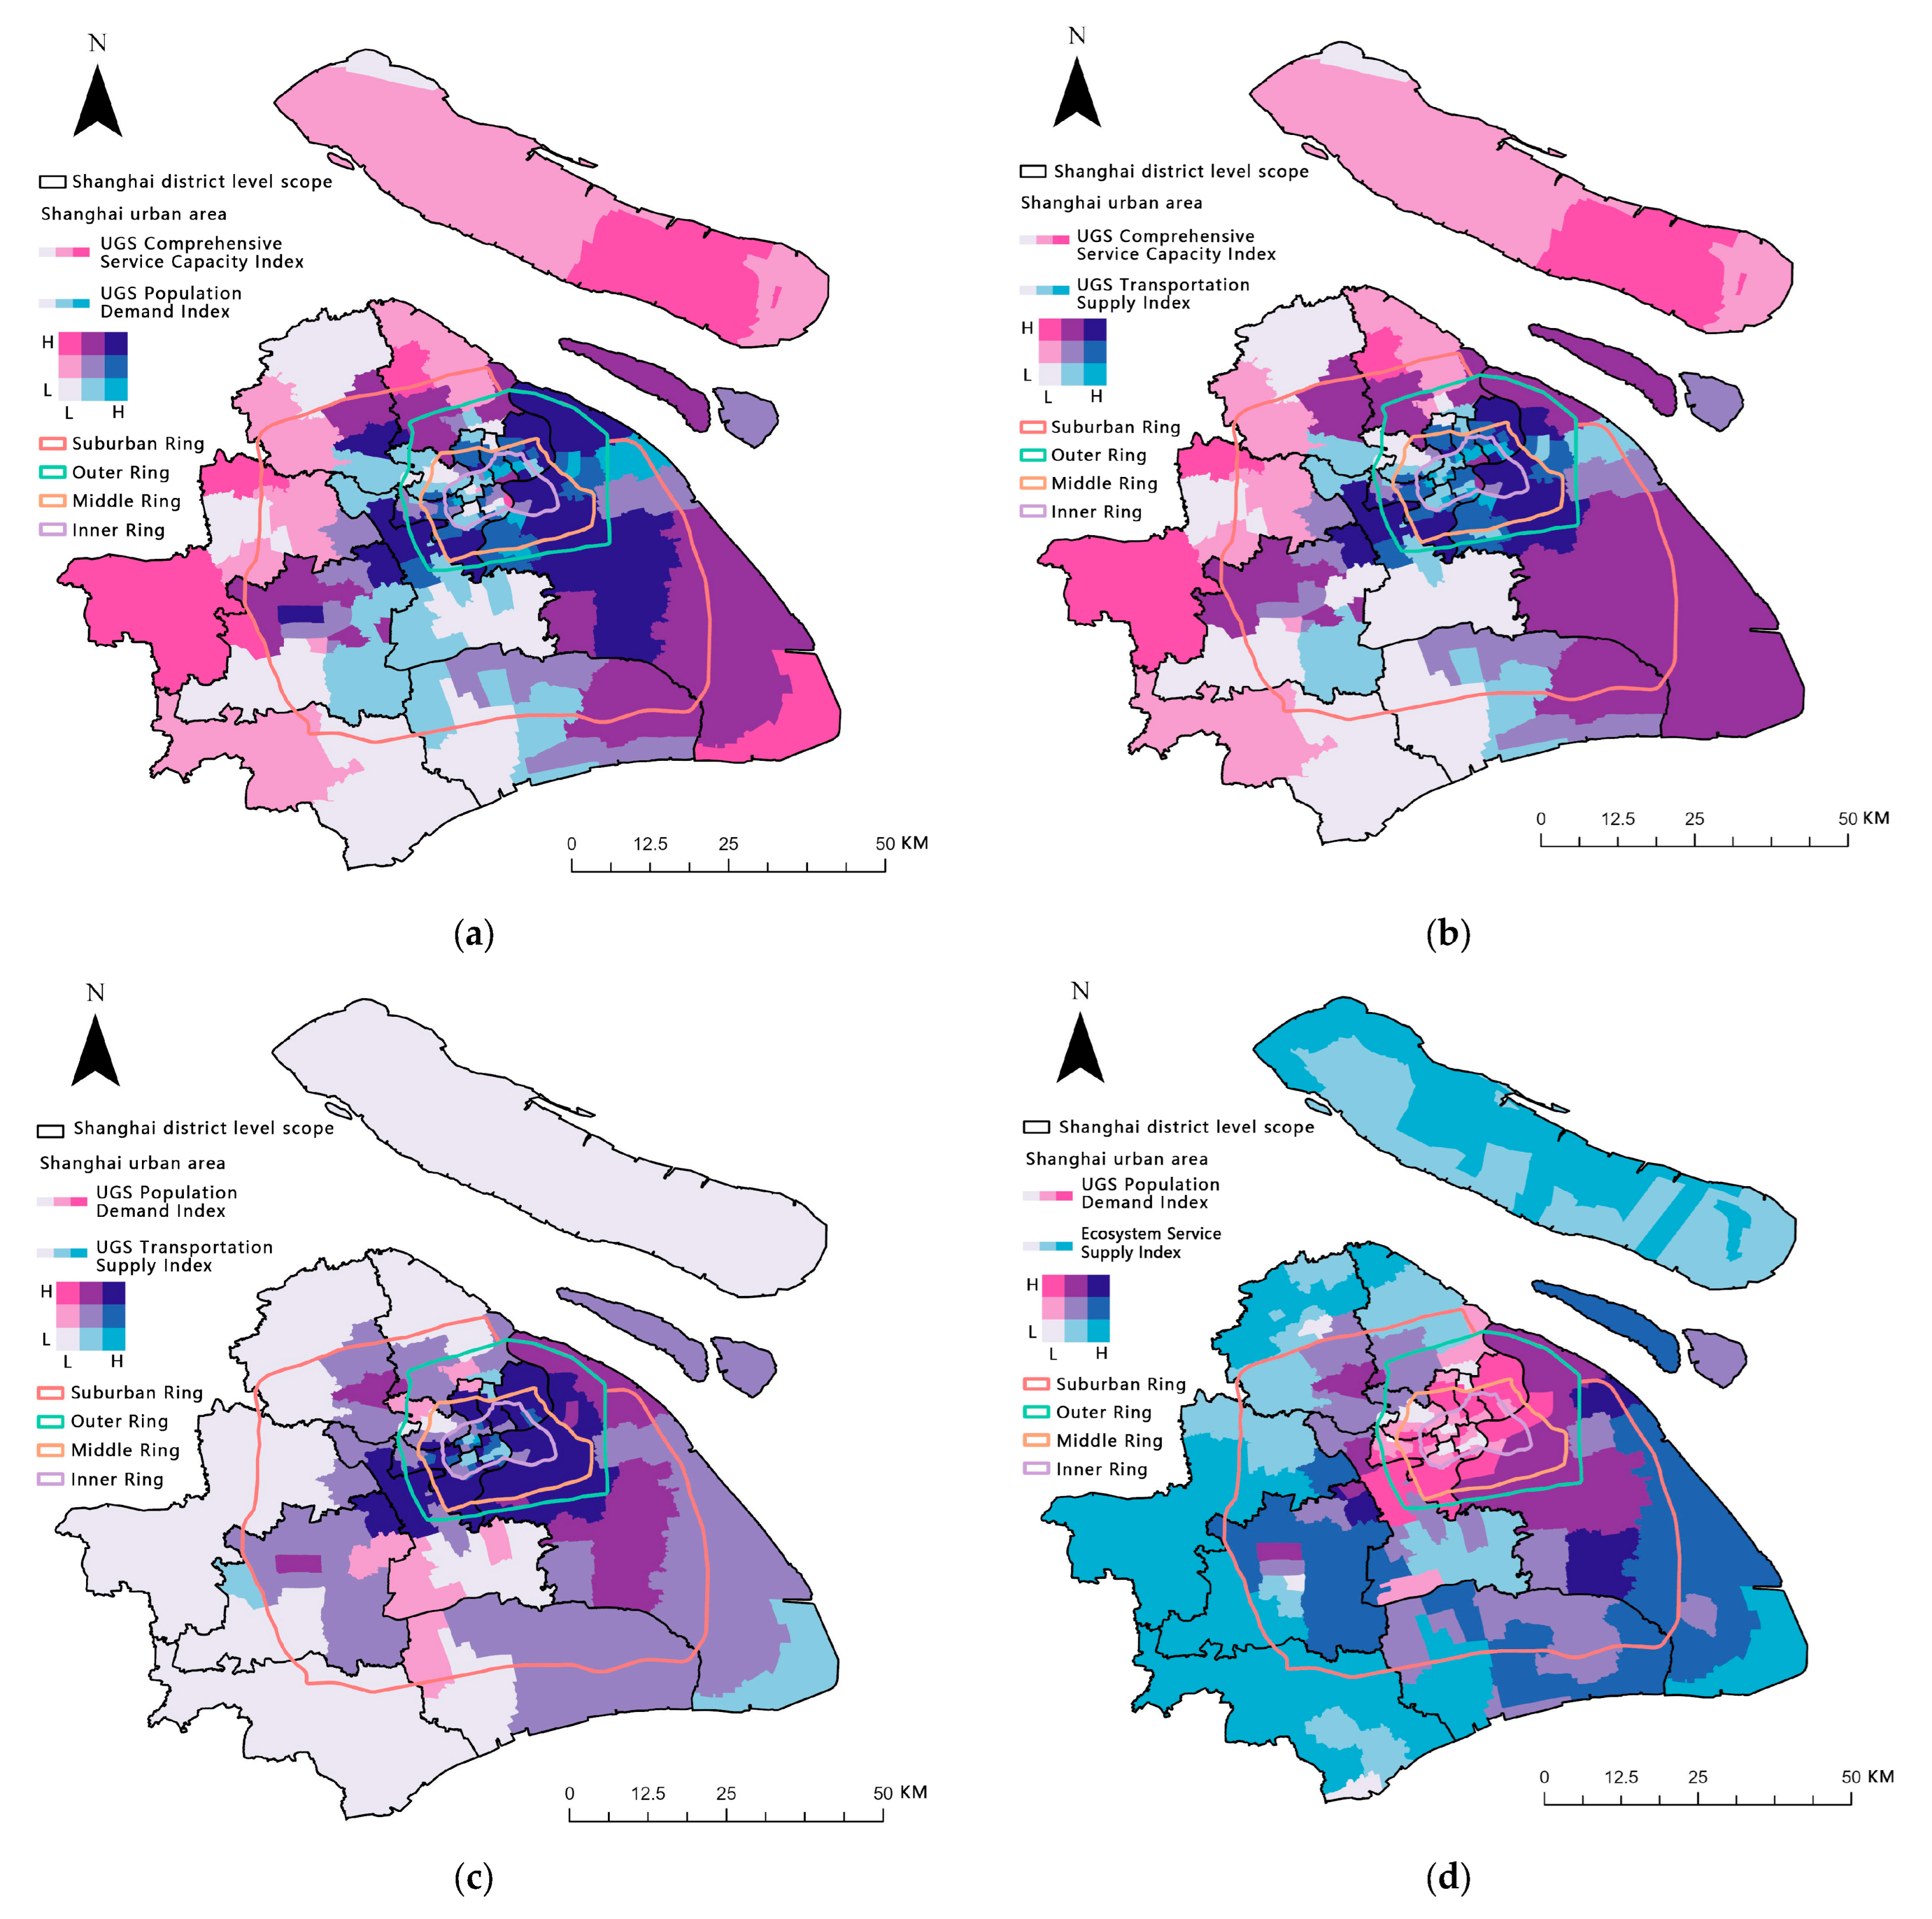
As shown in Figure 3, the diagram illustrates various dimensions of Shanghai’s urban green space services, population demand, and green space functions. The overall image reveals a mismatch in green space resources: high demand but low supply within the inner ring area and low demand but high supply in the outer ring area. Particularly concerning the spatial alignment between population demand and ecosystem service functions, the supply–demand imbalance is most pronounced in the central urban districts. Specifically: Figure 3a shows that core districts within the inner ring, such as Huangpu and Jing’an, possess strong service capacity, while outer ring areas are relatively weaker, exhibiting a decreasing trend from the core to the periphery. Figure 3b indicates that green space service capacity and transportation supply within the inner ring are largely balanced, whereas transportation supply in the outer and suburban rings exhibits pronounced deficiencies. Figure 3c reveals that population demand is high in the inner ring core areas, and there is strong demand for green spaces. However, in some areas, transportation supply capacity fails to keep pace with demand growth, resulting in a clear mismatch of high demand yet low accessibility. Figure 3d reveals that while inner ring areas exhibit high population demand, ecosystem service supply remains inadequate, whereas suburban ring areas like Songjiang and Qingpu, benefiting from high-quality natural endowments, demonstrate significant advantages in ecosystem service supply, thereby creating a marked contrast of abundant supply but low demand.
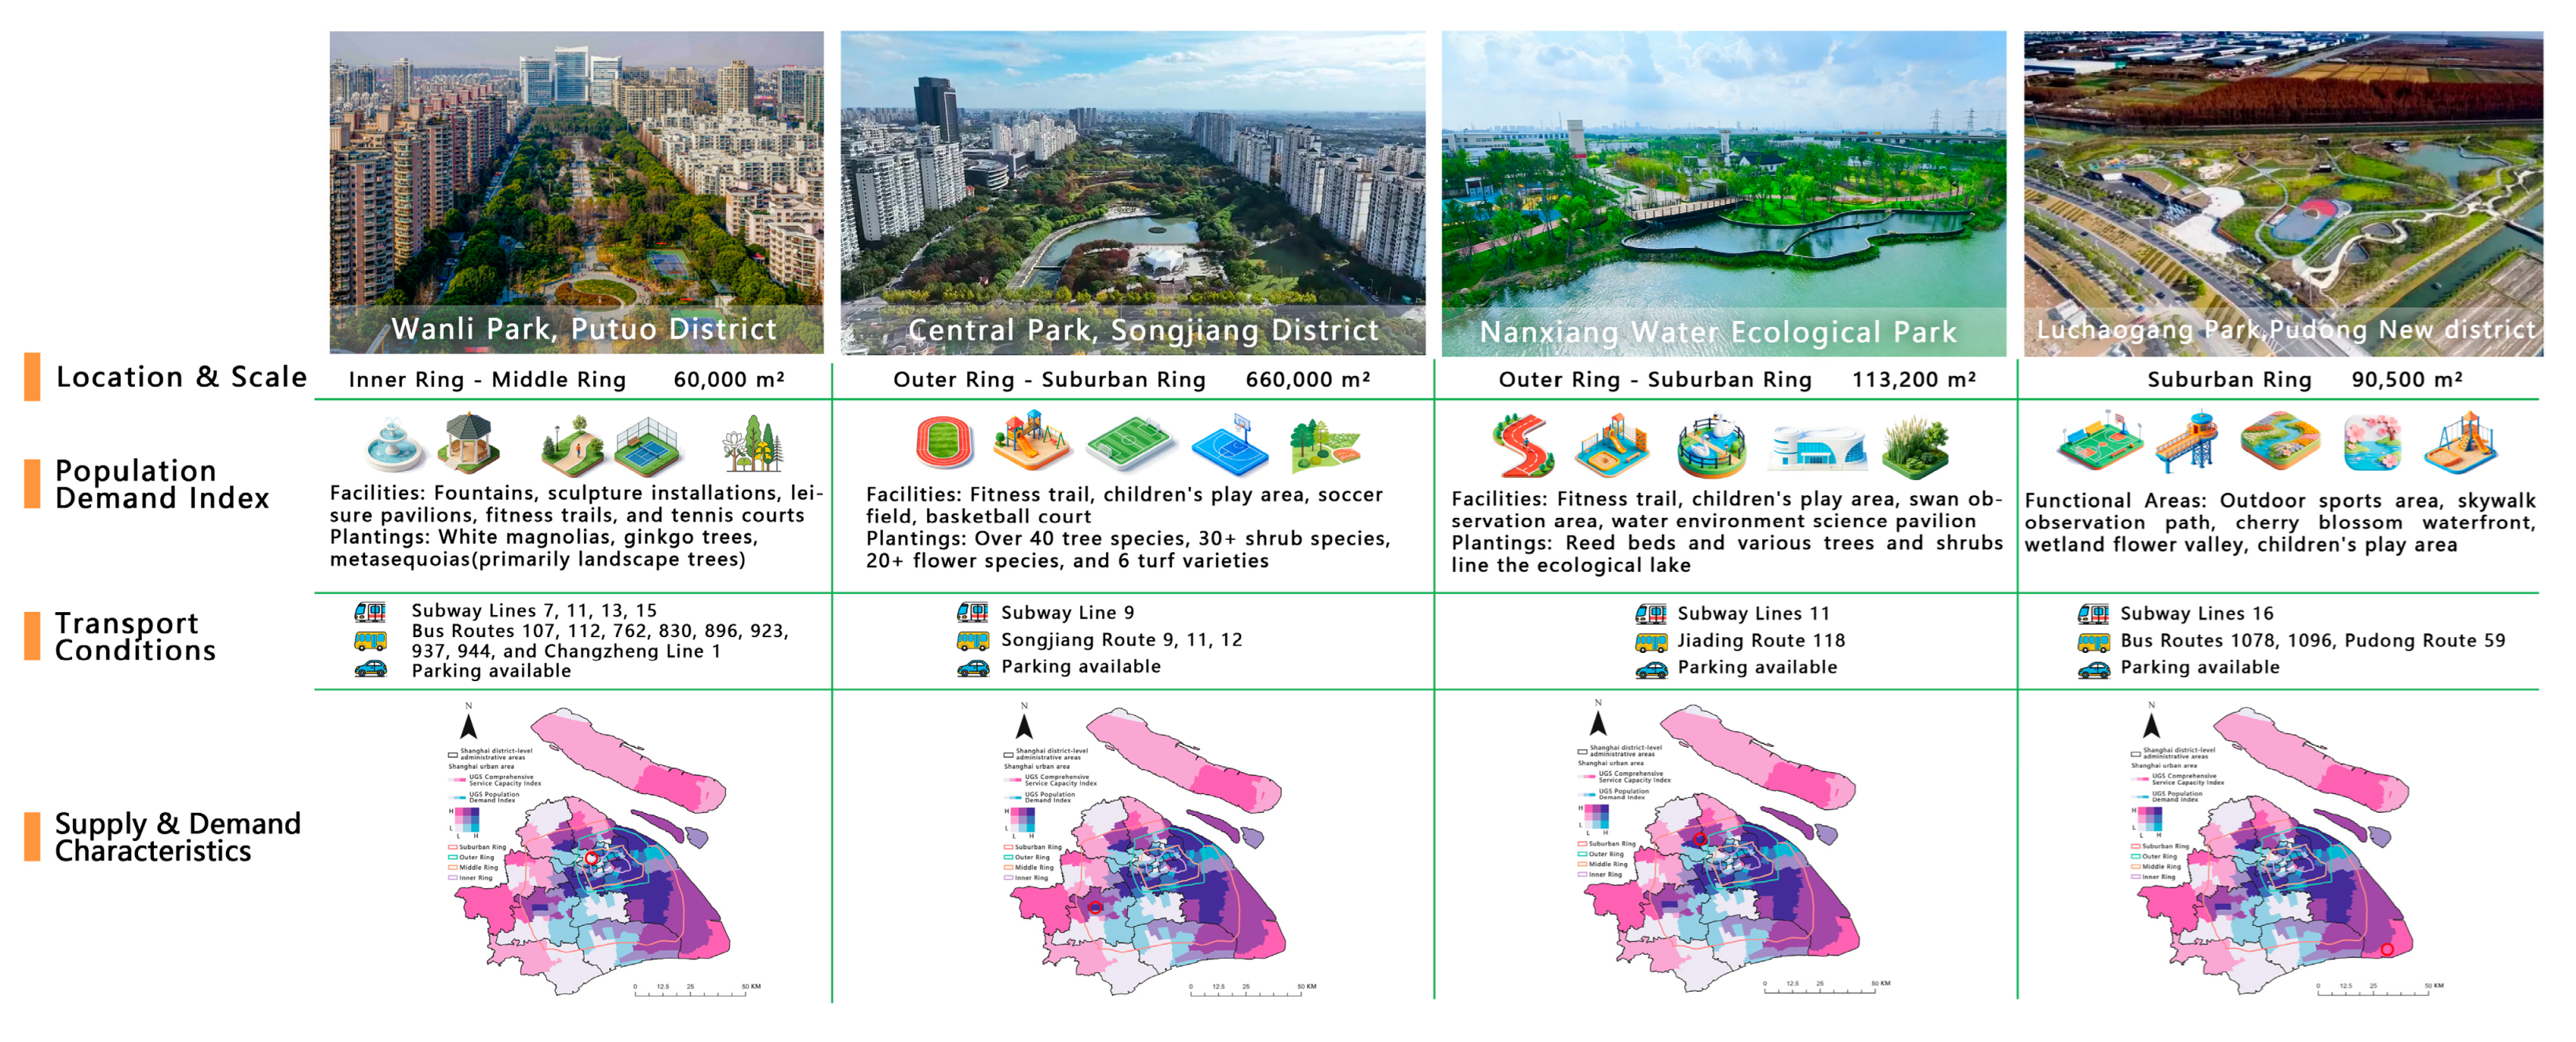
This study selected four representative urban parks in Shanghai to analyze their supply and demand characteristics, revealing significant spatial differentiation and functional specialization (Figure 4), as detailed below.
Wanli Park in Putuo District is located in the central urban area between the inner ring and middle ring. Despite the overall high population density in this area, the population demand index shown in Figure 3 exhibits a light shade, indicating low to medium values. This reflects that the park’s actual recreational demand has not been fully activated, or that existing green spaces in the surrounding area have diverted potential visitors. On the supply side, both the park’s comprehensive service capacity index and ecosystem service supply index register at low to moderate levels. This phenomenon directly correlates with the central urban area’s constrained land resources, the park’s relatively small scale, and its monotonous vegetation structure. These factors collectively result in weak ecological and recreational service supply capabilities. Overall, it exhibits a weak coupling state of low supply and low demand, representing a mismatch of supply and demand characterized by insufficient service efficiency. This occurs because limited supply capacity fails to attract more demand, while unmet demand struggles to drive supply upgrades.
Songjiang Central Park is situated in the core area of Songjiang New Town, between the outer ring and the suburban ring. With the influx of population into the new town, its population demand index remains in the medium-to-high range. The park maintains relatively stable supply capacity and delivers outstanding ecosystem services. Leveraging ample space reserved in the new town’s master plan, its vegetation layout and landscape design excel in both ecological functionality and aesthetic value. While the park currently achieves a fundamental equilibrium between supply and demand, ongoing attention is required to dynamically align the pace of population growth with the green space’s service carrying capacity.
Nanxiang Water Ecological Park is located in Nanxiang Town, Jiading District, situated between the outer ring and the suburban ring. The surrounding area primarily features mixed residential and industrial functions, with a medium-to-high population demand index. The park’s comprehensive service capacity is moderate to high, with its water ecological features enabling good synergy between ecosystem services and recreational offerings. However, inadequate transportation connections significantly limit its service reach, resulting in a structural imbalance where ecological supply is sufficient but service accessibility is insufficient—a case of accessibility-constrained supply–demand mismatch.
Luchaogang Park is situated in the Lingang New Area along the outer suburban ring. Currently exhibiting low population density and a low population demand index, it demonstrates significant potential for demand growth alongside the ongoing development of the Lingang New Area. The park’s ecological supply ranks high, with prominent cultural and aesthetic advantages stemming from its coastal setting. Its comprehensive service capacity is moderate, presenting an overall profile of advanced ecological provision and reserved service capacity. This configuration reserves ample ecological buffer space for future population influx.
In summary, from an overall perspective, the supply–demand match for urban parks in Shanghai exhibits distinct gradient characteristics: The low supply–low demand pattern observed at Wanli Park in Putuo District, a central urban area, reveals that some existing green spaces in central districts suffer from inadequate service efficiency. In the near-suburban new towns, Songjiang Central Park and Nanxiang Water Ecological Park demonstrate a medium demand–ecosystem service synergy transition pattern, with their supply–demand matching status mainly influenced by two key factors: the pace of population inflow and transportation accessibility. In the far-suburban Lingang area, Luchaogang Park demonstrates a low demand–ecologically pre-allocated reserve characteristic. The abundant ecosystem service supply provides critical ecological support for the future development of the Lingang New Area, reflecting the forward-looking nature of strategic urban spatial planning.

4.2. Analysis of Attractiveness Characteristics of Urban Green Spaces at Different Levels in Shanghai

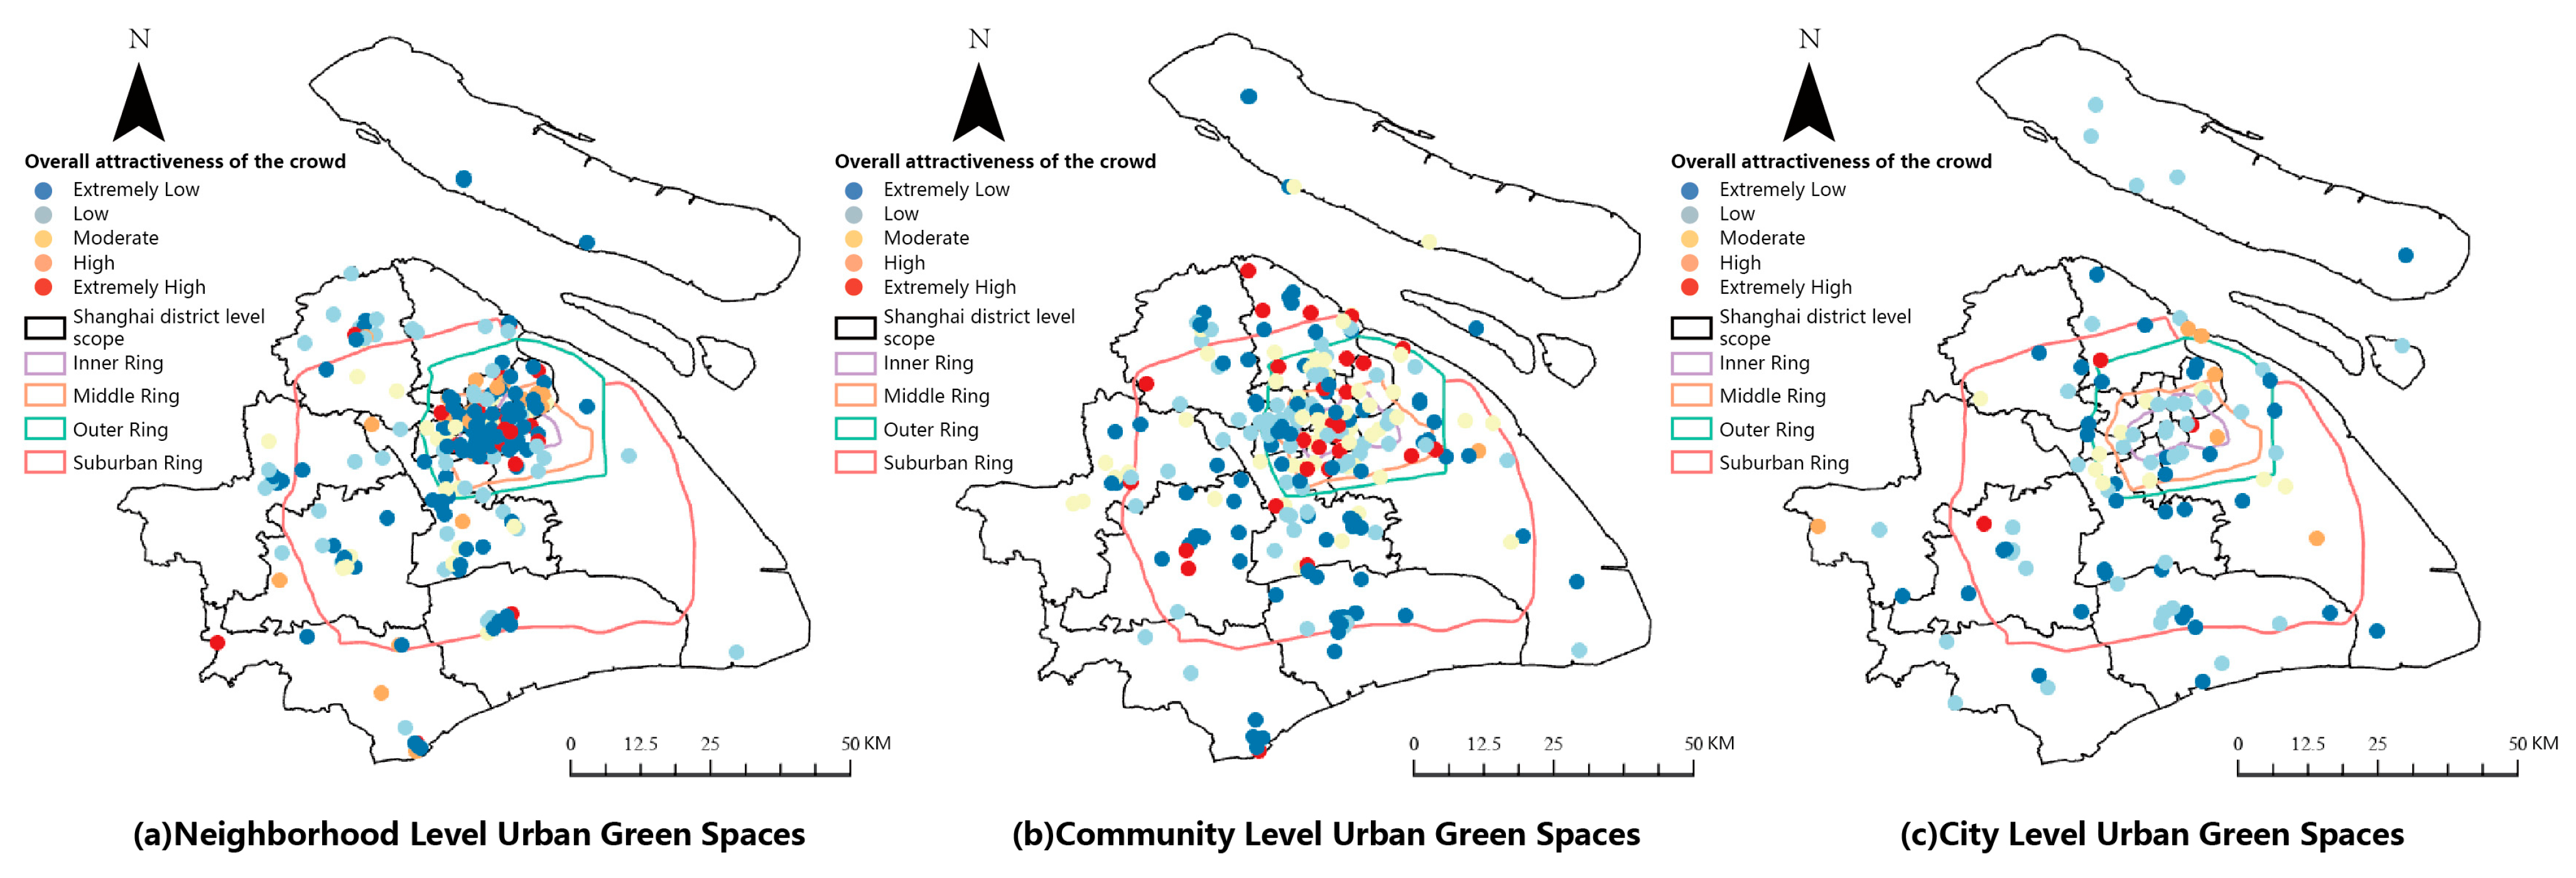
From the perspective of spatial distribution characteristics (Figure 5), the comprehensive attractiveness of urban green spaces across different tiers in Shanghai exhibits a pattern of gradual diffusion from the core to the periphery. Neighborhood-level urban green spaces demonstrate highly concentrated attractiveness within the inner ring, particularly in core urban districts such as Huangpu and Xuhui, while areas within the outer ring and suburban ring generally maintain low to moderate attractiveness levels. This overall configuration reveals a pronounced single-core concentration pattern. At the community-level urban green space scale, high-attraction areas began extending toward the middle ring zone. Scattered points of extremely high attraction emerged in areas near the middle ring, such as Putuo District and Minhang District. However, most areas within the outer ring and beyond still showed no significant increase in attraction. When green space classification is elevated to the citywide level, the coverage of attractiveness further expands to the outer ring and even suburban ring areas. Multiple highly attractive points also emerge in peripheral districts like Baoshan and Fengxian, collectively forming a spatially dispersed multi-node pattern.
From the perspective of differences in ring zone scope, the attractiveness of green spaces across various tiers exhibits significant divergence across each ring zone. The inner ring zone maintains high or extremely high attractiveness levels for all three tiers of green spaces, serving as the core advantage area for all types. Attractiveness in the middle ring zone increases with green space tier: neighborhood-level spaces predominantly offer medium–high attractiveness, while community-level and city-level spaces reach high or extremely high levels. The outer ring exhibits more pronounced changes: neighborhood-level green spaces show only low-to-moderate appeal, rising to moderate-to-high at the community level, and reaching high or extremely high at the city level. The suburban ring’s appeal deficit requires higher-grade green spaces to compensate, with only city-level green spaces elevating its appeal to moderate-to-high levels. At the neighborhood and community levels, its appeal generally remains low or low-to-moderate.
From the perspective of the correlation between green space tiers and attractiveness, as green spaces upgrade from neighborhood-level to city-level, the spatial coverage of their attractiveness expands progressively from the inner ring to the suburban ring, while the distribution of high-attractiveness areas gradually shifts from a concentrated pattern in the urban core to a more dispersed pattern toward peripheral areas. Meanwhile, the higher the green space level, the more significant its role in enhancing attractiveness in urban peripheral areas. City-level green spaces effectively compensate for the insufficient attractiveness of lower-level green spaces in peripheral zones, serving as key carriers for attracting populations to these areas. In contrast, lower-level green spaces primarily focus on strengthening localized attractiveness within the urban core, thereby meeting residents’ demand for nearby recreational opportunities.

4.3. Assessing the Distribution Characteristics of Different Levels of UGS by 2030

The current comprehensive capacity of Shanghai’s UGS exhibits a tiered differentiation: city-level green spaces possess higher comprehensive capacity but are limited in number; community-level green spaces maintain moderate comprehensive capacity and serve as the primary coverage for the population; neighborhood-level green spaces demonstrate relatively low comprehensive capacity and are predominantly characterized by small-scale, dispersed layouts. These patterns align closely with the common development characteristics observed in green spaces across international megacities [69].
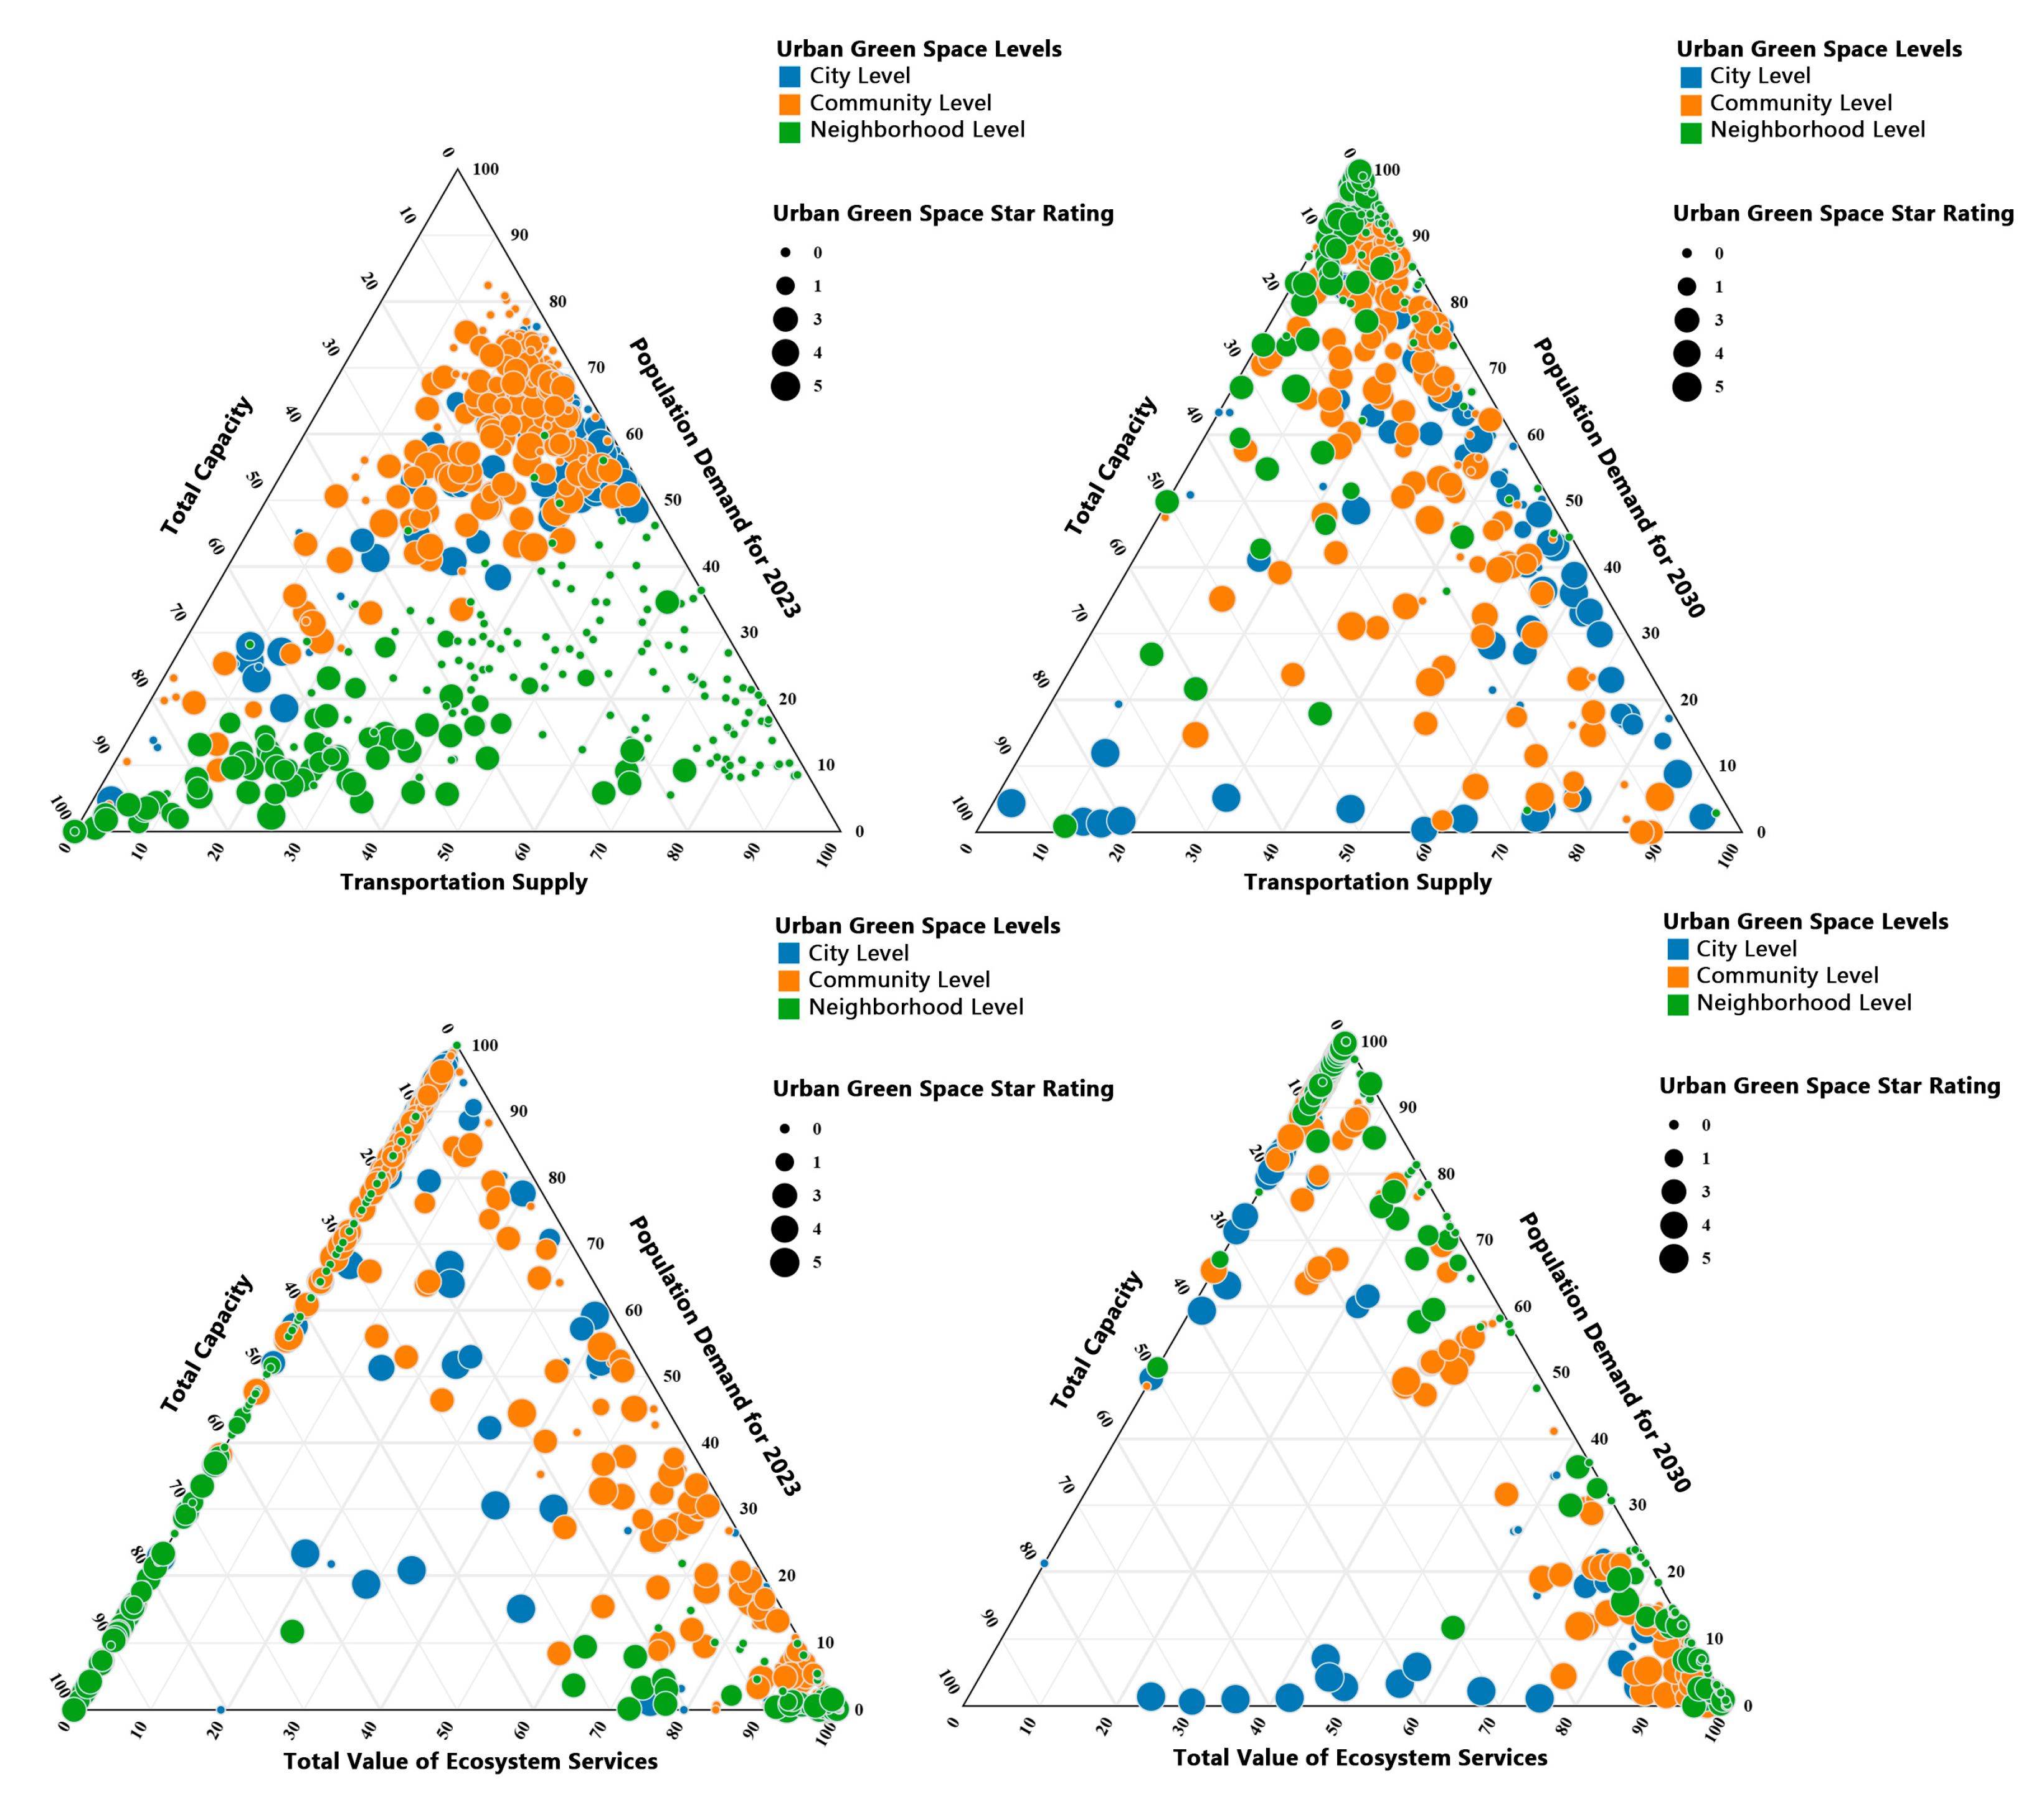
As shown in Figure 6, between 2023 and 2030, green spaces of different levels in Shanghai exhibit significant evolutionary characteristics in terms of spatial distribution, ecosystem service capacity, supply–demand matching, and functional structure. During this development process, green spaces at different levels demonstrate differentiated development trends as well as distinct existing issues.
For neighborhood-level green spaces, the distribution pattern in 2023 was mainly characterized by high comprehensive capacity (60–100%) and moderate transportation supply levels (20–60%), with overall service capacity and coverage remaining relatively limited. With the continuous advancement of urban renewal and residential development, the layout of neighborhood-level green spaces has gradually extended toward areas with high population density and strong ecological demand, with service supply becoming more aligned with residents’ daily needs for recreation, leisure, fitness, and nearby use. By 2030, the corresponding population demand level of neighborhood-level green spaces is projected to cover the full range of 0–100%, and service coverage is expected to expand significantly compared with previous conditions, showing notable progress in meeting residents’ demand for nearby green spaces. However, in terms of overall construction scale, per capita service level, and comprehensive service efficiency, neighborhood-level green spaces still face challenges such as insufficient total supply, uneven spatial distribution, and the need for improved service quality, making it difficult to fully match the continuously growing population demand and residents’ increasing expectations for high-quality living environments.
By 2030, community-level green spaces are expected to exhibit clear characteristics of functional upgrading and quality improvement, with the ecosystem service range further expanding to 50–90% compared with previous levels. Service functions become more diversified, while ecological benefits, recreational value, and social benefits are simultaneously enhanced. Correspondingly, the population demand range increases from 50–80% to 60–95%, indicating that community-level green spaces achieve effective expansion in service coverage and population reach, with simultaneous improvements in service level and overall performance, thereby playing an increasingly important supporting role in building community living circles, improving residential environmental quality, and enhancing residents’ well-being. However, in some areas, transportation supply levels remain relatively low at only 10–40%. Issues such as insufficient accessibility to green spaces, weak transportation connections, and incomplete slow-mobility systems remain prominent, which to some extent constrain the full realization of green space service efficiency and become key bottlenecks limiting functional performance.
By 2030, city-level green spaces are expected to achieve a significant increase in total ecosystem service value, with a more optimized ecological structure and enhanced comprehensive ecological benefits, landscape value, and social service functions, thereby occupying an important position in the urban ecological security pattern and green space system. However, the corresponding population demand proportion remains mainly concentrated within the 0–40% range, indicating a relatively low spatial coupling with areas of high population density and high service demand and reflecting a certain mismatch between green space services and population distribution. The overall spatial layout still shows a certain degree of dispersion, and substantial room for improvement remains in terms of service balance, spatial equity, and supply–demand matching. Therefore, future urban green space system planning needs to further strengthen spatial layout regulation and service enhancement.

5. Discussion

5.1. An In-Depth Analysis of the Underlying Causes of Supply–Demand Matching Characteristics in Shanghai’s Green Space Resources

The mismatched pattern within Shanghai’s inner ring—characterized by high demand and low supply—and the outer ring’s low demand and high supply stems from the long-term interplay of multiple factors. These include core elements such as land use prioritization during urbanization, historical planning legacies, and the asynchrony between population growth and spatial expansion, alongside natural endowments and planning directives.
(1)
The inherent constraints of the evolutionary logic of urbanization. The development of Shanghai’s central urban area originated within the inner ring. During the early industrialization phase, industrial layout and population concentration were the core priorities for land use, squeezing out ecological space and forming a pattern that prioritized production over ecology. As urbanization deepens, population density within the inner ring increases and urban functions become concentrated. With limited scope for renovating existing green spaces and constraints on new green areas due to high land costs and difficulties in relocation, the growth of ecosystem service supply lags behind the expansion of demand [70]. In highly market-oriented urban core areas, the reallocation of land resources often faces extremely high opportunity costs and transaction costs [71]. Due to the extremely high land value in the inner ring area of Shanghai, the addition or expansion of green spaces typically involves complex processes such as land acquisition, functional replacement, and property rights negotiations, which means that even when planning objectives are clearly defined, implementation is often hindered by excessively high costs. In addition, the existing property rights structure further reduces the financial attractiveness of high-quality redevelopment projects for district-level governments and market entities [72]; property ownership is fragmented among multiple stakeholders, and the institutional costs associated with coordinating property rights further constrain the contiguous provision of green spaces. The outer ring and suburban ring areas were developed later, featuring low land use intensity and preserving a sound natural ecological foundation. Designated as ecological reserve zones, they offer ample green space supply. However, their distance from core functional zones and low population density have led to relative oversupply—essentially reflecting a mismatch between population growth and spatial expansion.
(2)
The phased orientation of planning policies and historical legacy issues has further entrenched this mismatch. Early green space planning focused solely on ecological conservation, disconnecting from population distribution patterns—a problem difficult to swiftly reverse. Although the Shanghai Ecological Space Special Plan (2021–2035) explicitly sets a “500 m accessibility” target, spatial constraints in central urban areas [73] and issues such as sparse distribution and small scale of neighborhood-level green spaces [74] persist. In addition, city-level green spaces are predominantly located in suburban areas, further widening disparities in green space accessibility across different regions. Meanwhile, the planning shortcoming of emphasizing construction over operation has led to problems in some outer ring green spaces, such as inadequate facility maintenance and insufficient transportation connections. As a result, even with sufficient ecological supply capacity, their service effectiveness is difficult to fully realize.
(3)
Spatial differentiation in population and socioeconomic development serves as the core driving factor. The inner and middle rings concentrate high-quality public services and employment opportunities, attracting dense populations. Young families and working professionals exhibit strong demand for premium green space services, yet the area predominantly features small pocket parks or outdated green spaces whose scale, functionality, and facilities fall short of meeting these needs. The outer and suburban rings exhibit lower population density and weaker demand intensity, resulting in a more pronounced supply–demand disparity. Songjiang Central Park, with its 660,000-square-meter footprint, composite spatial structure, convenient transportation, and round-the-clock operation, serves the needs of 200,000 permanent residents. This demonstrates that scale, functionality, accessibility, and management are key factors in adapting large-scale parks. In contrast, Putuo District’s Wanli Park, with its mere 6-hectare space, single-function design, and operational shortcomings, highlights the core requirements for small-scale green spaces: spatial efficiency, functional diversity, and robust operational support.
(4)
The spatial heterogeneity of ecological foundations further intensifies the pattern of supply–demand differentiation. The suburban ring boasts premium resources like the Sheshan Ecological Belt and Dianshan Lake, endowed with significant ecosystem service advantages. In contrast, the central urban area has suffered from long-term human intervention, resulting in inherently deficient ecosystem service capacity. Even with newly added green spaces, their effectiveness struggles to match that of the suburban ring. This disparity, compounded by the scale and functional constraints of different green space types, ultimately creates a dual mismatch: “high demand but low supply efficiency in the inner ring, and ample supply but weak demand intensity in the outer ring.” The four major parks selected above provide micro-level empirical evidence for interpreting this mismatched pattern.

5.2. Mechanistic Explanation of Attractiveness and Accessibility Characteristics of UGS at Different Levels

The spatial patterns of green space attraction—characterized by core concentration at lower levels and peripheral diffusion at higher levels—stem fundamentally from the combined effects of green space attributes, transportation accessibility, and resident travel preferences [75,76]. The hierarchical structure—manifesting as single-core concentration at the neighborhood level, middle-ring extension at the community level, and multi-node dispersion at the city level—is closely linked to differences in service radius, functional complexity, and travel costs across these tiers:
(1)
Neighborhood-level green spaces operate within a 7.5 min walking radius, focusing on daily, nearby recreation with infrastructure as their primary function. The inner ring core area features dense populations and a well-developed pedestrian network, resulting in highly efficient green space coverage, comprehensive facilities, and concentrated attractiveness. In contrast, the outer and suburban rings exhibit sparse populations and insufficient road density, leading to scattered green space distribution, rudimentary facilities, limited walkability, and generally low attractiveness, forming a single-core pattern.
(2)
Community-level green space service radius expanded to a 15 min walk or 20 min public transit threshold, integrating multifunctional services such as sports fitness and cultural activities. The middle ring, serving as a transitional zone between the central city and outer areas, features moderate population density and a well-developed transportation network, keeping residents’ travel costs manageable. Some green spaces have been upgraded into regional leisure hubs, extending the city’s appeal into the middle ring. The outer ring, however, still maintains a low-to-medium level of appeal due to insufficient public transportation coverage and higher travel costs.
(3)
City-level green spaces are accessible within a 30 min walk or 40 min public transit threshold, combining scarce ecological resources with diverse service functions to generate significant cross-regional appeal. As rail transit extends into suburban areas, city-level green spaces in the outer ring reduce travel costs through transit connections. Coupled with the uniqueness of premium natural landscapes, this creates a dispersed multi-node pattern.
Current accessibility and alignment with population demand exhibit significant shortcomings: Low-level green spaces are characterized by proximity but insufficient capacity. While neighborhood-level and community-level green spaces offer nearby accessibility, their limited overall capacity means their facility provision and ecosystem service levels struggle to match the robust population demand in core areas. Higher-level green spaces, however, are abundant but distant. While city-level green spaces have strong supply capacity, their scattered distribution and inadequate transportation connections make it difficult to fully meet residents’ cross-regional usage needs. In the 2030 scenario, the core drivers for improved adaptability stem from increased green space capacity and optimized layout. Community-level green spaces will upgrade toward higher capacity and enhanced ecosystem service levels, neighborhood-level green spaces will expand their coverage, and city-level green spaces will focus on improving transportation accessibility. This will ultimately form a spatially complementary hierarchical structure. Furthermore, residents’ travel preferences will intensify spatial differentiation. Older adults and low-income groups will increasingly favor walkable neighborhood-level green spaces, reinforcing the concentration of core areas [77]. Meanwhile, younger adults and high-income groups will be willing to incur travel costs for high-quality green services, extending the appeal of community-level and city-level green spaces outward. This will further solidify the pattern of central concentration and peripheral expansion.
From the perspective of green space hierarchy in global megacities, the green space system of London is centered on the Green Belt, forming an ecological barrier through peri-urban open spaces. However, the Green Belt policy has long focused primarily on controlling urban sprawl, resulting in fragmented layouts of community- and neighborhood-level green spaces and weak connectivity between the Green Belt and internal urban green spaces, showing a pattern of concentrated large green spaces in the periphery and scattered small green spaces within the city [78]. In contrast, New York is centered on city-level landmark green spaces and a network of community parks. While the ecological and recreational functions of city-level green spaces are well integrated, the distribution of green spaces shows significant inequality [79]. Both London and New York share a common issue of emphasizing core landmark green spaces while underdeveloping grassroots green space networks.
In comparison, the uniqueness of Shanghai lies in two aspects. First, it explicitly constructs a three-tier linkage system of city-level, community-level and neighborhood-level green spaces, rather than relying solely on single-point control or landmark-based models, and incorporates 500 m accessibility into statutory planning, thereby strengthening the service function of grassroots green spaces. Second, under the SSP1-2.6 scenario, it forms a supply framework characterized by city-level dominance, community-level support, and neighborhood-level supplementation, breaking through the limitations of London’s protection-oriented but service-limited model and New York’s core-focused but grassroots-weak pattern, thus achieving an upgrade from spatial distribution to functional coordination.
The Shanghai model provides valuable reference for global megacities: green space planning should balance ecological protection and residents’ needs rather than following a single development orientation; it should strengthen the linkage and connectivity among green spaces of different hierarchical levels; and statutory planning should explicitly define grassroots green space supply standards to alleviate supply–demand imbalances in core urban areas and insufficient accessibility in suburban areas. This also aligns with the emerging trend of transforming London’s Green Belt toward multifunctionality.

5.3. The Significance of Green Space Ecosystem Service Supply Evolution Under the SSP1-2.6 Scenario by 2030

Under the SSP1-2.6 scenario for 2030, the evolution of Shanghai’s green space ecosystem service supply reflects synergistic effects achieved through land use optimization guided by sustainable development principles, alongside coordinated advancement of ecological conservation and urban development. This holds significant importance for building ecologically livable cities, achieving carbon peak targets, and enhancing residents’ well-being. A tiered ecosystem service supply framework—dominated at the city level, supported at the community level, and supplemented at the neighborhood level—is gradually taking shape. Its rationality and core values are particularly evident in the practice of sustainable development goals.
The SSP1-2.6 scenario represents an ideal pathway balancing sustainable development and low-carbon emissions. Based on this scenario, this study conducted simulation analyses of green space ecosystem services in Shanghai. However, in real-world development, various uncertainties—such as lower-than-expected policy implementation effectiveness and population growth exceeding planning projections—may affect the practical applicability of the findings. Therefore, building on existing climate scenario research, this study further supplements the analysis by examining changes in land use and ecosystem services under the SSP2-4.5 medium-development scenario [80]. The results indicate that under SSP2-4.5, increased urban land development intensity and expansion of construction land will further encroach on green space, significantly slowing the growth of ecosystem service supply. Meanwhile, continued population concentration will further increase urban green space demand, intensifying the contradiction of high demand and low supply within the inner ring and exacerbating supply–demand spatial mismatches in outer ring areas.
In terms of spatial patterns, the overall attractiveness pattern of green spaces of different hierarchical levels does not fundamentally change, but disparities in attractiveness among different urban rings continue to widen. Service pressure on community- and neighborhood-level green spaces increases significantly, while city-level green spaces exhibit more pronounced accessibility limitations due to dispersed layouts and insufficient transportation connectivity. Nevertheless, the green space ecosystem service supply framework proposed in this study—characterized by city-level dominance, community-level support, and neighborhood-level supplementation—remains valid under SSP2-4.5, requiring only strengthened implementation measures, such as accelerating the provision of neighborhood-level green spaces in core urban areas and enhancing the functions and facilities of community-level green spaces. Overall, the core conclusions of this study demonstrate strong robustness: even when the development scenario shifts from the ideal SSP1-2.6 to the moderate SSP2-4.5, the fundamental understanding of green space supply–demand characteristics and spatial patterns remains unchanged, with only flexible adjustments needed in planning implementation strategies across scenarios.
From the perspective of spatial adaptability, this model overcomes the fragmentation of traditional green space ecosystem services, achieving a transition toward structured and networked provision. It enhances ecosystem stability and service efficiency, precisely aligning with core demands for carbon peaking and ecological livability, thereby demonstrating significant dual ecological and social value. Ecologically, city-level green spaces reinforce regional ecological barriers and carbon sink functions, community-level green spaces bridge ecological gaps and transmit ecological benefits, while neighborhood-level green spaces ensure universal service access. Together, they form a comprehensive system of ecosystem services covering the entire area. Socially, differentiated functional configurations create a service network aligned with residents’ daily life radii, enhancing living satisfaction and well-being.
Enhancing the alignment between green space ecosystem service supply and population demand offers an effective pathway to alleviate urban ills and support the optimization of the spatial structure encompassing the main urban area and five new towns. Neighborhood-level green spaces in the core area should be optimized to cover high-density population zones, consolidating the accessibility of recreational green spaces and alleviating the imbalance between ecosystem service supply and demand. Community-level green spaces in the five new cities should be densely distributed to accommodate population influx, enhancing livability appeal while reducing pressure on city-level green spaces. This approach will foster a spatial development pattern characterized by the revitalization of the main urban area and the rise of new cities.
The synergistic evolution of green spaces across different tiers provides quantitative support and spatial pathways for achieving carbon peak and carbon neutrality goals. Under the SSP1-2.6 scenario, this framework establishes a multi-tiered, comprehensive carbon sink spatial system: city-level green spaces enhance carbon storage functions, becoming regional carbon sink cores; community- and neighborhood-level green spaces fill carbon sink gaps in built-up areas, boosting overall carbon sink efficiency. Concurrently, upgraded ecosystem services indirectly drive energy structure optimization and foster low-carbon lifestyles. Through dual-engine propulsion—enhanced carbon sinks and low-carbon guidance—this approach provides comprehensive support for achieving carbon peak targets.

6. Conclusions

Guided by the SSP1-2.6 scenario, this study systematically investigates the supply levels, accessibility characteristics, and supply–demand matching relationships of urban green space ecosystem services in Shanghai by integrating the PLUS model, InVEST model, and nSFCA method. This research provides scientific basis for optimizing urban green space planning. Findings reveal a significant mismatch in Shanghai’s green space resources: high demand but low supply within the inner ring and low demand but high supply in the outer ring. The contradiction between population concentration in central urban areas and insufficient ecosystem service supply is particularly pronounced. Meanwhile, the suburban ring area possesses superior ecological endowments but exhibits weaker demand intensity. The attractiveness of green spaces at different hierarchical levels follows a spatial pattern of core concentration and peripheral diffusion. Neighborhood-level green spaces cluster around the inner ring core, forming a single-core pattern. Community-level green spaces extend toward the middle ring, while city-level green spaces are distributed across the entire city in a multi-node, dispersed pattern. These differences are closely related to hierarchical variations in service radius, functional complexity, and travel costs.
The 2030 scenario simulation indicates that Shanghai’s green space ecosystem services will form a coordinated framework characterized by city-level dominance, community-level support, and neighborhood-level supplementation. Neighborhood-level green space coverage will continue to expand, community-level green spaces will undergo functional upgrades and capacity enhancements, and the total value of city-level green space ecosystem services will significantly increase. Together, these three tiers will progressively improve the alignment between ecosystem service supply and population demand. However, it should be noted that accessibility gaps persist: low-grade green spaces are often nearby but insufficient, while high-grade green spaces are sufficient but not easily accessible. Transportation connections and facility configurations in some areas still require optimization.
From the perspective of driving mechanisms, the mismatch between green space supply and demand, along with divergent attractiveness, stems from core factors such as urbanization processes, planning policy orientations, and the asynchrony between population growth and spatial expansion. These are the result of long-term interplay among multiple factors, including natural endowments and planning directives. Comparative case studies of Songjiang Central Park and Putuo District’s Wanli Park further validate the critical impact of green space scale, functional configuration, transportation accessibility, and operational management on supply–demand alignment. The multidimensional, multi-tiered green space supply assessment framework developed in this study effectively integrates ecosystem service supply and accessibility factors, offering a novel technical pathway for green space planning in megacities. Moving forward, Shanghai must continuously optimize green space layouts, enhance functional coordination and transportation connectivity among green spaces at different tiers, prioritize addressing neighborhood-level green space supply gaps in central urban areas, and simultaneously boost the demand–absorption capacity of green spaces in suburban ring zones. This integrated approach will ultimately advance the synergistic development of an ecologically livable city and carbon peak goals.
Although this study has achieved certain results in terms of methodological coupling, dimensional coverage, and scenario simulation, shortcomings remain. First, the InVEST model has inherent limitations in fine-scale assessment, including coarse land-use representation and parameter generalization, and it has limited capability in characterizing cultural and recreational services. Second, demand-side factors have not adequately addressed population-specific needs or temporal fluctuations in demand [81], and uncertainties in population projections may influence future supply–demand matching results; overestimation of population size may lead to misjudgment of insufficient supply in certain areas, whereas underestimation may conceal actual supply gaps. Third, transportation network simulations did not sufficiently account for variations in travel efficiency or emerging mobility modes, such as shared bicycles and electric scooters [82,83]. These modes may improve green space accessibility in peripheral areas but may also increase congestion and safety risks in urban core areas, potentially affecting the accuracy of overall supply–demand matching assessments. In addition, refined characteristics of public transportation are not fully captured. Future research could integrate mobile signaling and travel platform data for dynamic assessment to better reflect real-time travel behavior and green space use patterns [84]. Furthermore, future scenario simulations rely on rule-based and parameter-driven settings in the PLUS and InVEST models, limiting their ability to capture resident behavioral heterogeneity and the dynamic impacts of unexpected events (e.g., policy changes or extreme weather) on land use and ecosystem services. Future studies could incorporate agent-based models (ABM) to simulate individual decision-making, including interactions among residents’ travel preferences, developers’ land-use choices, and government planning interventions, thereby improving micro-level realism and robustness. Previous studies have identified related single-factor mechanisms through empirical or case studies, such as demand heterogeneity, the influence of emerging transport modes on spatial accessibility, and the potential of mobile data-based dynamic assessment. By developing a three-dimensional coupling framework integrating ecological supply, population demand, and transportation accessibility, and coupling the PLUS, InVEST, and nSFCA models, this study enables dynamic scenario simulation of green space supply–demand adaptation in megacities and enhances multi-factor integrated analysis and scenario prediction capacity.

Supplementary Materials

The following supporting information can be downloaded at: https://www.mdpi.com/article/10.3390/su18052195/s1, Table S1: Participation in the MaxEnt modeling factor; Table S2: Selection basis for supply services in urban green ecosystem; Table S3: Carbon density of carbon pools in Shanghai (t/ha); Table S4: Biophysical table using water yield (Shanghai); Table S5: P value and C value of different land use types in the USLE models (Shanghai); Table S6: Habitat suitability and habitat sensitivity to threats (Shanghai); Table S7: Weights and effective distances of degradation sources (Shanghai) [85,86,87,88,89,90,91,92].

Author Contributions

Conceptualization, J.H.; methodology, J.H. and S.C.; software, S.C. and C.S.; writing—original draft preparation, J.H. and C.S.; writing—review and editing, S.C. and M.Y.; visualization, H.C.; supervision, Z.D.; funding acquisition, Z.D. All authors have read and agreed to the published version of the manuscript.

Funding

This research work was supported by the Special Funding Project of the China Agricultural and Forestry University Design Art Alliance under Grant No. 111900050.

Institutional Review Board Statement

Not applicable.

Informed Consent Statement

Not applicable.

Data Availability Statement

The original contributions presented in this study are included in the article. Further inquiries can be directed to the corresponding author.

Conflicts of Interest

The authors declare no conflicts of interest.

References

  1. Gao, K. Research on Green Space Ecosystem Services under the Guidance of Healthy City Orientation. Int. J. Soc. Sci. Public Adm. 2024, 2, 445–455. [Google Scholar] [CrossRef]
  2. Zhao, L. Environmental ecosystem services assessment based on urban green infrastructure structure indicators with case study in Shanghai. In Proceedings of the E3S Web of Conferences; EDP Sciences: Les Ulis, France, 2019; p. 03003. [Google Scholar]
  3. Goodwin, S.; Olazabal, M.; Castro, A.J.; Pascual, U. Global mapping of urban nature-based solutions for climate change adaptation. Nat. Sustain. 2023, 6, 458–469. [Google Scholar] [CrossRef]
  4. Guterres, A. The Sustainable Development Goals Report 2020; United Nations Department of Economic and Social Affairs: New York, NY, USA, 2020. [Google Scholar] [CrossRef]
  5. Tian, M.; Yuan, L.; Guo, R.; Wu, Y.; Liu, X. Sustainable development: Investigating the correlations between park equality and mortality by multilevel model in Shenzhen, China. Sustain. Cities Soc. 2021, 75, 103385. [Google Scholar] [CrossRef]
  6. Sharifi, F.; Nygaard, A.; Stone, W.M.; Levin, I. Accessing green space in Melbourne: Measuring inequity and household mobility. Landsc. Urban Plan. 2021, 207, 104004. [Google Scholar] [CrossRef]
  7. Zhang, R.; Zhang, C.-Q.; Cheng, W.; Lai, P.C.; Schüz, B. The neighborhood socioeconomic inequalities in urban parks in a High-density City: An environmental justice perspective. Landsc. Urban Plan. 2021, 211, 104099. [Google Scholar] [CrossRef]
  8. Wang, S.; Yung, E.H.K.; Sun, Y. Effects of open space accessibility and quality on older adults’ visit: Planning towards equal right to the city. Cities 2022, 125, 103611. [Google Scholar] [CrossRef]
  9. Zepp, H.; Groß, L.; Inostroza, L. And the winner is? Comparing urban green space provision and accessibility in eight European metropolitan areas using a spatially explicit approach. Urban For. Urban Green. 2020, 49, 126603. [Google Scholar] [CrossRef]
  10. Seifu, S.; Stellmacher, T. Accessibility of public recreational parks in Addis Ababa, Ethiopia: A GIS based analysis at sub-city level. Urban For. Urban Green. 2021, 57, 126916. [Google Scholar] [CrossRef]
  11. Wolff, M. Taking one step further–Advancing the measurement of green and blue area accessibility using spatial network analysis. Ecol. Indic. 2021, 126, 107665. [Google Scholar] [CrossRef]
  12. Park, Y.; Guldmann, J.-M. Understanding disparities in community green accessibility under alternative green measures: A metropolitan-wide analysis of Columbus, Ohio, and Atlanta, Georgia. Landsc. Urban Plan. 2020, 200, 103806. [Google Scholar] [CrossRef]
  13. Liang, H.; Zhang, Q. Assessing the public transport service to urban parks on the basis of spatial accessibility for citizens in the compact megacity of Shanghai, China. Urban Stud. 2017, 55, 1983–1999. [Google Scholar] [CrossRef]
  14. Guo, S.; Song, C.; Pei, T.; Liu, Y.; Ma, T.; Du, Y.; Chen, J.; Fan, Z.; Tang, X.; Peng, Y. Accessibility to urban parks for elderly residents: Perspectives from mobile phone data. Landsc. Urban Plan. 2019, 191, 103642. [Google Scholar] [CrossRef]
  15. Zheng, Z.; Shen, W.; Li, Y.; Qin, Y.; Wang, L. Spatial equity of park green space using KD2SFCA and web map API: A case study of zhengzhou, China. Appl. Geogr. 2020, 123, 102310. [Google Scholar] [CrossRef]
  16. Zhang, J.; Cheng, Y.; Zhao, B. Assessing the inequities in access to peri-urban parks at the regional level: A case study in China’s largest urban agglomeration. Urban For. Urban Green. 2021, 65, 127334. [Google Scholar] [CrossRef]
  17. Zhang, W.; Li, S.; Gao, Y.; Liu, W.; Jiao, Y.; Zeng, C.; Gao, L.; Wang, T. Travel changes and equitable access to urban parks in the post COVID-19 pandemic period: Evidence from Wuhan, China. J. Environ. Manag. 2022, 304, 114217. [Google Scholar] [CrossRef]
  18. Cai, G.; Xiong, J.; Wen, L.; Weng, A.; Lin, Y.; Li, B. Predicting the ecosystem service values and constructing ecological security patterns in future changing land use patterns. Ecol. Indic. 2023, 154, 110787. [Google Scholar] [CrossRef]
  19. Gou, M.; Li, L.; Ouyang, S.; Wang, N.; La, L.; Liu, C.; Xiao, W. Identifying and analyzing ecosystem service bundles and their socioecological drivers in the Three Gorges Reservoir Area. J. Clean. Prod. 2021, 307, 127208. [Google Scholar] [CrossRef]
  20. Boulton, C.; Dedekorkut-Howes, A.; Byrne, J. Factors shaping urban greenspace provision: A systematic review of the literature. Landsc. Urban Plan. 2018, 178, 82–101. [Google Scholar] [CrossRef]
  21. Sun, C.; Song, X.; Cheng, J.; Peng, M.; Li, X. An equitable spatial strategy for urban green space based on reconciling growing and shrinking neighbourhoods at the parcel level. Land Use Policy 2025, 158, 107713. [Google Scholar] [CrossRef]
  22. Ai, X.; Zheng, X.; Zhang, Y.; Liu, Y.; Ou, X.; Xia, C.; Liu, L. Climate and land use changes impact the trajectories of ecosystem service bundles in an urban agglomeration: Intricate interaction trends and driver identification under SSP-RCP scenarios. Sci. Total Environ. 2024, 944, 173828. [Google Scholar] [CrossRef]
  23. Lin, G.; Lan, S.; Chi, B.; Wu, K.; Liu, Y.; Li, X. Synergistic optimization of ecological supply–demand: Integrating urban green space ecosystem services and dual ecological demands across multiple scenarios. Ecol. Indic. 2025, 178, 114133. [Google Scholar] [CrossRef]
  24. Chen, Q.; Ning, Y. Projecting LUCC dynamics and ecosystem services in an emerging urban agglomeration under SSP-RCP scenarios and their management implications. Sci. Total Environ. 2024, 949, 175100. [Google Scholar] [CrossRef] [PubMed]
  25. Huang, J.; Zheng, F.; Dong, X.; Wang, X.-C. Exploring the complex trade-offs and synergies among ecosystem services in the Tibet autonomous region. J. Clean. Prod. 2023, 384, 135483. [Google Scholar] [CrossRef]
  26. Zhang, J.; Liu, Z.; Guan, Z.; Wang, L.; Zhang, J.; Han, Z. Balancing future urban development and carbon sequestration: A multi-scenario InVEST model analysis of China’s urban clusters. J. Environ. Manag. 2025, 380, 125003. [Google Scholar] [CrossRef]
  27. Huang, Z.; Qian, L.; Cao, W. Developing a novel approach integrating ecosystem services and biodiversity for identifying priority ecological reserves. Resour. Conserv. Recycl. 2022, 179, 106128. [Google Scholar] [CrossRef]
  28. Lyu, K.; Li, Z. Scenario based assessment of carbon storage and habitat quality under land use change in Shandong Province China. Sci. Rep. 2025, 15, 38098. [Google Scholar] [CrossRef]
  29. Zhang, Q.; Huang, R.; Zhu, C.; Huang, L.; Yang, D. Integrating land use simulation and carbon assessment for sustainable urban planning in Fuzhou metropolitan area using PLUS and InVEST models. Sci. Rep. 2025, 15, 30382. [Google Scholar] [CrossRef]
  30. O’Neill, B.C.; Tebaldi, C.; van Vuuren, D.P.; Eyring, V.; Friedlingstein, P.; Hurtt, G.; Knutti, R.; Kriegler, E.; Lamarque, J.-F.; Lowe, J. The Scenario Model Intercomparison Project (ScenarioMIP) for CMIP6. Geosci. Model Dev. 2016, 9, 3461–3482. [Google Scholar] [CrossRef]
  31. Cui, M.; Hong, C.; Liu, W.; He, K.; Zhang, Q. Future warming exacerbates heatwave-ozone compound extremes in China. npj Clim. Atmos. Sci. 2025, 8, 341. [Google Scholar] [CrossRef]
  32. Usta, D.F.B.; Teymouri, M.; Chatterjee, U. Assessment of temperature changes over Iran during the twenty-first century using CMIP6 models under SSP1-26, SSP2-4.5, and SSP5-8.5 scenarios. Arab. J. Geosci. 2022, 15, 416. [Google Scholar] [CrossRef]
  33. Zhang, Y.; Cui, L.; Xie, D.; Jiang, J. Simulation and prediction of sea level rise impact on the distribution of mangrove and Spartina alterniflora in coastal China. Forests 2023, 14, 831. [Google Scholar] [CrossRef]
  34. Sun, Y.; Xie, S.; Zhao, S. Valuing urban green spaces in mitigating climate change: A city-wide estimate of aboveground carbon stored in urban green spaces of China’s Capital. Glob. Change Biol. 2019, 25, 1717–1732. [Google Scholar] [CrossRef] [PubMed]
  35. Li, Y.-Y.; Ren, B.-T.; Chen, Y.-S.; Huang, L.-C.; Sun, C.-G. Multiscale spatiotemporal dynamics analysis of urban green space: Implications for green space planning in the rapid urbanizing Hefei City, China. Front. Ecol. Evol. 2022, 10, 998111. [Google Scholar] [CrossRef]
  36. Zhao, W.; Li, X.; Zhang, L.; Peng, L.; Liu, Y.; Wang, Z.; Jiao, L.; Wang, H. The multi-scale spatial heterogeneity of ecosystem services’ supply–demand matching and its influencing factors on urban green space in China. Forests 2023, 14, 2091. [Google Scholar] [CrossRef]
  37. Zaerpour, M.; Papalexiou, S.M.; Pietroniro, A. Increasing tree canopy lowers urban air temperature by up to 1.5 °C in heat-prone areas. npj Urban Sustain. 2025, 5, 92. [Google Scholar] [CrossRef]
  38. Matias, P.; Moreira da Silva, M.; Teigão, J.; Duarte, A. Urban vegetation benefits in mediterranean cities for climate change adaptation and water usage efficiency–a case study in Algarve, Portugal. Front. Environ. Sci. 2025, 13, 1520934. [Google Scholar] [CrossRef]
  39. Liu, S.; Shen, P.; Huang, Y.; Jiang, L.; Feng, Y. Spatial distribution changes in nature-based recreation service supply from 2008 to 2018 in Shanghai, China. Land 2022, 11, 1862. [Google Scholar] [CrossRef]
  40. Baró, F.; Haase, D.; Gómez-Baggethun, E.; Frantzeskaki, N. Mismatches between ecosystem services supply and demand in urban areas: A quantitative assessment in five European cities. Ecol. Indic. 2015, 55, 146–158. [Google Scholar] [CrossRef]
  41. Yang, Y.; Guangrong, S.; Chen, Z.; Hao, S.; Zhouyiling, Z.; Shan, Y. Quantitative analysis and prediction of urban heat island intensity on urban-rural gradient: A case study of Shanghai. Sci. Total Environ. 2022, 829, 154264. [Google Scholar] [CrossRef]
  42. Li, J.; Fu, J.; Gao, J.; Zhou, R.; Wang, K.; Zhou, K. Effects of the spatial patterns of urban parks on public satisfaction: Evidence from Shanghai, China. Landsc. Ecol. 2023, 38, 1265–1277. [Google Scholar] [CrossRef]
  43. Liang, H.; Yan, Q.; Yan, Y.; Zhang, Q. Using an improved 3SFCA method to assess inequities associated with multimodal accessibility to green spaces based on mismatches between supply and demand in the metropolitan of Shanghai, China. Sustain. Cities Soc. 2023, 91, 104456. [Google Scholar] [CrossRef]
  44. Liang, H.; Zhang, Q. Temporal and spatial assessment of urban park visits from multiple social media data sets: A case study of Shanghai, China. J. Clean. Prod. 2021, 297, 126682. [Google Scholar] [CrossRef]
  45. GB/T 50563-2010; Evaluation Standard for Urban Landscaping and Greening. Ministry of Housing and Urban-Rural Development: Beijing, China, 2010.
  46. Comber, A.; Brunsdon, C.; Green, E. Using a GIS-based network analysis to determine urban greenspace accessibility for different ethnic and religious groups. Landsc. Urban Plan. 2008, 86, 103–114. [Google Scholar] [CrossRef]
  47. Liang, C.; Yuan, J.; Tang, X.; Kan, H.; Cai, W.; Chen, J. The influence of humid heat on morbidity of megacity Shanghai in China. Environ. Int. 2024, 183, 108424. [Google Scholar] [CrossRef]
  48. Li, Z.; Chang, J.; Wang, Z.; Chen, Y.; Li, C. Stability of Regional Ecological Supply–Demand Is Enhanced by Complex Network Modeling: Evidence From the Xuzhou Metropolitan Area, China. IEEE J. Sel. Top. Appl. Earth Obs. Remote Sens. 2024, 17, 1857–1873. [Google Scholar] [CrossRef]
  49. Zhang, Y.; Hu, W.; Min, M.; Zhao, K.; Zhang, S.; Liu, T. Optimization of ecological connectivity and construction of supply-demand network in Wuhan Metropolitan Area, China. Ecol. Indic. 2023, 146, 109799. [Google Scholar] [CrossRef]
  50. Pinto, L.V.; Inácio, M.; Ferreira, C.S.S.; Ferreira, A.D.; Pereira, P. Ecosystem services and well-being dimensions related to urban green spaces—A systematic review. Sustain. Cities Soc. 2022, 85, 104072. [Google Scholar] [CrossRef]
  51. Xu, L.; You, H.; Li, D.; Yu, K. Urban green spaces, their spatial pattern, and ecosystem service value: The case of Beijing. Habitat Int. 2016, 56, 84–95. [Google Scholar] [CrossRef]
  52. Hu, Y.n.; Zhang, J.; Yang, Y.; Hu, T.; Wang, S. Integrating supply and beneficiaries into assessing the benefit of water purification service: A spatial flow perspective. Landsc. Ecol. 2024, 39, 200. [Google Scholar] [CrossRef]
  53. Liu, X.; Zhao, Y.; Zeng, D.; Yang, Y.; Li, W.; Kang, Y.; Wei, G.; Yuan, X.; Bo, S.; Si, X. Characterizing bird species for achieving the win-wins of conserving biodiversity and enhancing regulating ecosystem services in urban green spaces. Urban For. Urban Green. 2023, 87, 128064. [Google Scholar] [CrossRef]
  54. Liu, Y.; Lü, Y.; Zhao, M.; Fu, B. Integrative analysis of biodiversity, ecosystem services, and ecological vulnerability can facilitate improved spatial representation of nature reserves. Sci. Total Environ. 2023, 879, 163096. [Google Scholar] [CrossRef] [PubMed]
  55. Wang, C.; Zhao, M.; Xu, Y.; Zhao, Y.; Zhang, X. Ecosystem Service Synergies Promote Ecological Tea Gardens: A Case Study in Fuzhou, China. Remote Sens. 2023, 15, 540. [Google Scholar] [CrossRef]
  56. He, L.; Xie, Z.; Wu, H.; Liu, Z.; Zheng, B.; Wan, W. Exploring the interrelations and driving factors among typical ecosystem services in the Yangtze river economic Belt, China. J. Environ. Manag. 2024, 351, 119794. [Google Scholar] [CrossRef] [PubMed]
  57. Liu, Q.; Qiao, J.; Li, M.; Huang, M. Spatiotemporal heterogeneity of ecosystem service interactions and their drivers at different spatial scales in the Yellow River Basin. Sci. Total Environ. 2024, 908, 168486. [Google Scholar] [CrossRef]
  58. Dou, H.; Li, X.; Li, S.; Dang, D.; Li, X.; Lyu, X.; Li, M.; Liu, S. Mapping ecosystem services bundles for analyzing spatial trade-offs in inner Mongolia, China. J. Clean. Prod. 2020, 256, 120444. [Google Scholar] [CrossRef]
  59. Fan, G.; Wang, Y.; Zhao, S.; Qiao, X.; Yang, G.; Lin, Z. Optimization of social values for ecosystem services assessment based on the analytic hierarchy process: A case study of the core district parks in Zhengzhou. Environ. Sustain. Indic. 2025, 27, 100786. [Google Scholar] [CrossRef]
  60. Jia, Q.; Jiao, L.; Lian, X.; Wang, W. Linking supply-demand balance of ecosystem services to identify ecological security patterns in urban agglomerations. Sustain. Cities Soc. 2023, 92, 104497. [Google Scholar] [CrossRef]
  61. Zhang, Z.; Wang, Q.; Yan, F.; Sun, Y.; Yan, S. Revealing spatio-temporal differentiations of ecological supply-demand mismatch among cities using ecological Network: A case study of typical cities in the “Upstream-Midstream-Downstream” of the Yellow River Basin. Ecol. Indic. 2024, 166, 112468. [Google Scholar] [CrossRef]
  62. Huang, W.; Wang, P.; He, L.; Liu, B. Improvement of water yield and net primary productivity ecosystem services in the Loess Plateau of China since the “Grain for Green” project. Ecol. Indic. 2023, 154, 110707. [Google Scholar] [CrossRef]
  63. Xiang, H.; Zhang, J.; Mao, D.; Wang, Z.; Qiu, Z.; Yan, H. Identifying spatial similarities and mismatches between supply and demand of ecosystem services for sustainable Northeast China. Ecol. Indic. 2022, 134, 108501. [Google Scholar] [CrossRef]
  64. Terrado, M.; Sabater, S.; Chaplin-Kramer, B.; Mandle, L.; Ziv, G.; Acuña, V. Model development for the assessment of terrestrial and aquatic habitat quality in conservation planning. Sci. Total Environ. 2016, 540, 63–70. [Google Scholar] [CrossRef] [PubMed]
  65. Sun, C.; König, H.J.; Uthes, S.; Chen, C.; Li, P.; Hemminger, K. Protection effect of overwintering water bird habitat and defining the conservation priority area in Poyang Lake wetland, China. Environ. Res. Lett. 2020, 15, 125013. [Google Scholar] [CrossRef]
  66. Liang, H.; Yan, Q.; Yan, Y. Evaluating green space provision development in Shanghai (2012–2021): A focus on accessibility and service efficiency. Sustain. Cities Soc. 2024, 103, 105269. [Google Scholar] [CrossRef]
  67. Luo, J. Integrating the huff model and floating catchment area methods to analyze spatial access to healthcare services. Trans. GIS 2014, 18, 436–448. [Google Scholar] [CrossRef]
  68. Zhang, J.; Yue, W.; Fan, P.; Gao, J. Measuring the accessibility of public green spaces in urban areas using web map services. Appl. Geogr. 2021, 126, 102381. [Google Scholar] [CrossRef]
  69. Collins, R.M.; Spake, R.; Brown, K.A.; Ogutu, B.O.; Smith, D.; Eigenbrod, F. A systematic map of research exploring the effect of greenspace on mental health. Landsc. Urban Plan. 2020, 201, 103823. [Google Scholar] [CrossRef]
  70. Liu, S.; Zhang, X.; Feng, Y.; Xie, H.; Jiang, L.; Lei, Z. Spatiotemporal Dynamics of Urban Green Space Influenced by Rapid Urbanization and Land Use Policies in Shanghai. Forests 2021, 12, 476. [Google Scholar] [CrossRef]
  71. Liang, Z. Strategic land allocation in China’s urban renewal: The role of non-market mechanisms. SN Bus. Econ. 2025, 5, 47. [Google Scholar] [CrossRef]
  72. Li, J. Development Control in Transitional Urban China from an Institutional Perspective: Shanghai in the “Era of Redevelopment” as Case Study. Ph.D. Thesis, University of Cambridge, Cambridge, UK, 2023. [Google Scholar]
  73. Liu, B.; Zheng, S.; Zhang, L.; Liu, J.; Fu, T.; Hao, R.; Yin, M. Identification and Analysis of Potential Open-Sharing Subjects of Unit-Affiliated Green Spaces in Shanghai Based on POI Data. Land 2023, 12, 2162. [Google Scholar] [CrossRef]
  74. Qiu, T.; Zhou, D.; Li, W. Fitness culture and green space equity: Accessibility evaluation of shanghai communities. Front. Environ. Sci. 2022, 10, 958649. [Google Scholar] [CrossRef]
  75. Jin, Y.; He, R.; Hong, J.; Luo, D.; Xiong, G. Assessing the accessibility and equity of urban green spaces from supply and demand perspectives: A case study of a mountainous city in China. Land 2023, 12, 1793. [Google Scholar] [CrossRef]
  76. Xie, H.; Wang, X.; Hu, X.; Shi, Z.; Lin, H.; Xie, X.; Chen, L.; Dai, H.; Zhang, J.; Xu, M. Exploring urban green space optimization of the urban walking life circle in Fuzhou, China. Int. J. Environ. Res. Public Health 2023, 20, 1180. [Google Scholar] [CrossRef] [PubMed]
  77. Jiaxin, L.; Bing, C.; Yinke, Z.; Chuanchun, H.; Yu, W.; Feng, S. Accessibility and social equity of urban parks. J. Zhejiang AF Univ. 2024, 41, 820–829. [Google Scholar]
  78. Kirby, M.G.; Scott, A.J.; Walsh, C.L. A greener Green Belt? Co-developing exploratory scenarios for contentious peri-urban landscapes. Landsc. Urban Plan. 2025, 255, 105268. [Google Scholar] [CrossRef]
  79. Tian, Y.; Van Leeuwen, E.; Tsendbazar, N.-e.; Jing, C.; Herold, M. Urban green inequality and its mismatches with human demand across neighborhoods in New York, Amsterdam, and Beijing. Landsc. Ecol. 2024, 39, 60. [Google Scholar] [CrossRef]
  80. Li, Y.; Wang, C.; Sun, M.; Zhang, H. Dynamic Simulation of Land Use Change and Assessment of Ecosystem Services Under Climate Change Scenarios: A Case Study of Shanghai, China. Land 2025, 14, 1791. [Google Scholar] [CrossRef]
  81. Zhang, T.; Zeng, Y.; Zhang, Y.; Song, Y.; Li, H. Dynamic and heterogeneous demand for urban green space by urban residents: Evidence from the cities in China. Sustainability 2020, 12, 9384. [Google Scholar] [CrossRef]
  82. Abouelela, M.; Durán-Rodas, D.; Antoniou, C. Do we all need shared E-scooters? An accessibility-centered spatial equity evaluation approach. Transp. Res. Part A Policy Pract. 2024, 181, 103985. [Google Scholar] [CrossRef]
  83. McKenzie, G. Spatiotemporal comparative analysis of scooter-share and bike-share usage patterns in Washington, DC. J. Transp. Geogr. 2019, 78, 19–28. [Google Scholar] [CrossRef]
  84. Mears, M.; Brindley, P.; Barrows, P.; Richardson, M.; Maheswaran, R. Mapping urban greenspace use from mobile phone GPS data. PLoS ONE 2021, 16, e0248622. [Google Scholar] [CrossRef]
  85. Guo, W.; Teng, Y.; Li, J.; Yan, Y.; Zhao, C.; Li, Y.; Li, X. A new assessment framework to forecast land use and carbon storage under different SSP-RCP scenarios in China. Sci. Total. Environ. 2023, 912, 169088. [Google Scholar] [CrossRef] [PubMed]
  86. Tang, J.; Song, P.; Hu, X.; Chen, C.; Wei, B.; Zhao, S. Coupled effects of land use and climate change on water supply in SSP–RCP scenarios: A case study of the Ganjiang River Basin, China. Ecol. Indic. 2023, 154, 110745. [Google Scholar] [CrossRef]
  87. He, N.; Guo, W.; Wang, H.; Yu, L.; Cheng, S.; Huang, L.; Jiao, X.; Chen, W.; Zhou, H. Temporal and Spatial Variations in Landscape Habitat Quality under Multiple Land-Use/Land-Cover Scenarios Based on the PLUS-InVEST Model in the Yangtze River Basin, China. Land 2023, 12, 1338. [Google Scholar] [CrossRef]
  88. Li, X.; Fu, J.; Jiang, D.; Lin, G.; Cao, C. Land use optimization in Ningbo City with a coupled GA and PLUS model. J. Clean. Prod. 2022, 375, 134004. [Google Scholar] [CrossRef]
  89. Gao, L.; Tao, F.; Liu, R.; Wang, Z.; Leng, H.; Zhou, T. Multi-scenario simulation and ecological risk analysis of land use based on the PLUS model: A case study of Nanjing. Sustain. Cities Soc. 2022, 85, 104055. [Google Scholar] [CrossRef]
  90. Liao, W.; Liu, X.; Xu, X.; Chen, G.; Liang, X.; Zhang, H.; Li, X. Projections of land use changes under the plant functional type classification in different SSP-RCP scenarios in China. Sci. Bull. 2020, 65, 1935–1947. [Google Scholar] [CrossRef]
  91. Liu, X.; Liu, Y.; Wang, Y.; Liu, Z. Evaluating potential impacts of land use changes on water supply–demand under multiple development scenarios in dryland region. J. Hydrol. 2022, 610, 127811. [Google Scholar] [CrossRef]
  92. Popp, A.; Calvin, K.; Fujimori, S.; Havlik, P.; Humpenöder, F.; Stehfest, E.; Bodirsky, B.L.; Dietrich, J.P.; Doelmann, J.C.; Gusti, M.; et al. Land-use futures in the shared socio-economic pathways. Glob. Environ. Change 2017, 42, 331–345. [Google Scholar] [CrossRef]
Figure 1. The research area.
Sustainability 18 02195 g001
Figure 2. Technology Roadmap.
Sustainability 18 02195 g002
Figure 3. Shanghai Urban Green Space (UGS) Service Spatial Differentiation of Multi-dimensional Supply and Demand: (a) Matching distribution diagram of the UGS Comprehensive Service Capacity Index and the UGS Population Demand Index; (b) Matching distribution diagram of the UGS Comprehensive Service Capacity Index and the UGS transportation supply index; (c) Matching distribution diagram of the UGS population demand index and the UGS transportation supply index; (d) Matching distribution diagram of the UGS population demand index and the ecosystem service supply index.
Sustainability 18 02195 g003
Figure 4. Typical Case Analysis Image.
Sustainability 18 02195 g004
Figure 5. Overall Attractiveness of the Crowd at Different Urban Green Space Levels in Shanghai.
Sustainability 18 02195 g005
Figure 6. Changes in the Distribution Characteristics of Different Levels of Green Space in Shanghai in 2023 and 2030.
Sustainability 18 02195 g006
Table 1. Per Capita Green Space Area (PCGSA), Service Radius, and Standards for Urban Green Space (UGS) Across Different City Levels.
Level (L)Urban Green Space LevelUrban Green Space AreaPer Capita Green Space Area (PCGSA) StandardTransportation Mode t 0
(Threshold Travel Time)
1Neighborhood LevelLess than 2 hectares15 m2Walking7.5 min
2Community Level2–10 hectares30 m2Walking15 min
Driving or public transportation20 min
3City Level10 hectares or more60 m2Walking30 min
Driving or public transportation40 min
Table 2. Transportation Network Based on Actual Travel Behavior Across Different Modes of Transportation.
Transportation ModeTransportation NetworkTransportation BehaviorRoad or Route TypeSpeed
WalkingWalking NetworkWalkingUrban Roads—Major Arterials, Secondary Arterials, Collector Roads, Sidewalks4 km per h
Public TransportationIntegrated Walking and Public Transit NetworkWalkingUrban Roads—Major Arterials, Secondary Arterials, Collector Roads, Sidewalks4 km per h
Public Transportation—BusDowntown Bus Routes20 km per h
Suburban Bus Routes30 km per h
Downtown–Suburban Commuter Bus Routes (Highway)70 km per h
Downtown–Suburban Commuter Bus Routes (Non-Highway)40 km per h
Public Transportation—FerryFerry Routes20 km per h
Public Transportation—Rail TransitMaglev Rail430 km per h
Subway Lines 6, 10, 1530 km per h
Subway Lines 1, 4, 7, 8, 9, 11, 12, 1435 km per h
Disclaimer/Publisher’s Note: The statements, opinions and data contained in all publications are solely those of the individual author(s) and contributor(s) and not of MDPI and/or the editor(s). MDPI and/or the editor(s) disclaim responsibility for any injury to people or property resulting from any ideas, methods, instructions or products referred to in the content.