Article

What Drives Residents’ Divergent Perceptions of Cultural Ecosystem Services in Urban Park Green Spaces? A Dual-Source Analysis Synergizing Social Media and Survey Data

1
School of Civil Engineering, Architecture and Environment, Hubei University of Technology, Wuhan 430068, China
2
Changjiang Ecology (Hubei) Technology Development Co., Ltd., Wuhan 430011, China
*
Author to whom correspondence should be addressed.
Sustainability 2026, 18(5), 2578; https://doi.org/10.3390/su18052578
Submission received: 19 January 2026 / Revised: 19 February 2026 / Accepted: 26 February 2026 / Published: 6 March 2026

Abstract

In the context of rapid urbanization and the pursuit of the United Nations Sustainable Development Goals (SDGs), particularly SDG 11 (Sustainable Cities and Communities), cities face multifaceted challenges such as high population density, limited green space, ecosystem degradation, and an insufficient supply of ecological products, all of which undermine urban sustainability. As crucial ecological units, urban park green spaces (UPGS) play a vital role in alleviating environmental pressures and providing cultural ecosystem services (CES) that are essential for human well-being and social sustainability. However, systematic insight into how residents perceive and value CES, along with the underlying drivers, remains underdeveloped, impeding the advancement of refined park management practices. Based on 12,083 social media texts, this study employed BERTopic topic modeling to identify five core dimensions of CES perception: recreational services (RS), aesthetic experiences (AE), health-promoting activities (HA), social interactions (SI), and educational services (ES). Additionally, four underlying drivers with corresponding measurable indicators were also identified: residents’ socioeconomic backgrounds (RSB), external built environment of parks (EBE), internal landscape composition (ILC), and quality of services management (QSM). Subsequently, using 313 valid questionnaires and geographic park data, a Partial Least Squares Structural Equation Modeling (PLS-SEM) framework was constructed to analyze the influence mechanisms of EBE, ILC, and QSM on CES perception differences, with residents’ satisfaction with CES serving as the measure of their perceived CES levels. Hierarchical regression analysis was further employed to examine the moderating effects of RSB on these driving pathways. The findings reveal the following: (1) Significant synergies and heterogeneities existed among CES dimensions, with notable synergistic effects observed between AE and SI, as well as between HA and RS. (2) EBE, ILC, and QSM significantly influenced CES perception differences (p < 0.05). EBE affected these differences through pathways such as EBE → ILC → QSM → CES and EBE → QSM → CES. Notably, QSM was identified as the most critical mediating factor affecting CES perception differences. (3) Age exerted a significant positive moderating effect on the QSM → CES pathway, while monthly income showed a marginally significant negative moderating trend on the ILC → QSM pathway. This study elucidates the multi-level driving mechanisms underlying differences in residents’ perceptions of CES in UPGS. A key innovation lies in the integration of large-scale social media text data with questionnaire surveys, combined with the application of the BERTopic model and PLS-SEM to analyze these perceptual differences. The findings offer both theoretical foundations and practical insights for landscape optimization and service enhancement in park planning and management, contributing to the development of more equitable, resilient, and sustainable urban environments.

1. Introduction

The United Nations Sustainable Development Goals (SDGs), particularly SDG 11 (Sustainable Cities and Communities) and SDG 15 (Life on Land), highlight the critical need to foster inclusive, safe, resilient, and sustainable urban environments [1]. Central to this global agenda is the provision of urban green spaces, which deliver essential ecosystem services that support both human well-being and ecological integrity [2]. However, the rapid urbanization observed worldwide, and especially in China, has generated significant socio-environmental pressures that directly challenge these sustainability targets. These pressures, including population overcrowding, resource depletion, ecosystem degradation, the loss of historic urban character, and a shortfall in ecological service provision [3,4,5,6,7], represent fundamental obstacles to realizing the SDGs. Consequently, a critical challenge confronting governments at all levels in China today is how to reconstruct new orientations, approaches, and pathways for urban development in the new era, facilitating urban transformation and sustainable development while meeting the people’s growing aspirations for a better quality of life and enhancing their sense of fulfillment and well-being [8]. In response, the Chinese government has advanced the innovative concept of “Park City” development as a new urban paradigm, aiming to implement the vision of ecological civilization and the people-centered development philosophy in the new era.
Urban park green spaces (UPGS) are defined as “publicly accessible green areas primarily designated for recreation, while also incorporating ecological, aesthetic, cultural, and educational functions, and emergency shelter capabilities, equipped with certain recreational and service facilities” [9]. Serving as a pivotal spatial medium for Park City development and ecological infrastructure construction, UPGS form essential structural components of urban ecological and landscape systems. Beyond their demonstrated efficacy in alleviating urban environmental stressors [10,11,12], UPGS are fundamental to delivering cultural ecosystem services (CES), namely the non-material benefits that are increasingly recognized as crucial determinants of urban livability and social sustainability [13]. However, the prevailing top-down, government-led development model has resulted in significant homogenization of urban parks. This manifests in features such as morphological monotony, functional oversimplification, and imbalanced integration of greening and cultural elements [14,15,16]. Park homogenization not only leads to inefficient utilization of scarce urban land resources but also fails to satisfy the public’s diverse CES demands. This deficiency directly undermines the social dimension of sustainable urban development. A primary underlying cause is the insufficient attention paid to the needs and preferences of residents with varying backgrounds and behavioral patterns. This study focuses on residents’ subjective perceptions of CES. This concept refers to individuals’ cognitive and emotional interpretations and experiences of the non-material benefits provided by UPGS. As a psychological construct, it is distinct from the objective provision of ecosystem services or actual service flows. To quantify the degree of subjective perception, this study adopts satisfaction with CES as the core reflective indicator, serving as a quantifiable proxy for residents’ subjective evaluations and the extent to which CES meets their needs. How to gain an in-depth understanding of the differences in residents’ perceptions of CES in UPGS across diverse social groups, and how to internalize such insights into the planning, construction, renovation, and quality enhancement of urban parks, remains a critical area of research for realizing the vision of “a city built by and for the people,” which lies at the core of socially sustainable urban development.
Cultural ecosystem services refer to the non-material benefits humans obtain from ecosystems through spiritual fulfillment, cognitive development, reflection, recreation, and aesthetic experiences. CES constitute one of the four main categories of ecosystem services, alongside provisioning, supporting, and regulating services [2]. CES encompasses diverse non-material benefits, including aesthetic appreciation, physical recreation, social interaction, mental health enhancement, spiritual inspiration, place identity, religious fulfillment, educational value, cultural heritage, and ecotourism opportunities [17,18,19,20]. These services are intrinsically linked to human well-being—a central pillar of sustainability that extends beyond environmental and economic considerations. As human perceptions of CES are inherently subjective and not easily quantifiable, and given the differences in cognition, cultural background, and other contextual factors among individuals, perceptions of CES may vary significantly across different population groups, even when engaging with the same ecosystem [21,22,23]. The intangible nature of CES, coupled with the difficulty of direct tangible valuation, often leads to their oversight in urban ecological space utilization and governance processes [24,25]. This oversight poses a significant risk to equitable sustainability, as it may systematically disadvantage certain social groups whose needs and perceptions are not adequately captured by conventional planning approaches.
Existing research on residents’ perceptions of CES in UPGS has primarily focused on three key areas. First, research on heterogeneous public perceptions of CES in UPGS. Residents, as primary end-users of CES in UPGS, exhibit perceptual patterns that constitute critical metrics for evaluating the efficacy and performance of park-delivered CES. Scholars have long employed the resident perception lens to research CES in UPGS. Key themes include: analyzing cognitive differences in CES types among demographic groups [23,26], assessing perceived importance and satisfaction [27], and estimating CES value [28]. Methodologies encompass questionnaire surveys [29], interviews [30], willingness-to-pay analysis [31], public participation GIS (PPGIS) [32,33], the SolVES model [26,28], and social media analytics [34].
Second, research on the influence of demographic attributes on CES perceptual differences. Heterogeneous population composition within a region necessitates UPGS to fulfill diverse and heterogeneous demands. Variations in CES preferences among resident groups highlight this heterogeneity. Differences in residents’ demographic, sociological, and behavioral backgrounds significantly influence their UPGS usage and CES perceptions [18,27]. Researchers often stratify respondents by demographics, social attributes, or personal characteristics to investigate group-specific CES preference influences. For instance, Zhang et al. examined the relational dynamics between generational CES demand patterns (youth vs. elderly cohorts) and landscape spatial configurations within urban park ecosystems [26]. Ghermandi et al. compared CES perceptions among locals, domestic, and international tourists, revealing distinct beneficiary patterns [35]. Zhou et al. examined the influence of gender on perceived CES preferences, revealing that male and female subgroups exhibited similar perceptions regarding cultural, educational, and recreational services, whereas preferences diverged for aesthetic appreciation and biodiversity perception [28]. Riechers et al. delimited their respondents to experts and laypersons, revealing through comparative analysis that while professionals exhibited stronger orientations toward environmental stewardship, non-specialists primarily valued nature for recreational enjoyment [36].
Third, research examining the underlying drivers shaping heterogeneous resident perceptions of CES. Research on the formative drivers of these differences remains limited. Existing studies primarily analyze the impacts of socioeconomic status, landscape characteristics, and spatial distribution on perceptual variations [36,37]. Landscape influence analyses often leverage social media data and remote sensing imagery to assess how environmental features shape CES preferences [38]. Accessibility exerts significant positive effects on CES perceptions [39]. Perceptions of health-promoting services strongly influence park usage intentions among younger residents [40]. Diverse UPGS characteristics, including location, size, and amenities, also significantly impact usage patterns and CES provision [19,37,41].
Despite growing attention to CES perceptions, the field remains constrained by a reliance on single-method approaches, which compromises both the scope and validity of its findings. First, existing knowledge is divided between two primary data sources, each with inherent limitations. Traditional surveys, while demographically representative, are epistemologically anchored in a priori constructs. Their retrospective design captures post hoc rationalizations rather than immediate lived experience, which makes them susceptible to recall bias and fundamentally unable to capture in-the-moment affective responses [42]. Conversely, social media big data, while offering real-time, context-specific expressions, is subject to intrinsic self-selection bias [43]. This bias systematically over-represents digitally active demographics while leaving digitally disadvantaged groups unrepresented [44]. Moreover, the unstructured nature of such data presents a methodological challenge, as reliably distinguishing ephemeral sentiments from enduring attitudes remains difficult. Hence, the field finds itself caught between data that is demographically rich but experientially thin, and data that is experientially rich but demographically opaque. Second, this methodological schism has fragmented theoretical development regarding the drivers of perceptual heterogeneity, with studies isolating either socio-demographic factors or environmental attributes rather than exploring their interactive pathways [45,46]. To transcend these dual limitations, this study employs a sequential mixed-methods approach that methodologically triangulates online social media data with offline survey and spatial data. This design leverages their complementary strengths to correct for each other’s inherent weaknesses: large-scale online data is used to surface emergent perceptions and generate hypotheses, while offline data ensures demographic representativeness and enables rigorous causal testing. Ultimately, this integrated approach reveals both the mediating and moderating processes underlying the heterogeneity of CES perceptions, thereby providing a socially inclusive evidence base for optimizing the structural composition of urban green spaces, refining the functional zoning of parks, and promoting the equitable allocation of public green space resources. This represents a core tenet of environmental justice and social sustainability. Integrating CES into planning thus helps bridge perceptual disparities between urban cores and peripheries, fostering more inclusive and demand-responsive urban greening that contributes directly to the achievement of SDGs.
Operationalizing this framework, the research followed a two-phase sequential design to systematically analyze the driving mechanisms of residents’ perceptions of CES in UPGS. In the first (online) phase, data were collected from user comments on the social media platform Weibo through web crawling. The BERTopic topic modeling was then employed to identify five key CES perception dimensions: Recreational Services (RS), Aesthetic Experiences (AE), Health-promoting Activities (HA), Social Interactions (SI), and Educational Services (ES). Corresponding potential drivers and their observable indicators were also identified, including residents’ socioeconomic backgrounds (RSB), external built environment (EBE), internal landscape composition (ILC), and quality of services management (QSM). In the subsequent (offline) phase, informed by these inductive insights, a structured questionnaire was developed and administered through field surveys in urban parks, with responses integrated alongside park-related geospatial datasets. A Partial Least Squares Structural Equation Modeling (PLS-SEM) framework was applied to construct and test a comprehensive model of the driving pathways among EBE, ILC, QSM, and CES perception variations. Finally, hierarchical regression analysis was conducted to examine the moderating effects of RSB within these causal pathways.
This study aims to address the following core research question: In the context of UPGS, how do the EBE, ILC, QSM, and RSB synergistically drive variations in residents’ perceptions of CES?
Based on preliminary exploratory findings and a synthesis of relevant theoretical frameworks, the following specific hypotheses are proposed for subsequent quantitative testing:
H1. 
The EBE has a positive effect on residents’ perception variations of CES in UPGS.
H2. 
The EBE has a positive effect on the ILC.
H3. 
The EBE has a positive effect on the QSM.
H4. 
The ILC has a positive effect on residents’ perception variations of CES in UPGS.
H5. 
The ILC has a positive effect on the QSM.
H6. 
The QSM has a positive effect on residents’ perception variations of CES in UPGS.
Furthermore, hierarchical regression analysis will be employed to examine the moderating effects of RSB on the hypothesized causal pathways. This analytical step aims to achieve a more comprehensive understanding of the heterogeneity in CES perceptions across different social groups.
By constructing and empirically testing this integrated model, this study seeks to theoretically elucidate the complex pathways that shape CES perceptions in UPGS. From a practical and sustainability-oriented perspective, the findings are intended to provide targeted empirical evidence to inform park planning, design, and fine-scale management, thereby contributing to the maximization of the socio-ecological benefits provided by UPGS and advancing the broader transition toward socially equitable and ecologically resilient urban development.

2. Materials and Methods

2.1. Study Area

Wuhan (29°58′–31°22′ N, 113°41′–115°05′ E) is situated in eastern Jianghan Plain along the middle reaches of the Yangtze River, covering a total area of 8569.15 km2. As a central Chinese metropolis, Wuhan has undergone rapid urbanization. By the end of 2024, Wuhan had achieved an urbanization rate of 85% among its permanent resident population [47]. This substantial population concentration has not only intensified urban ecological pressures but also challenged the capacity to meet the diverse and growing spiritual and cultural demands of its large resident base. To support high-quality urban development and enhance resident well-being, Wuhan municipal authorities have actively promoted the expansion and quality enhancement of urban green spaces in recent years. As of the end of 2024, Wuhan had cumulatively established 1024 parks of various categories, achieving a per capita urban park green space area of 15.03 m2 and an urban built-up area green coverage rate of 43.14% [47]. Wuhan thus presents a representative case study context characterized by rapid urban park expansion, significant population agglomeration, and rising resident demand for CES. This empirical focus offers valuable insights for optimizing UPGS allocation and informing planning, construction, and renewal strategies in comparable cities facing land, ecological, and cultural resource constraints.
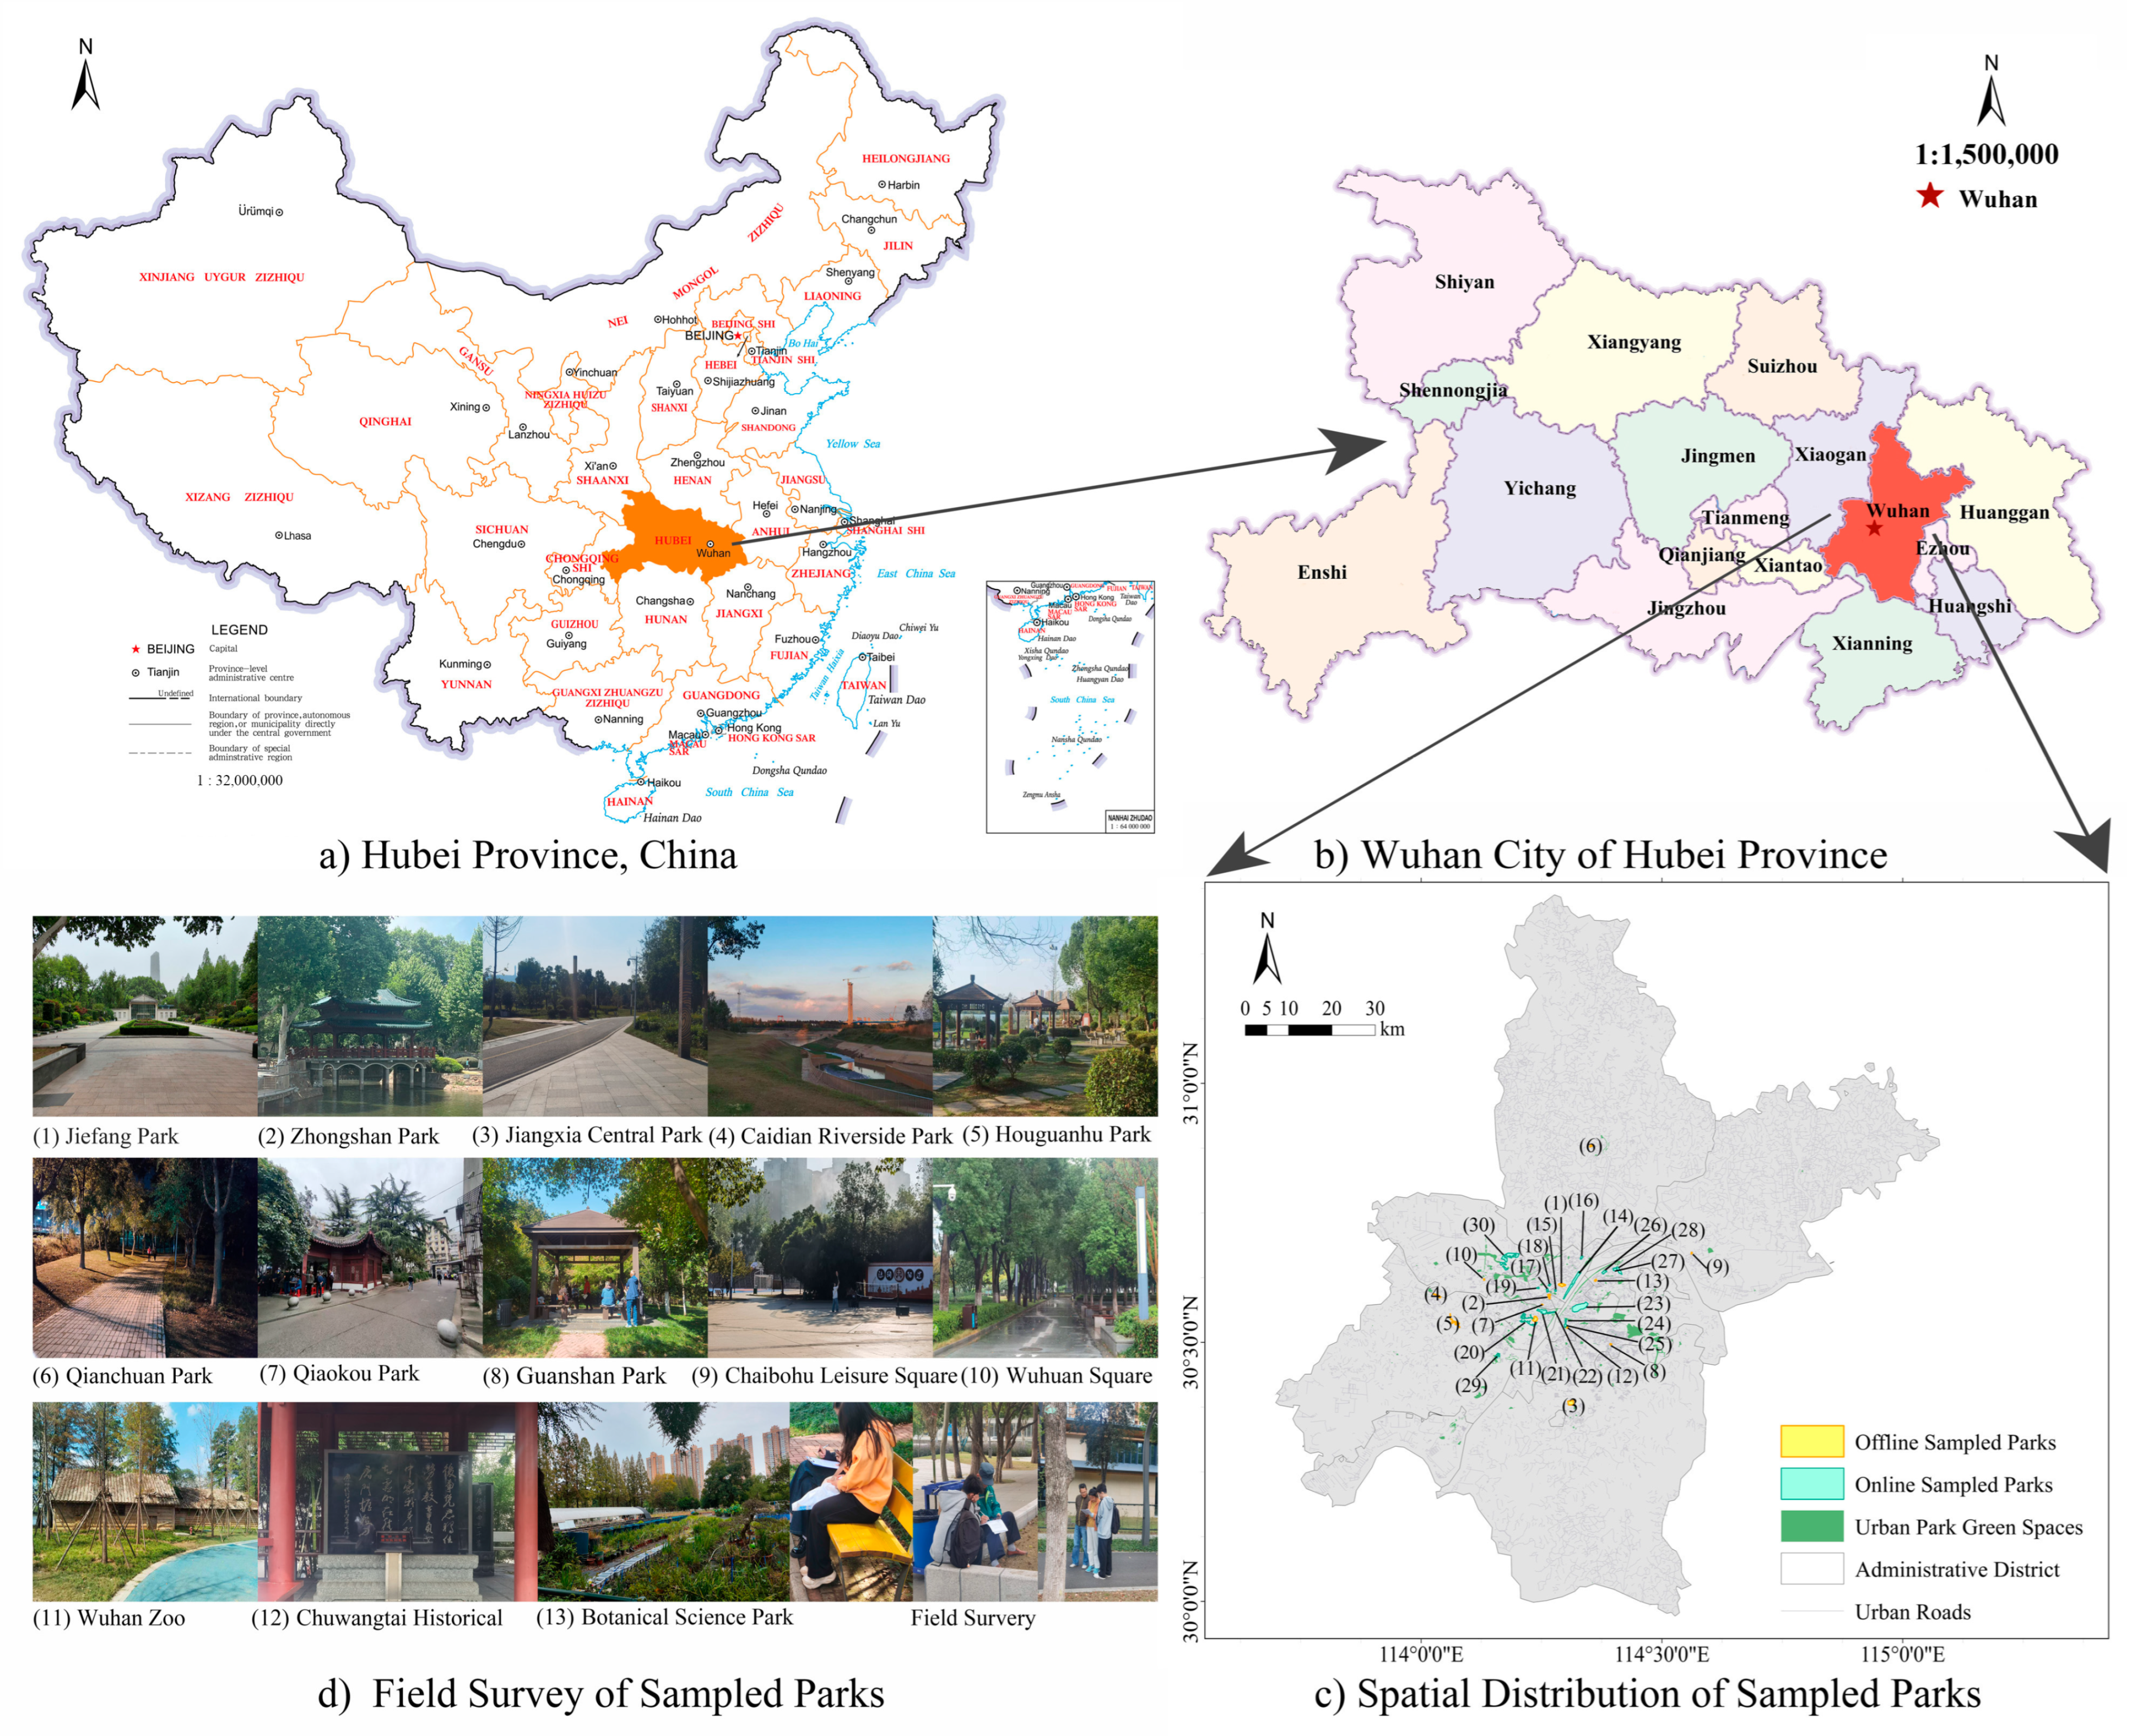
Regarding sample selection, this study implemented a stratified sampling strategy for both online and offline research subjects, guided by the principles of representativeness, feasibility, and data quality. For the online component, priority was given to data accessibility and the effectiveness of topic identification. Twenty parks in Wuhan’s central urban area were selected, covering a range of sizes and types, all of which exhibited active discussion on social media platforms to ensure diverse sources of textual reviews. For the offline component, emphasis was placed on geographical coverage, typological representativeness, and survey practicality. Thirteen parks were chosen from various administrative districts across Wuhan, representing different locations, scales, functions, and visitor profiles to strengthen the sample’s explanatory power. The study area and the locations of the online and offline parks are presented in Figure 1, with detailed park characteristics provided in Table 1.
As shown in Table 1, differences in composition exist between the online and offline park samples, which can be attributed to the underlying data generation mechanisms. The Weibo data are generated from users’ voluntary posts on a public platform. Consequently, the online sample naturally emphasizes parks with greater visibility and discussion frequency on social media, such as large comprehensive parks and iconic urban parks. These types of parks are more likely to stimulate public willingness to share, whereas smaller, community-based parks intended for daily use tend to have limited online presence on Weibo.
Online data may amplify the visibility of certain high-profile services, whereas offline data provide a more balanced representation of diverse service types. To ensure systematic representation of urban parks in terms of geographic location, scale, and typology, this study employed a stratified systematic sampling method for the offline questionnaire survey. One representative park was selected from each administrative district, covering four park types: comprehensive parks, neighborhood parks, ecological parks, and thematic parks. This approach aimed to capture the perceptions of park users under diverse functional, spatial, and locational conditions.
In summary, online data capture spontaneous and expansive public discourse generated by parks with heightened public appeal and online discussion, while offline data enables systematic measurement of park user experiences. Together, these complementary data sources contribute to a more multidimensional and comprehensive understanding of CES perceptions in UPGS.

2.2. Data Sources and Processing

The data utilized in this study encompass social media data, RSB, EBE, ILC, QSM, and residents’ perceptions of CES. Detailed information regarding each data source is provided in Table 2. This study collected review texts from Sina Weibo 15.5.0 as the primary data source. Following initial data cleaning of the social media texts obtained via web crawling, the Python-based jieba segmentation tool was employed for preprocessing. This included sentence splitting, word segmentation, removal of stop words, and synonym merging. Subsequently, BERTopic topic modeling and term frequency analysis were applied to analyze the textual data, extract residents’ perceived dimensions of CES, and identify the corresponding driving factors and their indicators. Spatial data for the EBE and ILC were processed in ArcGIS 10.8 to derive, for each park, metrics such as surrounding building density (SBD), transportation accessibility (TA), population density (PD), facility richness (FR), park area (PA), and water feature (WF). Subsequently, the continuous variables for EBE and ILC were transformed into five-point ordinal variables (1 = very low to 5 = very high). This transformation was based on two primary considerations. First, it ensured consistency in measurement scales, aligning the environmental variables with CES satisfaction, which was measured using a five-point Likert scale, thereby facilitating straightforward interpretation of the path coefficients. Second, it supported the analysis of moderating effects, as the categorical nature of RSB allowed for clearer logic when constructing interaction terms with the ordinal environmental variables, thereby facilitating the translation of findings into planning practice. Questionnaire data were analyzed using SPSS 27.0.1. Descriptive statistics summarized the respondents’ socio-demographic profiles. Reliability and validity analyses were performed to evaluate the measurement quality of both the intra-park environment management (IEM), visitor experience management (VEM), cultural promotion management (CPM), and residents’ perceived satisfaction with CES. Relationships among different CES dimensions were examined using Pearson correlation analysis to identify trade-offs and synergies. Friedman tests were conducted to determine if significant differences existed in satisfaction levels across the five CES categories. Finally, we employed PLS-SEM to assess the measurement and structural models, evaluating reliability, validity, path coefficients, and model fit. The moderating effect of RSB was tested through regression analysis.

2.3. Methods

2.3.1. Research Design

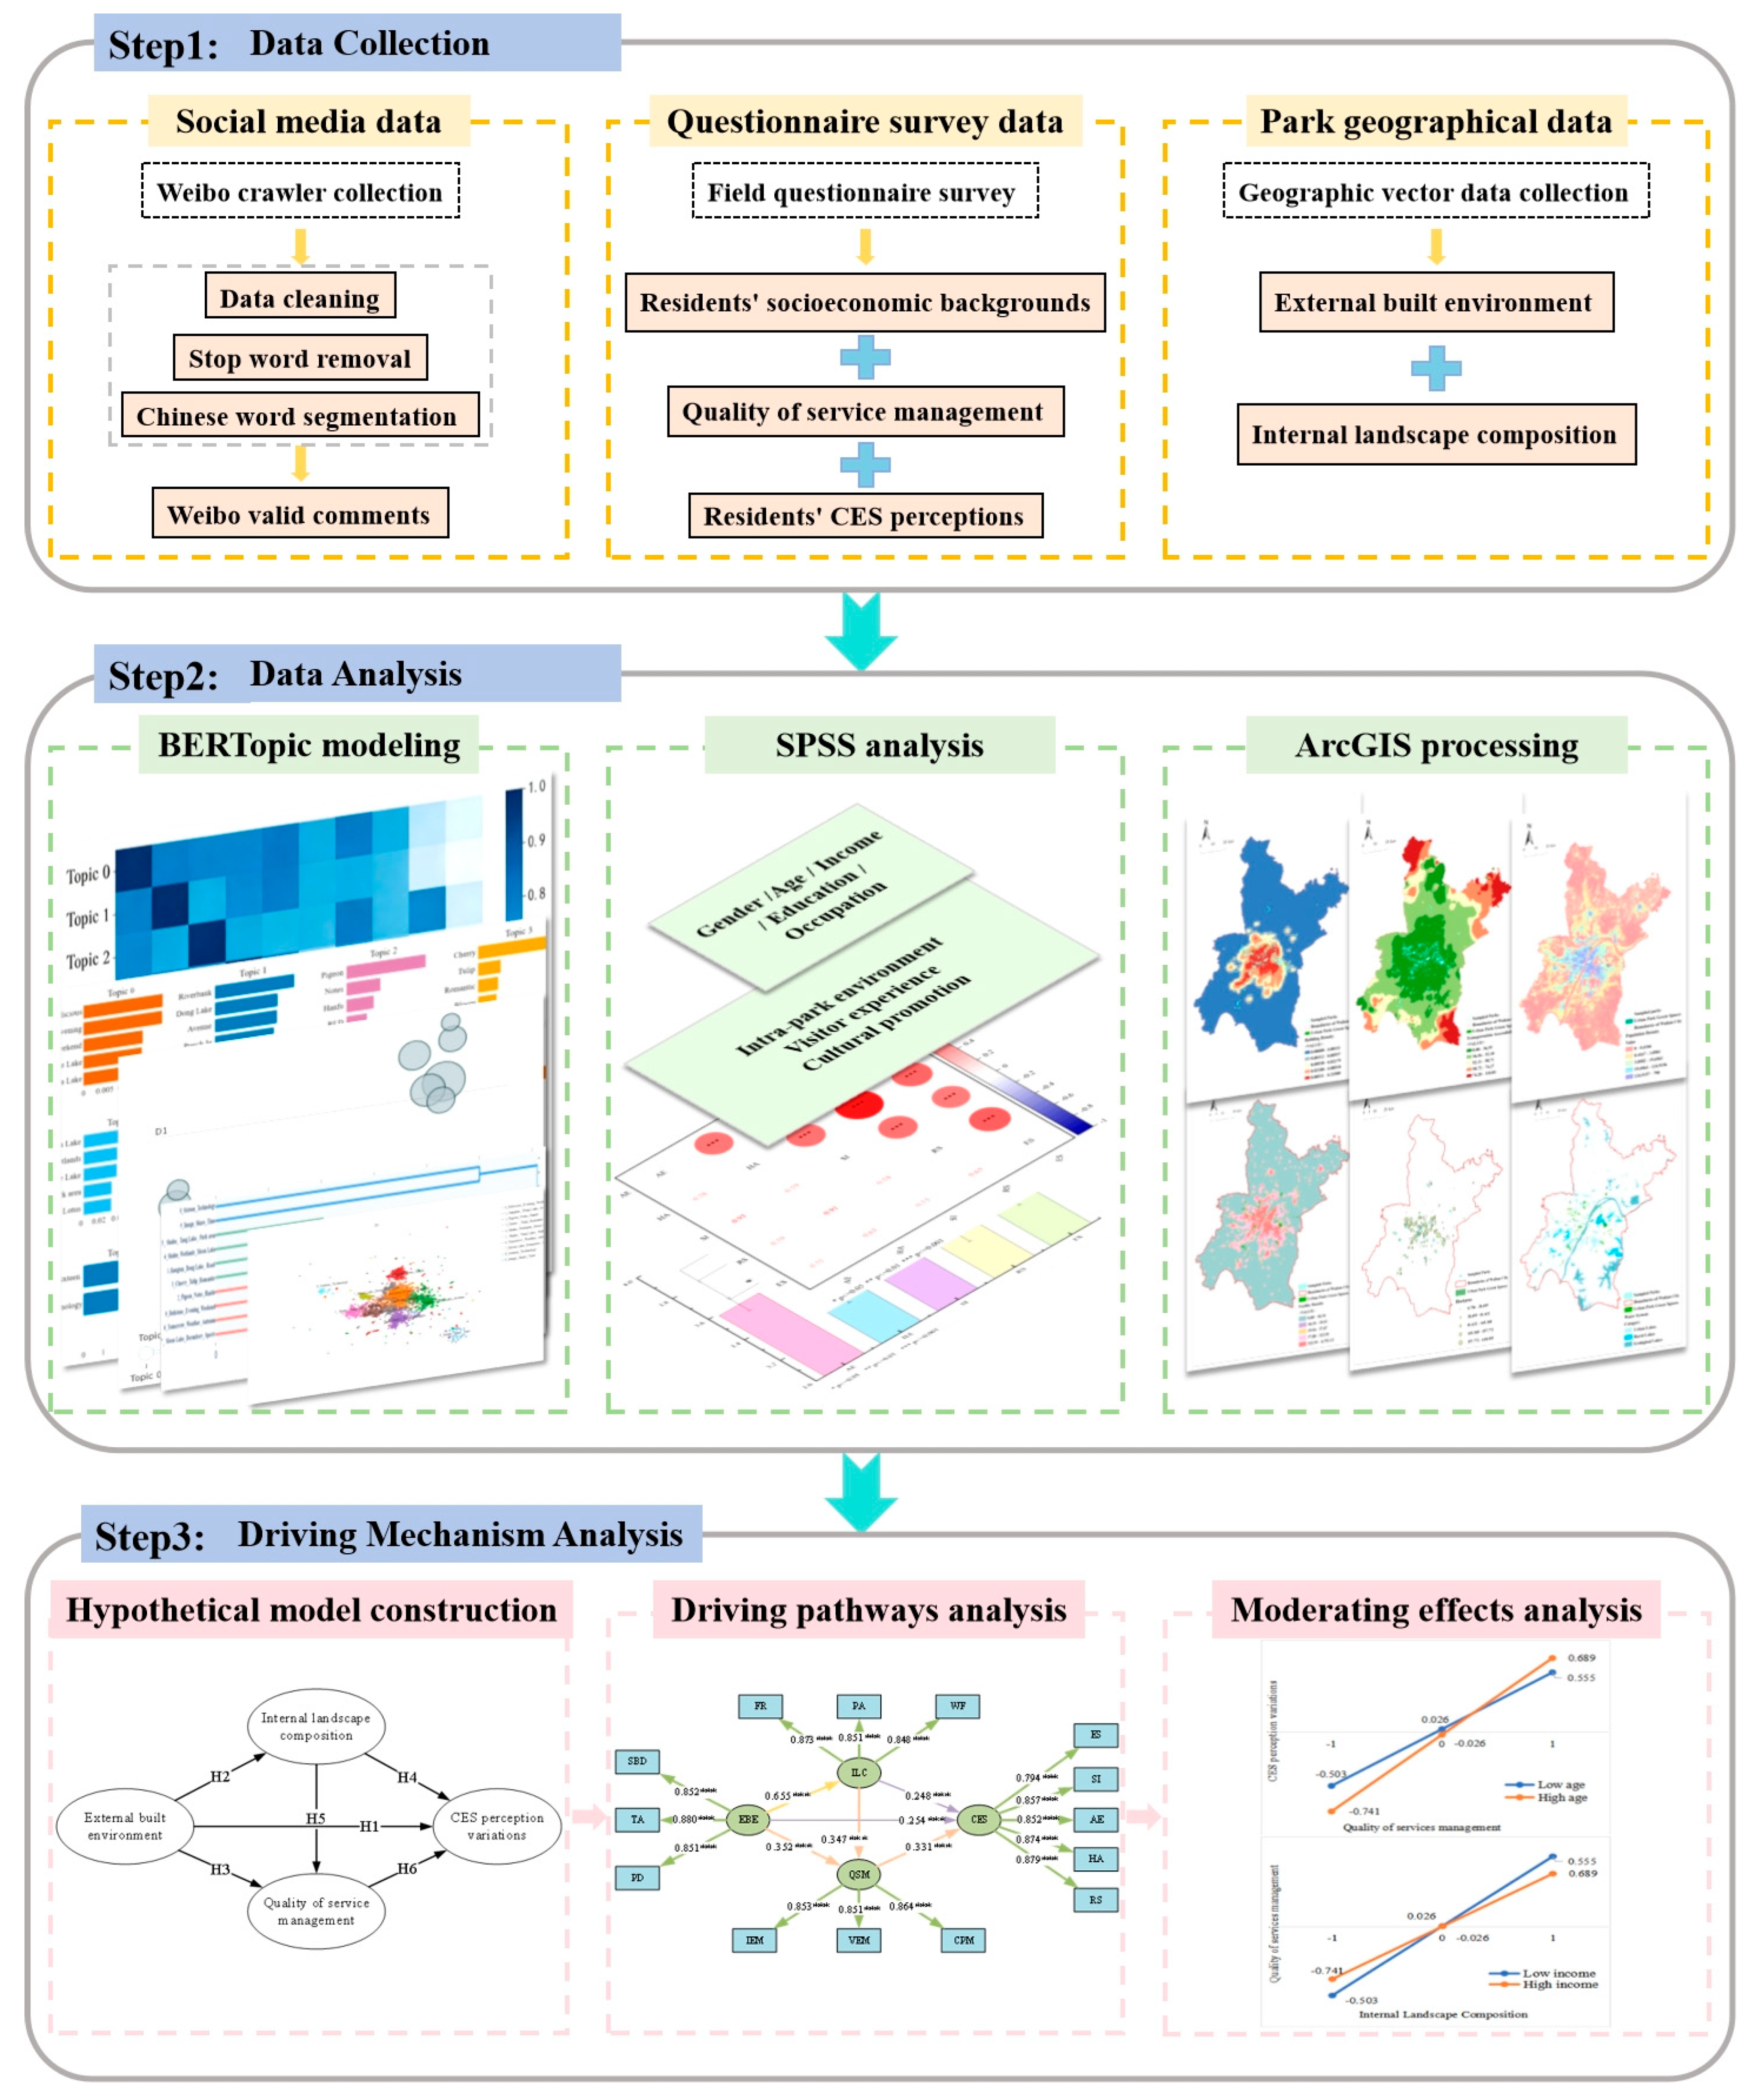
This study was conducted following the three methodological steps outlined below, with the corresponding technical workflow illustrated in Figure 2.
Step 1: Data collection. Social media data were collected from user-generated reviews on the Weibo platform. Questionnaire survey data encompassed RSB, QSM, and their evaluations of CES. Geospatial data included metrics related to the EBE and ILC.
Step 2: Data processing. The social media comments were analyzed using the BERTopic model to extract key CES perception dimensions and to identify underlying driving factors along with their observable indicators. Questionnaire data were processed using SPSS 27.0.1 software, involving correlation and difference analyses concerning CES perceptions. Geospatial data were processed and analyzed in ArcGIS 10.8, yielding specific metrics such as SBD, TA, PD, FR, PA, and WF.
Step 3: Analysis of driving mechanisms. First, a hypothesized model was constructed to explain the differences in residents’ CES perceptions. Second, PLS-SEM was applied to examine the driving mechanisms behind these perceptual differences. Finally, hierarchical regression analysis was employed to assess the moderating effects of residents’ socioeconomic backgrounds on the identified driving pathways.

2.3.2. Social Media Data Collection and Preprocessing

This study used Weibo as the data source for social media content related to UPGS. Textual reviews were collected from 20 parks in central Wuhan between July 2024 and July 2025 via web crawling of the platform’s API, resulting in an initial dataset of 17,836 comments.
During data cleaning, blank, duplicate, and clearly irrelevant entries were initially removed. A subsequent manual review was conducted to further exclude non-original texts, such as advertisements and automatically generated content, resulting in 12,083 valid original user comments retained for analysis. The inclusion criteria required that comments be original, contain specific park names, and exceed five characters in length. Entries identified as advertisements, completely irrelevant content, or duplicate posts were filtered out accordingly.
In the text preprocessing stage, the Jieba segmentation tool in Python 3.13.6 was employed for sentence segmentation and word tokenization. Multiple Chinese stop word lists and customized dictionaries were then integrated to remove semantically insignificant terms. Text normalization procedures, including traditional-simplified Chinese conversion and spelling correction, were also performed. To further reduce noise, emoticons and URLs embedded in the text were systematically removed.
Based on this processed corpus, word frequency analysis was conducted to calculate the occurrence frequency of each term, thereby assessing its relative importance. To avoid ambiguity, only multi-character words with substantive semantic meaning were retained in the high-frequency keyword statistics, while single-character terms were excluded. Word frequency analysis was subsequently applied to identify keywords from high-frequency terms, enabling the summarization of representative driving factors and their corresponding indicators. Topic extraction and analysis were performed using the BERTopic model. In alignment with the conceptual framework of CES, five core CES perception dimensions were ultimately derived.
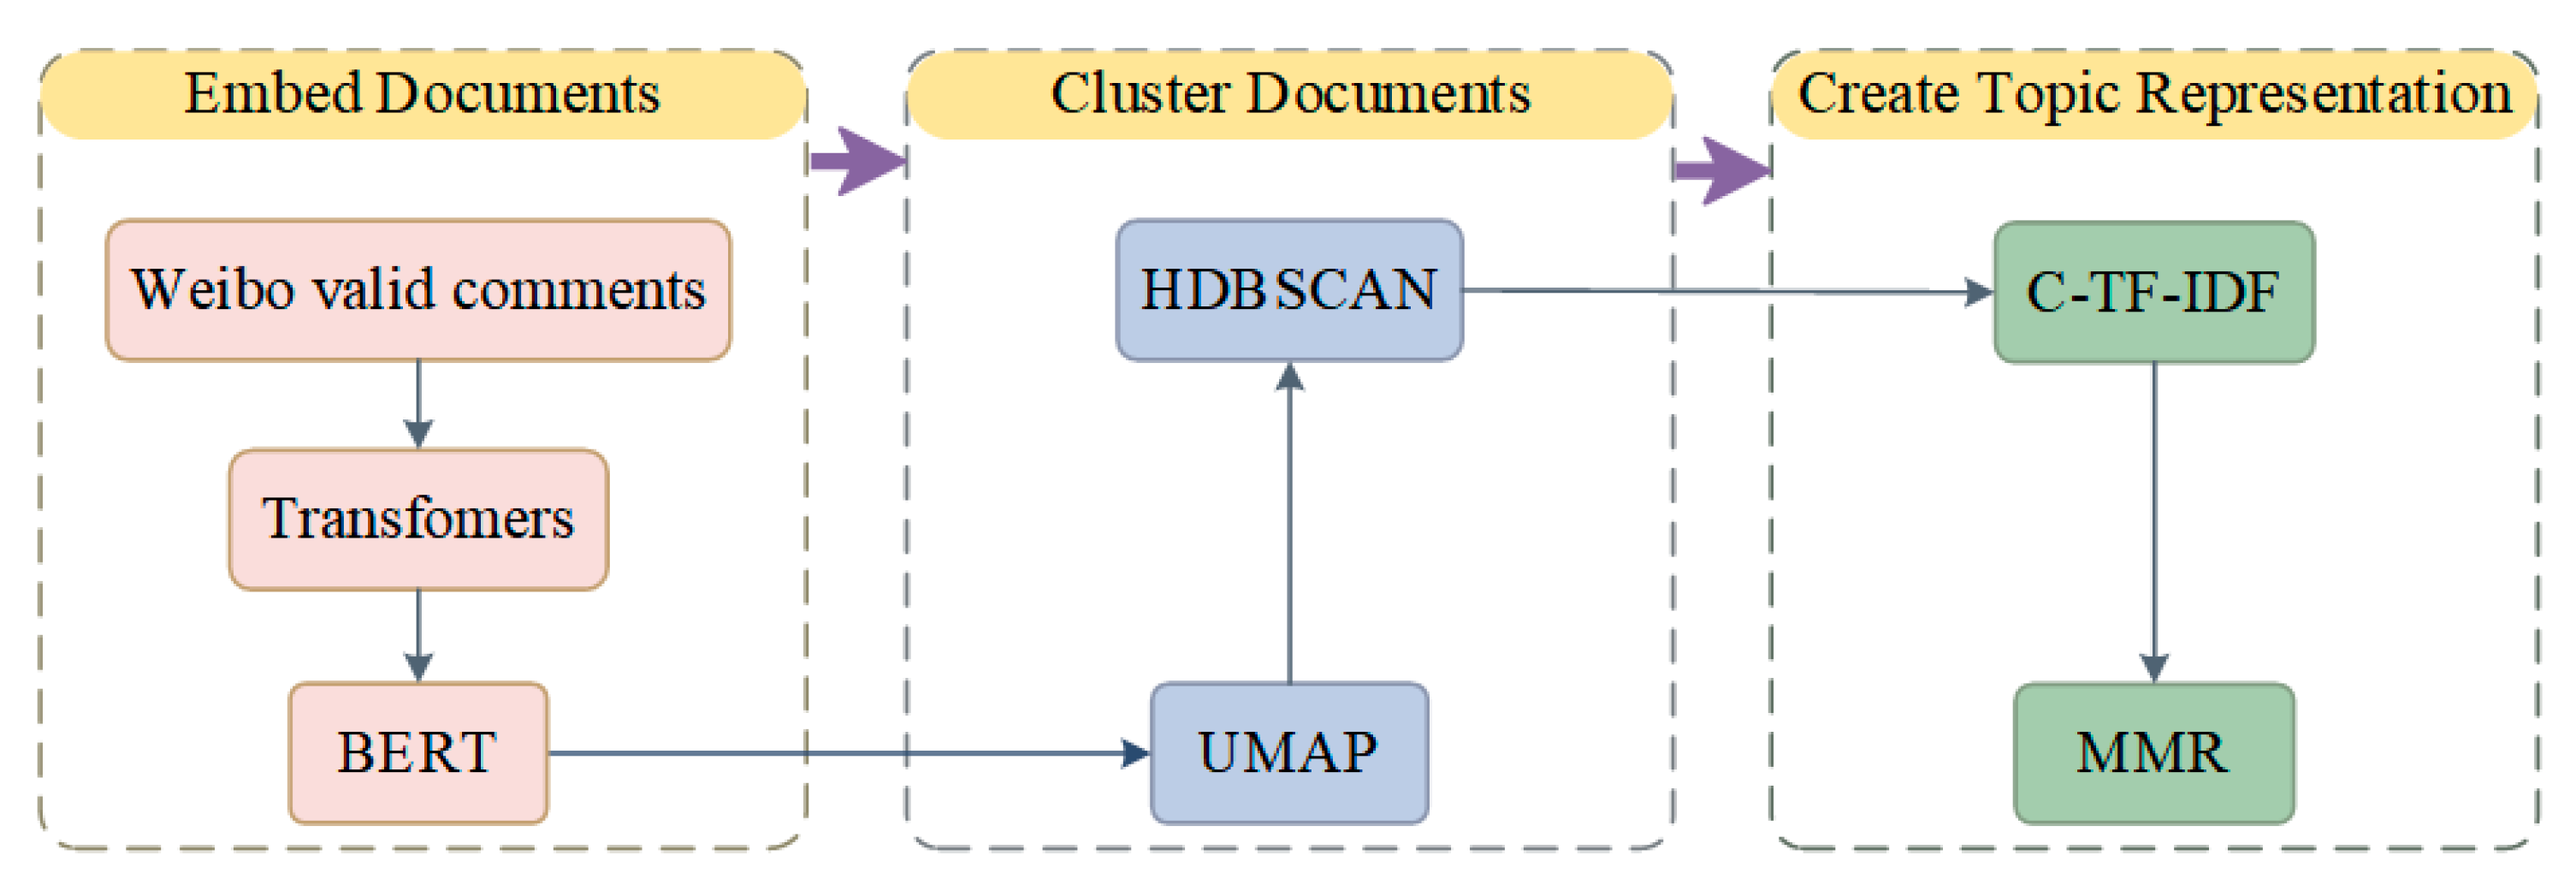
The BERTopic modeling procedure was systematically calibrated to suit the characteristics of the dataset, which consisted of 12,083 Weibo texts. Specifically, a pre-trained BERT model was initially employed to generate high-dimensional semantic embeddings. When applying UMAP for dimensionality reduction, the parameter configuration was deliberately selected to balance dataset size with the need to preserve global topic structure. The n_neighbors parameter was set to 50, which, given the dataset size, captures broad semantic associations by considering sufficiently large local neighborhoods, thereby helping to prevent overly fragmented clustering. The dimensionality reduction target, n_components, was set to 5 to achieve a balance between computational efficiency and the retention of meaningful semantic information. Additionally, min_dist was set to 0.0, allowing the embedded points to be densely arranged and creating favorable conditions for the subsequent density-based clustering performed by HDBSCAN.
For clustering analysis, the HDBSCAN algorithm was selected due to its capacity to identify clusters of varying densities without requiring the number of topics to be predetermined. The parameters were determined through an iterative process aimed at optimizing both the coherence and granularity of the resulting topics. The min_cluster_size parameter was set to 50 to ensure that each topic is supported by a sufficient number of documents, aligning to identify meaningful, non-spurious topics within the corpus of 12,083 texts. The min_samples parameter was set to 25 to provide a conservative estimate of cluster stability, thereby reducing the likelihood of outliers being incorrectly assigned to clusters. HDBSCAN was applied using the Euclidean distance metric, as it is the standard metric for the UMAP-reduced space.
To assess the robustness of the parameter configuration, a sensitivity analysis was conducted by systematically adjusting key parameters. The final selected configuration (n_neighbors = 50, min_cluster_size = 50) produced the most interpretable and stable topic clusters, characterized by lower topic overlap and higher average topic coherence scores. In contrast, other parameter configurations either resulted in excessively fragmented topics (with smaller min_cluster_size values) or led to the merging of conceptually distinct topics (with larger n_neighbors values). Ultimately, the c-TF-IDF method was applied to extract salient keywords and characterize each topic. The complete workflow is illustrated in Figure 3.
To ensure the ecological validity of the automated topic modeling results, a manual coding approach was employed to validate the thematic classification. First, a random sample of 500 comments was drawn from the full dataset as the coding sample. Two independent coders were trained to familiarize themselves with the definitions, characteristics, and boundaries of the ten initial topics. Prior to formal coding, a preliminary coding exercise was conducted to establish a shared understanding of the thematic content. During the formal coding process, the two coders independently classified the 500 sampled comments according to a predefined coding manual. A forced-choice approach was adopted, whereby each comment was assigned to the most appropriate topic based on its core semantic content. Comments that could not be clearly assigned to any existing topic were categorized as “other”, with the reason for this designation documented. Throughout the coding process, the coders made independent judgments without discussion. Upon completion of the coding, inter-coder agreement was assessed using Cohen’s Kappa coefficient to account for chance-corrected consistency. If an acceptable Kappa value was achieved, this indicated satisfactory inter-coder reliability. If the reliability did not meet the threshold, the coders collaboratively discussed the discrepant items to reach consensus, and a second round of coding was conducted on the disputed samples until overall reliability was deemed acceptable. Subsequently, the results of the manual coding were compared with the output of the automated topic modeling to validate the model’s effectiveness.
After obtaining the ten initial topics through the BERTopic model, the thematic results were systematically interpreted and refined by drawing upon internationally recognized classification frameworks, such as the Millennium Ecosystem Assessment (MA) and the Common International Classification of Ecosystem Services (CICES). Taking into account the specific characteristics of UPGS and the actual perceptions of residents, the initial topics were transformed into theoretically grounded CES dimensions. The specific process and criteria for merging the topics are outlined as follows.
As a first step, a semantic similarity matrix was calculated among all initial topics. For each topic, all representative keywords were input into a pre-trained Chinese BERT model to obtain an average vector representation. The pairwise cosine similarity between topics was then computed based on these vector representations. Topic pairs with similarity scores exceeding a preset threshold (>0.70) were identified as candidate pairs for merging, indicating a high degree of proximity in the latent semantic space. Subsequently, an in-depth qualitative content review was conducted on these candidate topic pairs to ensure that any merger was supported by substantive textual grounding. The review process included the following steps. First, the overlap and semantic association between the top 10 representative keywords of each candidate topic pair were examined. Second, the 20 most representative original comments under each topic were manually reviewed to determine whether the core meanings or experiential descriptions expressed were consistent. Only when a high degree of conceptual alignment was observed in both keyword composition and representative textual content were the topics considered for subsequent merging. Finally, it was ensured that the final merged results remained compatible with authoritative theoretical frameworks of CES. The merged CES dimensions were systematically aligned with service categories defined within these frameworks, thereby ensuring that each dimension had a clear theoretical basis and corresponding nomenclature.
The Weibo data used in this study consist of publicly available user-generated content. In accordance with platform regulations and privacy ethics, personal identity information of the commenters could not be obtained. To assess the stability of CES dimension identification across different user groups, a proxy variable was employed for user segmentation and sensitivity analysis. User groups were delineated based on the time of comment posting (daytime versus nighttime). The BERTopic model was then reapplied to each of these sub-datasets, and the resulting topic structures were compared with those derived from the global model to evaluate their similarity.
As a comparative and complementary measure, the principles of sampling representativeness were strictly adhered to during the subsequent collection of questionnaire data. In both the pilot and formal survey stages, stratified sampling was employed to ensure a balanced distribution of respondents across key demographic characteristics, including age, gender, occupation, and income. This approach was intended to complement the social media data by providing a more demographically representative perspective on CES perceptions.

2.3.3. Questionnaire Design and Implementation

A pilot study preceded formal data collection to ensure methodological robustness. The preliminary questionnaire was designed with three structured sections. First, comprehensive socioeconomic and demographic data collection encompassing gender, age, income, educational attainment, and occupation. Second, evaluation of QSM, operationalized through 5-point Likert scales (1 = lowest to 5 = highest appraisal) across three domains: intra-park environment, visitor experience, and cultural promotion. Third, assessment of CES satisfaction, quantifying perceived CES quality through parallel 5-point Likert scales (1 = completely dissatisfied to 5 = extremely satisfied). The research team administered 40 questionnaires at Jiefang Park on 12 October 2025, yielding 35 valid responses. The respondents were also asked for feedback on the clarity and user-friendliness of the preliminary questionnaire, including the comprehensibility of its content and the appropriateness of its format, to improve the validity of the survey results. Reliability and validity analyses were subsequently performed on the pilot data using SPSS 27.0.1 software. The overall Cronbach’s alpha coefficient was 0.896, indicating strong internal consistency reliability. The KMO measure was 0.818, reflecting adequate structural validity. These results confirm the suitability of the questionnaire for the subsequent formal investigation and analysis.
Based on the pilot study findings, the preliminary questionnaire was optimized through iterative refinements, including linguistic clarification of items and response options, as well as enhanced layout design, culminating in the finalized survey instrument. The formal questionnaire retains the tripartite structure, with detailed content specifications provided in Appendix A. According to Robert, the sample size for the questionnaire survey should meet a minimum threshold of ten participants per predictor variable to ensure robust statistical power [48]. The conceptual model incorporated nine factors that influence residents’ CES perception variations. Formal surveys were conducted across 13 selected sample parks in Wuhan from October 14 to 28 October 2025. A total of 325 questionnaires were distributed, with 313 valid responses collected, meeting the predetermined sample size requirements for robust statistical analysis. During the survey process, all respondents were actively engaged in park activities and demonstrated sufficient familiarity with CES-related concepts, thereby ensuring the collection of authentic and reliable data. Reliability and validity tests were conducted on the finalized survey data using SPSS 27.0.1.

2.3.4. Driver Model Construction and Validation

(1)
Hypothetical Model Construction
Structural Equation Modeling (SEM) is a multivariate statistical technique used to analyze complex relationships among observed and latent variables. It consists of a measurement model, which links indicators to their underlying constructs, and a structural model, which estimates the causal pathways between latent variables. PLS-SEM is particularly suitable for theory development and exploratory research.
In this study, PLS-SEM was selected for several reasons. First, the sample size (N = 313) is relatively modest, and PLS-SEM is recognized for its capacity to handle smaller samples effectively. Second, the research objectives involve predicting and exploring complex mediating and moderating relationships, an area in which PLS-SEM excels. Third, PLS-SEM does not require strict multivariate normality of the data, making it robust for real-world data distributions. By simultaneously estimating both components of the model, it effectively handles complex causal structures and is adept at uncovering theoretical relationships that can be challenging to identify with covariance-based methods. The following hypotheses are proposed based on driving factors and observed indicators derived from social media data, and a structural model of the driving mechanisms for residents’ perception differences in UPGS is constructed.
(i) Hypotheses Concerning the External Built Environment of Parks.
The external built environment of UPGS functions as a key exogenous latent variable, playing a foundational role in shaping residents’ perceptions of CES. Empirical evidence indicates that high transportation accessibility not only significantly increases residents’ frequency of park use and improves experiential quality but also directly enhances the perceived intensity of recreational, aesthetic, and cultural identity services by strengthening the connection between parks and communities [49]. When parks are located within easily accessible distances for residents, as envisioned in the “15-min city” planning concept, their role as providers of cultural services becomes fully activated and utilized. Rational planning of the surrounding built environment can also provide functional and structural support for the internal landscape, thereby improving its overall scenic value and ecological coherence [50]. Furthermore, a high-quality external built environment may indirectly elevate park management responsiveness and service quality [51]. Synthesizing these findings, we posit the following hypothesis:
H1. 
The EBE has a positive effect on residents’ perception variations of CES in UPGS.
H2. 
The EBE has a positive effect on the ILC.
H3. 
The EBE has a positive effect on the QSM.
(ii) Hypotheses Concerning the Internal Landscape Composition of Parks.
Within the formative mechanism of perceived disparities in CES in UPGS, the internal landscape composition acts as a key material carrier that directly shapes residents’ experiential perceptions and influences the implementation of management services. Research indicates that the diversity of facilities, the scale of the area, and the configuration of natural elements such as water bodies collectively constitute the core physical dimensions affecting CES provision. Specifically, a high richness of amenities and landscape heterogeneity not only helps attract user groups with diverse preferences but also significantly enhances the perceived intensity of multidimensional services, including aesthetic appreciation, recreation, and cultural education [52]. Furthermore, well-conceived internal landscape design provides the essential physical foundation and spatial framework for management services: a clearly arranged facility system can reduce operational and maintenance costs, scientifically zoned functional areas improve service response efficiency, and ecological landscape structures can effectively mitigate maintenance pressures through their self-regulating capacity. Thus, the internal landscape composition is not only a direct source of CES perceptions but also, through its synergistic integration with the management service system, collectively shapes the overall quality and sustainability of the socio-ecological services provided by UPGS. Based on this synthesis, the following hypothesis is proposed:
H4. 
The ILC has a positive effect on residents’ perception variations of CES in UPGS.
H5. 
The ILC has a positive effect on the QSM.
(iii) Hypothesis Concerning the Quality of Service Management.
Within the formative mechanism of CES perception disparities, service management quality does not function as an independent exogenous variable. Rather, it acts as a critical mediating factor that is jointly driven by the external built environment and the internal landscape composition, thereby directly influencing residents’ CES experiences. Different dimensions of service management strategies exhibit notable divergence in their cultural dissemination effects: digital media promotions demonstrate stronger appeal to younger demographics, while heritage-based immersive programs are more likely to gain value recognition from groups with high cultural capital. Optimized service management enhances CES perception quality primarily through two mechanistic pathways: first, by providing targeted cultural content that strengthens emotional resonance among visitors; and second, by implementing professional service that improves on-site experiential quality. Such improvements in management efficacy not only directly boost visitor satisfaction but may also reinforce overall CES perception intensity by prolonging dwell time and other behavioral responses. Based on this synthesis, the following hypothesis is proposed regarding park service quality management:
H6. 
The QSM has a positive effect on residents’ perception variations of CES in UPGS.
(iv) The Moderating Effect of Residents’ Socioeconomic Backgrounds.
Within the mathematical modeling framework, a moderator describes a specific role characterizing the relationship between variables. When examining the influence of an independent variable on a dependent variable, the presence of a moderating variable may alter this relationship. This study collected data on residents’ socioeconomic backgrounds via questionnaires, treating them as potential moderators, including gender, age, income, educational attainment, and occupation. Prior research indicates that these factors correlate with perceived differences in CES [18,27]. However, categorical variables such as gender and occupation are unsuitable for inclusion as latent variables in the model structure. Given this understanding, we utilized hierarchical regression to examine the significance of socioeconomic background as a moderator of the model relationships.
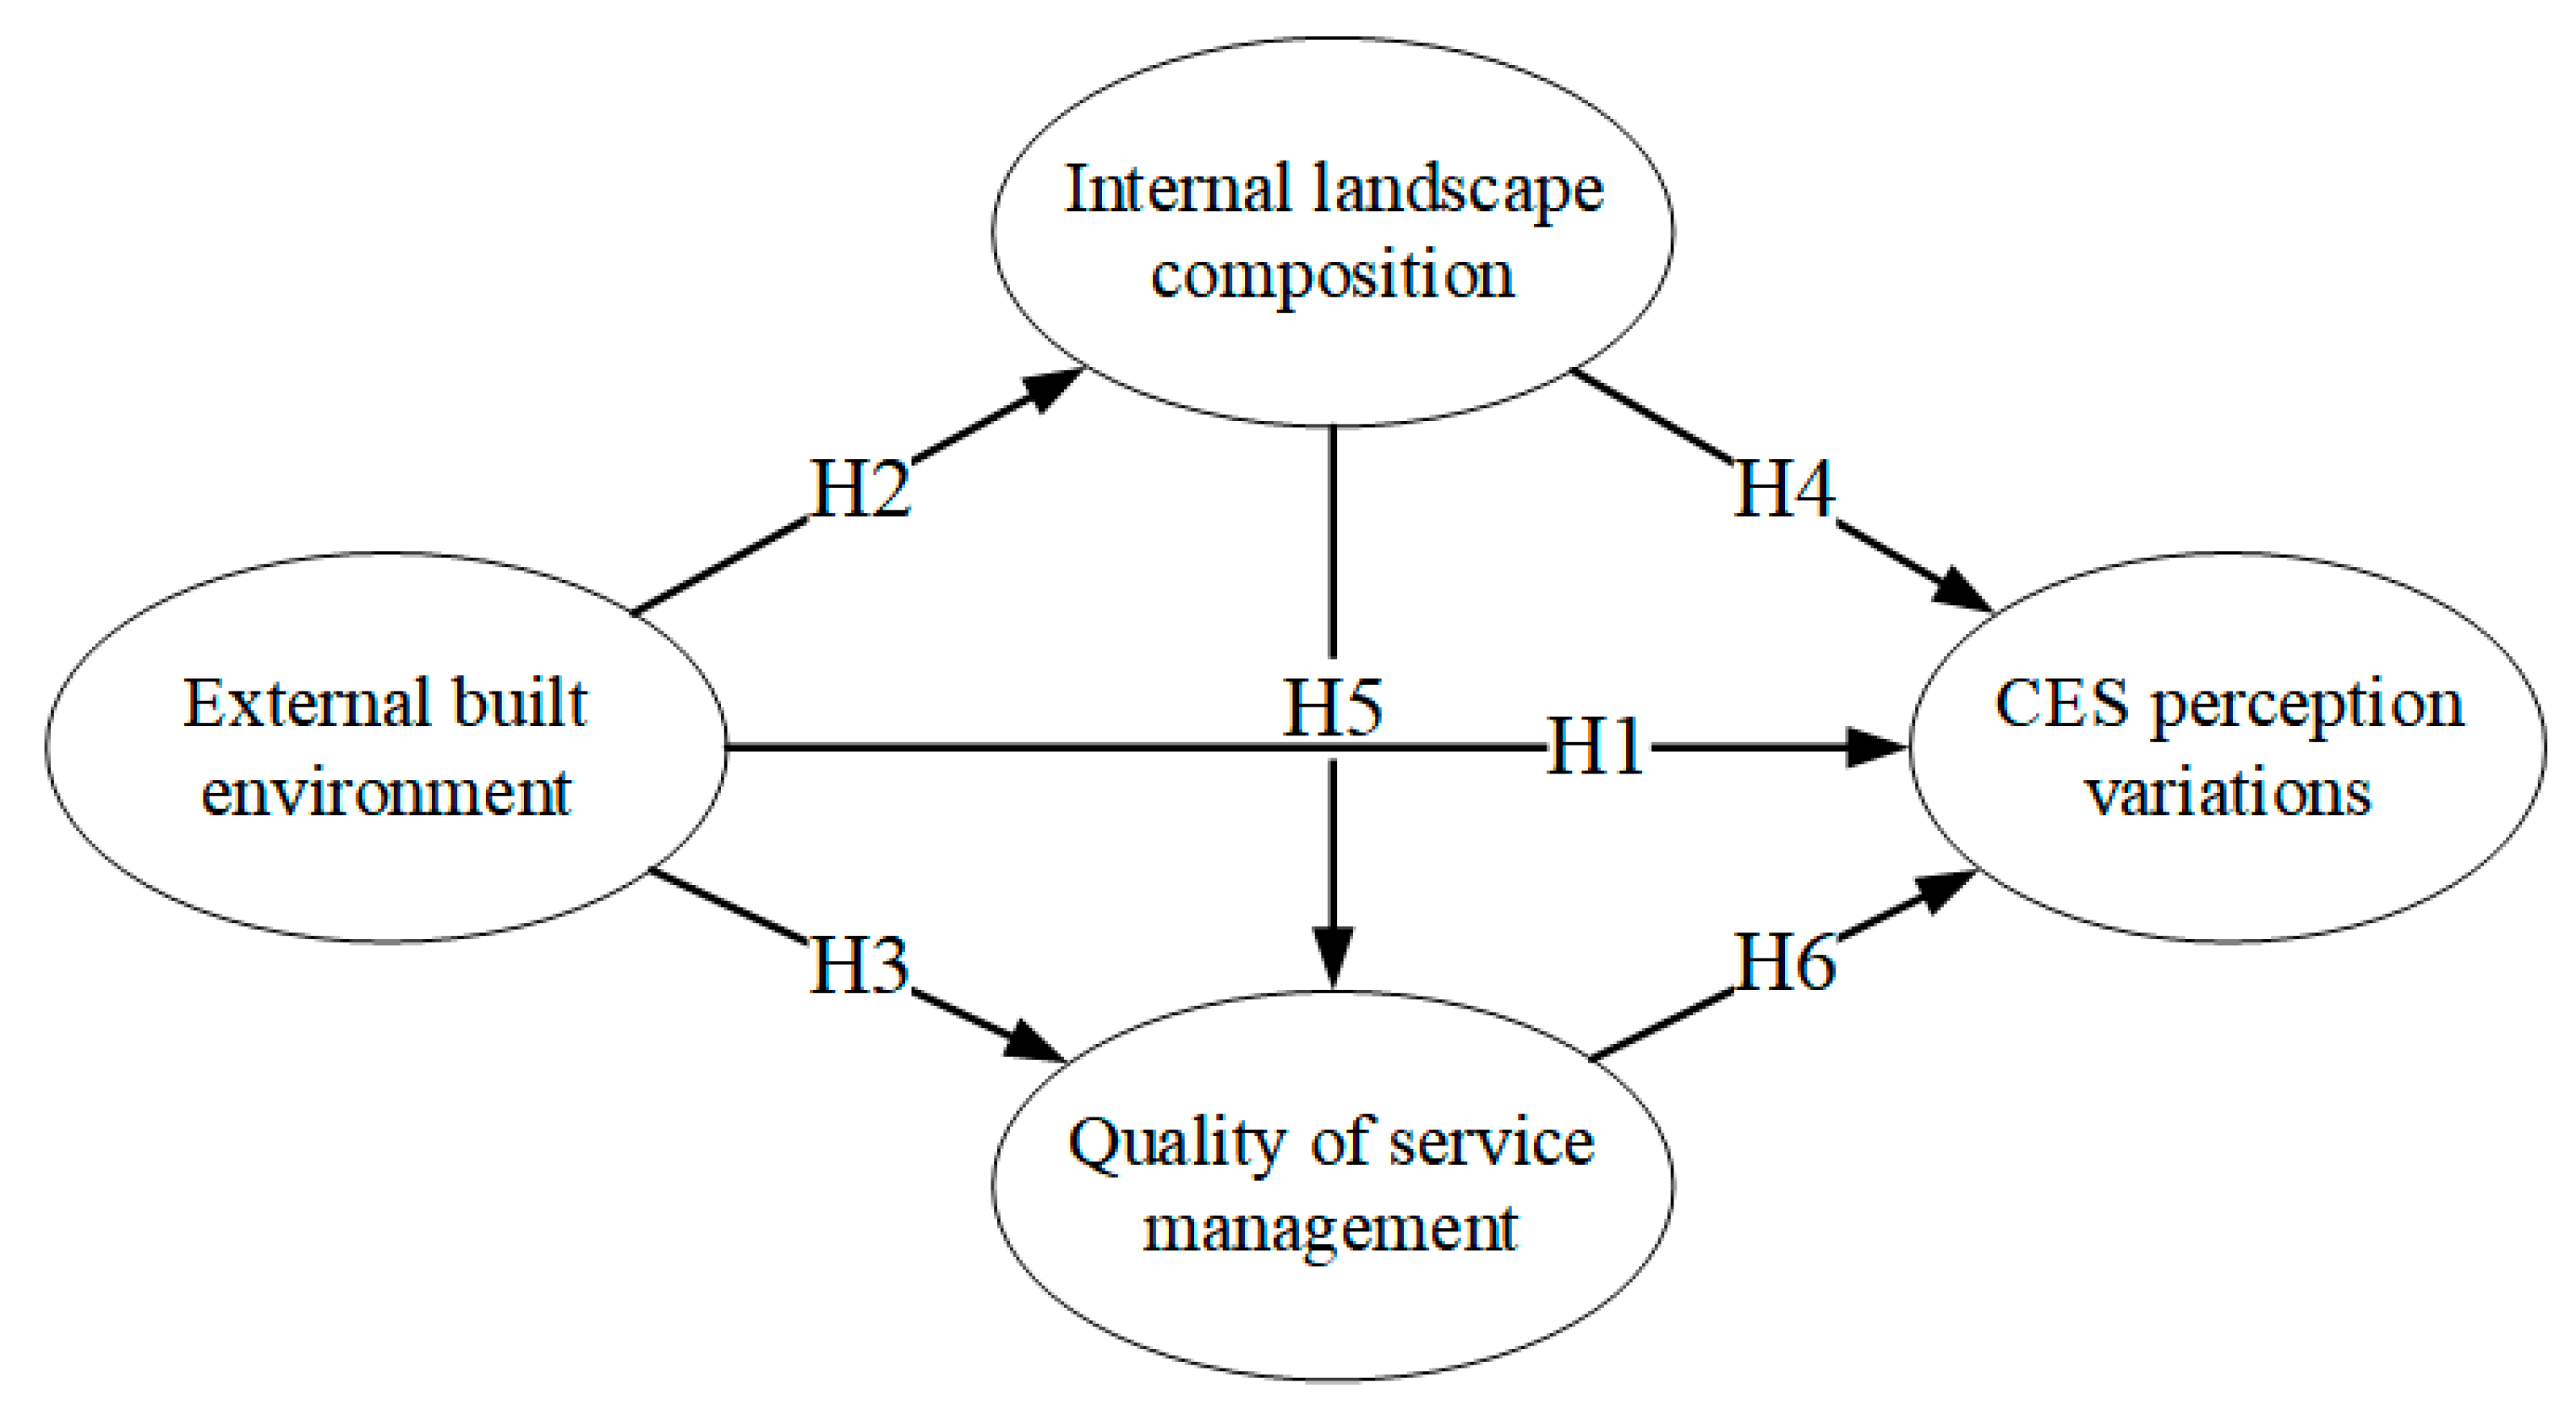
Accordingly, the conceptual model depicted in Figure 4 delineates the linkages between EBE, ILC, QSM, and residents’ perception variations of CES. Within this model, RSB is incorporated as a moderating variable to examine its influence on the aforementioned pathways.
In theoretical modeling, a moderating effect refers to the influence exerted by a variable (the moderator) on the strength or direction of the relationship between an independent variable and a dependent variable. To accurately identify such an effect, this study employs a regression-based analytical approach, the core of which lies in examining the statistical significance of the interaction term between the moderator and the independent variable. The regression equation utilized to test for this moderating effect is specified as follows:
Y = aX + bM + cXM + e
where X is the independent variable, Y is the dependent variable, and M represents the moderator. XM is calculated as their product.
(2)
Validation of Driving Model
This study evaluated the measurement model by examining standardized factor loadings, Cronbach’s alpha, Composite Reliability (CR), and Average Variance Extracted (AVE) to assess convergent validity and reliability [53,54,55]. Discriminant validity, which reflects the extent to which a latent variable is empirically distinct from other constructs in the structural model, was verified using both the Fornell-Larcker criterion and the Heterotrait-Monotrait ratio of correlations (HTMT) [55,56]. Specifically:
AVE   =   ( γ 2 ) / n
where γ is the factor loadings, n is the number of measurement indicators for that factor.
CR = ( γ ) 2 / ( ( γ ) 2 + δ )
where γ is the factor loadings, δ is the residual variances.
The structural model was evaluated based on the significance and magnitude of the standardized path coefficients.
Given that both Service QSM and CES perception data were collected from the same questionnaire, a rigorous assessment of common method bias (CMB) was conducted. Procedurally, several measures were implemented to minimize potential sources of bias. These included anonymous questionnaire administration, instructions emphasizing that there were no right or wrong answers, and randomized presentation of items to reduce response patterns. These steps were designed to mitigate common method bias arising from the survey context itself. Statistically, this study employed the full collinearity variance inflation factor (VIF) test proposed by Kock to diagnose common method bias. By calculating VIF values for all latent variables in the model, this approach effectively identifies potential systematic distortion caused by the presence of a single latent factor influencing the observed relationships. Compared to the traditional Harman’s single-factor test, this method offers a more rigorous and accurate diagnostic criterion [57]. The overall model fit was assessed using the coefficient of determination (R2), and predictive relevance was examined via the Q2 statistic, providing a comprehensive validation of the model’s explanatory and predictive strength [58,59]. Additionally, the global model fit was evaluated with the Goodness-of-Fit (GoF) index [60]. Additionally, ƒ2 indicates the assessment of effect magnitude and is used to evaluate whether an omitted construct exerts a substantial influence on an endogenous construct [58]. Specific evaluation criteria for these indices are summarized in Table 3.

3. Results

3.1. Descriptive Findings from Dual Sources

3.1.1. Identification of CES Perception Dimensions

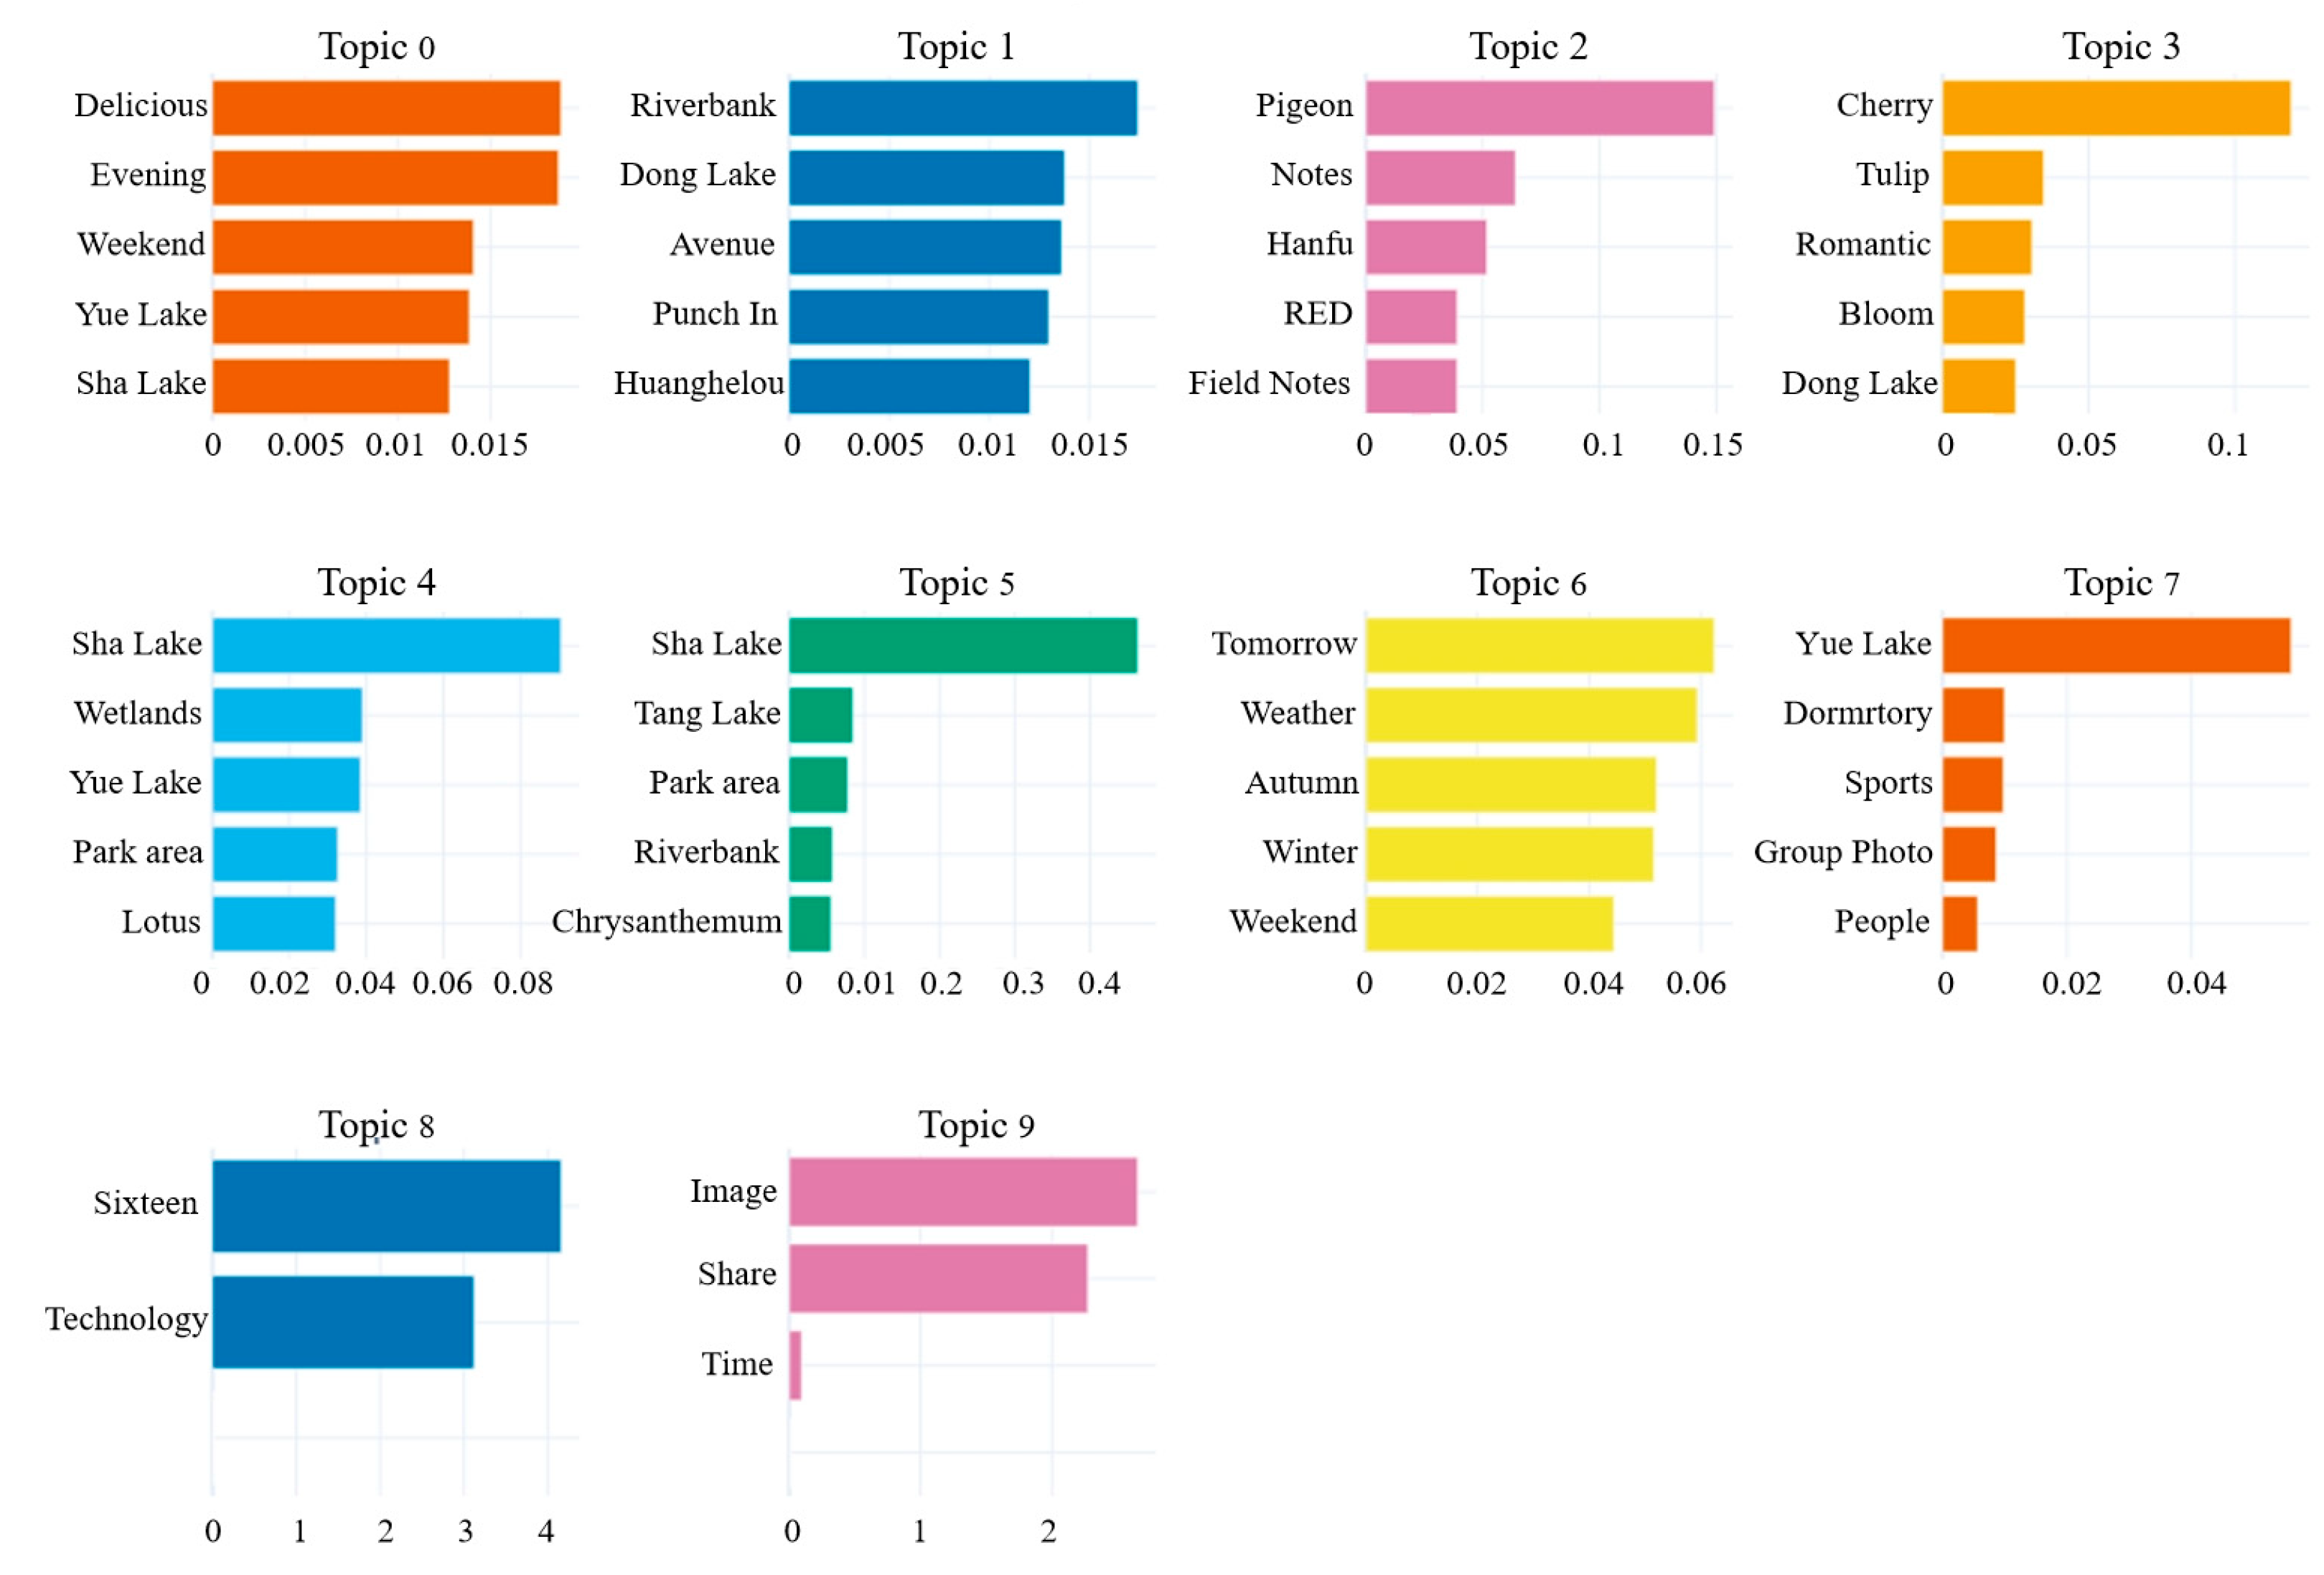
Based on the BERTopic topic modeling of collected Weibo comments, ten thematically distinct topics with high semantic salience were identified. As illustrated in Figure 5, the topic bar chart visually displays the top five representative keywords for each topic. The analysis reveals that residents’ perceptions of CES in UPGS exhibit the following structured characteristics. First, recreational activities demonstrate significant temporal dependency, correlating with specific diurnal periods and seasonal cycles (Topics 0, 6). Second, distinctive landscapes and natural features constitute the core attractions of park experiences (Topics 3, 4, 5). Third, parks function dually as physical venues for offline social interaction and as virtual platforms for online engagement (Topics 2, 9), while also promoting physical and mental well-being and facilitating collective activities (Topic 7). Furthermore, although topics directly related to “technology” account for a relatively low proportion (Topics 1, 8), their emergence indicates that science-popularization and cultural dissemination experiences have gradually entered residents’ perceptual scope, reflecting a contemporary extension of the functional connotations of UPGS.
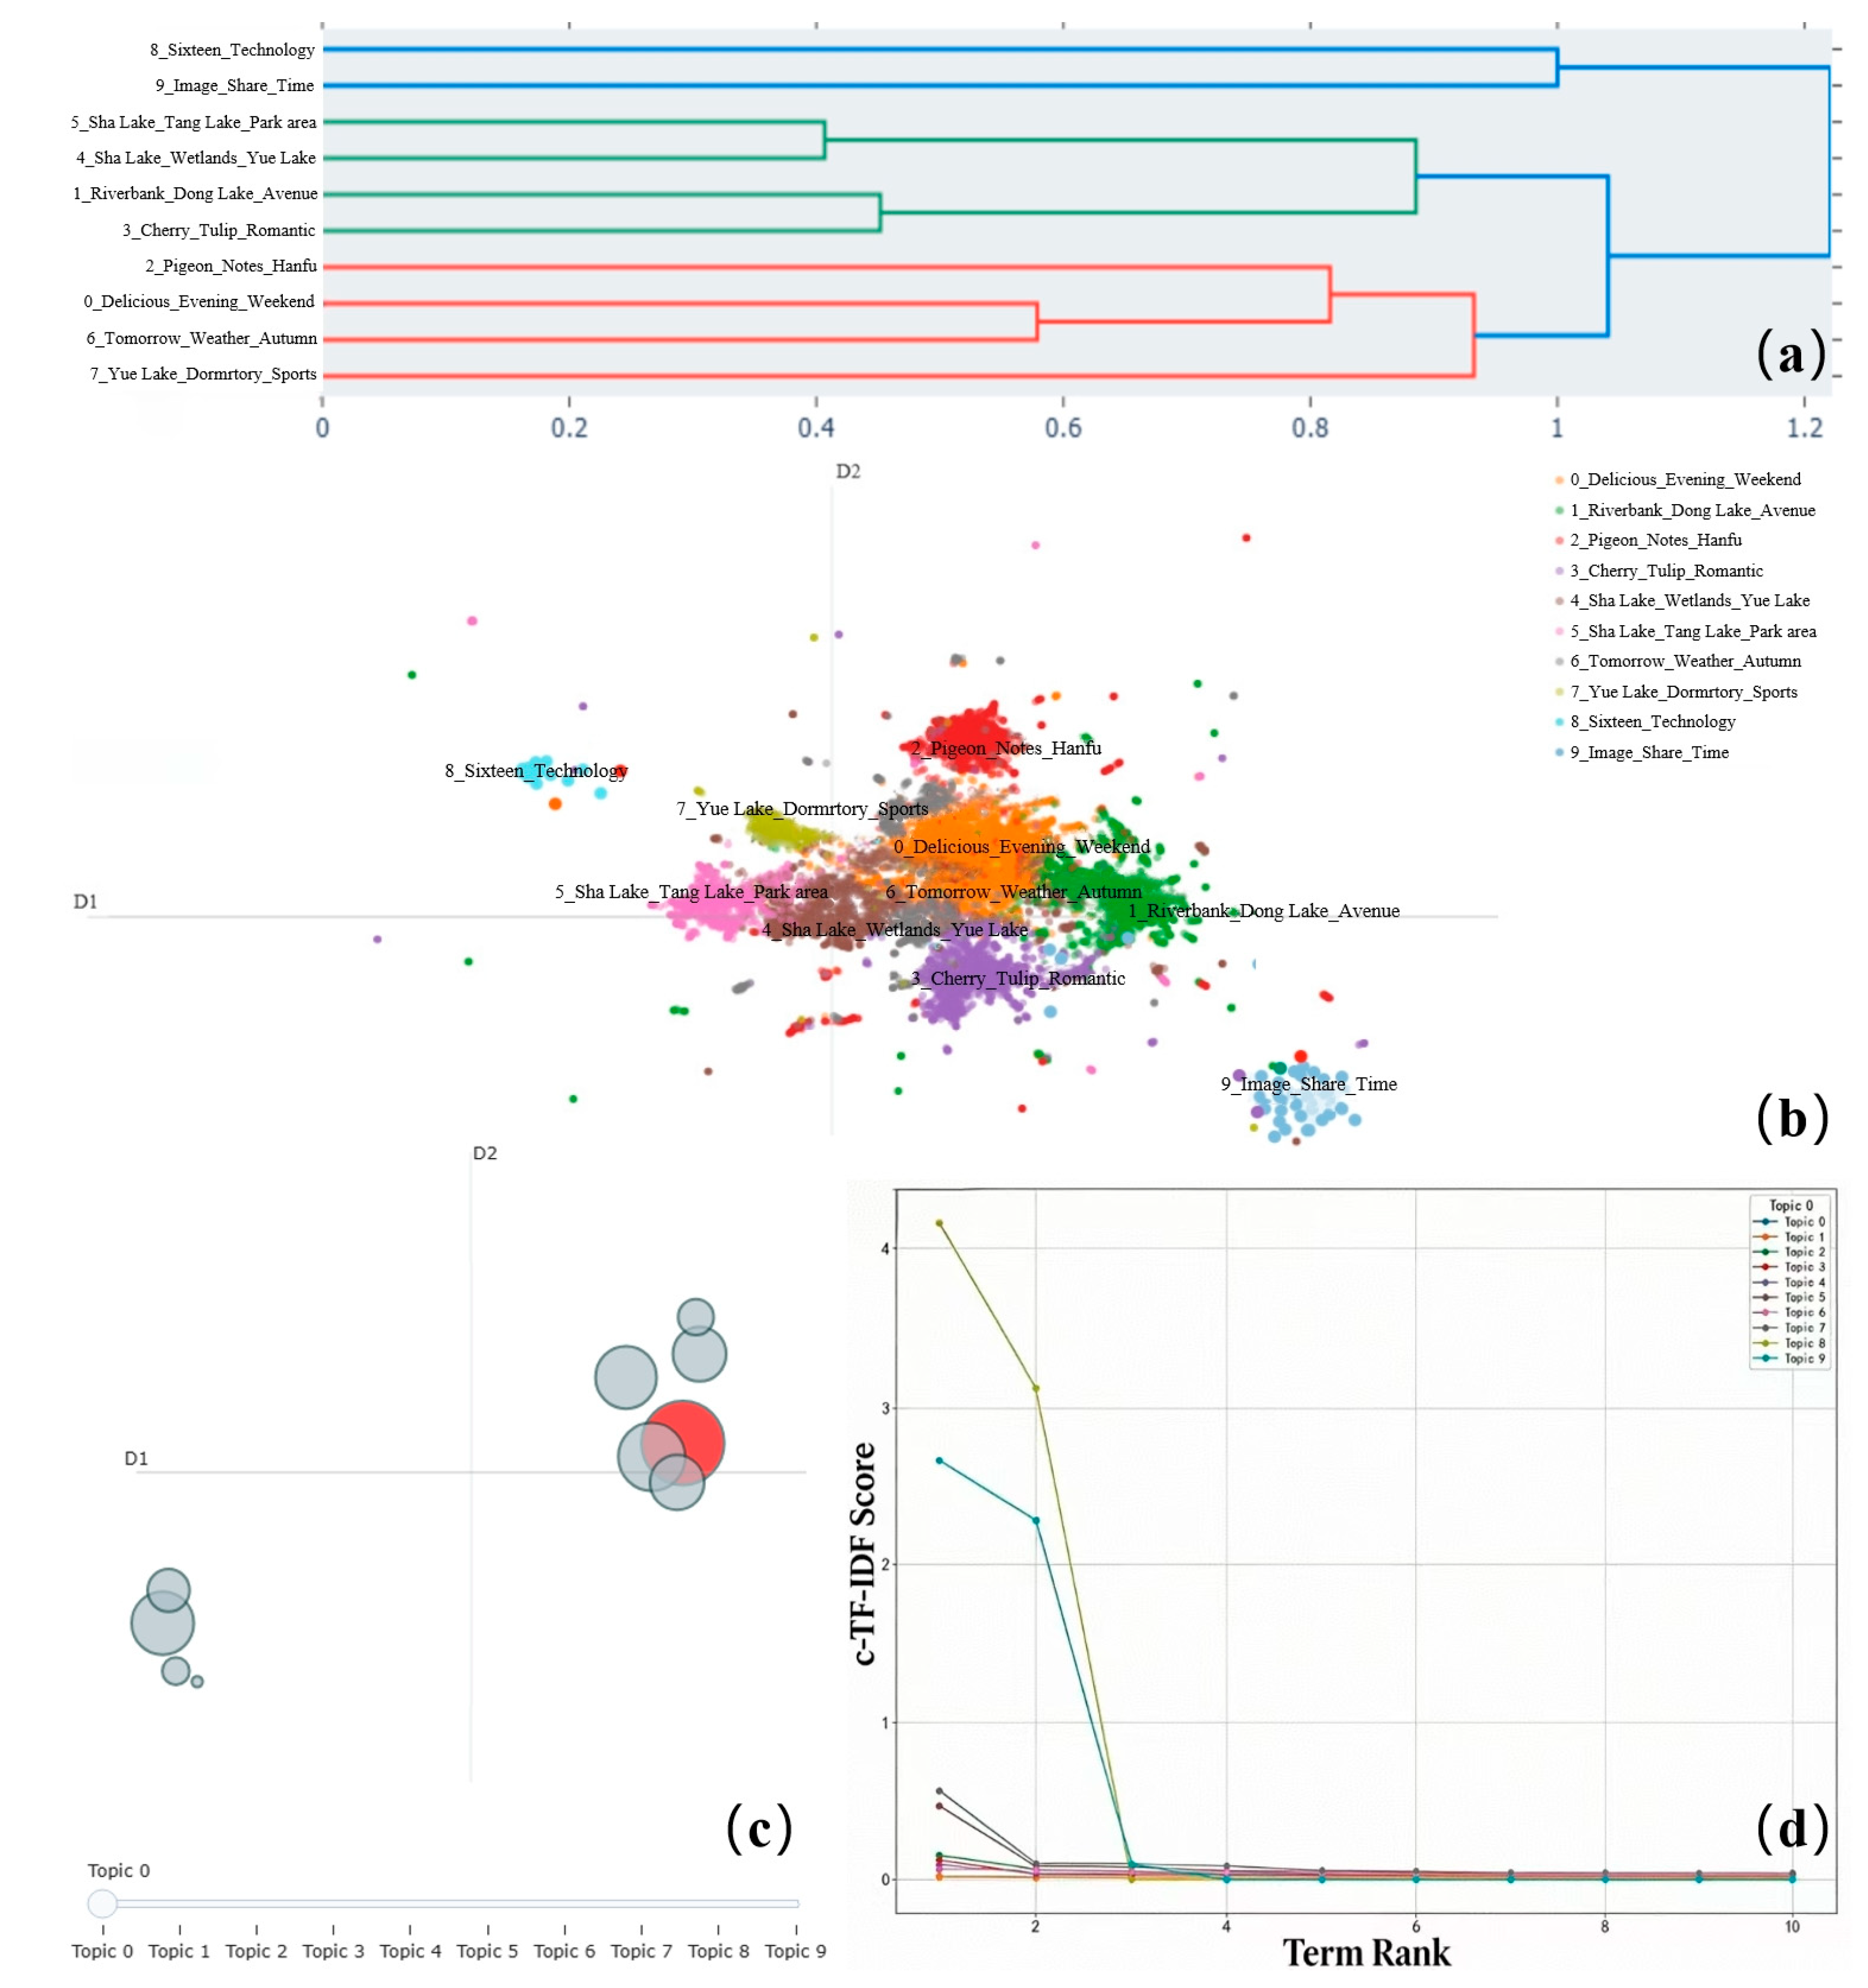
This study integrated multiple analytical methods to deepen the understanding of inter-topic relationships and to refine the interpretation of comment-based CES perceptions. Hierarchical clustering of topics, mapping of document-topic distributions, inter-topic distance analysis, and examination of keyword-weight variations were employed to structurally refine and validate the topic framework. The outcomes of these analyses are visualized in Figure 6.
To elucidate the hierarchical relationships among topics, hierarchical clustering was applied, with the results presented in Figure 6a. The figure visually reveals semantic associations between topics. Specifically, Topics 0 and 6 are closely linked, indicating that temporal and meteorological factors, including time of day, weather conditions, and seasonal changes, constitute significant contextual variables shaping leisure behavior and experiential evaluations in parks. Topics 4 and 5 are directly correlated, jointly illustrating the role of parks as integrated environments for immersive natural encounters and landscape appreciation. Furthermore, Topic 3 exhibits an indirect connection to Topic 4, suggesting that activities such as flower viewing have evolved into a specialized and distinct experiential dimension within the spectrum of park services.
Figure 6b presents a two-dimensional document-topic distribution map generated through dimensionality reduction in BERTopic. The well-separated clustering of topics demonstrates robust topic distinctiveness and model stability. Based on the observed distribution patterns, the textual content was synthesized into five distinct CES perception dimensions: (1) Temporally contextualized recreation, represented by Topics 0 and 6, which reflect leisure activities strongly conditioned by diurnal, seasonal, and meteorological factors; (2) Aesthetic and nature-based engagement, captured by Topics 3, 4, and 5, focusing on aesthetic experiences associated with specific landscapes and natural features; (3) Physical activity and health promotion, corresponding to Topic 7, highlighting participatory behaviors such as sports and wellness-oriented practices; (4) Social interaction and online engagement, derived from Topics 2 and 9, illustrating the dual role of parks as physical venues for offline socialization and platforms for online content sharing; and (5) Cultural and science-informed experience, encompassing Topics 1 and 8, emphasizing the function of parks in facilitating cultural communication and public knowledge dissemination.
To further elucidate the relationships among topics, an inter-topic distance map was generated, as shown in Figure 6c. In this visualization, each circle represents a topic, with its size proportional to its document frequency and the distance between circles reflecting their semantic similarity. This analysis identifies Topic 0 (“Delicious_Evening_Weekend”) and Topic 1 (“Riverbank_Dong Lake_Avenue”) as the most frequently occurring themes.
Figure 6d displays the descending trend of feature word weights within each topic. The clear declining pattern observed for most topics confirms that core keywords dominate the semantic representation of each cluster. This result validates the internal coherence of the topics and supports the robustness and interpretability of the clustering outcome.
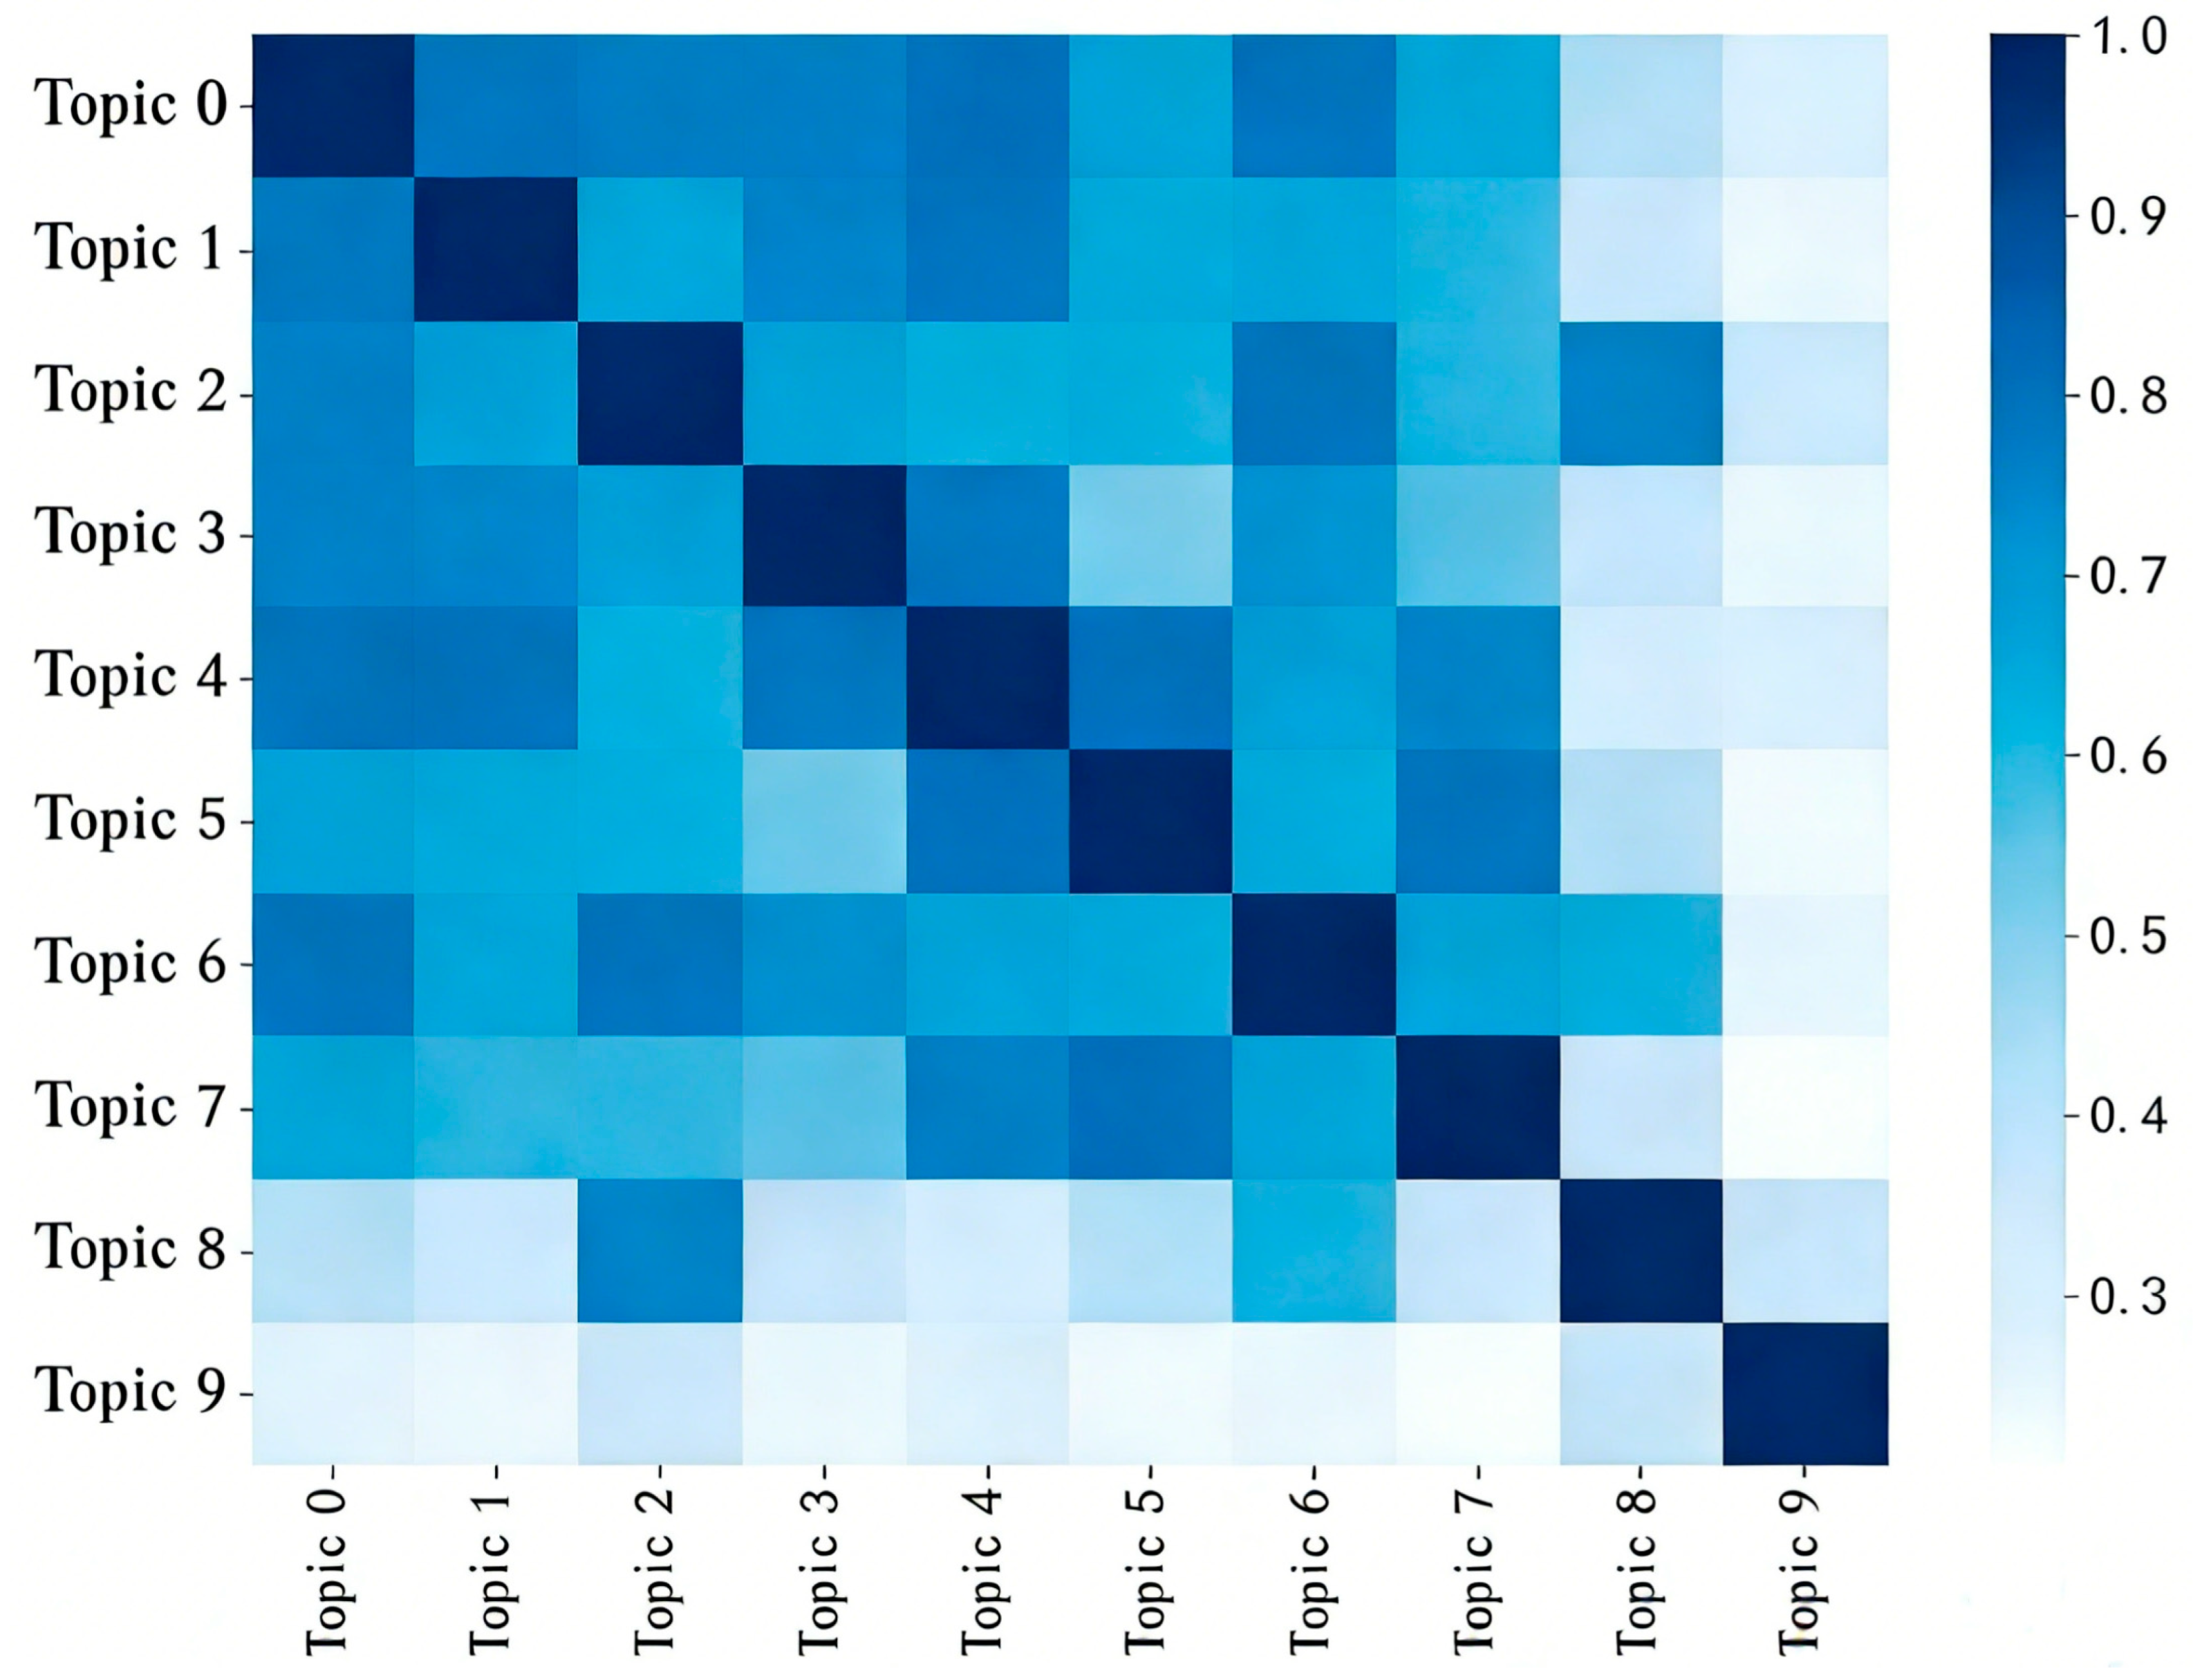
Figure 7 visualizes the semantic similarities among latent topics in the form of a heatmap. In the matrix, higher similarity values indicate a greater likelihood that topics would be grouped into the same category in subsequent merging processes. As shown in the figure, the inter-topic similarity exhibits a distinctly uneven distribution. Specifically, Topic 0 and Topic 6, Topic 3 and Topic 4, as well as Topic 4 and Topic 5, demonstrate strong semantic coherence, suggesting they may belong to a shared semantic category or functional dimension. In contrast, Topics 8 and 9 exhibit relatively low similarity with the other topics in the matrix. This pattern indicates a degree of semantic distinctiveness, suggesting they may represent distinct perceptual perspectives within the comment data.
This study applied the BERTopic model to analyze Weibo text comments, identifying ten initial topics. The analysis revealed that several topics exhibited high semantic similarity and close inter-topic relationships. Guided by the theoretical framework of CES and following criteria including proximity in hierarchical clustering, high inter-topic similarity, and spatial adjacency in the document-topic distribution, related topics were merged.
As shown in Figure 7 and Appendix B Table A4, several topic pairs exhibit high semantic similarity, including Topic 0 and Topic 6 (similarity coefficient = 0.818), Topic 3 and Topic 4 (0.808), Topic 4 and Topic 5 (0.847), and Topic 5 and Topic 7 (0.815). Additionally, strong associations are observed between Topic 2 and Topic 6 (0.831) and between Topic 2 and Topic 8 (0.776). Other notable correlations include Topic 1 with Topic 0 (0.820) and Topic 1 with Topic 4 (0.824). These relationships form an interconnected network centered around Topic 4. Although substantial semantic overlap exists among these topics, each retains distinct thematic emphases in terms of specific content. Based on the visual presentation of the BERTopic modeling results (Figure 6) and a semantic interpretation of the topic keywords in relation to each CES dimension, the initial topics were reclassified into five more interpretable dimensions. Dimension 1 (Topics 0 and 6): These two topics exhibit high similarity (0.818) and share a semantic focus on recreational services (RS). Dimension 2 (Topics 3, 4, and 5): Although Topic 3 and Topic 5 have a relatively low direct similarity (0.525), they are semantically bridged through Topic 4. Together, they form a thematic cluster encompassing aesthetic experiences (AE). Dimension 3 (Topic 7): Despite showing strong correlations with other topics, such as Topic 5 (0.815), its distinctive keywords justify its treatment as an independent dimension related to health-promoting activities (HA). Dimension 4 (Topics 2 and 9): Although their statistical similarity is low (0.363), both topics converge on the theme of social interaction. Topic 2 emphasizes both online and offline social contexts (e.g., Hanfu gatherings, Xiaohongshu sharing), while Topic 9 focuses on digital media sharing behaviors. Semantically, they can be consolidated into a single dimension representing social interaction (SI). Dimension 5 (Topics 1 and 8): These topics also exhibit low statistical similarity (0.380). However, Topic 1 relates to cultural landmark visitation and documentation, while Topic 8 pertains to science and technology education. Together, they fall within the broader domain of educational and cultural services (ES), encompassing both humanities and science-oriented cultural content.
Following this data-driven consolidation, manual semantic validation was conducted to ensure conceptual consistency. To further ensure the reliability and ecological validity of the analyses, an inter-coder reliability check was performed both before and after the formal coding process, with the coding manual detailed in Appendix B, Table A5.
During the pilot coding phase, two independent coders conducted trial coding on a randomly selected sample of 50 comments, achieving an agreement rate of 76.0% and a Cohen’s Kappa of 0.73. In the formal coding phase, the same two coders independently classified the full sample of 500 comments, yielding an agreement rate of 65.4% and a Cohen’s Kappa of 0.61. Both Kappa values fell within the acceptable range, indicating satisfactory reliability of the coding results.
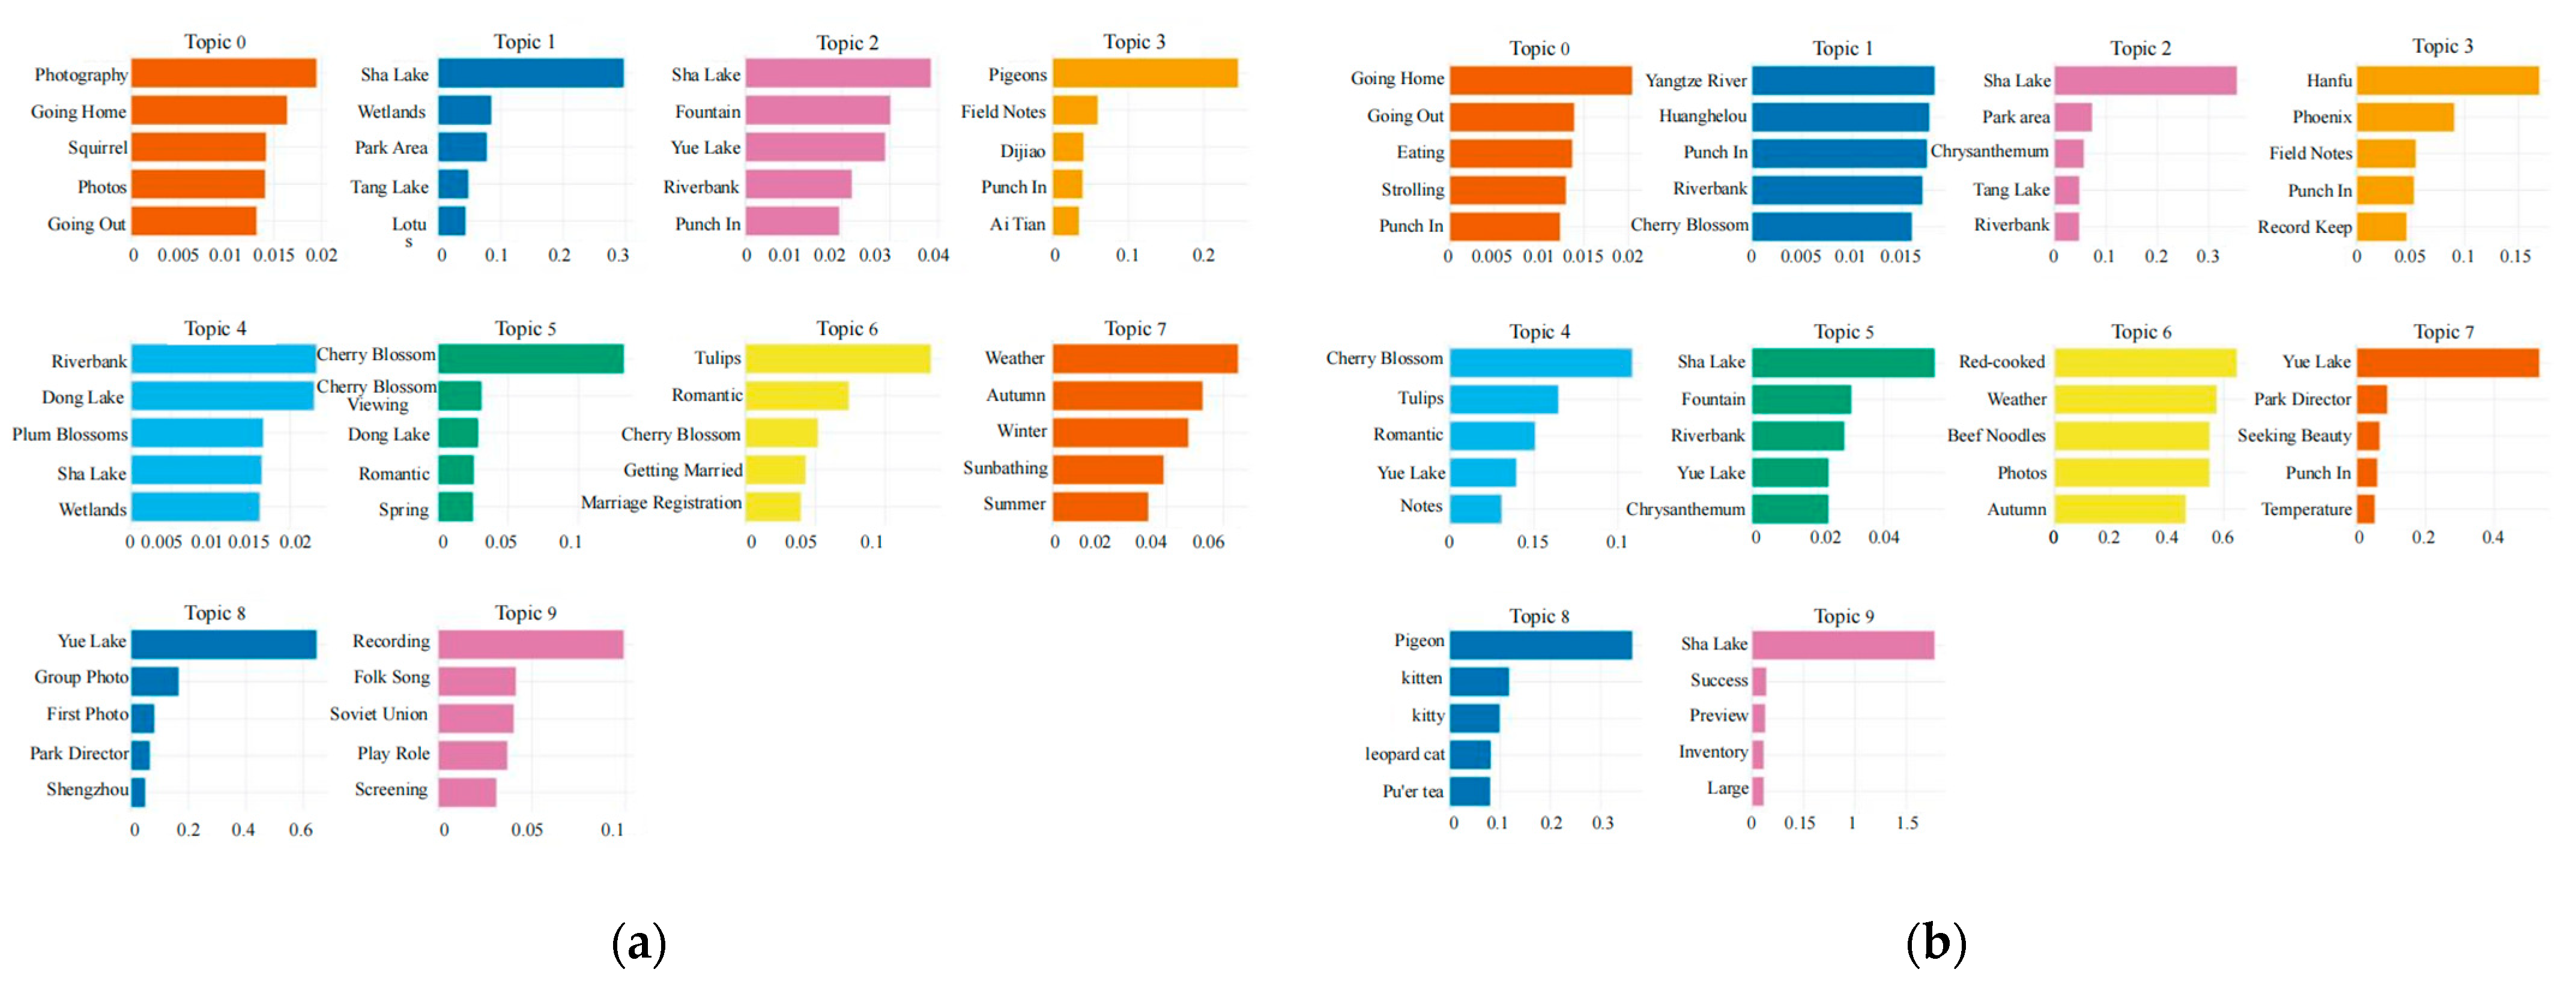
Using manual coding as the benchmark, the BERTopic model achieved an overall accuracy of 76.0% on the 500-comment test set, with a weighted average F1 score of 0.76 and a Cohen’s Kappa of 0.7119. At the topic level, Topics 2 (social sharing), 5 (sense of place), 7 (physical activity), and 8 (culture and history) demonstrated excellent performance, with F1 scores exceeding 0.83. Topics 0 (food-related leisure), 1 (landmark check-ins), 6 (seasonal recreation), and 9 (family-oriented social interaction) showed good performance, with F1 scores ranging from 0.70 to 0.78. Topic 4 (wetland ecology) obtained a moderate F1 score of 0.58. Overall, the classification results of the model showed satisfactory agreement with manual coding, supporting its applicability for subsequent analysis.
Ultimately, the topics were integrated and categorized into five CES perception dimensions: Recreational Services (RS), Aesthetic Experiences (AE), Health-promoting Activities (HA), Social Interactions (SI), and Educational Services (ES). The detailed classification is presented in Table 4. As detailed in Appendix B Table A6, the CES connotations, keywords, document counts, and representative comments for both the ten initial topics and the five consolidated CES dimensions are comprehensively presented. The results confirm that the consolidation process preserved essential semantic information without any loss of critical content.
To assess the stability of CES dimension identification across different user groups, two subsets of Weibo users were delineated based on the time of comment posting: daytime and nighttime. The BERTopic model was then reapplied to each of these subsets. As shown in Appendix B, Figure A1, topics related to the CES dimensions, namely RS, AE, HA, SI, and ES, consistently emerged across both subsets. This finding indicates the robustness of the dimensional identification results to variations in user subgroups.

3.1.2. Derivation of Potential Driving Factors

From the perspective of environmental psychology, perception arises from the complex interactions among individual characteristics, social contexts, and physical environments. Based on preprocessed Weibo comment data, this study employed Python and Excel to conduct statistical and content analysis of high-frequency words. Through this process, key influencing factors and their corresponding indicators reflecting residents’ differential perceptions of CES in UPGS were extracted, as summarized in Table 5.

3.1.3. Characteristics of Driving Factors

Statistical analysis of the socioeconomic backgrounds of 313 respondents is presented in Table 6. The sample exhibited a balanced gender distribution, with females comprising 48.9% and males 51.1% of respondents. Age distribution skewed toward adults, with significant proportions in the 18–30 cohort (29.1%) and seniors over 60 (23.6%). Respondents demonstrated relatively high educational levels: 25.6% held associate degrees, and 45.6% possessed bachelor’s degrees or higher qualifications. Using monthly income as the metric, the majority (49.8%) reported earnings between CNY2000 and CNY5000, while 28.4% earned below CNY2000. Only 4.1% fell into the high-income bracket (≥CNY9000). The sample comprised retirees (33.5%), employed professionals (28.4%), freelancers (18.5%), and students (12.7%). Reliability analysis yielded a Cronbach’s alpha coefficient of 0.859, indicating strong internal consistency. The KMO measure verified sampling adequacy (KMO = 0.897), supporting the scale’s factorial validity.
Table 7 presents the evaluation results of 313 respondents on the service management quality of the sampled parks. A majority of the residents gave favorable ratings to the park’s service management. Specifically, 47.2% of respondents expressed satisfaction with the IEM, 44% reported a positive experience with the VEM, and 45.3% held a positive attitude toward the CPM. Furthermore, among these three service dimensions, CPM received the highest mean score (M = 3.30), which was close to the score for IEM (M = 3.27). The VEM had the lowest mean score (M = 3.24). Notably, the average ratings for all three services exceeded the neutral midpoint of 3.
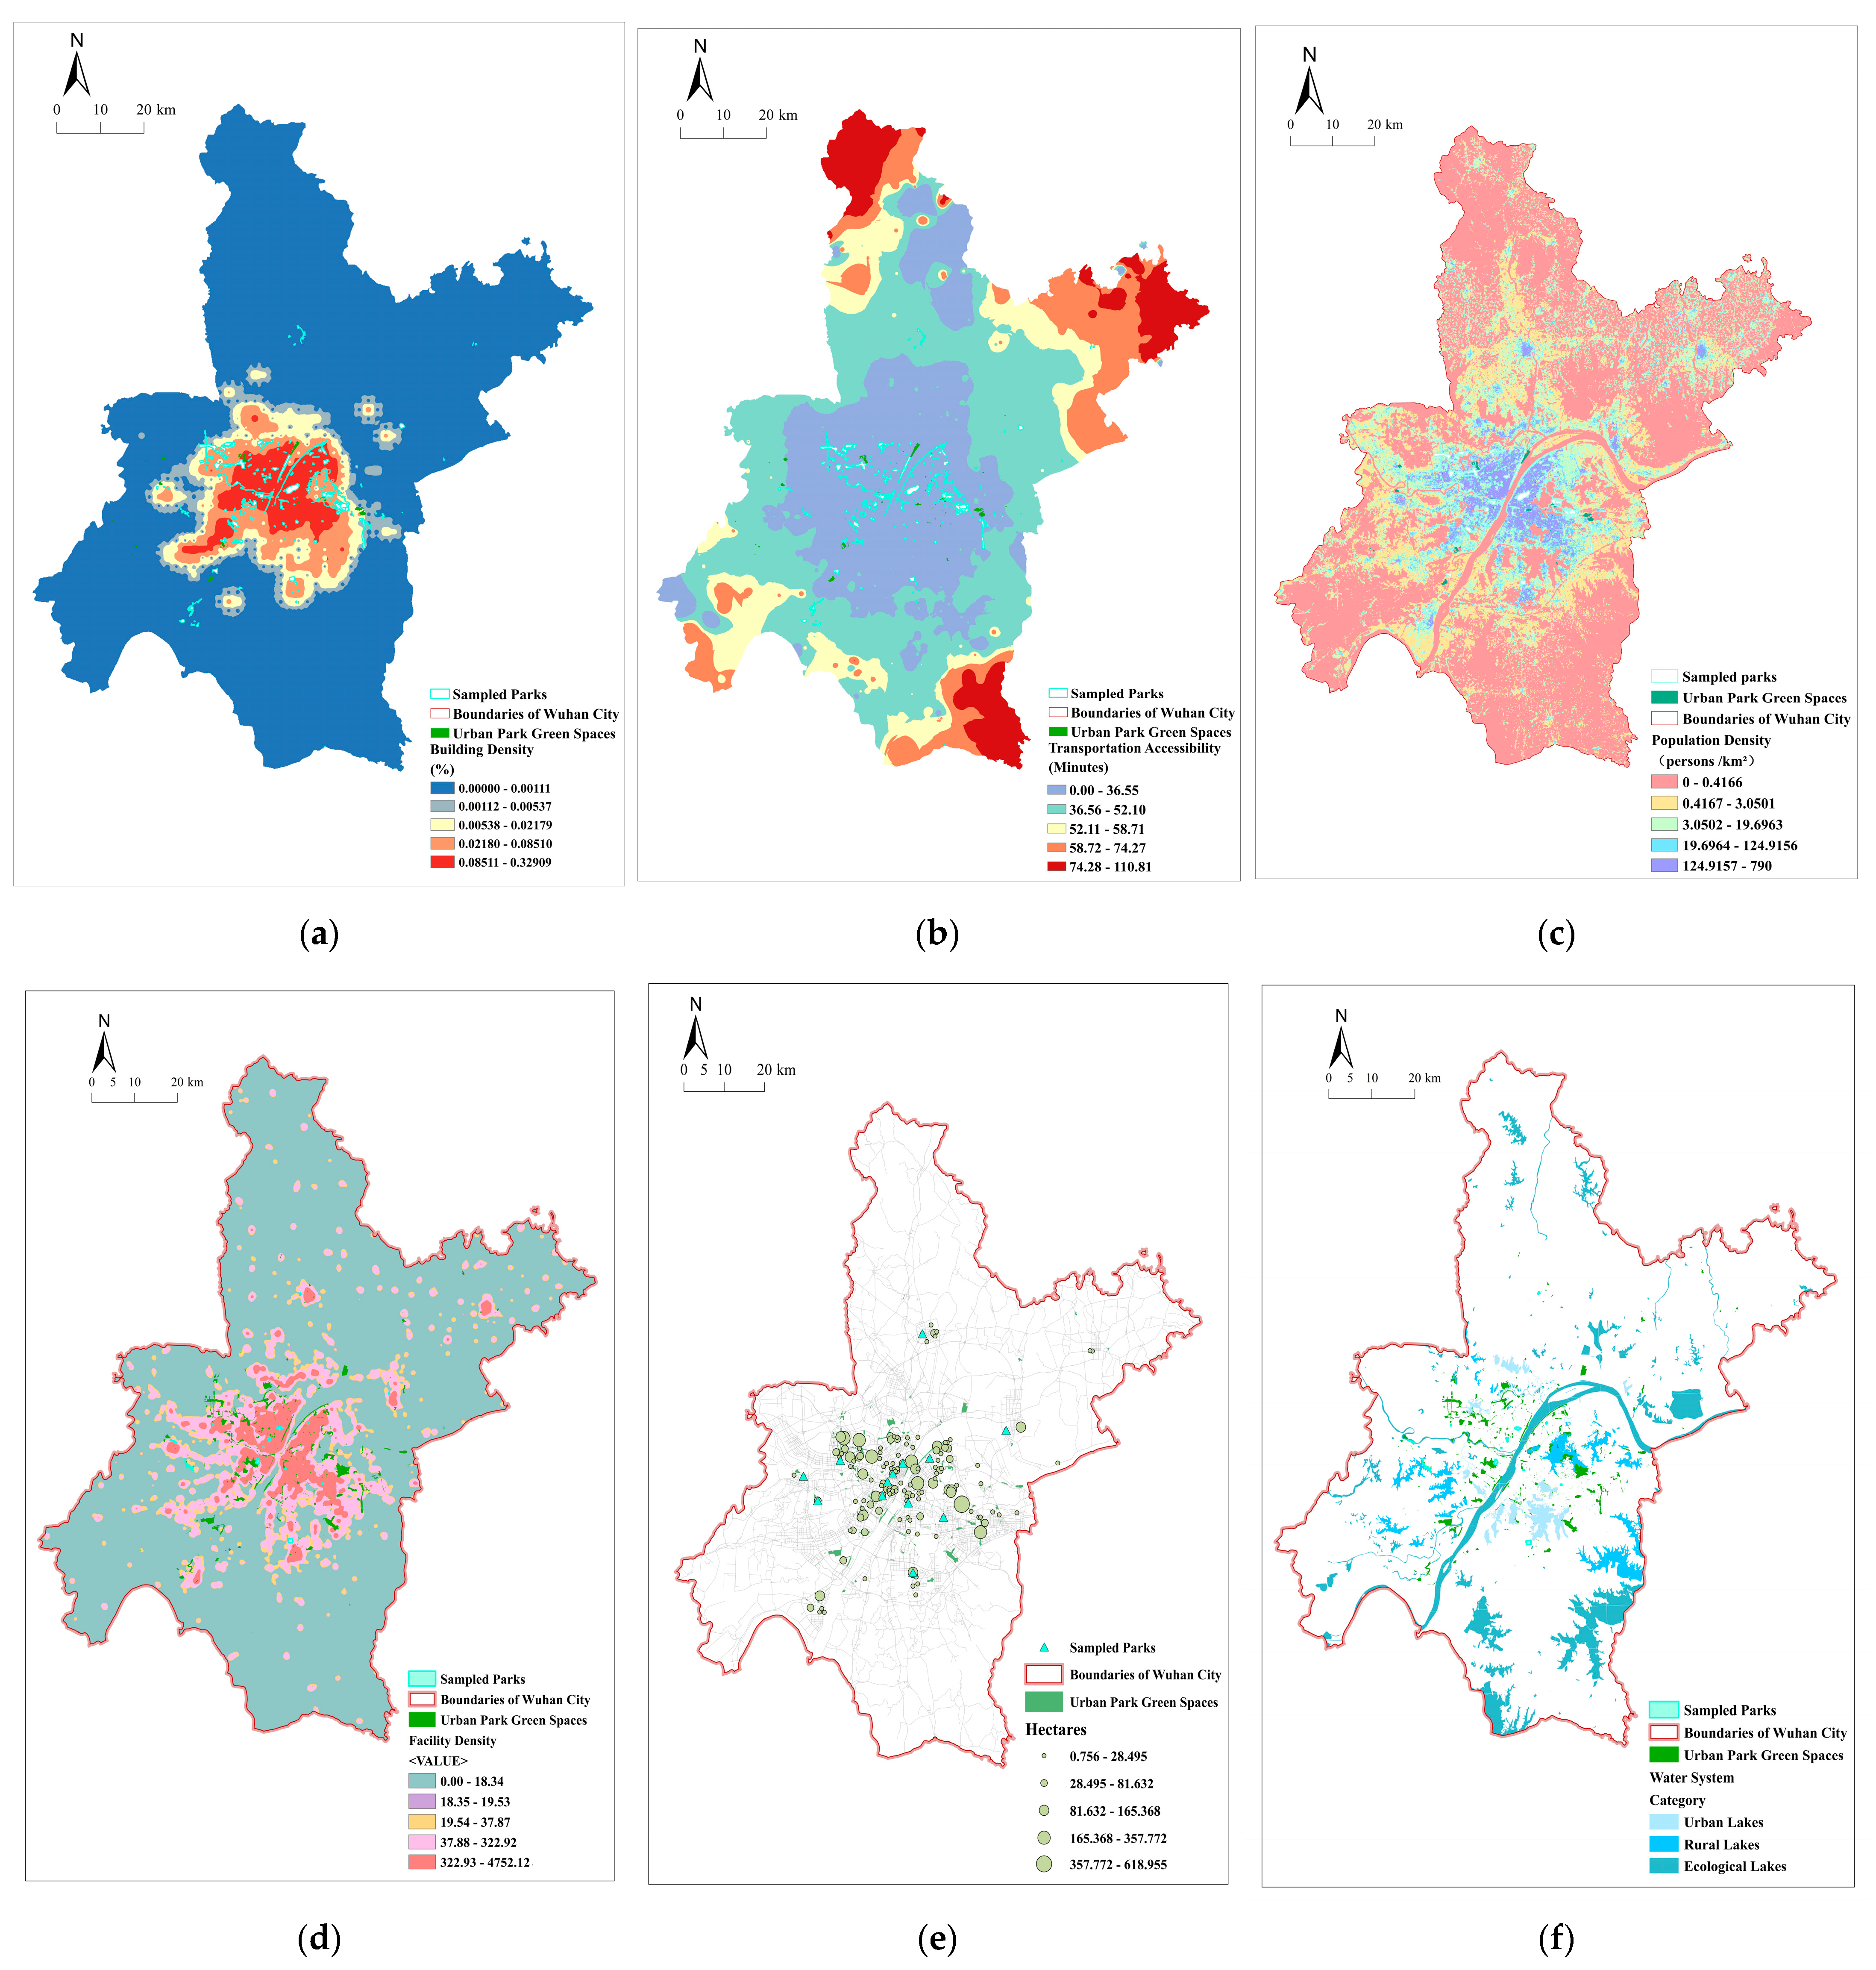
The external built environment and internal landscape composition of the sampled parks were analyzed using geospatial techniques in ArcGIS 10.8. First, a set of spatial indicators for Wuhan was generated, encompassing surrounding building density, transportation accessibility, population density, facility richness, park area, and water features. Subsequently, these indicators were spatially matched with their corresponding sampled parks. The results are presented in Figure 8.
The EBE and ILC of the 13 sampled parks were analyzed and classified according to specific metrics. For the indicator grading, SBD, PD, FR, PA, and WF were graded on a scale from 1 (lowest) to 5 (highest), while TA was graded inversely from 1 (highest) to 5 (lowest). The resulting environmental classification for all parks is summarized in Table 8.
As evidenced by Figure 8 and Table 8, significant spatial inequity exists in the EBE. Parks in central urban areas exhibit higher SBD, greater TA, and elevated PD, with these metrics displaying a clear declining gradient from the urban core to peripheral zones. Among the sampled parks, Jiefang Park, Zhongshan Park, and Qiaokou Park exhibited the highest levels of SBD, TA, and PD, respectively. These were followed by Guanshan Park, Chuwangtai Historical Park, and the Botanical Science Park. Due to their distinct attributes and functional orientations, certain parks exhibit significant variations in their EBE. For instance, Houguanhu Park prioritizes ecological conservation, while Wuhan Zoo features expansive habitats. Both of them are renowned destinations with high TA but low SBD. In contrast, Qianchuan Park and Chaibohu Leisure Square, located in peri-urban areas, demonstrate uniformly low levels of SBD, TA, and PD.
As shown in Table 8, parks such as Jiefang Park, Zhongshan Park, and Jiangxia Central Park show comparative advantages in both PA and FR. Caidian Riverside Park and Houguanhu Park, located adjacent to major water bodies, feature abundant aquatic landscapes but offer relatively limited facilities. Parks, including Qiaokou Park, Guanshan Park, Chaibohu Leisure Square, and Wuhuan Square, generally have smaller PA, with their WF and FR levels largely shaped by surrounding urban conditions. In contrast, certain parks exhibit notable spatial and hydrological heterogeneity aligned with their specialized functions, while consistently maintaining higher FR ratings across different park types.

3.1.4. Patterns in CES Perception Satisfaction

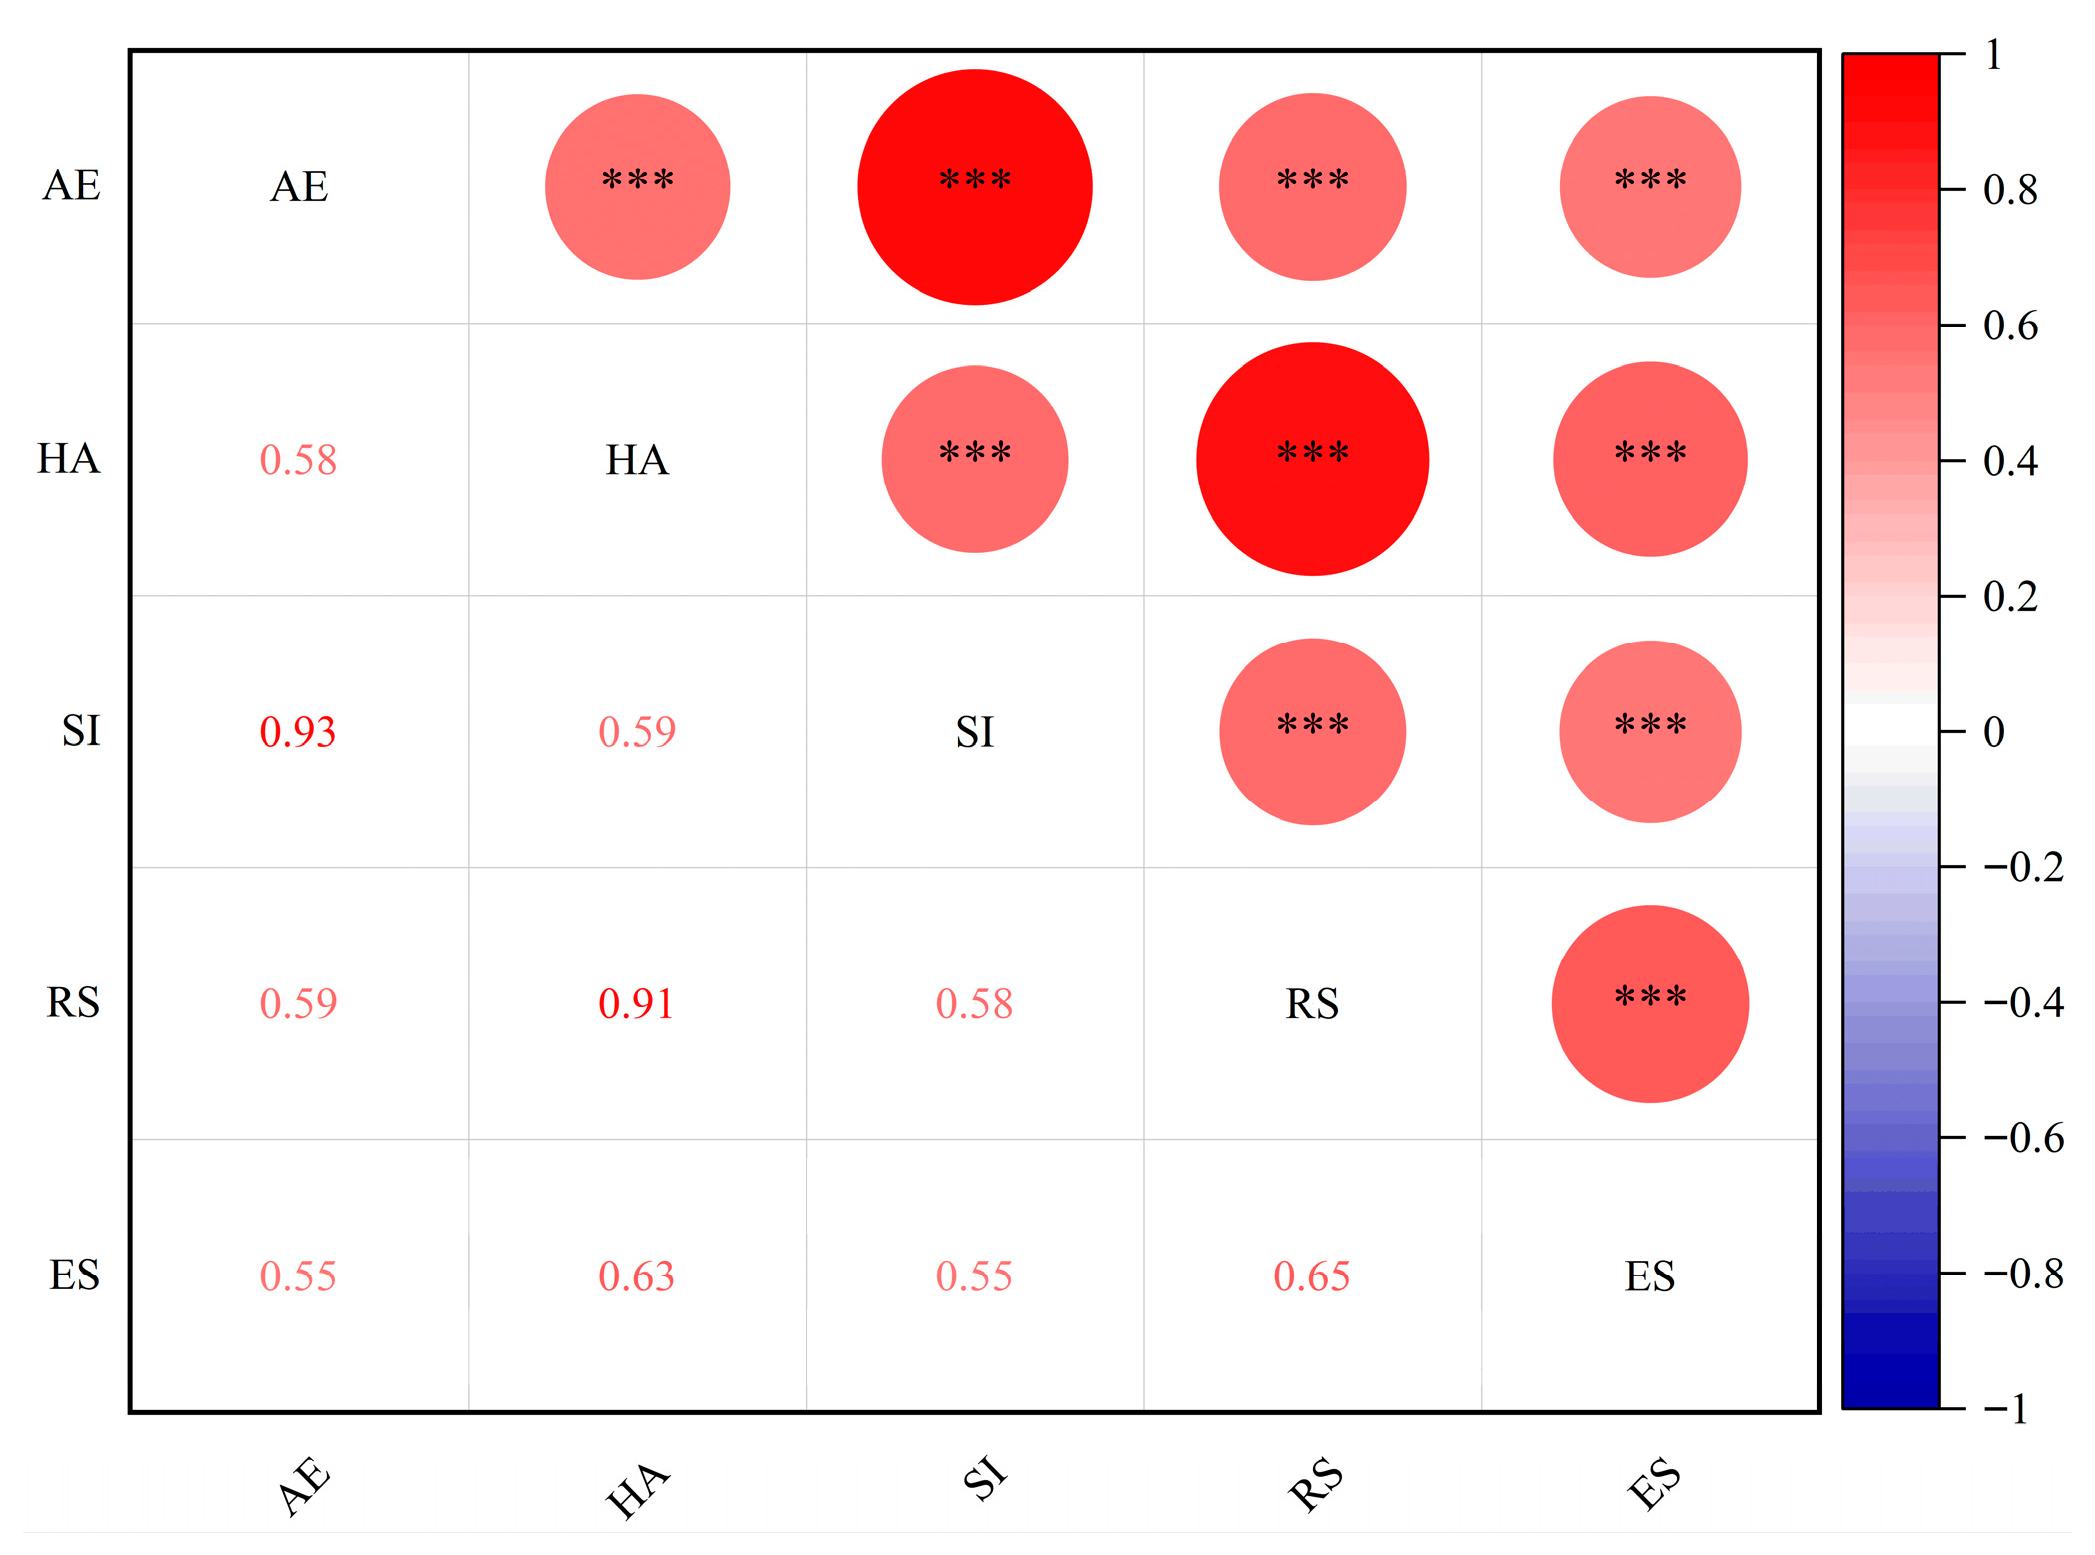
Pearson correlation analysis revealed significant synergistic associations among all resident-perceived CES dimensions (p < 0.001). As shown in Figure 9, strong positive correlations were observed between AE and SI (r = 0.93), as well as between HA and RS (r = 0.91). This pattern suggests a close relationship between residents’ appreciation of scenic beauty and their engagement in social behaviors within parks: aesthetically appealing landscapes create favorable settings for social activities, while positive social interactions can, in turn, enrich the perceived aesthetic value. Furthermore, HA and RS show a high degree of functional integration in actual park use, suggesting that residents often experience these two dimensions concurrently. Park environments conducive to positive exercise experiences are strongly associated with enhanced recreational atmosphere and overall satisfaction.
Additionally, ES maintained consistently moderate to strong positive correlations with all other CES indicators (r > 0.50). These findings underscore that residents perceive the various CES functions in a highly integrated and synergistic manner. The different dimensions reinforce one another, collectively contributing to a high-quality experience in UPGS.
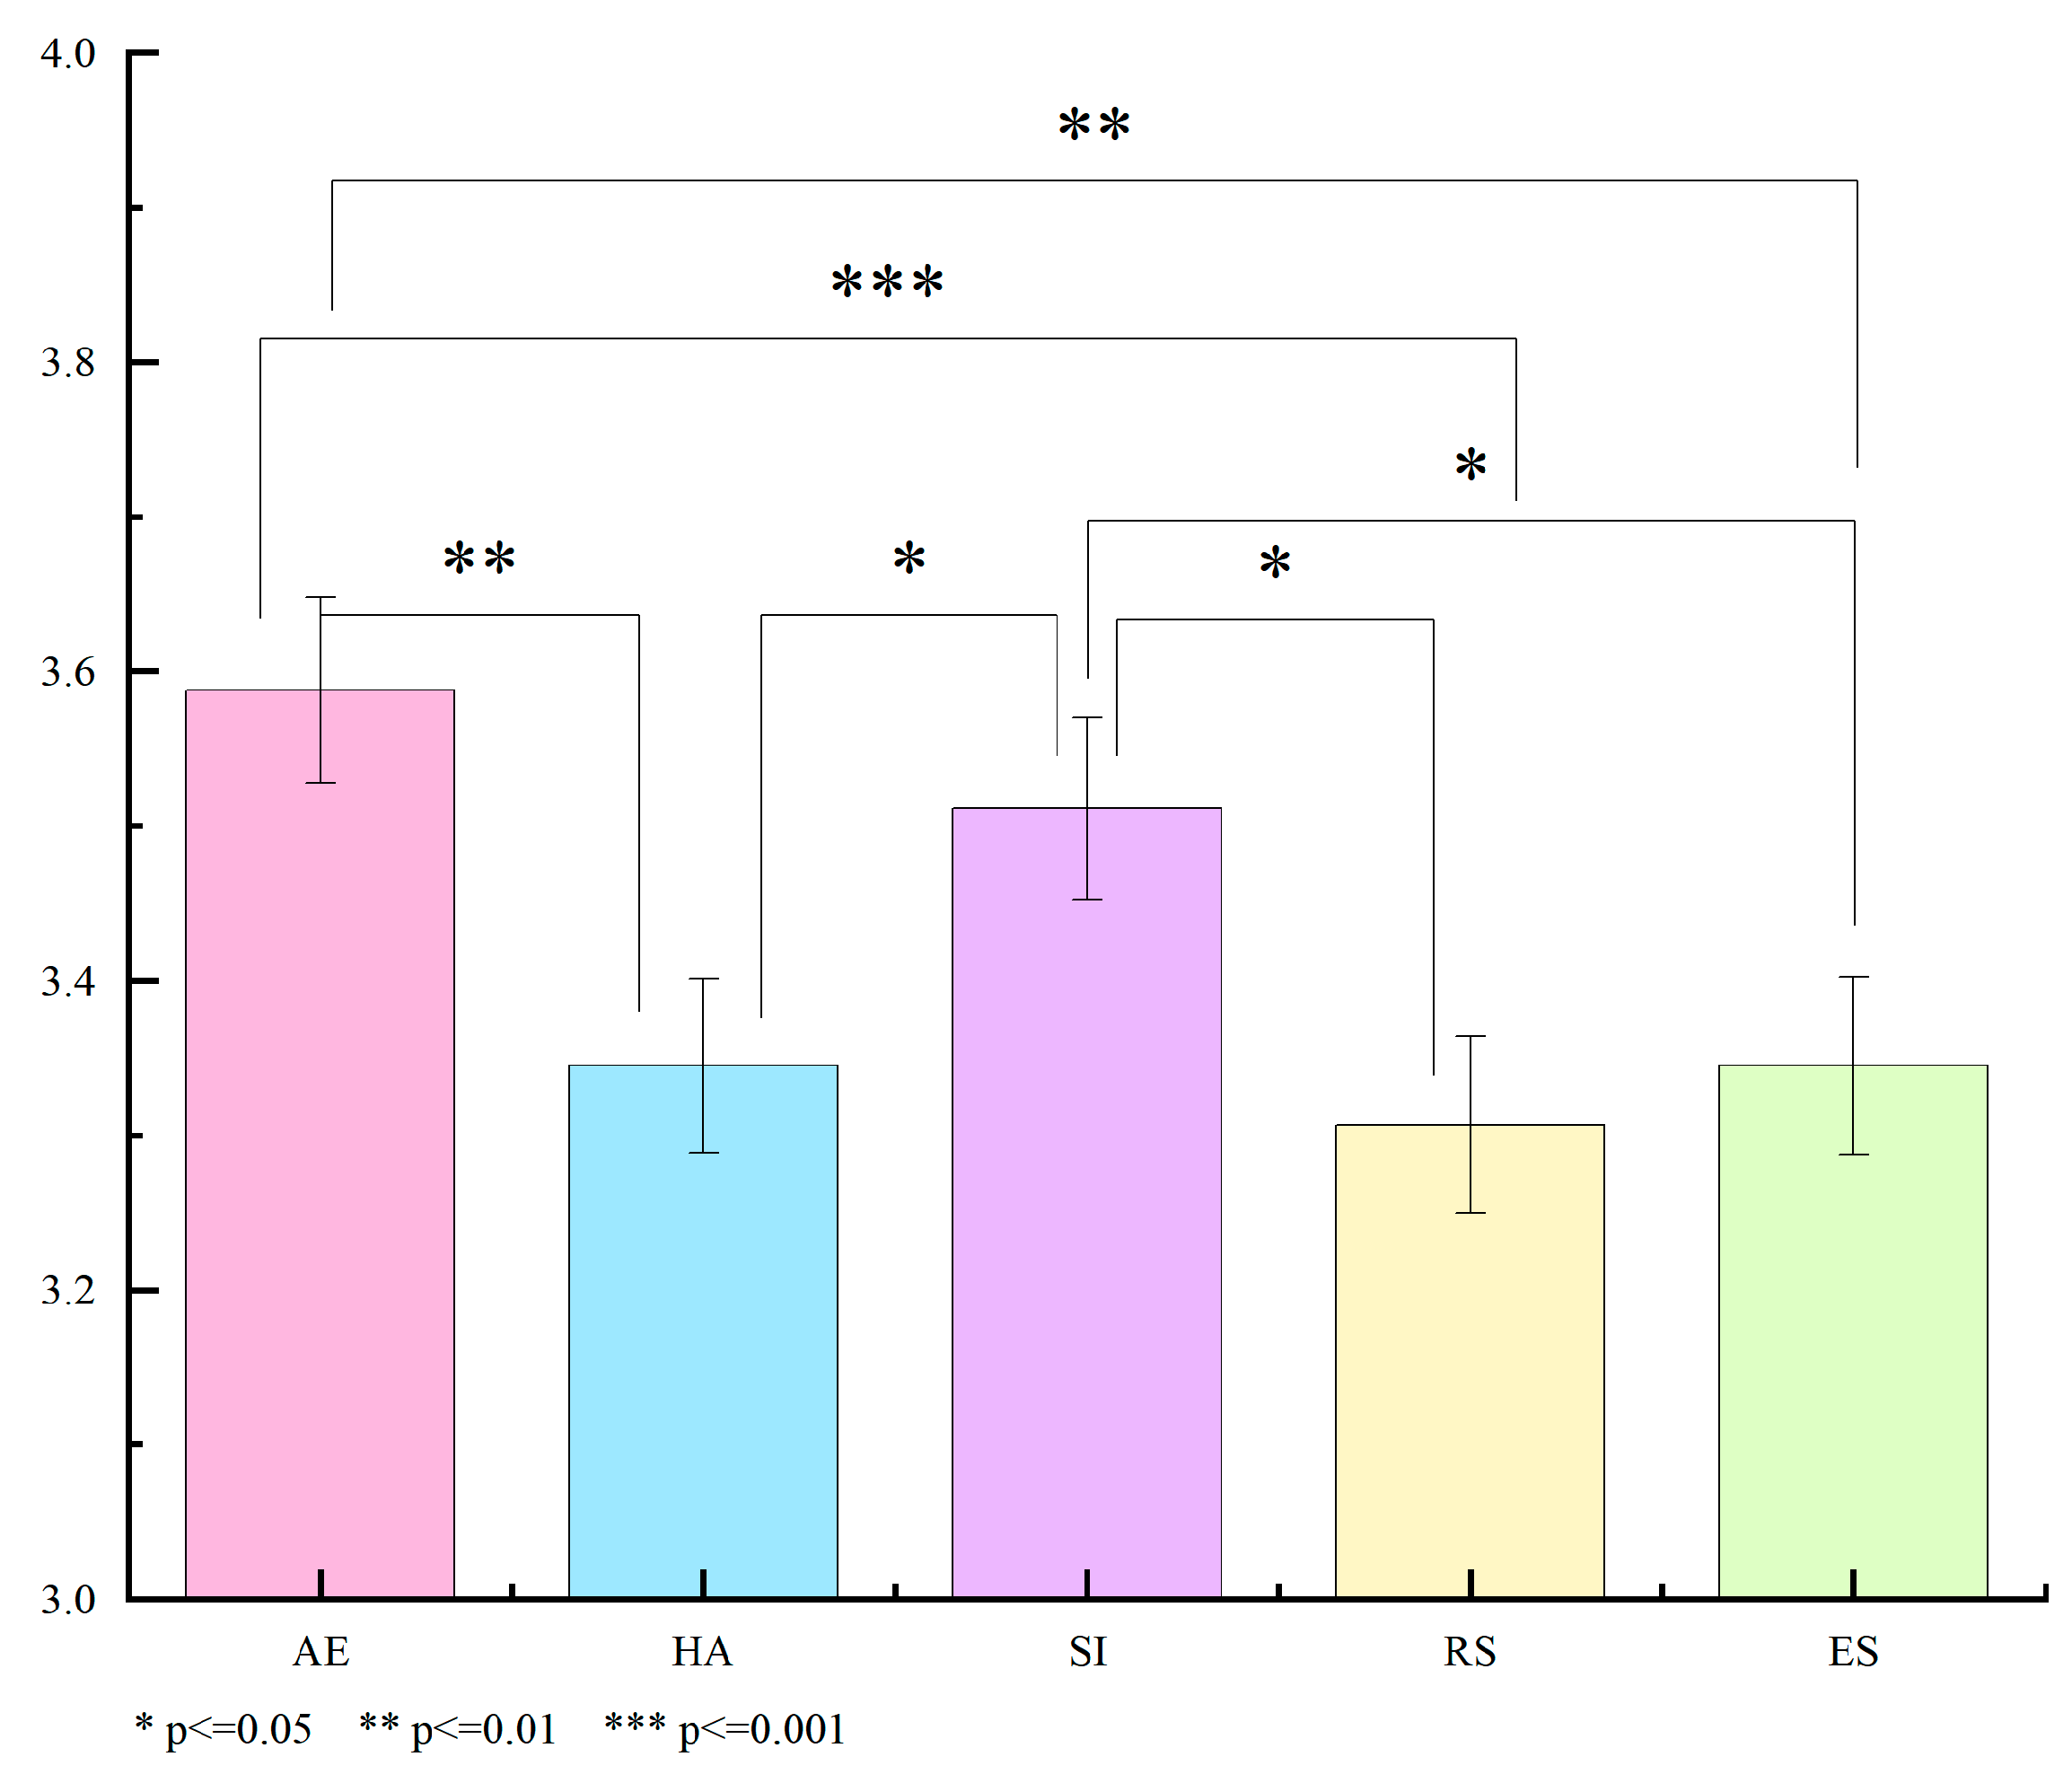
The Friedman rank-sum test was conducted to assess differences in residents’ perceived satisfaction across the five CES categories. The overall test results revealed statistically significant differences (χ2 = 48.086, df = 4, p < 0.001). Post pairwise comparisons were performed, with results displayed in Figure 10.
As shown in Figure 10, significant disparities in satisfaction levels were observed among the CES dimensions. AE garnered the highest mean satisfaction score (M = 3.59, SD = 1.059), followed by SI (M = 3.51, SD = 1.044). In contrast, HA (M = 3.35, SD = 0.995), ES (M = 3.35, SD = 1.017), and RS (M = 3.31, SD = 1.010) yielded the lowest mean scores, which were statistically comparable to each other. These results suggest that while parks are perceived to deliver strong aesthetic and social value, their performance in supporting health, recreation, and educational functions is rated relatively lower. This pattern may reflect limitations in facility diversity or a resident preference for unstructured, experiential engagement over formally organized programs.

3.2. Validation of the Driver-Based PLS-SEM Model

3.2.1. Evaluation of the Measurement Model

In alignment with the PLS-SEM evaluation criteria outlined in Table 3, the findings detailed in Table 9 confirm full compliance with all specified criteria. This substantiates a measurement model characterized by robust internal consistency and adequate convergent validity.
In this study, discriminant validity was cross-validated using the Fornell-Larcker criterion and HTMT. As summarized in Table 10, all HTMT values were below the threshold of 0.85, and the square root of the AVE for each latent variable exceeded its correlations with all other constructs. Both criteria were satisfactorily met, thereby confirming that the measurement model exhibits robust discriminant validity and that the constructs are statistically distinct and empirically separable.

3.2.2. Assessment of the Structural Model

All VIF values between latent constructs ranged from 1.000 to 1.960, falling below the critical threshold (Table 3), which indicates the absence of severe collinearity issues and supports the robustness of subsequent analyses. The model fit results show that the R2 values for CES, QSM, and ILC were 0.510, 0.404, and 0.429, respectively, demonstrating satisfactory explanatory power. Further predictive relevance testing revealed Q2 values of 0.364 for CES, 0.330 for QSM, and 0.424 for ILC, indicating adequate predictive capability of the model. The GoF index reached 0.573, further confirming the high overall fit quality of the model. Additionally, the effect sizes (ƒ2) of the paths in the model ranged from 0.065 to 0.752, revealing a clear gradient in the strength of influence across different relationships. Specifically, the paths EBE → QSM (ƒ2 = 0.119), ILC → QSM (ƒ2 = 0.115), and QSM → CES (ƒ2 = 0.133) all exhibit effects approaching the medium threshold. In contrast, EBE → CES (ƒ2 = 0.067) and ILC → CES (ƒ2 = 0.065) were categorized as small effects. Notably, the EBE → ILC pathway exhibited a substantial effect, with an ƒ2 value of 0.752, indicating that the external built environment exerts a dominant influence on internal landscape composition. In planning practice, internal landscape design should be adapted to the characteristics of the external built environment. For instance, in high-density urban areas, priority may be given to buffering landscapes that mitigate environmental stressors, while suburban areas may benefit more from inviting landscape designs that enhance accessibility and engagement. The pathways EBE → CES (ƒ2 = 0.067) and ILC → CES (ƒ2 = 0.065) exhibited relatively small effect sizes, suggesting that improving the external environment alone or making localized adjustments to internal landscape composition has limited effectiveness in directly enhancing cultural service experiences. In contrast, the pathways EBE → QSM (ƒ2 = 0.119), ILC → QSM (ƒ2 = 0.115), and QSM → CES (ƒ2 = 0.133) exhibited moderate effect sizes, thereby revealing the core transmission mechanism: these elements influence cultural service experiences primarily through service management quality as a mediating factor. This finding highlights that practical efforts in park management should prioritize the optimization of service quality.
To assess the statistical significance of the path coefficients (β), a bias-corrected and accelerated bootstrap procedure with 5000 resamples was employed to derive parameter estimates and their 95% confidence intervals (CIs). The 95% CIs for all hypothesized paths excluded zero, confirming their statistical significance.
For the total effect of the EBE on CES perceptions, the bootstrap analysis yielded a coefficient of β = 0.608, with a 95% CI of [0.523, 0.685]. The relatively narrow confidence interval indicates that improvements in park surrounding conditions can exert a substantial positive influence on residents’ CES perceptions. In contrast, the direct effect of QSM on CES perceptions was β = 0.331, with a 95% CI of [0.204, 0.464]. The wider confidence interval suggests that, while improving service management quality is effective, the precise magnitude of its effect may vary across different park types or resident groups.
The final path coefficients, confidence intervals, significance levels, and other relevant indicators are presented in detail in Table 11.

3.3. Analysis of the Driving Mechanisms

3.3.1. Pathways of Key Drivers and Their Interplay

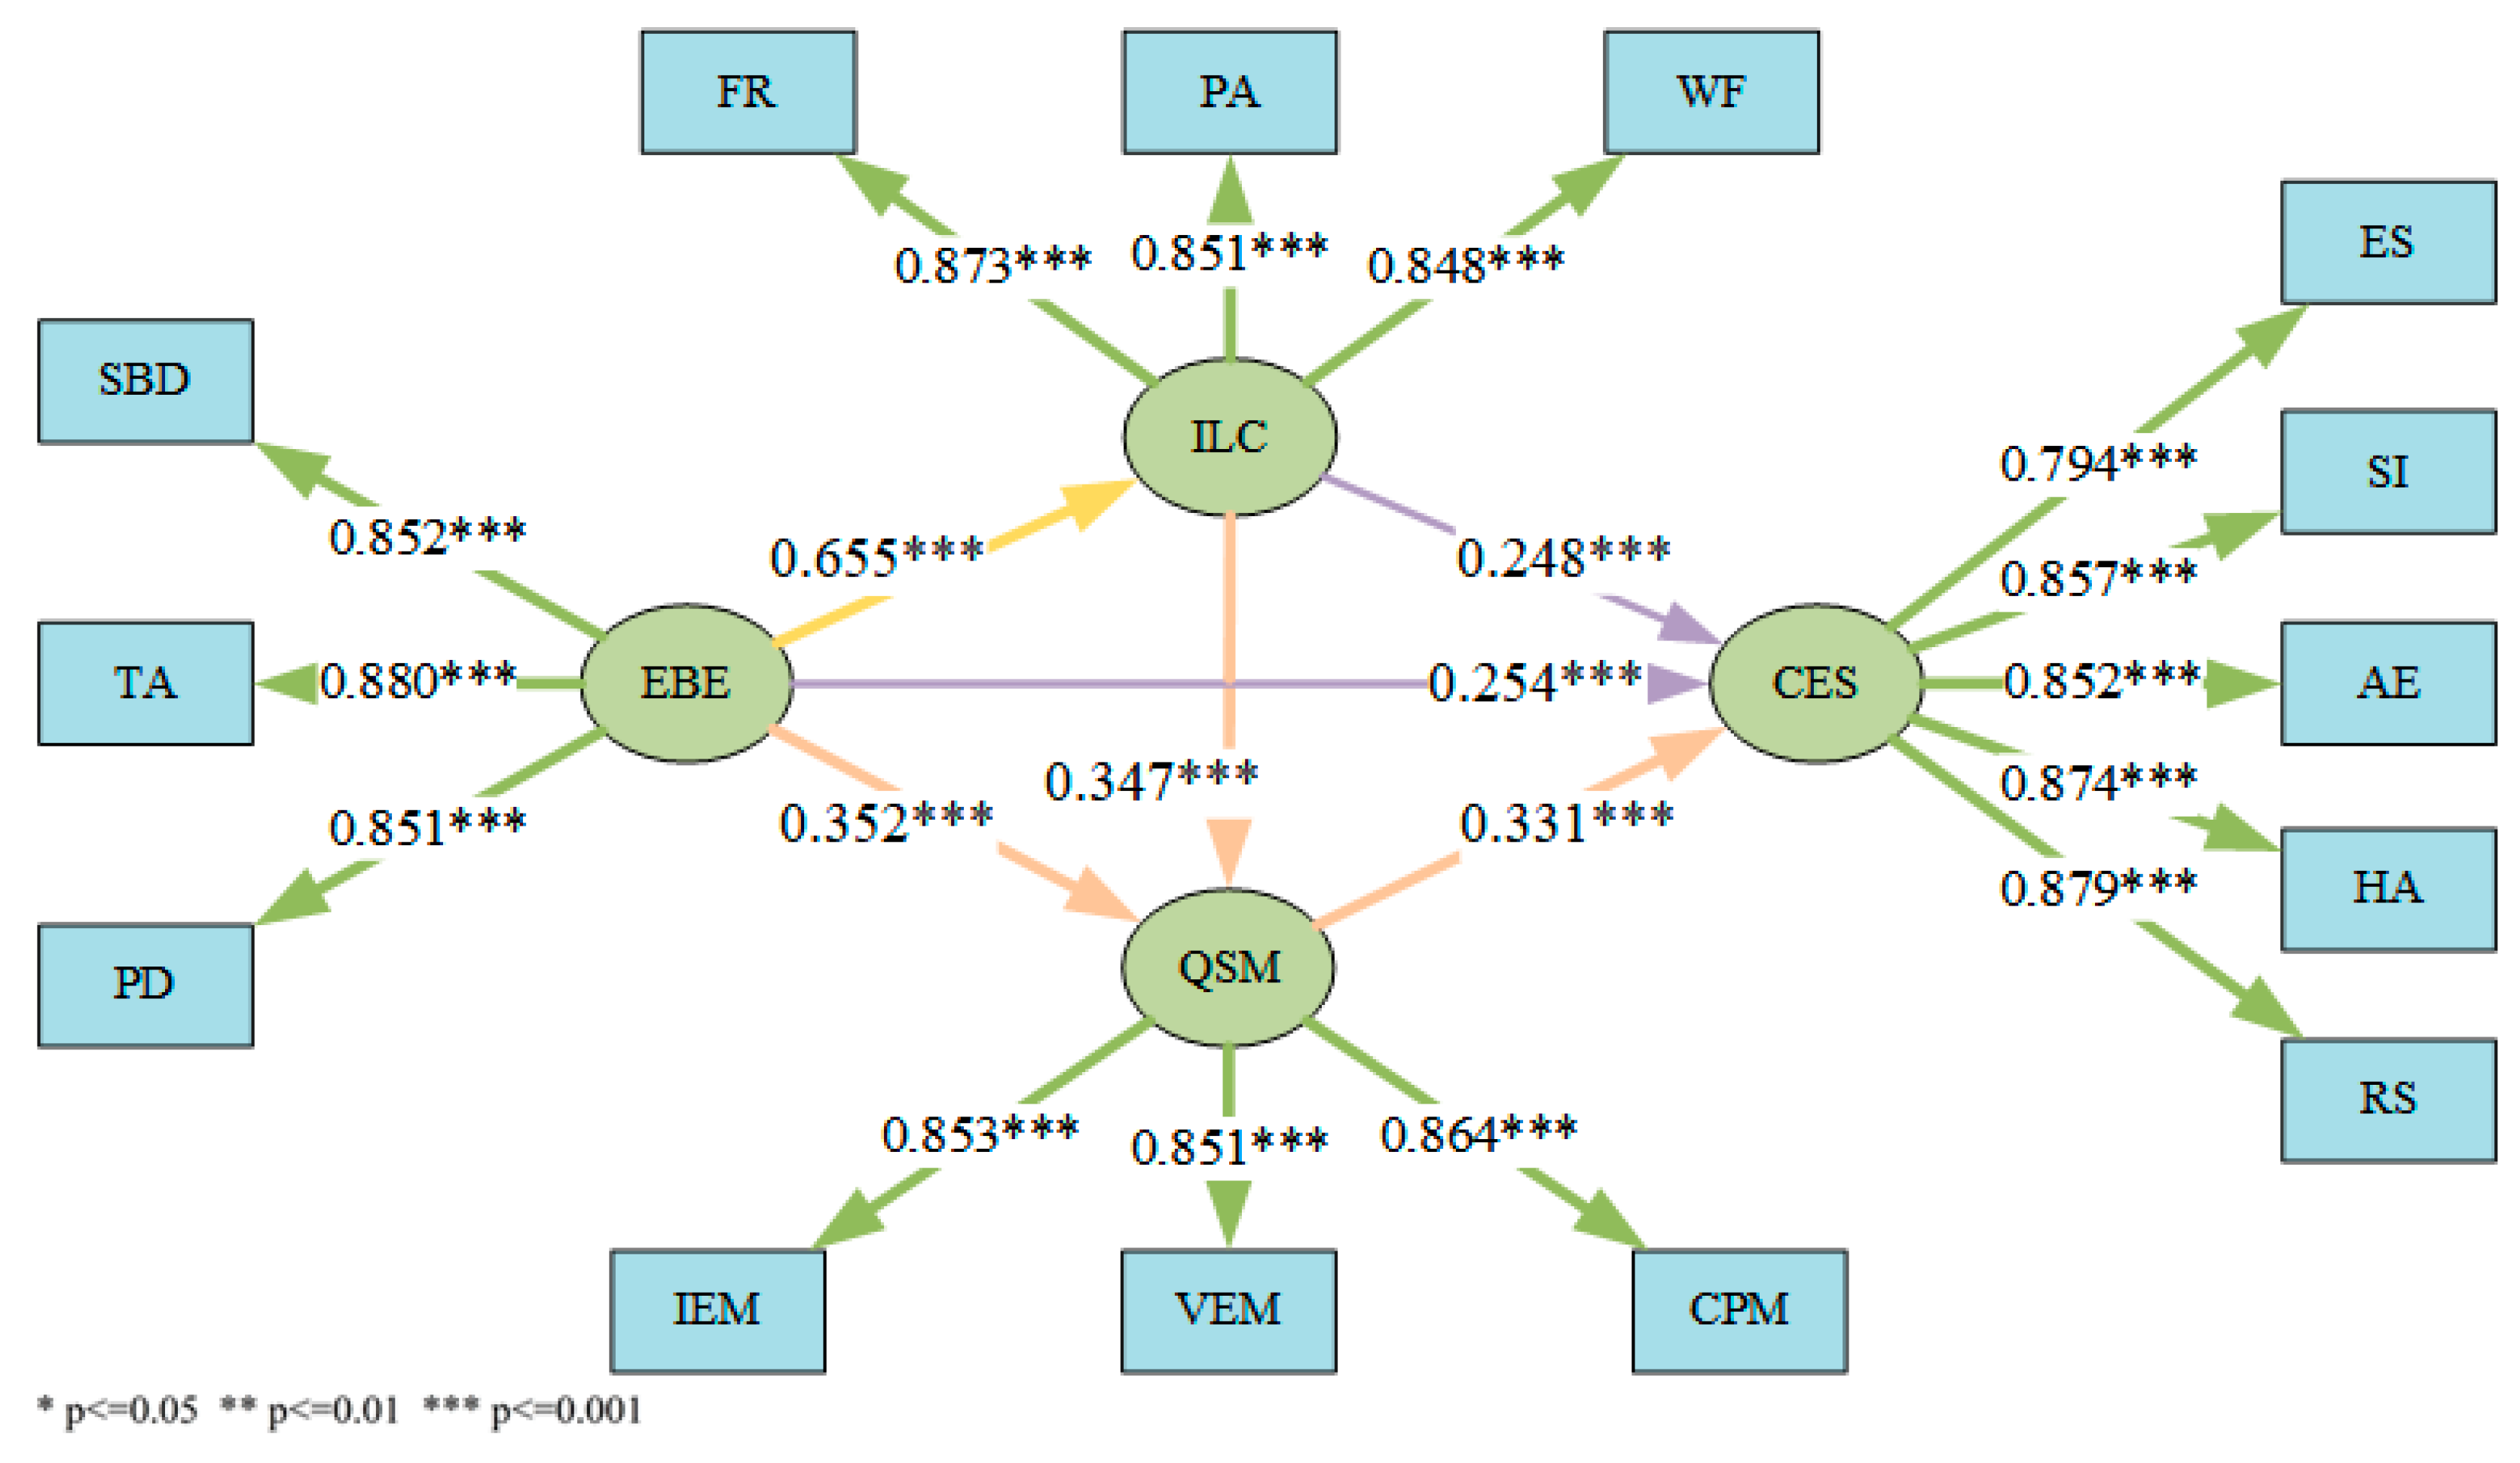
Based on the validated PLS-SEM model (Figure 11), this study reveals a coherent, sequentially transmitted mechanism underlying residents’ perception differences in CES within UPGS. All path coefficients reached statistical significance (p < 0.001), fully supporting research hypotheses H1–H6.
Analysis of the direct effects reveals a clear hierarchy of proximal drivers. QSM emerged as the most potent direct driver (β = 0.331, p < 0.001; ƒ2 = 0.133), indicating that service management experience proximately shapes final evaluations. The ILC also showed a significant positive direct effect (β = 0.248, p < 0.001), functioning as the essential physical medium for CES experiences. While the EBE exhibited a direct effect of comparable magnitude (β = 0.254, p < 0.001), its significantly greater total effect (β = 0.608) indicated a more complex, mediation-dominant mechanism of influence.
The perceptual differences are primarily explained by a robust multi-mediation transmission system. The EBE’s influence was largely indirect, with 58.2% of its total effect (β = 0.354) mediated through other constructs. Two significant indirect pathways were identified: EBE → ILC → CES (β = 0.163) and EBE → QSM → CES (β = 0.116). Critically, the chained mediation pathway EBE → ILC → QSM → CES (β = 0.075) delineates the complete logical sequence from environmental foundation to perceptual outcome. This path illustrates how favorable external conditions foster superior internal landscapes, which in turn create both the necessity and the capacity for high-standard management services, thereby collectively driving elevated CES perceptions.
Furthermore, the model elucidates a synergistic interaction between core physical and managerial attributes. ILC significantly amplified its total impact (Total effect = 0.363) through QSM (ILC → QSM → CES, β = 0.115). This interaction highlights that even with comparable physical foundations, divergent management performance is a key determinant of varied perceptual outcomes. The strength of this landscape-management synergy fundamentally explains the heterogeneity in perception levels observed across different parks.
It is noteworthy that the total effect of EBE on CES perceptions (β = 0.608) substantially exceeds its direct effect (β = 0.254). This marked discrepancy underscores the critical mediating role of indirect pathways in translating the advantages of the external built environment into perceptible benefits for residents. From the perspective of urban resource allocation, this strong mediation effect suggests that investment strategies should not be limited to the unidimensional optimization of the external built environment. Instead, a coordinated approach along the EBE–ILC–QSM pathway is warranted, wherein improvements to a park’s external surroundings are complemented by concurrent upgrades to its internal landscape composition. Such alignment helps prevent efficiency losses that may arise from decoupled interventions. Regarding locational inequality, the mediating effect significantly amplifies the perceptual gap between parks in core urban areas and those on the periphery. Parks in core areas benefit from favorable external built environments, which, combined with high-quality internal landscape composition and service management, continuously reinforce their advantages. In contrast, parks in peripheral areas face a dual constraint: they are disadvantaged not only by inferior external conditions but also by weak mediating pathways. This structural disparity suggests that policy resources should be redirected toward peripheral areas. Increased investment in internal landscape composition and service management in these areas may help mitigate the entrenched perceptual gap arising from locational differences. From the perspective of fiscal and institutional support, it is essential to establish a coordinated mechanism that links improvements in the external built environment with enhancements in internal landscape composition and service management quality. Incorporating the synergistic upgrading of ILC and QSM into the performance criteria for urban park development, while allocating dedicated funding specifically for strengthening mediating pathways, would enable more effective transmission of EBE advantages through robust mediating processes. Such a strategy would ultimately contribute to more equitable and high-quality provision of CES in UPGS.
In summary, the findings indicate that CES perception differences do not stem from isolated factors but emerge from an integrated, sequentially transmitted driving system. Within this system, the EBE acts as the foundational contextual precondition, the ILC serves as the core physical medium that manifests these conditions, and QSM functions as the pivotal transformational agent that converts latent environmental and landscape potentials into tangible experiential outcomes.

3.3.2. Moderating Effects on the Driving Pathways

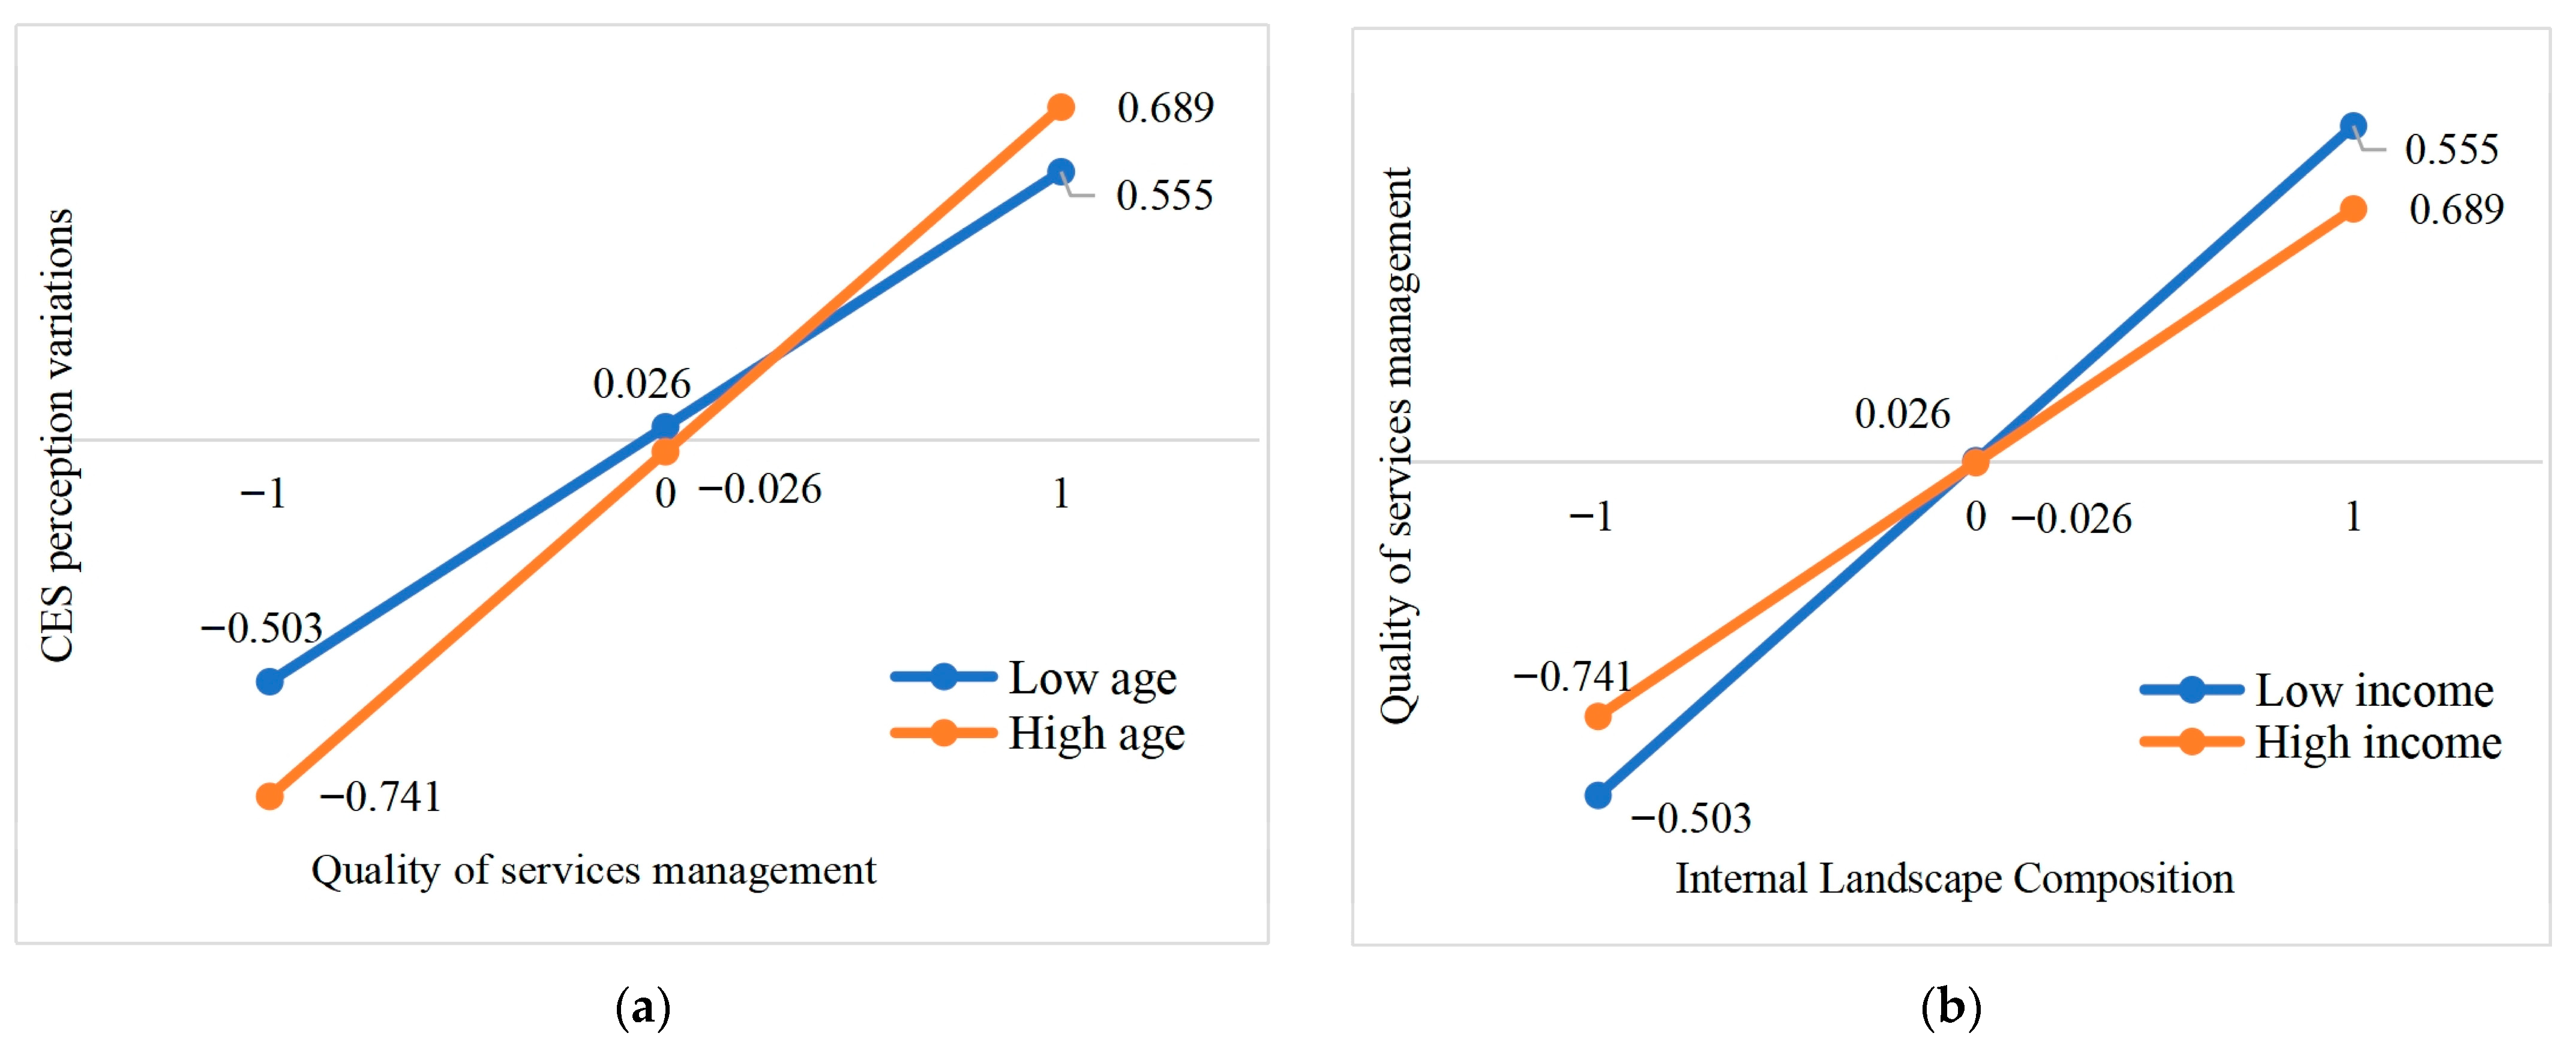
To systematically investigate the moderating role of RSB within the theoretical model, five key variables were examined, including gender, age, monthly income, education level, and occupation. Moderating effects for binary and ordinal variables were assessed using linear regression models with interaction terms, while multi-categorical variables were analyzed via group comparison approaches. The influence of RSB on the hypothesized driving pathways is visually summarized in Figure 12. The analysis revealed distinct moderating patterns. Specifically, for hypothesis H6, the interaction between QSM and age reached statistical significance (β = 0.093, p = 0.037), indicating that age moderates the relationship between QSM and residents’ CES perception variations. Older residents exhibit a stronger positive response to improvements in service quality. Regarding hypothesis H5, the interaction between ILC and monthly income approached marginal significance (β = −0.079, p = 0.069), suggesting a potential, though not fully conclusive, moderating role of income in the pathway from ILC to QSM. As income increases, the positive influence of landscape optimization on perceived service quality appears to diminish, indicating that higher-income groups may be less sensitive to enhancements in management services resulting from landscape improvements. No statistically significant moderating effects were detected for the remaining socioeconomic variables across any pathways in the model, based on both p-value and z-score criteria.

4. Discussion

4.1. Integrated Insights into CES Perceptions from Dual-Source Data

Environmental psychology theory indicates that human perception of the environment involves a dual process, consisting of both spontaneous, context-dependent, immediate responses and reflective, integrated, systematic judgments [61]. Traditional questionnaire surveys can gather reflective data with demographic representativeness. However, they are often influenced by recall bias and social desirability effects. Consequently, they struggle to capture real-time psychological experiences in dynamic environmental settings [62]. In contrast, large-scale social media data can record authentic instant behaviors and emotional expressions from the public [63]. Nonetheless, such data are subject to challenges like sample bias (e.g., an overrepresentation of younger user groups). This may limit the generalizability of findings, and these data often do not directly uncover underlying causal relationships [64]. Therefore, this study employs a sequential mixed-methods design that integrates online social media data, offline questionnaire surveys, and spatial data to systematically investigate the differences in residents’ perceptions of CES in UPGS and their underlying driving mechanisms. Social media captures spontaneous emotional expressions, while questionnaires generate reflective evaluations, making the two approaches highly complementary. Social media data provide fine-grained, real-time emotional responses within specific contexts, whereas questionnaire data offer structured interpretations from sociocultural and demographic perspectives [65,66].
Although the physical environments of the studied parks are relatively homogeneous, the mixed-methods approach effectively differentiates between “immediate reactions” and “systematic evaluations”. This integration enhances both the breadth and depth of insight, leading to a more comprehensive understanding of residents’ perceptions and experiences of CES in parks [67].
Analysis based on spontaneous expressions from social media reveals that residents’ perceptions of CES exhibit notable dynamism and non-linear characteristics [68]. Such a process of value formation is characterized by its real-time generation and high context dependency. These qualities are often difficult to capture through traditional survey methods, which rely on retrospective accounts or preset response options [69]. This finding suggests that many critical cultural service experiences do not exist as static attributes of parks, but rather emerge spontaneously during real-time, context-specific interactions between individuals and their environment, fluctuating dynamically with situational factors [70]. Consequently, this insight prompts a conceptual shift in understanding CES from a static classification of services toward a theoretical perspective that emphasizes dynamic generation and process-based construction, thereby highlighting the immediacy, contextual embeddedness, and interactive nature of perception.
This study proposed and validated a sequential mixed-methods analytical framework that integrates BERTopic topic modeling with PLS-SEM. The framework first employs BERTopic, a deep learning-based technique. It inductively identifies core dimensions of residents’ perceptions of CES and their associated driving factors from unstructured social media texts, thereby generating quantitative indicators grounded in authentic contextual expressions. While these dimensions conceptually align with traditional typologies such as those of the MA and CICES, their underlying logic of generation differs fundamentally [2,71]. Traditional classification systems are derived from top-down expert synthesis and present static knowledge structures [72]. In contrast, the dimensions identified in this study emerge from spontaneous, context-specific expressions by the public, reflecting a bottom-up and dynamically evolving perceptual construct. Thus, the theoretical contribution of this study is twofold. First, it is not merely about proposing new classification labels. Second, it lies in employing a data-driven approach to reveal how CES dimensions are dynamically perceived and constructed in real-time within authentic experiences. In doing so, it advances the evolution of related research from static classification toward a dynamic, process-oriented understanding.
Building on this foundation, the data-driven dimensions derived from BERTopic were used to construct a structural model, which was systematically tested using PLS-SEM with integrated multi-source data to examine causal pathways and underlying mechanisms among the variables. This framework constitutes a complete methodological cycle. BERTopic extracts empirically grounded constructs and hypotheses from large-scale natural language data. Meanwhile, PLS-SEM rigorously validates the structural relationships among these constructs. This integration not only enhances the ecological validity and theoretical explanatory power of the measurement model but also strengthens the robustness of causal inferences. Consequently, it offers a systematic approach that combines exploratory and confirmatory methods for investigating the core question of how residents dynamically perceive CES in real-world settings.
This study acknowledges the limitation of anonymity inherent in social media data and, through sensitivity analyses based on proxy user segmentation, demonstrates that the core CES dimensions remain robust across different behavioral groups. However, it is crucial to further clarify that the Weibo data are characterized by a user base skewed toward younger and more digitally engaged populations [73]. This bias is not merely a matter of sample composition but fundamentally shapes the semantic boundaries and conceptual connotations of the CES themes identified by BERTopic [62].
The linguistic style of younger user groups tends to favor concise, emotionally expressive language, and they are more inclined to share experiences with strong social appeal, such as social interactions and leisure check-ins [74]. This tendency leads the BERTopic clustering process to assign greater weight to CES dimensions that are easily disseminated through short, rapidly shared texts. These dimensions include aesthetic experiences and recreational services. As a result, these dimensions become more prominent within the resulting topic structure [75,76]. In contrast, cultural services that require nuanced description or deeper reflection, such as emotional restoration or intergenerational heritage transmission, may be underrepresented in the corpus [77]. Consequently, they may be dimensionally reduced or merged. This suggests that the CES thematic dimensions identified by the model represent a structured representation of explicitly articulated CES experiences within the digital public sphere, shaped jointly by the expressive preferences of specific user groups and the discursive practices of the platform. This precisely underscores the necessity of integrating structured questionnaire surveys with social media data. Questionnaires, through their predefined demographic frameworks, ensure that potentially silent groups and the potentially implicit CES dimensions they may hold are systematically incorporated into the analysis. While Weibo data reveal what is publicly articulated and how thematic structures are shaped by user characteristics, questionnaires respond to how different groups evaluate CES [78]. The complementarity between the two provides a critical entry point for understanding the selective construction of CES within social contexts.
At a theoretical level, by connecting data-driven discovery with theory-driven validation, this framework advances CES research beyond static classification frameworks toward a more dynamic and experiential theoretical understanding. From a practical standpoint, this evidence-based analytical tool enables the systematic identification of key factors shaping public perception and satisfaction. It thereby provides a scientific basis and decision-making support for the precise planning, adaptive management, and service enhancement of UPGS.

4.2. Heterogeneity and Synergy in CES Perceptions

Elucidating the heterogeneity in residents’ perceptions of CES in UPGS holds critical theoretical and practical significance for accurately identifying diverse public needs and optimizing park service provision. This study confirms that while overall perception intensity is high, significant differences exist across CES dimensions, revealing a structured perceptual hierarchy. Aesthetic experience emerged as the most strongly perceived dimension, consistent with its established role as the core visual attractor of green spaces [20]. In contrast, perceptions of social interactions and health-promoting activities demonstrated greater volatility, being more susceptible to contextual constraints such as environmental disturbances, facility conditions, and crowding [79,80]. The lower satisfaction associated with recreational services and educational service points to deficits in their current provision, particularly regarding content depth, format innovation, and alignment with heterogeneous user expectations [27,81,82].
Notably, the analysis revealed a significant synergistic correlation between recreational services and educational services. This finding suggests a complementary relationship wherein recreational settings foster a relaxed atmosphere conducive to cultural enrichment, which in turn adds intellectual or spiritual value to the leisure experience. Such complementarity helps mitigate perceptional disparities between these two dimensions. This nuance challenges perspectives that treat CES dimensions as largely independent, indicating instead that the strength of inter-CES synergies is likely context-dependent. Divergent preferences for CES bundles among residents may be explained by variations in cultural backgrounds, leisure habits, and attitudes toward “edutainment”.
These patterns collectively underscore that residents’ evaluations are not uniform but are structured by both the inherent properties of service types and their interrelationships. The relational analytical framework employed here thus provides a sharper lens for capturing the intrinsic connections within the CES construct, moving beyond siloed assessments toward a more integrated understanding of park experiences.
The specific CES combinations identified through correlation analysis raise a critical theoretical question: do the observed synergies, such as those between aesthetic experience and social interaction or between health activity and recreational service, reflect patterns unique to UPGS, or do they represent generalizable phenomena with broader explanatory value? UPGS characterized by high accessibility, social vibrancy, and semi-natural environments may amplify certain service synergies [83]. Dense visitation and visually appealing landscapes foster the integration of social interaction into aesthetic experiences [84], while recreational infrastructure directly supports the coupling of health activity with leisure. Such configurations may be less salient in wilderness or productive landscapes [85].
Conversely, some synergies may originate from universal psychological or social foundations. The link between aesthetic experience and social interaction may reflect a fundamental human inclination toward shared emotional engagement [86], while the alignment of health activity with recreation may embody a holistic conception of well-being integrating physical and mental dimensions. These underlying associations may persist across contexts, manifesting through diverse service expressions. Thus, a more nuanced interpretation suggests that intrinsic relationships among CES may follow certain universal logics, yet their dominant configurations and synergistic strength are significantly moderated by situational factors, including ecosystem type, user demographics, cultural norms, and management practices [23]. The patterns observed in this study offer an instructive case for understanding the complexity of CES dynamics in human-nature interactions. Future comparative research across ecosystems and cultural settings is needed to delineate which synergies are universal and which are context-dependent, thereby supporting the development of more refined CES theory and context-sensitive management strategies.

4.3. Driving Mechanisms Through Sequential Pathways

While existing studies have confirmed that perceptions of CES are influenced by multiple factors [37,87], the intrinsic mechanisms underlying the formation of residents’ CES perception variations in UPGS remain insufficiently explored. Based on PLS-SEM, this study systematically quantified the structural relationships and influence pathways among various driving factors. It thereby elucidated the intrinsic mechanisms underlying the formation of residents’ perception differences in CES within UPGS. The research identified the EBE, ILC, and QSM as key factors influencing residents’ CES perception variations. Results from PLS-SEM and mediation path analysis indicate that the EBE exerts both a direct effect on CES perception variations and indirect effects through a serial mediation pathway involving ILC and QSM. This finding aligns with existing research on the spatial heterogeneity of CES perceptions. It further substantiates the systemic and transmissive characteristics of parks as carriers of ecological well-being [88]. As noted in related studies, parks located in areas of high development intensity often possess more complete landscape amenities and managerial resources [89]. This may exacerbate CES perception disparities among residents from different neighborhoods.
This study further identifies the mediating role of the ILC between the EBE and QSM, subsequently influencing residents’ CES perception variations. This result aligns with the views that landscape attributes are key variables affecting visitor experiences [90]. Specifically, high-quality internal landscapes often reflect external resource investment and locational advantages. They directly shape residents’ usage experiences. Consequently, they serve as crucial mediating variables influencing service management quality and CES perception differences [52]. Furthermore, the EBE also independently influences CES perception variations through QSM. This suggests that even with comparable landscape conditions, differences in the EBE can indirectly widen experience gaps among residents through uneven allocation of management resources [91,92]. This reflects how urban parks in practice often form service gradients due to unequal external resource input. Such structural differences may further affect the equitable use of UPGS by different social groups, thereby shaping CES perception disparities across multiple dimensions.
Notably, within the overall model, QSM emerges as the central node influencing residents’ CES perception differences, with its effect strength surpassing other pathways. This highlights the pivotal role of management factors in explaining perception disparities. High-quality service management can directly enhance residents’ identification with and perceived intensity of cultural services by improving activity experiences [93,94]. Even under similar landscape conditions, differences in management levels can lead to significant distinctions in resident perceptions [95]. The study also identified a synergistic effect between the EBE and QSM. Differences in external conditions can affect QSM through resource allocation mechanisms. This thereby amplifies disparities in residents’ cultural service perceptions. This finding aligns with the conclusion that physical conditions form the foundation of CES cognition, while management optimization is an effective pathway to enhance perceptions [29]. Urban expansion and socioeconomic disparities systematically affect the accessibility and service quality of green spaces. This exacerbates inequalities in ecological well-being among different groups [96]. Consequently, park planning must emphasize spatial balance in resource investment and service provision to alleviate the structural contradictions underlying CES perception differences.
Based on the PLS-SEM analysis results, this study systematically tested the six proposed hypotheses. Regarding direct effects, the external built environment exhibited significant positive influences on residents’ CES perception differences (H1: β = 0.254, p < 0.001), internal landscape composition (H2: β = 0.655, p < 0.001), and perceived service quality (H3: β = 0.352, p < 0.001). These results provide support for H1, H2, and H3. This finding confirms that the external built environment not only directly shapes residents’ perceptions of cultural services. It also operates through multiple pathways by influencing the intrinsic qualities of parks. Among these, H2 demonstrated an exceptionally strong effect size (ƒ2 = 0.752). This indicates that the external built environment possesses substantial explanatory power regarding internal landscape composition. It thereby serves as a strategic leverage point yielding the greatest multiplier effect.
Internal landscape composition exhibited significant direct effects on both CES perception differences (H4: β = 0.248, p < 0.001) and perceived service quality (H5: β = 0.347, p < 0.001). These results provide support for H4 and H5. These findings indicate that the internal landscape elements of parks serve a dual role. They are not only direct sources of residents’ cultural experiences but also a fundamental foundation for the formation of perceived service quality. Perceived service quality exerted the most pronounced influence on CES perception differences (H6: β = 0.331, p < 0.001). This provides the strongest support among all hypotheses. The 95% confidence interval for this effect ranged from 0.204 to 0.464. This underscores the central role of managerial factors in explaining variations in resident perceptions. Specifically, with 95% confidence, an improvement of one standard deviation in perceived service quality is expected to result in an increase of between 0.204 and 0.464 standard deviations in residents’ CES perceptions.
Mediation analysis further elucidated the chain-mediated relationships among the hypothesized pathways. The total effect of the external built environment on CES perception differences was β = 0.608 (p < 0.001). Specifically, the external built environment influenced CES perception differences through three indirect pathways. First, a single mediation pathway through internal landscape composition (EBE → ILC → CES, β = 0.163, p < 0.001). Second, a single mediation pathway through perceived service quality (EBE → QSM → CES, β = 0.116, p < 0.001). Third, a sequential mediation pathway through both internal landscape composition and perceived service quality (EBE → ILC → QSM → CES, β = 0.075, p < 0.01). The statistical significance of this sequential mediation pathway (p < 0.01) provides a mechanistic explanation. It shows how the direct effect of the external built environment (H1) is amplified through the indirect pathways H2–H5–H6. These findings reveal that the external built environment carries substantial spillover value and chain-based multiplier effects. This suggests that its comprehensive benefits should be systematically accounted for in planning evaluations.
In summary, all six hypotheses were empirically supported. Notably, H2 (EBE → ILC) emerged as the most influential pathway within the model (β = 0.655, ƒ2 = 0.752). This indicates that optimizing the external built environment represents a strategic leverage point capable of generating the greatest multiplier effect. Meanwhile, H6 (QSM → CES) functioned as a central node within the model (β = 0.331, ƒ2 = 0.133). Its effect size and mediating role underscore the pivotal position of managerial factors in explaining variations in CES perception. This hypothesis-testing framework serves two purposes. It not only validates the theoretical model but also quantifies the differential contributions of each factor to perceptual divergence. It thereby provides a quantitative benchmark for translating statistical relationships into concrete planning practices.

4.4. Socioeconomic Contingencies in Perception Shaping

The analysis identified a significant positive moderating effect of age on the relationship between QSM and CES perception variations, indicating that older residents demonstrate heightened responsiveness to improvements in service quality. This demographic group exhibits a more pronounced increase in CES perception levels in response to enhanced QSM, which aligns with existing research on the distinctive environmental perception patterns and affective attachments formed by older adults [97]. This cohort tends to engage with natural settings through physical activity and social interaction, rendering them particularly sensitive to service enhancements that facilitate such engagements, including maintenance standards, safety provisions, and organized activities. Theoretically, older individuals often possess greater discretionary leisure time and develop stronger emotional bonds with urban parks. Consequently, optimizations in QSM directly address their core needs for comfort, safety, and socialization, thereby amplifying non-material CES benefits such as sense of place and subjective well-being [67].
In contrast, monthly income exhibited a marginally significant negative moderating effect along the ILC → QSM pathway. Specifically, as income rises, the positive influence of landscape optimization on perceived QSM appears attenuated. This pattern may be explained by the broader leisure options available to higher-income groups, including access to private green spaces and travel opportunities, which can dilute the marginal perceived utility derived from landscape improvements within any single public park [98]. Elevated expectation thresholds among higher-income residents may further reduce their sensitivity to incremental enhancements in park services management. This finding, although not reaching the conventional threshold for statistical significance (p = 0.069), provides preliminary evidence suggesting that socioeconomic status may exert multidimensional effects. While higher income may reinforce recognition of the intrinsic economic value of landscapes, it can simultaneously weaken the translation of landscape improvements into perceived service quality. Such differential moderation highlights the complex interplay between objective environmental attributes, subjective service evaluations, and residents’ socioeconomic positioning, suggesting that uniform management strategies may not equally address the expectations of diverse demographic segments.
Given that this moderating effect only reached marginal significance, it should be regarded as a preliminary finding requiring further validation in future research with larger sample sizes. Therefore, future studies should employ expanded samples to examine the robustness of this effect and further investigate the specific mechanisms through which income influences residents’ perceptions of CES in UPGS.

4.5. Limitations and Future Research

This study has several limitations that point to meaningful avenues for future inquiry.
First, while social media text data were leveraged to capture public discourse, the analysis did not incorporate visual content (e.g., photographs or videos). This omission may constrain a fully dimensional understanding of residents’ visual engagement with CES. Future research could employ computer vision techniques, such as convolutional neural networks (CNNs) or visual sentiment analysis, to systematically examine image data from platforms. Integrating multimodal data would offer a more holistic perspective on how aesthetic and experiential qualities of landscapes are perceived, shared, and valued, thereby enriching the ecological validity and interpretive power of CES assessments.
Second, while this study investigated environmental and social drivers of CES perception differences, the role of temporal dynamics, such as diurnal, seasonal, or event-based fluctuations, remains underexplored. Perceptions of CES are likely sensitive to temporal contexts, yet the current cross-sectional design limits insights into these dynamics. Longitudinal or repeated-measures designs, coupled with time-series analysis, could elucidate how temporal factors moderate the relationships between drivers and CES perceptions, offering a more process-oriented understanding of ecosystem service experience.
Third, this study examined CES perception differences and their driving mechanisms at the park scale, focusing primarily on the internal and external environmental attributes of individual parks. However, it did not account for the connectivity, synergistic effects, or service coverage of urban green spaces as an integrated network. Within the context of the “park city” and “15-min city” planning concepts, residents’ access to CES in UPGS is often shaped more by the spatial configuration of green space networks and the accessibility of these spaces within residential catchments than by the attributes of individual parks alone. Residents’ cumulative CES benefits may depend more on the density and connectivity of green spaces within their daily activity radius than on the performance of individual parks. Future research should extend the spatial scale to the urban green space network or the 15-min living catchment, exploring how the overall configuration, connectivity, and equitable distribution of green spaces influence residents’ CES perceptions. Such an extension would provide more targeted insights for optimizing urban green space system planning and promoting equity in the provision of ecosystem services.
Fourth, this study employed a cross-sectional questionnaire design, and both QSM and CES data were obtained from the same respondents, which may have introduced a slight overestimation of path coefficients due to common method bias. However, the full collinearity test (with all VIF values below 1.96) and the independent replication of key findings using social media data collectively indicate that this bias did not substantially compromise the robustness of the core conclusions. Future research could further strengthen the validity of causal inferences by adopting three methodological strategies: separating the measurement time points for predictor and outcome variables, incorporating objective or multi-source measurements, and pre-specifying and including marker variables in the survey design.
Fifth, several methodological limitations warrant further reflection. Although the merging and labeling of BERTopic topics were cross-validated by multiple coders, the process may still involve some degree of subjective interpretation. Future research could incorporate multimodal semantic analysis to enhance the objectivity of thematic classification. In addition, discretizing continuous variables into ordinal categories may affect the precision of parameter estimates. Future studies could re-estimate the model using the original continuous forms of these variables and compare the resulting path coefficients and significance levels across the two data preprocessing approaches to assess the robustness of the findings. Finally, this study did not conduct an in-depth analysis of heterogeneity across different park types. Patterns of CES perception may vary among distinct categories of green spaces, and future research could employ multi-group analysis to examine the moderating role of park typology.

5. Conclusions

This study employs a sequential two-phase analytical framework to systematically investigate the heterogeneity in residents’ perceptions of CES within UPGS and their underlying driving mechanisms, addressing a critical gap in urban sustainability research. In the initial phase, BERTopic modeling and keyword frequency analysis were applied to Weibo review texts. This process identified five core CES perception dimensions: recreational services, aesthetic experiences, health-promoting activities, social interactions, and educational services. Concurrently, it extracted four primary categories of key drivers along with their measurable indicators: residents’ socioeconomic background, the external built environment, internal landscape composition, and service quality management. In the subsequent phase, questionnaire data from 313 respondents across 13 representative urban parks in Wuhan were integrated with park-related geospatial datasets. A PLS-SEM was constructed and validated to systematically examine the pathways through which the identified drivers influence residents’ CES perception differences. This sequential mixed-methods design effectively bridges exploratory data-driven pattern discovery with confirmatory model testing, providing a comprehensive understanding of the perceptual drivers and their complex interrelationships.
By integrating social media data with questionnaire survey data, this study reveals their synergistic and complementary value in capturing residents’ perceptions of CES, offering a methodological advancement for socially inclusive sustainability research. The two data sources capture distinct yet interrelated dimensions of perceived experiences, namely spontaneous public expressions versus structured reflective evaluations, thereby offering a more integrated and comprehensive understanding of CES perception. Social media text data, derived from large-scale user-generated content, exhibit characteristics of real-time expression, contextual specificity, and emotional valence. These data effectively capture residents’ behavioral tendencies and affective responses in authentic usage contexts, particularly reflecting the perspectives of younger populations and frequent park users. In contrast, questionnaire survey data are valued for their structured format, reflective nature, and demographic representativeness, providing systematic coverage across diverse socioeconomic backgrounds. This makes them particularly well-suited for testing theoretical hypotheses and examining causal mechanisms while ensuring that no social group is systematically excluded from the analysis. The main findings are as follows:
First, significant synergistic correlations exist among different CES types, with the strongest interrelationships observed between aesthetic experiences and social interactions (r = 0.93), as well as between health-promoting activities and recreational services (r = 0.91). These synergies suggest that well-designed urban green spaces can deliver multiple co-benefits simultaneously, maximizing the socio-ecological returns from limited land resources, which is a key principle of sustainable urban development. Satisfaction analysis revealed statistically significant differences across CES dimensions: aesthetic experiences received the highest satisfaction score (M = 3.59), followed by social interactions (M = 3.51), while recreational services scored the lowest (M = 3.31); health-promoting activities and educational services attained intermediate and comparable levels of satisfaction (M = 3.35). This satisfaction hierarchy provides empirical benchmarks for prioritizing resource allocation in sustainability-oriented park management.
Second, PLS-SEM analysis elucidated a multi-level transmission mechanism underlying the perception differences, with all path coefficients statistically significant (p < 0.001). The external built environment functions as a foundational contextual factor, exerting indirect effects through three mediation pathways: EBE → ILC → CES (β = 0.163), EBE → QSM → CES (β = 0.116), and the chained mediation path EBE → ILC → QSM → CES (β = 0.075). The total indirect effect of EBE on CES (β = 0.354) accounted for 58.2% of its total effect (β = 0.608), indicating that the influence of the built environment is predominantly transmitted through internal landscape and service management. Internal landscape composition serves as the physical carrier of CES perceptions, contributing both directly (ILC → CES: β = 0.248, p < 0.001) and indirectly via service management (ILC → QSM → CES: β = 0.115, p < 0.001). Notably, quality of service management emerged as the most critical direct driver of perception differences (QSM → CES: β = 0.331, p < 0.001), with the largest effect size among direct predictors (f2 = 0.133), and played a central mediating role throughout the transmission chain, participating in two of the three significant indirect pathways from EBE to CES. This finding identifies QSM as a high-leverage intervention point for urban planners seeking to enhance the sustainability outcomes of park investments, as improvements in service management can amplify the benefits of both built environment and landscape features.
Third, the moderating effects of socioeconomic background variables displayed differentiated patterns. A significant positive moderating effect of age was found on the relationship between service quality management and CES perception differences (β = 0.093, p = 0.037), indicating that older residents tend to respond more positively to improvements in service quality. This finding suggests that age-friendly service enhancements, such as accessible facilities, seating, and restrooms, can yield particularly significant sustainability benefits for an aging urban population, thereby addressing a demographic trend with profound implications for SDG 11′s commitment to “inclusive” cities. Monthly income showed a marginally significant negative moderating trend along the pathway from internal landscape composition to service quality management (β = −0.079, p = 0.069), implying that the influence of landscape optimization on perceived service quality weakens with higher income levels. This income-based disparity raises concerns about environmental justice: if higher-income residents are less sensitive to landscape improvements, while lower-income groups rely more heavily on park quality for their CES benefits, then uniform investment strategies may inadvertently exacerbate existing inequities in access to urban green space amenities. Other socioeconomic variables, including gender, education level, and occupation, did not demonstrate statistically significant moderating effects.
In summary, by integrating social media big data with survey data, this study develops and validates a theoretical model that explains the formation mechanisms of residents’ CES perception differences in UPGS, contributing to the evidence base for sustainable urban planning. These findings provide a scientific basis for evidence-based policy implementation in park city construction. In high-density old urban areas, priority should be given to enhancing landscape quality through small-scale renewal interventions to compensate for limited ecological space. Compact, mixed-use functional zones should be developed to strengthen the synergy between recreation and services, while vertical greening may be increased to enrich aesthetic experiences. Furthermore, optimizing the deployment of cleaning and mobile services during peak hours can leverage the mediating role of QSM in improving overall perceived quality. In newly developed urban areas, ecological spaces and infrastructure should be integrated at the planning stage to foster long-term CES provision capacity. Large-scale ecological landscapes can be strategically aligned with public transport networks to amplify the functions of aesthetic experiences and health-promoting activities. For different population groups, differentiated strategies should be implemented to advance social sustainability. For older adults, priority should be given to optimizing age-friendly facilities and supporting services. For low-income groups, equitable access to free public amenities and inclusive services should be ensured, alongside improvements to the external built environment of surrounding parks to mitigate spatial injustice. These targeted interventions align with the core principle of “leaving no one behind” embedded in the 2030 Agenda for Sustainable Development. Collectively, these findings provide scientific support for urban planning and land management strategies that balance spatial justice with the diverse needs of population groups, ultimately contributing to the transition toward more resilient, equitable, and sustainable cities in line with SDG 11.


Author Contributions

X.L.: Conceptualization, Writing—original draft, Writing—review & editing, Funding acquisition, Methodology, Supervision. Z.Y.: Writing—original draft, Writing—review & editing, Data curation, Investigation, Visualization, Formal analysis. L.L.: Conceptualization, Methodology. Y.W.: Data curation, Investigation. J.H.: Data curation, Investigation. All authors have read and agreed to the published version of the manuscript.

Funding

This work was supported by the Department of Education of Hubei Province [grant number 24Q176]; and the National Natural Science Foundation of China [grant number 72404082].

Institutional Review Board Statement

This study was conducted in accordance with the Declaration of Helsinki and approved by the Scientific Research Ethics and Technology Safety Committee of Hubei University of Technology (protocol code HBUT20250073, 9 October 2025).

Informed Consent Statement

Informed consent was obtained from all participants involved in the study. Prior to participation, each individual was presented with a consent statement and explicitly confirmed their agreement via a checkbox mechanism.

Data Availability Statement

Due to the privacy and confidentiality of the respondents, the questionnaire data used in this study cannot be made publicly available. However, the data can be accessed upon reasonable request and under the condition that participant privacy is ensured, by contacting the corresponding author.

Acknowledgments

We thank all participants of the questionnaire survey for their time and valuable input, which greatly contributed to this study.

Conflicts of Interest

Author Lin Lei was employed by the company Changjiang Ecology (Hubei) Technology Development Co., Ltd. The remaining authors declare that the research was conducted in the ab-sence of any commercial or financial relationships that could be construed as a potential conflict of interest.

Abbreviations

The following abbreviations are used in this manuscript:
RSRecreational services
AEAesthetic experiences
HAHealth-promoting activities
SISocial interactions
ESEducational services
EBEExternal built environment of parks
ILCInternal landscape composition of parks
QSMQuality of services management
SBDSurrounding building density
TATransportation accessibility
PDPopulation density
FRFacility richness
PAPark area
WFWater features
IEMIntra-park environment management
VEMVisitor experience management
CPMCultural promotion management

Appendix A

Survey Questionnaire on the Driving Mechanisms of Residents’ Perception Variations in Cultural Ecosystem Services of Urban Park Green Spaces.
Dear Sir/Madam,
Hello! Thank you very much for helping us complete this questionnaire survey. This questionnaire is solely for academic research purposes and will not be used for any other purpose.
Cultural ecosystem services (CES) in urban parks refer to the direct or indirect benefits that humans derive from the various ecosystems within urban parks. These services represent humans’ subjective perceptions of objective ecosystems and primarily include types such as aesthetic experiences, health-promoting activities, social interactions, recreational services, and educational services. This questionnaire has been designed to explore the driving mechanisms behind the differences in residents’ CES perceptions provided by urban park ecosystems. During the survey process, your privacy will not be compromised. There are no right or wrong answers to the questionnaire; please simply mark the appropriate box based on your personal experiences in the park. Once again, thank you for your patience and assistance.
Table A1. Basic information.
VariableCategories
GenderMaleFemale
Age<1818–3031–4546–60>60
Income<CNY2000CNY2000–CNY5000CNY5000–CNY9000>CNY9000
Education attainmentHigh school and belowCollegeBachelor’s degreeMaster’s degree or above
OccupationStudentsCorporate employeesPublic sector employeesFreelancersRetireesOthers
Table A2. Assessment scale for quality of park service management.
Types of Service Management QuestionsQuality Evaluation (from Low to High)
Intra-park environment management How would you rate the quality of environmental management services in the park, such as plant maintenance, hygiene, and facility maintenance?12345
Visitor experience management How would you rate the quality of tour experience management services, such as road guidance, facility distribution, and safety protection in the park?12345
Cultural promotion management How would you rate the quality of cultural promotion management services, such as the establishment of cultural landscapes, the organisation of related activities, and park promotion?12345
Table A3. Perceptions of Cultural Ecosystem Services Provided by Park Ecosystems.
CES TypesQuestionsPerceived Satisfaction (from Low to High)
Aesthetic experiencesYour perceived satisfaction with the park’s aesthetic aspects, including landscape design, vegetation, and water features12345
Health-promoting activitiesYour perceived satisfaction with the park’s fitness and walking facilities12345
Social interactionsYour perceived satisfaction with the park’s interactive aspects, including making friends and strengthening relationships with family and friends12345
Recreational servicesYour overall satisfaction with the park’s recreational experiences, including leisure, entertainment, and relaxation, is:12345
Educational servicesYour perceived satisfaction with the park’s educational aspects, including animal and plant science and landscape knowledge12345

Appendix B

Table A4. Topic similarity matrix.
Topic 0Topic 1Topic 2Topic 3Topic 4Topic 5Topic 6Topic 7Topic 8Topic 9
Topic 01.00 0.82 0.79 0.78 0.84 0.67 0.82 0.66 0.44 0.30
Topic 10.82 1.00 0.67 0.77 0.82 0.63 0.66 0.59 0.38 0.26
Topic 20.79 0.67 1.00 0.68 0.61 0.62 0.83 0.59 0.78 0.36
Topic 30.78 0.77 0.68 1.00 0.81 0.53 0.72 0.54 0.38 0.25
Topic 40.84 0.82 0.61 0.81 1.00 0.85 0.68 0.76 0.33 0.30
Topic 50.67 0.63 0.62 0.53 0.85 1.00 0.65 0.82 0.44 0.24
Topic 60.82 0.66 0.83 0.72 0.68 0.65 1.00 0.68 0.62 0.26
Topic 70.66 0.59 0.59 0.54 0.76 0.82 0.68 1.00 0.40 0.20
Topic 80.44 0.38 0.78 0.38 0.33 0.44 0.62 0.40 1.00 0.39
Topic 90.30 0.26 0.36 0.25 0.30 0.24 0.26 0.20 0.39 1.00
Table A5. Coding manual.
TopicTopic NameDescriptionKeywordsDistinguishing Features
Topic 0Food-related leisureEngaging in leisure activities such as dining, culinary experiences, and nightlife within or in the vicinity of parks.Delicious, evening, weekend, Yue Lake, Sha Lake, cuisine, restaurant, snacks, barbecue, picnicDistinction from Topic 3: Topic 0 focuses on food-related leisure, whereas T3 centers on recreational activities.
Topic 1Culture landmark check-insVisiting and documenting experiences at urban cultural landmarks or science-education sites, often accompanied by social media check-ins.Riverbank, Dong Lake, avenue, punch In, Huanghelou, Yangtze River Bridge, landmark, scenic spot, tourismDistinction from Topic 5: Topic 1 focuses on cultural and science landmark check-ins, whereas Topic 5 emphasizes emotional attachment and sense of belonging.
Topic 2Social sharingDocumenting and sharing park experiences through social media platforms such as RED and Weibo.Pigeons, notes, Hanfu, RED, personal journals, photography, sharing, documenting, vlog, videoDistinction from Topic 8: Topic 2 emphasizes the act of sharing itself, whereas Topic 8 focuses on the aesthetic experience of nature.
Topic 3Natural aestheticsAppreciation of natural landscape aesthetics in parks, such as flowers and seasonal changes.Cherry blossoms, tulips, romance, blooming, East Lake, lotus, plum blossoms, ginkgo, red maple, osmanthus.Distinction from Topic 4: Topic 3 focuses on the aesthetic appreciation of flowers, whereas Topic 4 emphasizes wetland and aquatic ecology.
Topic 4Wetland ecologyExperiencing the wetland, lake, and other aquatic ecological environments within parks.Sha Lake, wetland, Yue Lake, park area, lotus, lake water, water body, ecology, environment, greenDistinction from Topic 3: Topic 4 focuses on the overall aquatic ecosystem, not merely visual appreciation.
Topic 5Sense of place and belongingDeveloping a sense of place identity, emotional attachment, and belonging toward a park.Sha Lake, Tang Lake, park area, riverbank, chrysanthemums, memories, recollection, nostalgia, childhood, hometownDistinction from Topic 1: Topic 5 emphasizes emotional depth and long-term connection to place, rather than one-time check-in behaviors.
Topic 6Seasonal recreationRecreational activities undertaken in parks during specific seasons, holidays, or festive periods.Tomorrow, weather, autumn, early winter, weekend, start of autumn, Mid-Autumn Festival, spring, summer, winterDistinction from Topic 0: Topic 6 emphasizes seasonal recreational activities, whereas Topic 0 focuses on food-related leisure experiences.
Topic 7Physical activity and fitnessEngaging in physical activities such as sports, fitness, and running within parks.Yue Lake, dormitory, sports, group photos, people, running, cycling, fitness, walking, strollingDistinction from Topic 0: Topic 7 emphasizes physical activities and exercise, whereas Topic 0 focuses on food-related leisure.
Topic 8Culture and historyExperiencing the historical and cultural significance, humanistic depth, and artistic atmosphere of parks.Sixteen, technology, museum, history, culture, heritage site, ancient architecture, memorial, martyr, revolutionDistinction from Topic 1: Topic 8 emphasizes historical and cultural connotations, whereas Topic 1 focuses on landmark appearances and check-in behaviors.
Topic 9Family-oriented social interactionSocial interactions including parent–child activities, family outings, and gatherings with friends.Photos, sharing, time, child-accompanying, children, parent–child, family, friendsDistinction from Topic 2: Topic 9 emphasizes interpersonal interaction, whereas Topic 2 focuses on the act of sharing through digital media.
Table A6. Comparison of 10 initial topics and 5 merged CES dimensions.
CESConnotationTopicKeywordsDocument CountRepresentative Comments
RSProvide spaces for outdoor leisure and recreational activities.Topic 0delicious, evening, weekend, Yue Lake, Sha Lake2848“On a lovely weekend, Beibei and I took a taxi to the park. We ended up getting in the wrong cab, but luckily, we were with good friends, and everywhere is fun with them, haha. In the evening, we had fried chicken and pan-fried buns at the park. They were so, so tasty.”
Topic 6tomorrow, weather, autumn, winter, weekend736“Embracing the fullness of autumn with all its warmth and sweetness, I went to Guishan Park on a sunny weekend to gather the essence of the season.”
AEOffer scenic natural and cultural landscapes that deliver spiritual enjoyment and aesthetic pleasure.Topic 3cherry, tulip, romantic, bloom, Dong Lake1554“A casual shot at Qingshan Park, with plum blossoms in full bloom as spring approaches.”
Topic 4Sha Lake, wetlands, Yue Lake, park area, lotus1225“I happened to pass by Tanghu Park and stopped for a quick visit, only to be completely captivated by its beauty. The park features wetland scenery reminiscent of Jiangnan water towns. With numerous small peninsulas along the lake, every step offers a new and captivating view, making it hard for visitors to leave.”
Topic 5Sha Lake, Tang Lake, park area, riverbank, chrysanthemum1184“It had been a long time since I last visited Jiefang Park. Wandering among the vibrant blossoms, strolling and stopping along the way, it felt as though I had returned to my childhood.”
HAServe as venues for physical exercise and mental relaxation, contributing to both physical and psychological well-being.Topic 7Yue Lake, dormitory, sports, group photo, people525“A snippet of daily life: While others have been at work for an hour already, I’ve already run 5 kilometers around Moon Lake Park. I consoled myself by thinking, at least I really made the most of this beautiful weather and lovely spring day.”
SIFunction as settings that facilitate social connections and enable the sharing of experiences through online platforms.Topic 2pigeon, notes, Hanfu (traditional Chinese Han clothing), RED (a social media platform in China), field notes1610“My park check-in is seriously belated, and my procrastination is getting out of hand. To celebrate reaching 10,000 followers on my notes, I went to Zhongshan Park to take some nice photos and share them. The schedule was super tight. I managed to check out four spots in just one day.”
Topic 9image, share, time48“I had planned to take some parent-child photos in traditional Hanfu costume, but the heavy makeup and the big headpiece completely freaked my kid out. They burst into tears, thinking they could no longer find their mom. We had to give up on the idea, take off the headpiece, and, as compensation, ended up going to Heping Park’s amusement park while still wearing that heavy makeup. So much for that plan!”
ESProvide access to places of cultural and historical significance and support environmental education activities.Topic 1riverbank, Dong Lake, avenue, punch In, Huanghelou1874“After leaving Jianghan Road, we headed to the Guishan Scenic Area. By the riverbank, we spent about an hour enjoying the breeze, watching trains cross the Yangtze River Bridge, and quietly taking in the beauty of the Yangtze. Later, we climbed to the highest point of Guishan Park. From this vantage point, we enjoyed the sweeping views, a truly refreshing and delightful experience.”
Topic 8sixteen, technology306“On Saturday, we took the two little ones to a tech exhibition at Moon Lake Park. They had so much fun. The older brother was busy playing on his own the whole time and even made a new friend. It was the younger one’s first visit, and he was so excited he could only squeal with delight.”
Figure A1. Visualization of BERTopic-Derived Topic Keywords by Daytime and Nighttime Weibo User Groups: (a) Daytime Period; (b) Nighttime Period.
Sustainability 18 02578 g0a1

References

  1. Olaiya, A. Transforming our world: The 2030 agenda for sustainable development: International. Civ. Eng. Siviele Ingenieurswese 2015, 24, 26–30. [Google Scholar]
  2. MEA. Millennium Ecosystem Assessment: Ecosystems and Human Well-Being: Synthesis; Island Press: Washington, DC, USA, 2005. [Google Scholar]
  3. Luo, J.; Xing, X.; Wu, Y.; Zhang, W.; Chen, R.S. Spatio-temporal analysis on built-up land expansion and population growth in the Yangtze River Delta Region, China: From a coordination perspective. Appl. Geogr. 2018, 96, 98–108. [Google Scholar] [CrossRef]
  4. Wei, H.; Qi, W.; Liu, S.; Li, Y.; Yin, Y. Uncovering the edge urban villages using social media big data: A case study in Beijing, China. Habitat Int. 2025, 159, 103357. [Google Scholar] [CrossRef]
  5. Zhou, W.; Yu, W.; Qian, Y.; Han, L.; Pickett, S.T.A.; Wang, J.; Li, W.; Ouyang, Z. Beyond city expansion: Multi-scale environmental impacts of urban megaregion formation in China. Natl. Sci. Rev. 2022, 9, 79–91. [Google Scholar] [CrossRef]
  6. Wang, S.; Zhang, J.; Wang, F.; Dong, Y. How to achieve a balance between functional improvement and heritage conservation? A case study on the renewal of old Beijing city. Sustain. Cities Soc. 2023, 98, 104790. [Google Scholar] [CrossRef]
  7. Li, K.; Hou, Y.; Randall, M.T.; Skov-Petersen, H.; Li, X. The spatio-temporal trade-off between ecosystem and basic public services and the urbanization driving force in the rapidly urbanizing region. Sustain. Cities Soc. 2024, 111, 105554. [Google Scholar] [CrossRef]
  8. Ferreira, C.; Kalantari, Z.; Pereira, P. Liveable cities: Current environmental challenges and paths to urban sustainability. J. Environ. Manag. 2021, 277, 111458. [Google Scholar] [CrossRef]
  9. CJJ/T85-2002; Standard for Classification of Urban Green Space. China Government Online: Beijing, China, 2018.
  10. Wang, Z.; Miao, Y.; Xu, M.; Zhu, Z.; Qureshi, S.; Chang, Q. Revealing the differences of urban parks’ services to human wellbeing based upon social media data. Urban For. Urban Green. 2021, 63, 127233. [Google Scholar] [CrossRef]
  11. Paudel, S.; States, S.L. Urban green spaces and sustainability: Exploring the ecosystem services and disservices of grassy lawns versus floral meadows. Urban For. Urban Green. 2023, 84, 127932. [Google Scholar] [CrossRef]
  12. Wang, L.; Xu, Y.; Zhai, Y.; Xu, D.; Fang, J.; Yao, Y.; Ren, Z.; Ye, Z. The ideal characteristics of landscape pattern and morphological spatial pattern for seasonal cool island regulation in urban park green space. Urban For. Urban Green. 2025, 107, 128813. [Google Scholar] [CrossRef]
  13. Haque, M.N.; Sharifi, A. Barriers and solutions for just and equitable access to urban ecosystem services: A critical analysis. Int. J. Sustain. Dev. World Ecol. 2025, 32, 370–386. [Google Scholar] [CrossRef]
  14. Yang, Y.; Jiang, L.; Ma, X.; Liu, S.; Wang, L. A comprehensive approach to identifying the supply and demand of urban park cultural ecosystem services in the Megalopolis area of Shanghai, China. Land 2025, 14, 455. [Google Scholar] [CrossRef]
  15. De Luca, C.; Calcagni, F.; Tondelli, S. Assessing distributional justice around Cultural Ecosystem Services (CES) provided by urban green areas: The case of Bologna. Urban For. Urban Green. 2024, 101, 128556. [Google Scholar] [CrossRef]
  16. Wei, J.; Chen, M.; Chu, C.; Zhao, C.; Xia, X.; Li, Y. Assessing cultural ecosystem services supply–demand balance of urban parks in the context of old and new urban districts. Ecol. Indic. 2024, 159, 111688. [Google Scholar] [CrossRef]
  17. Xu, S.; Li, J.; Gao, X.; Zhao, H.; Hu, J.; Yuan, S. Framework for analyzing the relationship between supply, demand, and flow of recreational services in urban park green spaces. Ecol. Indic. 2024, 166, 112403. [Google Scholar] [CrossRef]
  18. Blake, D.; Carver, S.; Ziv, G. Demographic, natural and anthropogenic drivers for coastal Cultural ecosystem services in the Falkland Islands. Ecol. Indic. 2021, 130, 108087. [Google Scholar] [CrossRef]
  19. Li, J.; Huang, Z.; Zhu, Z.; Ding, G. Coexistence Perspectives: Exploring the impact of landscape features on aesthetic and recreational values in urban parks. Ecol. Indic. 2024, 162, 112043. [Google Scholar] [CrossRef]
  20. Arslan, E.S.; Orucu, O.K. MaxEnt modelling of the potential distribution areas of cultural ecosystem services using social media data and GIS. Environ. Dev. Sustain. 2021, 23, 2655–2667. [Google Scholar] [CrossRef]
  21. Inácio, M.; Gomes, E.; Bogdzevič, K.; Kalinauskas, M.; Zhao, W.; Pereira, P. Mapping and assessing coastal recreation cultural ecosystem services supply, flow, and demand in Lithuania. J. Environ. Manag. 2022, 323, 116175. [Google Scholar] [CrossRef]
  22. Wan, C.; Shen, G.Q.; Choi, S. Effects of physical and psychological factors on users’ attitudes, use patterns, and perceived benefits toward urban parks. Urban For. Urban Green. 2020, 51, 126691. [Google Scholar] [CrossRef]
  23. Tian, T.; Huang, S.; Wu, Y.; Zeng, P.; Liu, Y.; Che, Y. Non-ecological factors affect human interaction with urban nature and perception of cultural ecosystem services. Sustain. Cities Soc. 2024, 112, 105643. [Google Scholar] [CrossRef]
  24. Johansson, M.; Pedersen, E.; Weisner, S. Assessing cultural ecosystem services as individuals’ place-based appraisals. Urban For. Urban Green. 2019, 39, 79–88. [Google Scholar] [CrossRef]
  25. Tandarić, N.; Ives, C.D.; Watkins, C. Can we plan for urban cultural ecosystem services? J. Urban Ecol. 2020, 6, juaa016. [Google Scholar] [CrossRef]
  26. Zhang, K.; Tang, X.; Zhao, Y.; Huang, B.; Liu, M.; Luo, E.; Li, Y.; Jiang, T.; Zhang, L.; Wang, Y.; et al. Differing perceptions of the youth and the elderly regarding cultural ecosystem services in urban parks: An exploration of the tour experience. Sci. Total Environ. 2022, 821, 153388. [Google Scholar] [CrossRef]
  27. Gai, S.; Fu, J.; Rong, X.; Dai, L. Users’ views on cultural ecosystem services of urban parks: An importance-performance analysis of a case in Beijing, China. Anthropocene 2022, 37, 100323. [Google Scholar] [CrossRef]
  28. Zhou, L.; Guan, D.; Huang, X.; Yuan, X.; Zhang, M. Evaluation of the cultural ecosystem services of wetland park. Ecol. Indic. 2020, 114, 106286. [Google Scholar] [CrossRef]
  29. Nie, X.; Wang, Q.; Wu, J.; Wang, H.; Chen, Z.; He, J. Effectively enhancing perceptions of cultural ecosystem services: A case study of a karst cultural ecosystem. J. Environ. Manag. 2022, 315, 115189. [Google Scholar] [CrossRef]
  30. Cabana, D.; Ryfield, F.; Crowe, T.P.; Brannigan, J. Evaluating and communicating cultural ecosystem services. Ecosyst. Serv. 2020, 42, 101085. [Google Scholar] [CrossRef]
  31. Liu, Z.; Hanley, N.; Campbell, D. Linking urban air pollution with residents’ willingness to pay for greenspace: A choice experiment study in Beijing. J. Environ. Econ. Manag. 2020, 104, 102383. [Google Scholar] [CrossRef]
  32. Meng, S.; Huang, Q.; Zhang, L.; He, C.; Inostroza, L.; Bai, Y.; Yin, D. Matches and mismatches between the supply of and demand for cultural ecosystem services in rapidly urbanizing watersheds: A case study in the Guanting Reservoir basin, China. Ecosyst. Serv. 2020, 45, 101156. [Google Scholar] [CrossRef]
  33. Baumeister, C.F.; Gerstenberg, T.; Plieninger, T.; Schraml, U. Exploring cultural ecosystem service hotspots: Linking multiple urban forest features with public participation mapping data. Urban For. Urban Green. 2020, 48, 126561. [Google Scholar] [CrossRef]
  34. Dang, H.; Li, J. Supply-demand relationship and spatial flow of urban cultural ecosystem services: The case of Shenzhen, China. J. Clean. Prod. 2023, 423, 138765. [Google Scholar] [CrossRef]
  35. Ghermandi, A.; Camacho, V.; Trejo-Espinosa, H. Social media-based analysis of cultural ecosystem services and heritage tourism in a coastal region of Mexico. Tour. Manag. 2019, 77, 104002. [Google Scholar] [CrossRef]
  36. Riechers, M.; Barkmann, J.; Tscharntke, T. Diverging perceptions by social groups on cultural ecosystem services provided by urban green. Landsc. Urban Plan. 2018, 175, 161–168. [Google Scholar] [CrossRef]
  37. Dade, M.C.; Mitchell, M.G.E.; Brown, G.; Rhodes, J.R. The effects of urban greenspace characteristics and socio-demographics vary among cultural ecosystem services. Urban For. Urban Green. 2020, 49, 126641. [Google Scholar] [CrossRef]
  38. Bi, X.; Gan, X.; Jiang, Z.; Li, Z.; Li, J. How do landscape patterns in urban parks affect multiple cultural ecosystem services perceived by residents? Sci. Total Environ. 2024, 946, 174255. [Google Scholar] [CrossRef]
  39. Valánszki, I.; Kristensen, L.S.; Jombach, S.; Ladányi, M.; Filepné Kovács, K.; Fekete, A. Assessing relations between cultural ecosystem services, physical landscape features and accessibility in central-eastern Europe: A PPGIS empirical study from Hungary. Sustainability 2022, 14, 754. [Google Scholar] [CrossRef]
  40. Chen, C.; Luo, W.; Li, H.; Zhang, D.; Kang, N.; Yang, X.; Xia, Y. Impact of perception of green space for health promotion on willingness to use parks and actual use among young urban residents. Int. J. Environ. Res. Public Health 2020, 17, 5560. [Google Scholar] [CrossRef]
  41. Cheng, X.; Van Damme, S.; Li, L.; Uyttenhove, P. Cultural ecosystem services in an urban park: Understanding bundles, trade-offs, and synergies. Landsc. Ecol. 2022, 37, 1693–1705. [Google Scholar] [CrossRef]
  42. Aranguren, M. Adding experiments to the classical survey-interview mix: A three-method design for supporting micro-to-macro explanations in sociology. Res. Soc. Stratif. Mobil. 2024, 91, 100933. [Google Scholar] [CrossRef]
  43. Bradley, V.C.; Kuriwaki, S.; Isakov, M.; Sejdinovic, D.; Meng, X.-L.; Flaxman, S. Unrepresentative big surveys significantly overestimated US vaccine uptake. Nature 2021, 600, 695–700. [Google Scholar] [CrossRef] [PubMed]
  44. Pan, Y.; Hashim, N.H.; Goh, H.C. A Systematic Review of Place-Based Cultural Ecosystem Service Assessments: Categories, Methods, and Research Trends. Sustainability 2026, 18, 644. [Google Scholar] [CrossRef]
  45. Su, R.; Ye, S.; Yu, L.; Wu, J.; Kang, Y.; Chen, R. Social and ecological factors on the perception of cultural ecosystem services and disservices: Insights from Shanghai, China. Landsc. Urban Plan. 2025, 259, 105373. [Google Scholar] [CrossRef]
  46. Li, J.; Li, K.; Wang, Y.; Jiao, R. Comparative Study on the Perception of Cultural Ecosystem Services in Taibai Mountain National Forest Park from Different Stakeholder Perspectives. Land 2024, 13, 2207. [Google Scholar] [CrossRef]
  47. WMSB. Statistical Communiqué on the National Economic and Social Development of Wuhan City; Wuhan Government Online: Wuhan, China, 2024. [Google Scholar]
  48. DeVellis, R.F. Scale Development: Theory and Applications; Sage Publications: Thousand Oaks, CA, USA, 2016. [Google Scholar]
  49. Phillips, A.; Plastara, D.; Khan, A.Z.; Canters, F. Integrating public perceptions of proximity and quality in the modelling of urban green space access. Landsc. Urban Plan. 2023, 240, 104875. [Google Scholar] [CrossRef]
  50. Leng, S.; Sun, R.; Yang, X.; Chen, L. Global inequities in population exposure to urban greenspaces increased amidst tree and nontree vegetation cover expansion. Commun. Earth Environ. 2023, 4, 464. [Google Scholar] [CrossRef]
  51. Buonocore, C.; Carlucci, F.; Ciciarelli, L.; Papola, A.; Tinessa, F.; Tocchi, D.; Trincone, B. Accessibility analysis in spatial planning: A case of special economic zones (SEZs) in Campania, Southern Italy. Land Use Policy 2023, 132, 106763. [Google Scholar] [CrossRef]
  52. Wang, Y.; Shi, X.; Cheng, K.; Zhang, J.; Chang, Q. How do urban park features affect cultural ecosystem services: Quantified evidence for design practices. Urban For. Urban Green. 2022, 76, 127713. [Google Scholar] [CrossRef]
  53. Edeh, E.; Lo, W.-J.; Khojasteh, J. Review of Partial Least Squares Structural Equation Modeling (PLS-SEM) Using R: A Workbook. Struct. Equ. Model.-A Multidiscip. J. 2023, 30, 165–167. [Google Scholar] [CrossRef]
  54. Monecke, A.; Leisch, F. semPLS: Structural Equation Modeling Using Partial Least Squares. J. Stat. Softw. 2012, 48, 1–32. [Google Scholar] [CrossRef]
  55. Fornell, C.; Larcker, D.F. Evaluating structural equation models with unobservable variables and measurement error. J. Mark. Res. 1981, 18, 39–50. [Google Scholar] [CrossRef]
  56. Henseler, J.; Dijkstra, T.; Sarstedt, M.; Ringle, C.; Diamantopoulos, A.; Straub, D.; Ketchen, D.J., Jr.; Hair, J.; Hult, G.T.M.; Calantone, R. Common Beliefs and Reality About PLS: Comments on Rönkkö and Evermann (2013). Organ. Res. Methods 2014, 17, 182–209. [Google Scholar] [CrossRef]
  57. Kock, N. Common Method Bias in PLS-SEM. Int. J. E-Collab. 2015, 11, 1–10. [Google Scholar] [CrossRef]
  58. Hair, J.; Hult, G.T.M.; Ringle, C.; Sarstedt, M. A Primer on Partial Least Squares Structural Equation Modeling (PLS-SEM), 2nd ed.; Springer International Publishing: Berlin/Heidelberg, Germany, 2016. [Google Scholar]
  59. Sarstedt, M.; Ringle, C.M.; Hair, J.F. Partial Least Squares Structural Equation Modeling. In Handbook of Market Research; Homburg, C., Klarmann, M., Vomberg, A., Eds.; Springer International Publishing: Cham, Switzerland, 2017; pp. 1–40. [Google Scholar]
  60. Hair, J.; Ringle, C.; Sarstedt, M. Partial Least Squares Structural Equation Modeling: Rigorous Applications, Better Results and Higher Acceptance. Long Range Plan. 2013, 46, 1–12. [Google Scholar] [CrossRef]
  61. Cavalcante, S.; Maciel, R.H. Métodos de avaliação da percepção ambiental. In Métodos de Pesquisa nos Estudos Pessoa-Ambiente, 1st ed.; Pinheiro, J.Q., Günther, H., Eds.; Casa do Psicólogo: São Paulo, Brazil, 2008. [Google Scholar]
  62. Huai, S.; Liu, S.; Zheng, T.; Van de Voorde, T. Are social media data and survey data consistent in measuring park visitation, park satisfaction, and their influencing factors? A case study in Shanghai. Urban For. Urban Green. 2023, 81, 127869. [Google Scholar] [CrossRef]
  63. Zhao, X.; Lu, Y.; Huang, W.; Lin, G. Assessing and interpreting perceived park accessibility, usability and attractiveness through texts and images from social media. Sustain. Cities Soc. 2024, 112, 105619. [Google Scholar] [CrossRef]
  64. Ghermandi, A.; Depietri, Y.; Orenstein, D.E. Human-nature interactions through a digital prism: Heterogeneity in user socio-demographics and content across social media platforms. Landsc. Urban Plan. 2026, 268, 105568. [Google Scholar] [CrossRef]
  65. Liang, H.; Yan, Q.; Yan, Y.; Zhang, L.; Zhang, Q. Spatiotemporal Study of Park Sentiments at Metropolitan Scale Using Multiple Social Media Data. Land 2022, 11, 1497. [Google Scholar] [CrossRef]
  66. Kong, L.; Liu, Z.; Pan, X.; Wang, Y.; Guo, X.; Wu, J. How do different types and landscape attributes of urban parks affect visitors’ positive emotions? Landsc. Urban Plan. 2022, 226, 104482. [Google Scholar] [CrossRef]
  67. Wu, Y.; Tang, L.; Huang, C.B.; Shao, G.; Hou, J.; Sabel, C.E. Enhancing human well-being through cognitive and affective pathways linking landscape sensation to cultural ecosystem services. Landsc. Ecol. 2024, 39, 175. [Google Scholar] [CrossRef]
  68. Keleş Özgenç, E.; Dönmez, A.H.; Özgenç, E. Evaluating Cultural Ecosystem Services Through Geospatial Social Media Data: A Study of Edirne City. J. Geovis. Spat. Anal. 2024, 8, 30. [Google Scholar] [CrossRef]
  69. Wykowski, J.H.; Starks, H. What Type of Self-Assessment Is Best for Your Educational Activity? A Review of Pre-Post, Now-Then, and Post-Only Designs. J. Gen. Intern. Med. 2025, 40, 1010–1015. [Google Scholar] [CrossRef] [PubMed]
  70. Yee, T.B.L.; Carrasco, L.R. Applying deep learning on social media to investigate cultural ecosystem services in protected areas worldwide. Sci. Rep. 2024, 14, 13700. [Google Scholar] [CrossRef] [PubMed]
  71. Haines-Young, R.; Potschin, M. Common International Classification of Ecosystem Services (CICES): 2011 Update; European Environment Agency: Copenhagen, Denmark, 2011. [Google Scholar]
  72. Hubatova, M.; McGinlay, J.; Parsons, D.J.; Morris, J.; Graves, A.R. Assessing Preferences for Cultural Ecosystem Services in the English Countryside Using Q Methodology. Land 2023, 12, 331. [Google Scholar] [CrossRef]
  73. Sultan, M.; Tump, A.N.; Ehmann, N.; Lorenz-Spreen, P.; Hertwig, R.; Gollwitzer, A.; Kurvers, R. Susceptibility to online misinformation: A systematic meta-analysis of demographic and psychological factors. Proc. Natl. Acad. Sci. USA 2024, 121, e2409329121. [Google Scholar] [CrossRef]
  74. Pang, D.; Guntuku, S.C.; Sherman, G.; Liu, T.; Rai, S.; Cho, Y.-M.; You, R.; Bakker, A.B.; Ungar, L.H. Understanding gender and age differences in language use: Cross-cultural insights from Weibo and Facebook. Humanit. Soc. Sci. Commun. 2025, 12, 1667. [Google Scholar] [CrossRef]
  75. Lu, J.; Zhang, H.; Zhang, X. Cultural ecosystem services in China’s national parks and their impact on public online engagement—Analysis of Douyin short videos data based on BERTopic modeling. J. Nat. Conserv. 2025, 87, 126969. [Google Scholar] [CrossRef]
  76. Souza, C.N.; Martínez-Arribas, J.; Correia, R.A.; Almeida, J.A.G.R.; Ladle, R.; Vaz, A.S.; Malhado, A.C. Using social media and machine learning to understand sentiments towards Brazilian National Parks. Biol. Conserv. 2024, 293, 110557. [Google Scholar] [CrossRef]
  77. Oguro, M.; Shibata, R. Quantifying effects of demographic biases on estimation of cultural ecosystem services using social media in Japan. Ecosyst. Serv. 2025, 76, 101777. [Google Scholar] [CrossRef]
  78. Sohail, S.S.; Khan, M.M.; Madsen, D.Ø.; Alam, M.A.; Irshad, R.R. Geospatial and Linguistic Analysis of Twitter Behavioral Trends: Examining the Impact of Socioeconomic Development on Social Media Use. Hum. Behav. Emerg. Technol. 2025, 2025, 1376983. [Google Scholar] [CrossRef]
  79. Rivera, E.; Timperio, A.; Loh, V.H.; Deforche, B.; Veitch, J. Important park features for encouraging park visitation, physical activity and social interaction among adolescents: A conjoint analysis. Health Place 2021, 70, 102617. [Google Scholar] [CrossRef]
  80. Veitch, J.; Ball, K.; Rivera, E.; Loh, V.; Deforche, B.; Best, K.; Timperio, A. What entices older adults to parks? Identification of park features that encourage park visitation, physical activity, and social interaction. Landsc. Urban Plan. 2022, 217, 104254. [Google Scholar] [CrossRef]
  81. Wang, Y.; Hayashi, K. Methodological development of cultural ecosystem services evaluation using location data. J. Clean. Prod. 2023, 396, 136523. [Google Scholar] [CrossRef]
  82. Koh, Y.F.; Loc, H.H.; Park, E. Towards a “city in nature”: Evaluating the cultural ecosystem services approach using online public participation GIS to support urban green space management. Sustainability 2022, 14, 1499. [Google Scholar] [CrossRef]
  83. Dushkova, D.; Taherkhani, M.; Konstantinova, A.; Vasenev, V.I.; Dovletyarova, E.A. Understanding Factors Affecting the Use of Urban Parks Through the Lens of Ecosystem Services and Blue–Green Infrastructure: The Case of Gorky Park, Moscow, Russia. Land 2025, 14, 237. [Google Scholar] [CrossRef]
  84. Wan, C.; Shen, G.Q.; Choi, S. Eliciting users’ preferences and values in urban parks: Evidence from analyzing social media data from Hong Kong. Urban For. Urban Green. 2021, 62, 127172. [Google Scholar] [CrossRef]
  85. Sikorski, P.; Gawryszewska, B.; Sikorska, D.; Chormański, J.; Schwerk, A.; Jojczyk, A.; Ciężkowski, W.; Archiciński, P.; Łepkowski, M.; Dymitryszyn, I.; et al. The value of doing nothing—How informal green spaces can provide comparable ecosystem services to cultivated urban parks. Ecosyst. Serv. 2021, 50, 101339. [Google Scholar] [CrossRef]
  86. Cross, E.S.; Darda, K.M.; Moffat, R.; Muñoz, L.; Humphries, S.; Kirsch, L.P. Mutual gaze and movement synchrony boost observers’ enjoyment and perception of togetherness when watching dance duets. Sci. Rep. 2024, 14, 24004. [Google Scholar] [CrossRef]
  87. Lyu, B.; Gao, Z.; Wang, Y.; Liu, J.; Zhang, L.; Song, J.; Pan, Y.; Cheng, M.; Liu, S.; Chen, Q.; et al. Seasonal Dynamics and Trade-Offs/Synergies of Cultural Ecosystem Services in Urban Parks: A Case Study of Chengdu, China. Land 2025, 14, 2126. [Google Scholar] [CrossRef]
  88. You, W.; Xu, H.; Duan, J.; Zhou, Y.; Li, J.; He, D.; Kizos, T. Assessing spatial differences of perceptions of cultural ecosystem services for coastal cultural landscape management: A case study from rural and urban areas in Quanzhou, China. J. Environ. Manag. 2025, 395, 127674. [Google Scholar] [CrossRef]
  89. Zhang, Y.; Zhao, L.; Hu, S. Assessing perception and equity of cultural ecosystem services in urban parks using social media data. Sci. Rep. 2025, 15, 33127. [Google Scholar] [CrossRef] [PubMed]
  90. Li, J.; Luo, J.; Deng, T.; Tian, J.; Wang, H. Exploring perceived restoration, landscape perception, and place attachment in historical districts: Insights from diverse visitors. Front. Psychol. 2023, 14, 1156207. [Google Scholar] [CrossRef] [PubMed]
  91. Liu, T.; Yu, L.; Chen, X.; Chen, Y.; Li, X.; Liu, X.; Cao, Y.; Zhang, F.; Zhang, C.; Gong, P. Identifying Potential Urban Greenways by Considering Green Space Exposure Levels and Maximizing Recreational Flows: A Case Study in Beijing’s Built-Up Areas. Land 2024, 13, 1793. [Google Scholar] [CrossRef]
  92. Vierikko, K.; Gonçalves, P.; Haase, D.; Elands, B.; Ioja, C.; Jaatsi, M.; Pieniniemi, M.; Lindgren, J.; Grilo, F.; Santos-Reis, M.; et al. Biocultural diversity (BCD) in European cities—Interactions between motivations, experiences and environment in public parks. Urban For. Urban Green. 2020, 48, 126501. [Google Scholar] [CrossRef]
  93. Cheng, Y.; Browning, M.H.E.M.; Zhao, B.; Qiu, B.; Wang, H.; Zhang, J. How can urban green space be planned for a ‘happy city’? Evidence from overhead- to eye-level green exposure metrics. Landsc. Urban Plan. 2024, 249, 105131. [Google Scholar] [CrossRef]
  94. Guo, R.; Ann Diehl, J.; Zhang, R.; Wang, H. Spatial equity of urban parks from the perspective of recreational opportunities and recreational environment quality: A case study in Singapore. Landsc. Urban Plan. 2024, 247, 105065. [Google Scholar] [CrossRef]
  95. Zhong, J.; Lin, Z.; Jia, F.; Schoenherr, T. Smooth or sticky? An analysis of service variability. Humanit. Soc. Sci. Commun. 2025, 12, 113. [Google Scholar] [CrossRef]
  96. Yang, H.; Jin, C.; Li, T. A paradox of economic benefit and social equity of green space in megacity: Evidence from Tianjin in China. Sustain. Cities Soc. 2024, 109, 105530. [Google Scholar] [CrossRef]
  97. Wang, C.; Luo, F. Differing perceptions on cultural ecosystem service values of urban forest landscapes for children and youths: A case study of Changsha, Central China. Urban For. Urban Green. 2025, 112, 129005. [Google Scholar] [CrossRef]
  98. Sun, X.; Liu, H.; Liao, C.; Nong, H.; Yang, P. Understanding recreational ecosystem service supply-demand mismatch and social groups’ preferences: Implications for urban–rural planning. Landsc. Urban Plan. 2024, 241, 104903. [Google Scholar] [CrossRef]
Figure 1. Study area and locations of the sampled parks.
Sustainability 18 02578 g001
Figure 2. Research workflow.
Sustainability 18 02578 g002
Figure 3. BERTopic topic modelling framework.
Sustainability 18 02578 g003
Figure 4. A hypothetical structural model.
Sustainability 18 02578 g004
Figure 5. Visualization of topic keywords from Weibo social media data related to UPGS. The values to each keyword indicate their relative importance weights within the topic, with larger values signifying a greater semantic contribution to the topic’s characterization.
Sustainability 18 02578 g005
Figure 6. This figure presents the CES analysis results derived from the BERTopic model applied to Weibo text data. It consists of four standard BERTopic output subplots, each designed to convey specific analytical information. A brief explanation of each subplot follows. (a) Topic Hierarchical Clustering Diagram: This subplot illustrates the initial topics identified by the HDBSCAN algorithm and their hierarchical clustering relationships. (b) Document-Topic Distribution Map: After dimensionality reduction using UMAP, each point represents a single comment, with colors indicating its primary topic assignment. This visualization reveals how comments are clustered within the semantic space. (c) Inter-topic Distance Map: This plot visualizes the cosine distances between topics, calculated based on their word vector representations. The red circle denotes Topic 0. (d) Semantic Weight Decline of Topic Keywords: This graph displays the cumulative c-TF-IDF weight contributed by the top N keywords for each topic. The inflection point in the curve helps determine the optimal number of keywords needed to characterize a given topic.
Sustainability 18 02578 g006
Figure 7. Topic similarity heatmap.
Sustainability 18 02578 g007
Figure 8. Geospatial analysis of the parks: (a) Surrounding building density; (b) Transportation accessibility; (c) Population density; (d) Facility richness; (e) Park area; (f) Water feature.
Sustainability 18 02578 g008
Figure 9. Correlation analysis of CES perceptions. *** p ≤ 0.001.
Sustainability 18 02578 g009
Figure 10. Variability assessment of residents’ perceptions regarding CES.
Sustainability 18 02578 g010
Figure 11. Driving pathways of factors influencing residents’ CES perception differences.
Sustainability 18 02578 g011
Figure 12. Moderating effects of residents’ socioeconomic background on the driving pathways: (a) Moderating Effect of Age; (b) Moderating Effect of Income.
Sustainability 18 02578 g012
Table 1. Profile of Sample Parks.
No.ParksYearArea (Hectares)LocationTypeApplication
(1)Jiefang Park195246Jiang’an DistrictComprehensive ParksSurvey/Online
(2)Zhongshan Park191032.80Jianghan DistrictComprehensive ParksSurvey/Online
(3)Jiangxia Central Park201795.60Jiangxia DistrictComprehensive ParksSurvey
(4)Caidian Riverside Park200426.17Caidian DistrictEcological ParksSurvey
(5)Houguanhu Park201128.55Hannan DistrictEcological ParksSurvey/Online
(6)Qianchuan Park201921.07Huangpi DistrictEcological ParksSurvey
(7)Qiaokou Park19573.27Qiaokou DistrictNeighborhood ParksSurvey
(8)Guanshan Park20088.23Hongshan DistrictNeighborhood ParksSurvey
(9)Chaibohu Leisure Square20106.95Xinzhou DistrictEcological ParksSurvey
(10)Wuhuan Square20083.70Dongxihu DistrictNeighborhood ParksSurvey
(11)Wuhan Zoo198564.66Hanyang DistrictThematic ParksSurvey
(12)Chuwangtai Historical Park20083.10Wuchang DistrictThematic ParksSurvey
(13)Botanical Science Park200711.2Qingshan DistrictThematic ParksSurvey
(14)Hankou Riverside Park2002153.71Jiang’an DistrictComprehensive ParksOnline
(15)Baodao Park198513.46Jiang’an DistrictComprehensive ParksOnline
(16)Dijiao Park200419.89Jiang’an DistrictComprehensive ParksOnline
(17)Xibeihu Green Square199924.15Jianghan DistrictEcological ParksOnline
(18)Lingjiaohu Park200814.12Jianghan DistrictComprehensive ParksOnline
(19)Wangjiadun Park201712.03Jianghan DistrictComprehensive ParksOnline
(20)Moshuihu Park201678.22Hanyang DistrictEcological ParksOnline
(21)Yuehu Park2006106Hanyang DistrictComprehensive ParksOnline
(22)Guishan Park198335.33Hanyang DistrictComprehensive ParksOnline
(23)Shahu Park1917377Wuchang DistrictComprehensive ParksOnline
(24)Shouyi Park192316.6Wuchang DistrictComprehensive ParksOnline
(25)Ziyang Park195129.61Wuchang DistrictComprehensive ParksOnline
(26)Heping Park199849.4Qingshan DistrictComprehensive ParksOnline
(27)Qingshan Park196235.43Qingshan DistrictComprehensive ParksOnline
(28)Daijiahu Park201570.28Qingshan DistrictEcological ParksOnline
(29)Tanghu Park200435.44Hannan DistrictComprehensive ParksOnline
(30)Jinyinhu Park200177Dongxihu DistrictEcological ParksOnline
Table 2. Data sources.
Data ClassificationData NameData Source
Social media dataWeibo textual commentsWeb crawler collection
Residents’ socioeconomic backgroundsDemographic characteristicsQuestionnaire survey
Residents’ perceptions of CESPerceived satisfaction with CESQuestionnaire survey
External built environmentSurrounding building density2024 Open Street Map Data
https://www.openstreetmap.org/
Transportation accessibility
Population densityNational Earth System Science Data Center
http://www.geodata.cn
Internal landscape compositionFacility richnessPeking University Open Research Data Platform
Park area2024 Open Street Map Data
https://www.openstreetmap.org/
Water feature
Quality of service managementIntra-park environment managementQuestionnaire survey
Visitor experience management
Cultural promotion management
Table 3. PLS-SEM evaluation criteria.
Evaluation MetricInterpretationThreshold Description
Standardized factor loadingsStrength of association between an indicator and its corresponding latent variable.>0.7Good
Cronbach’s alphaInternal consistency reliability within a latent variable.>0.7Good
CRInternal consistency reliability indicator.>0.7Good
AVEAn indicator of convergent validity for a latent variable.>0.5Good
HTMTIndicator for discriminant validity.<0.85Good
VIFIndicator for multicollinearity among latent variables.<3Good
R2Proportion of variance explained in a latent variable.0.20–0.33Weak model
0.34–0.67Moderate model
>0.67Strong model
Q2Predictive ability of the model.>0Having predictive relevance
0.02–0.15Weak predictive
0.15–0.35Moderate predictive
>0.35Strong predictive
GoFOverall model fit quality.0.1–0.25Poor
0.25–0.36Moderate
>0.36Good
ƒ2Assess the magnitude of the effect.0.02–0.15Small effect
0.15–0.35Moderate effect
>0.35Large effect
Table 4. Summary of Residents’ Perception Dimensions of CES in UPGS.
CESTopicsKeywordsClassification Basis
RSTopic 0Delicious, evening, weekend, Yue Lake, Sha LakeReflects comprehensive recreational behaviors, representing fundamental leisure services.
Topic 6Tomorrow, weather, autumn, winter, weekendDescribes conditional and seasonal leisure planning, such as sunbathing based on weather or time of year.
AETopic 3Cherry, tulip, romantic, bloom, Dong LakeCenters on spring flower appreciation, evoking a romantic emotional response and exemplifying natural aesthetic engagement.
Topic 4Sha Lake, wetlands, Yue Lake, park area, lotusInvolves appreciation of wetland ecosystems, floral diversity, and curated exhibitions, highlighting horticultural and ecological aesthetics.
Topic 5Sha Lake, Tang Lake, park area, riverbank, chrysanthemumFocuses on viewing thematic horticultural displays like chrysanthemum exhibitions, often accompanied by social media documentation.
HATopic 7Yue Lake, dormitory, sports, group photo, peopleDominated by the term “sports”, which directly indicates health-promoting physical activity; other terms provide contextual support.
SITopic 2Pigeon, notes, Hanfu (traditional Chinese Han clothing), RED (a social media platform in China), field notesActivities such as community-organized Hanfu gatherings reflect offline social engagement, while terms like “RED” and “Notes” indicate online social interaction through content sharing.
Topic 9Image, share, timeCombines “share” and “image” to illustrate online social behavior centered on content dissemination via digital media.
ESTopic 1Riverbank, Dong Lake, avenue, punch In, HuanghelouKeywords refer to well-known landmarks, natural landscapes, and flora, reflecting visitation, learning, and documentation of local cultural and natural heritage.
Topic 8Sixteen, technologyThe term “technology” explicitly points to activities involving scientific knowledge and technological exhibitions, aligning with science education and technological culture promotion.
Table 5. Driving factors of residents’ CES perception heterogeneity in UPGS and their corresponding high-frequency keywords.
FactorsIndicatorsHigh-Frequency Words
Residents’ socioeconomic backgroundsGenderAuntie, uncle, young lady, handsome guy
AgeChildren, teenagers, university students, middle-aged, elderly, retired
IncomeHigh-end restaurant, buffet, convenience store, food stall, free
Educational attainmentUniversity student, postgraduate
OccupationPhotographer, security guard, barista, tour guide, cleaner, retired
External built environmentSurrounding building density Pedestrian street, business district, high-rise building, residential compound, shop, residence, storefront, office building
Transportation accessibilityParking lot, main road, subway station, geographical location, parking space, bus, ferry, shared bicycle
Population densityTourists, crowd, residents, crowded, pedestrian flow, gathering, high pedestrian flow, peak hours
Internal landscape compositionFacility richnessStreet light, fitness equipment, coffee shop, public toilet, children’s playground, vending machine, bench, trash bin
Park areaSite area, garden path, trail, lawn, square, park area, expansive green space, open, view
Water featureLake, river beach, lotus, boating, water cypress, lotus pond, reed, fountain, small bridge over flowing water
Quality of services managementIntra-park environment managementSecurity, cleaning, greening maintenance, repair, inspection, upkeep, weeding, waste sorting
Visitor experience managementPhotography, check-in, guided tour, volunteer, selfie, wedding photography, explanation, visitor center, interactive experience
Cultural promotion managementIntangible cultural heritage, exhibition, poetry, Hanfu, lantern, folk custom, historical stone inscription, pagoda forest, information board
Table 6. Socioeconomic Backgrounds of Respondents.
VariablesCategorySample
N%
GenderFemale15348.9
Male16051.1
Age<1831
18–309129.1
31–457323.3
46–607223
>607423.6
Income<CNY20008928.4
CNY2000–CNY500015649.8
CNY5000–CNY90005517.5
>CNY9000134.1
Educational attainmentHigh school or below9028.8
College8025.6
Bachelor’s degree10433.2
Master’s degree or above3912.4
OccupationStudents4012.7
Corporate employees4715
Public sector employees4213.4
Freelancers5818.5
Retirees10533.5
Others216.7
Table 7. Respondents’ comments on the services management quality of sampled parks.
VariablesCategorySample
N%
Intra-park environment managementVery bad (1)165.1
Bad (2)9329.7
Neutral (3)5617.8
Good (4)8527.1
Very good (5)6320.1
Visitor experience managementVery bad (1)165.1
Bad (2)8226.1
Neutral (3)7724.6
Good (4)8627.4
Very good (5)5216.6
Cultural promotion managementVery bad (1)123.8
Bad (2)8627.4
Neutral (3)7323.3
Good (4)7925.2
Very good (5)6320.1
Table 8. Classification of environment levels for sampled parks.
ParksSBDTAPDFRPAWF
Jiefang Park555542
Zhongshan Park555532
Jiangxia Central Park343453
Caidian Riverside Park242235
Houguanhu Park141335
Qianchuan Park132131
Qiaokou Park555313
Guanshan Park454421
Chaibohu Leisure Square133125
Wuhuan Square255311
Wuhan Zoo351554
Chuwangtai Historical Park555413
Botanical Science Park455423
Table 9. Reliability and validity indicators.
ConstructVariableFactor LoadingCronbach’s AlphaCRAVE
EBESBD0.8520.8260.8280.742
TA0.880
PD0.851
ILCFR0.8730.8200.8200.735
PA0.851
WF0.848
QSMIEM0.8530.8180.8190.733
VEM0.851
CPM0.864
CESES0.7940.9050.9070.725
SI0.857
AE0.852
HA0.874
RS0.879
Table 10. Discriminant validity.
ConstructsCESQSMILCEBE
CES0.8520.6210.6060.608
QSM0.7190.8560.5780.579
ILC0.7010.7040.8570.655
EBE0.7020.7010.7950.861
Note: Diagonal values (in bold) represent AVE , values above the diagonal represent inter-structural correlations, and values below the diagonal represent the HTMT statistics.
Table 11. Standardized path coefficients of the hypothesized model.
Path EffectsRelationshipβStandard Deviation95% Bootstrap CIT Statisticsp ValuesVIFƒ2HConclusion
Direct effectsEBE → QSM0.3520.061[0.226, 0.466]5.7400.0001.7520.119H3Support hypothesis
EBE → ILC0.6550.040[0.573, 0.730]16.3190.0001.0000.752H2Support hypothesis
EBE → CES0.2540.065[0.126, 0.380]3.9160.0001.9600.067H1Support hypothesis
ILC → QSM0.3470.060[0.233, 0.466]5.8280.0001.7520.115H5Support hypothesis
ILC → CES0.2480.066[0.118, 0.374]3.7610.0001.9540.065H4Support hypothesis
QSM → CES0.3310.066[0.204, 0.464]4.9800.0001.6790.133H6Support hypothesis
Indirect effectsEBE → ILC → CES0.1630.045[0.075, 0.251]3.6010.000
EBE → ILC → QSM0.2270.043[0.149, 0.317]5.2750.000
EBE → ILC → QSM → CES0.0750.022[0.039, 0.124]3.4360.001
EBE → QSM → CES0.1160.032[0.061, 0.186]3.6720.000
ILC → QSM → CES0.1150.032[0.062, 0.184]3.5880.000
Total effectsEBE → CES0.6080.042[0.523, 0.685]14.5870.000
ILC → CES0.3630.060[0.248, 0.481]6.080.000
QSM → CES0.3310.066[0.204, 0.464]4.9800.000
Disclaimer/Publisher’s Note: The statements, opinions and data contained in all publications are solely those of the individual author(s) and contributor(s) and not of MDPI and/or the editor(s). MDPI and/or the editor(s) disclaim responsibility for any injury to people or property resulting from any ideas, methods, instructions or products referred to in the content.