1. Introduction
The United States has long been recognized as a global leader in advancing clean energy technologies (CET), particularly in areas such as wind power, solar energy, and smart grid systems. Federal initiatives, including the Inflation Reduction Act of 2022, together with state-level renewable portfolio standards, have accelerated investment in renewable energy, while innovation hubs in California, Texas, and the Midwest have positioned the United States as a key actor in global sustainability transitions [
1]. However, despite substantial financial investment and technological advancement, persistent challenges remain in ensuring equitable access, scaling infrastructure, and addressing institutional and societal barriers that shape the diffusion of clean energy technologies. Consistent with the Agenda 2030 framework, these challenges highlight that clean energy transitions are not driven by technology alone, but are deeply conditioned by social and institutional structures. This underscores the need to reposition SDG 5 (Gender Equality) as a conceptual and interpretative core for understanding how innovation systems evolve and how sustainability transitions unfold in practice.
Within this context, women’s education and skills development (WE) emerges as a foundational mechanism through which SDG 5 influences clean energy innovation systems. Education enhances women’s capacity to participate in energy-related economic activity, household, and community-level decision-making and the clean energy workforce, while skills development expands access to technical and professional roles within CET sectors [
2,
3]. These pathways directly align with SDG 5 targets 5.1–5.5, which emphasize the elimination of structural discrimination, women’s full participation in economic life, and empowerment through enabling skills and capabilities. Existing evidence shows that higher female educational attainment is associated with increased adoption of clean energy solutions at the household level, while macro-level analyses link women’s empowerment to stronger renewable electricity capacity and innovation outcomes [
4]. Accordingly, investments in women’s education and skills should be understood not as peripheral social policies, but as core drivers of women-driven transformation dynamics within clean energy innovation systems.
Democratic governance (DEM) and financial development (FD) further shape the effectiveness of these SDG 5 mechanisms by providing the institutional conditions under which women’s capabilities translate into innovation and diffusion outcomes. Democratic institutions foster transparency, accountability, and inclusive participation, thereby strengthening policy stability and institutional frameworks that support sustainability transitions [
5,
6]. In line with SDG 5.c, such governance structures are essential for embedding gender equality principles within energy and innovation policy design. Similarly, financial development expands access to capital, lowers financing constraints, and mobilizes public and private resources required for capital-intensive clean energy technologies [
7,
8]. In the U.S. context, democratic institutions create channels through which women’s voices can influence clean energy policy, while advanced financial systems enable investment instruments that support innovation-led CET expansion. Together, women’s education, democratic governance, and financial development form a multidimensional framework that complements technological progress and economic growth, reinforcing an inclusive, stable, and sustainable clean energy transition consistent with SDG 5 and its interlinkages with SDGs 7, 9, 12, and 13.
Building on this SDG 5-centered conceptual framing, this study formulates research questions that explicitly link clean energy outcomes to gender equality and institutional mechanisms:
- (1)
How does economic growth shape clean energy innovation and diffusion across different time horizons in the United States?
- (2)
To what extent do investments in women’s education and skills development function as SDG 5-driven mechanisms for advancing clean energy technologies?
- (3)
How does democratic governance influence institutional frameworks that support gender-inclusive sustainability transitions?
- (4)
In what ways does financial development enable or constrain clean energy innovation through its interaction with gender equality objectives?
- (5)
How does social globalization interact with SDG 5 mechanisms to shape clean energy diffusion?
This study contributes to the existing literature by explicitly centering SDG 5 within the analysis of clean energy innovation systems and sustainability transitions. By integrating gendered human capital perspectives with institutional quality frameworks, the study moves beyond energy-driven explanations and demonstrates how clean energy outcomes are shaped by women’s empowerment, participation, and institutional inclusion [
2,
3,
4,
5,
6]. In doing so, the analysis directly engages with SDG 5 targets (5.1–5.5) and uses Agenda 2030 as an interpretative lens to explain observed patterns in clean energy technologies. Importantly, the findings emphasize that CET advancement is not gender-neutral, but instead reflects the extent to which innovation systems incorporate inclusive education systems and participatory democratic structures. While empirically focused on the United States, the policy implications extend beyond this context, offering transferable insights for both developing and advanced economies seeking to integrate gender equality objectives into clean energy strategies.
From a methodological perspective, the wavelet-based approach strengthens the SDG 5-centered interpretation by capturing how empowerment and institutional mechanisms operate across short-, medium-, and long-term horizons. The influence of women’s education and skills development is expected to materialize gradually through cumulative empowerment and labor market integration, while shifts in democratic governance may generate more immediate effects through policy reform and institutional change. By uncovering these time–frequency dynamics, the methodology supports a more precise interpretation of how SDG 5 mechanisms shape innovation systems and sustainability transitions over time. This approach not only enhances the robustness of the U.S. findings but also provides a transferable analytical framework for countries seeking to align clean energy innovation with the gender equality commitments embedded in Agenda 2030.
The subsequent sections are organized as follows:
Section 2 and
Section 3 present the theoretical framework and literature review;
Section 4 presents the data and methodology;
Section 5 reports the results; and
Section 6 concludes the study with policy suggestions.
2. Theoretical Framework
Women’s education and skills development (WE) represents a core socio-human capital channel through which progress toward the clean energy transition is mediated, with direct relevance to SDG 5 (Gender Equality) and its targets on empowerment and participation. From a human capital perspective, women’s education enhances decision-making capacity at the household level, strengthens labor market participation, and increases the ability to adopt and manage innovative energy solutions. Empirical evidence consistently shows that improvements in female education and empowerment significantly raise the likelihood of household adoption of cleaner fuels and renewable technologies [
2,
9], supporting the interlinkage between SDG 5 and SDG 7 (Affordable and Clean Energy). At the macro level, women’s skills development and participation in technical, managerial, and political spheres contribute to higher renewable energy capacity and innovation outcomes [
4], reinforcing SDG 9 (Industry, Innovation, and Infrastructure). However, persistent structural barriers, including gender gaps in STEM education and unequal access to financial and technical resources, continue to constrain the transformative potential of WE for CET diffusion, underscoring the need for targeted SDG-5-oriented policy interventions [
2].
The role of democracy (DEM) in promoting CET is grounded in institutional and political economy theories and aligns closely with SDG 16 (Peace, Justice, and Strong Institutions). Democratic institutions enhance accountability, transparency, and citizen participation, which increase societal demand for clean energy and facilitate the formulation and implementation of renewable energy policies. Empirical studies show that democracy amplifies the positive effect of economic growth on renewable energy use [
10], while cross-country and hierarchical analyses highlight heterogeneous impacts across income levels and energy types [
9]. In emerging economies, democratic deepening often creates more favorable conditions for renewable investment by strengthening environmental regulation and public participation [
11]. Nevertheless, where democratic institutions are weak or unstable, citizen preferences may not translate into effective CET outcomes, indicating that institutional quality is a necessary condition for sustainable energy transitions [
12].
Financial development (FD) constitutes a critical enabling mechanism for CET adoption, consistent with theories of financial intermediation and long-run growth [
13], and is closely linked to SDGs 7 and 9. By expanding access to credit, mobilizing capital, and reducing financing costs, FD supports investment in capital-intensive renewable energy projects that require long planning horizons. Evidence from global samples shows that financial development significantly increases renewable energy consumption and capacity, with stronger effects in advanced economies [
14]. Country-level evidence, including studies on emerging economies such as Ghana, further indicates that FD facilitates long-run clean energy investment despite short-run volatility [
7]. Through deeper capital markets, green bond issuance, and private-sector participation, financial development acts as a key structural driver of CET diffusion worldwide [
15], while also supporting climate mitigation objectives under SDG 13.
Finally, social globalization (SOG) provides the cultural, informational, and network-based linkages that accelerate CET diffusion, consistent with diffusion-of-innovations theory [
16] and aligned with SDGs 12 and 17. Social globalization enhances knowledge transfer, disseminates best practices, and shapes social norms favorable to renewable energy adoption. Empirical studies using the KOF Globalization Index show that information flows, cultural exchange, and international networks associated with SOG positively influence renewable energy consumption, often generating cross-border spillovers [
17]. In regions such as the Belt and Road economies, social globalization strengthens international collaboration in renewable deployment [
18]. Thus, SOG functions not only as a direct driver of CET but also as a reinforcing mechanism that complements WE, DEM, and FD by fostering social acceptance, awareness, and collective action in support of inclusive and sustainable clean energy transitions.
3. Literature Review
This section of the study presents a discussion regarding the factors driving clean energy techniques. Regarding the nexus between WE and CET, significant studies have been documented. For instance, Ref. [
3] demonstrates that expanding female education in Bangladesh through a quasi-experimental program directly reduced energy poverty and shifted households toward cleaner energy use, showing education’s practical effect on household energy transitions. Complementing this, Ref. [
19] employs extended probit regression and finds that higher educational attainment of household heads significantly increases the likelihood of adopting clean cooking fuels, further confirming the education–energy link in the Bangladeshi context. Moving beyond a single-country focus, Ref. [
9] uses multi-country household data and establishes that women’s bargaining power, often rooted in education and skills, strongly correlates with household adoption of cleaner energy sources, underscoring the global relevance of WE in CET diffusion. Similarly, Ref. [
20], using a dynamic panel model across both developed and developing economies, finds that women’s political and social empowerment—closely tied to education and skill-building—enhances renewable electricity capacity, though outcomes vary with levels of human development. Finally, Ref. [
2] provides a global literature review that complicates the narrative by showing both enabling and constraining factors: while women’s education and training improve inclusivity and technical capacity in the renewable sector, structural barriers such as limited access to STEM training, workplace discrimination, and institutional gaps may dampen the full realization of CET benefits.
Table 1 presents a summary of studies.
Likewise, conflicting reports have been highlighted on how democracy impacts CET. For instance, Ref. [
5] highlights the importance of institutional thresholds, finding that economic growth supports renewable energy use only when democracy exceeds a certain level, whereas in less democratic regimes, growth can actually hinder CET development. Similarly, Ref. [
21] shows that democracy’s influence on clean energy varies across income levels: in developing countries, democratic institutions foster greater deployment of solar, wind, and hydro energy, while in advanced economies, democracy tends to promote nuclear energy but can slow the growth of other renewables. By contrast, Refs. [
11,
22] provide stronger evidence of a positive association, showing that democracy directly enhances renewable energy consumption and accelerates the energy transition in broader samples and emerging nations, respectively. The heterogeneity of outcomes is further illustrated by [
12], whose panel quantile analysis in Sub-Saharan Africa demonstrates that democracy can both enable and constrain CET adoption depending on the quantile and country-specific context, reflecting institutional and infrastructural disparities. On the other hand, Ref. [
23] shows that in the BRICS countries, democracy, alongside renewable energy use, improves environmental quality, reinforcing the positive role of democratic governance. Likewise, Ref. [
10] finds that in the Next Eleven (N-11) economies, stronger democratic institutions complement renewable energy development and reduce ecological pressure.
Table 2 presents a summary of the studies.
Also, the financial role in increasing or decreasing CET has been documented in the literature. Ref. [
13] shows that in ASEAN+3 economies, deeper financial systems significantly enhance renewable energy uptake, highlighting the importance of regional capital markets for financing green infrastructure. In the U.S. case, Ref. [
15] uses a nonlinear ARDL approach and uncovers asymmetric effects, where positive shocks in FD boost renewable energy consumption more strongly than negative shocks reduce it, suggesting that CET is particularly responsive to expansions in credit and financial depth. Extending this analysis globally, Ref. [
8] employs a multidimensional GMM framework across 103 countries and finds that FD positively influences renewable energy adoption, with the effect being stronger in developed economies due to mature financial institutions. At the national level, Ref. [
7] illustrates that in Ghana, FD facilitates long-run investment in clean energy despite short-run challenges from price volatility and growth pressures. Similarly, Ref. [
24] confirms through CS-ARDL analysis that financial sector expansion is a key driver of renewable consumption across diverse economies, while Ref. [
14] emphasizes that in BRICS countries, FD consistently supports clean energy use, though with heterogeneity across nations.
Table 3 presents a summary of the studies.
Lastly studies on social globalization and CET have become an important area of discussion, with mixed results emerging. For instance, Ref. [
17] demonstrates for the G7 that social globalization significantly boosts renewable energy adoption, showing that cultural exchange, information flows, and people-to-people linkages help accelerate clean energy transitions. Similarly, Ref. [
25], using spatial panel econometrics for 60 countries, reveals that social globalization not only promotes CET domestically but also has spatial spillover effects, where socially interconnected countries influence one another’s renewable adoption. At the global level, Ref. [
26] applies non-parametric and panel methods to confirm that social and cultural globalization positively drive renewable energy consumption, suggesting that openness to global norms and practices fosters sustainable energy policies. A country-level analysis by [
27] shows that, in fragile contexts like Somalia, globalization—including its social dimension—supports renewable energy development in the long run, emphasizing its role even in least developed countries. Ref. [
28] further strengthens this evidence by showing that, for Belt and Road economies, social globalization enhances CET through knowledge diffusion and cultural collaboration across partner states. Finally, Ref. [
29] demonstrates through dynamic ARDL analysis that in developing countries, social globalization strongly complements CET, reducing environmental pressures while advancing sustainable energy adoption.
Table 4 presents a summary of the studies.
5. Results
5.1. Preliminary Test Results
Table 6 presents the summary of descriptive statistics and correlation results for the six variables under study: CET, DEM, EG, FD, SOG, and WE. Part A highlights the distributional properties of the series. The variables exhibit a wide range of values, with CET fluctuating between 6.30 and 10.50, DEM ranging from −0.216 to −0.102, and EG spanning 10.80 to 11.10. The measures of central tendency (mean and median) are generally close, suggesting that most variables are symmetrically distributed around their average, except CET and SOG, which show negative skewness, while EG and FD are positively skewed. The kurtosis results indicate that CET is leptokurtic (kurtosis = 7.0), suggesting heavy tails, while most other variables are moderately mesokurtic or platykurtic. Normality diagnostics via the Jarque–Bera test reveal that CET, DEM, EG, FD, and SOG significantly deviate from normality at the 1% or 5% levels, while WE appear approximately normally distributed. Part B reports the correlation matrix, which captures the linear associations among variables. The results indicate strong positive correlations between EG and SOG (0.843) and between EG and WE (0.897), suggesting that economic growth is closely aligned with sustainable outcomes and welfare. Likewise, SOG and WE are highly correlated (0.858), underscoring their complementarity. CET shows moderate positive correlations with SOG (0.591) and weaker positive associations with DEM, EG, FD, and WE. DEM, however, is negatively correlated with EG and WE, pointing to potential trade-offs between demographic dynamics and these measures.
5.2. Diagnostic Tests Result
Table 7 reports a comprehensive set of diagnostic tests used to evaluate the statistical properties of the six variables CET, DEM, EG, FD, SOG, and WE. Part A focuses on nonlinearity, employing several complementary tests that capture different aspects of nonlinear behavior. The Terasvirta test assesses whether relationships evolve smoothly across regimes rather than remaining linear, while the White test detects neglected nonlinear functional forms. The BDS test examines departures from independent and identically distributed dynamics, and the Mann–Kendall and Runs tests capture nonlinear dependence and structural shifts in trends. With the exception of a few cases under the Keenan test, which is known to be less powerful in some settings, most variables strongly reject the null of linearity at the 1% level, indicating pervasive nonlinear dynamics and the likelihood of regime-dependent behavior.
Part B presents normality tests, showing that most series deviate substantially from Gaussian distributions, reflecting skewness and excess kurtosis, particularly for CET, FD, and SOG, while EG and WE are relatively closer to normality but still fail at least one formal test. Part C reports heteroskedasticity diagnostics, where the White and ARCH–LM tests provide strong evidence of time-varying volatility for almost all variables, suggesting the presence of conditional heteroskedasticity. Taken together, these results indicate that the data are characterized by nonlinearity, non-normality, and heteroskedasticity, which supports the use of flexible and variance-sensitive econometric frameworks, such as wavelet-based methods, that are well-suited to capturing complex dynamics across time and frequency.
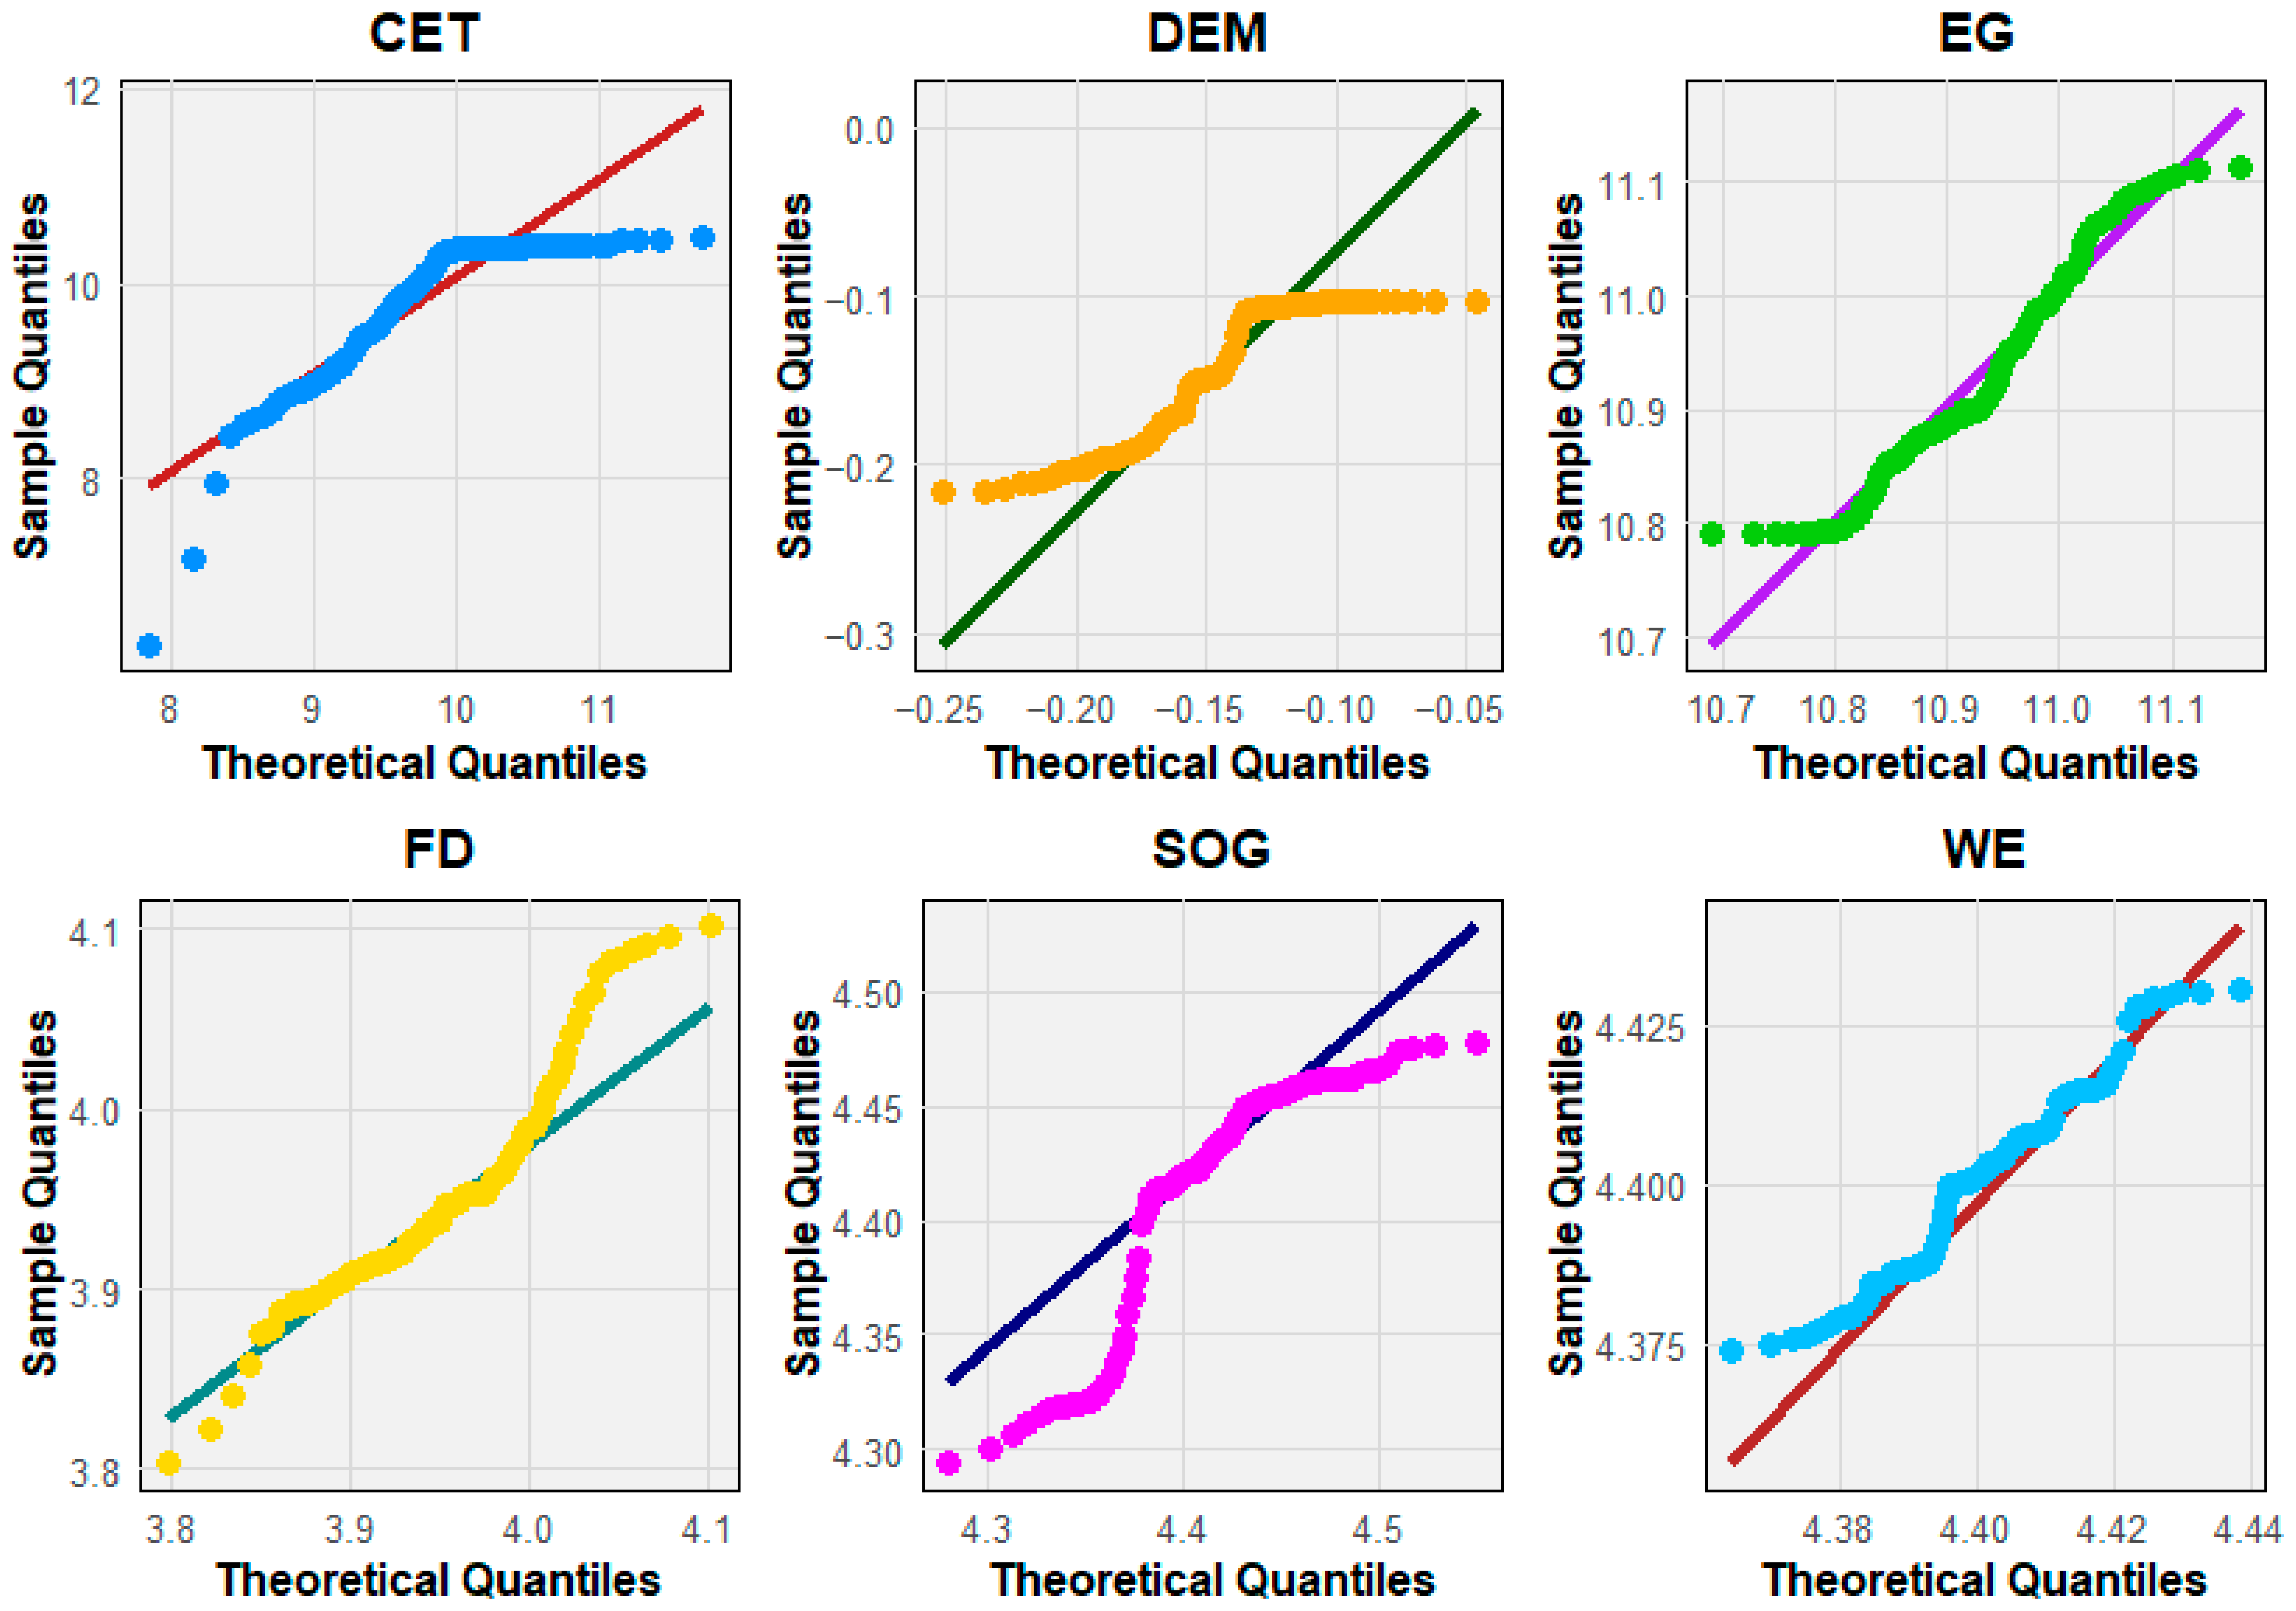
The Q–Q plots in
Figure 1 test the null hypothesis that each variable (CET, DEM, EG, FD, SOG, and WE) follows a normal distribution. If the null were true, the sample quantiles would align closely with the 45-degree theoretical quantile line. However, the plots reveal visible deviations: CET and SOG show heavy tails and curvature, FD and DEM exhibit systematic departures from the line, and even EG and WE display modest but clear distortions. These patterns indicate rejection of the null hypothesis of normality for most variables, consistent with earlier Jarque–Bera and Shapiro–Wilk test results. Thus, the evidence suggests that the majority of the series are non-normally distributed, implying that econometric analyses should rely on robust or nonparametric methods rather than standard parametric models that assume Gaussian errors.
5.3. Stationarity Test Result
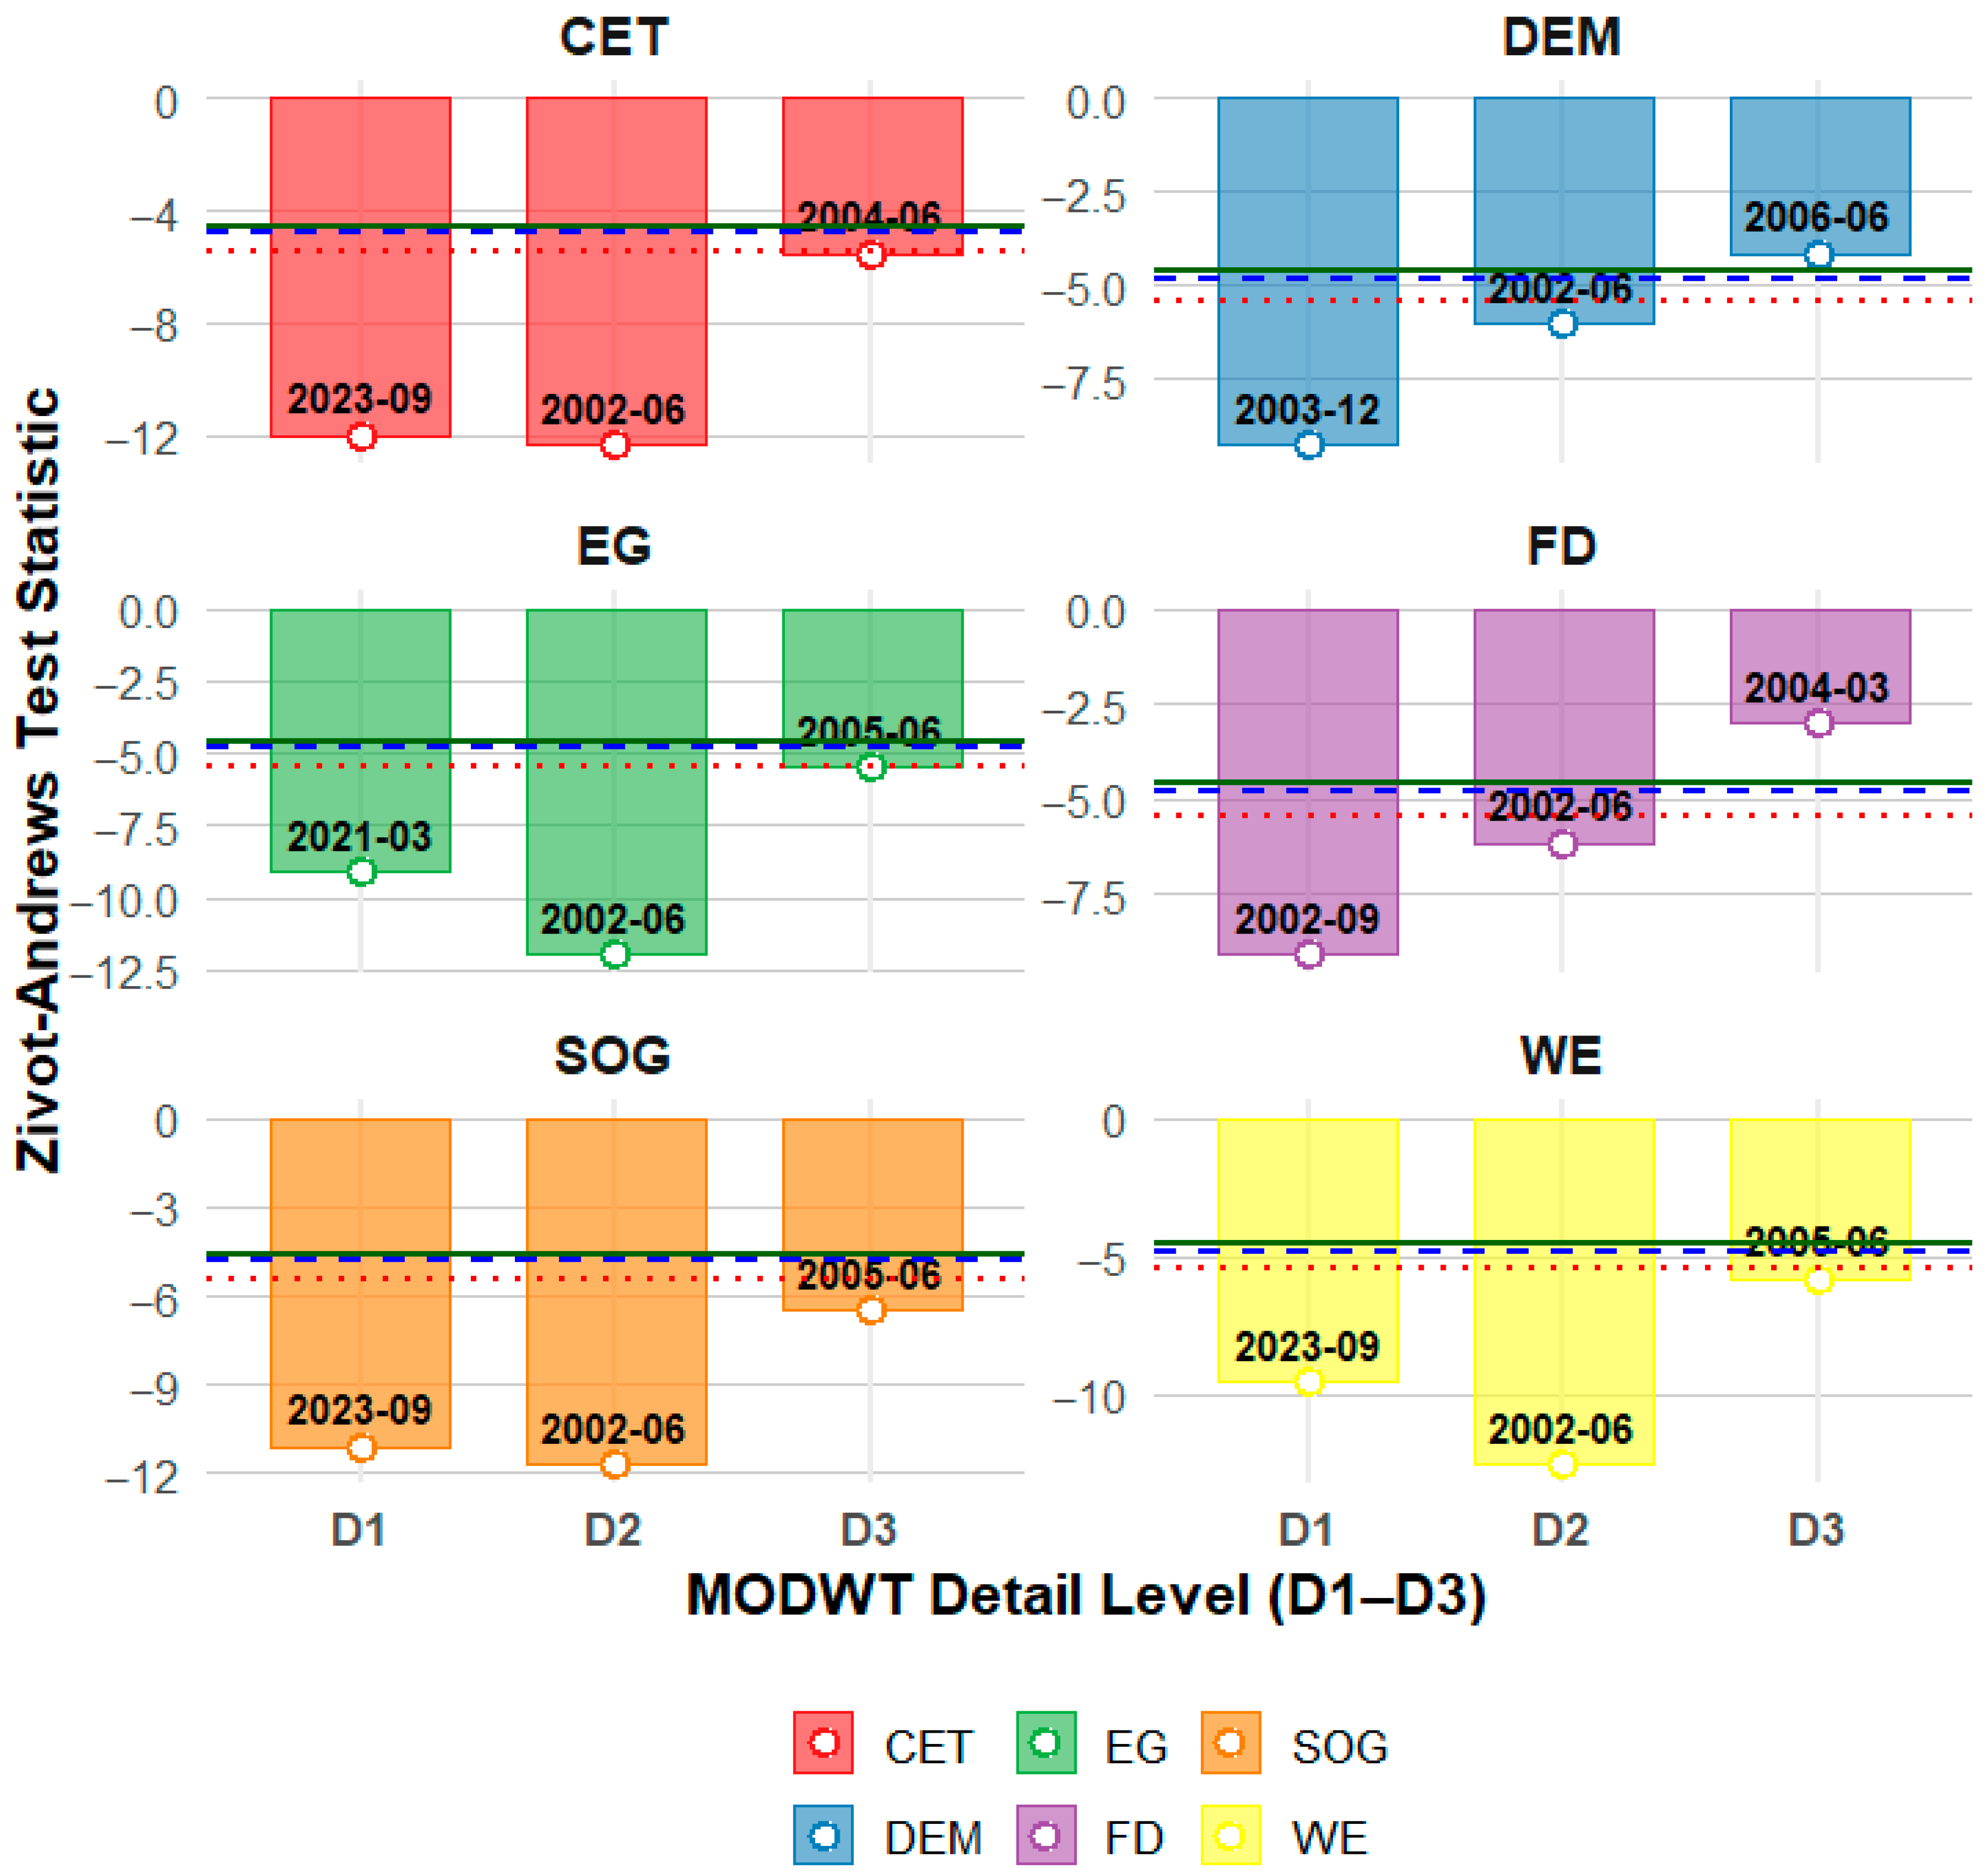
Figure 2 shows the wavelet-based Zivot–Andrews (ZA) unit root test suggested by [
35] across MODWT detail levels (D1–D3) for CET, DEM, EG, FD, SOG, and WE. The null hypothesis of the ZA test is that each series contains a unit root (non-stationary), against the alternative of stationarity, with a single structural break. In the plots, rejection of the null occurs when the test statistic falls below the critical values (dotted lines at 1%, 5%, and 10%). The results indicate that for most variables (e.g., CET, EG, FD, SOG, and WE), the test statistics consistently cross below the critical thresholds at different decomposition levels, meaning the null of the unit root is rejected, and the series is stationary with breakpoints such as 2002–2006 and 2021–2023. DEM also shows similar rejection around 2002 and 2006. Overall, the ZA results confirm that all series become stationary once structural breaks are accounted for, implying that ignoring breakpoints could falsely suggest persistence of non-stationarity.
5.4. Wavelet Power Spectrum Result
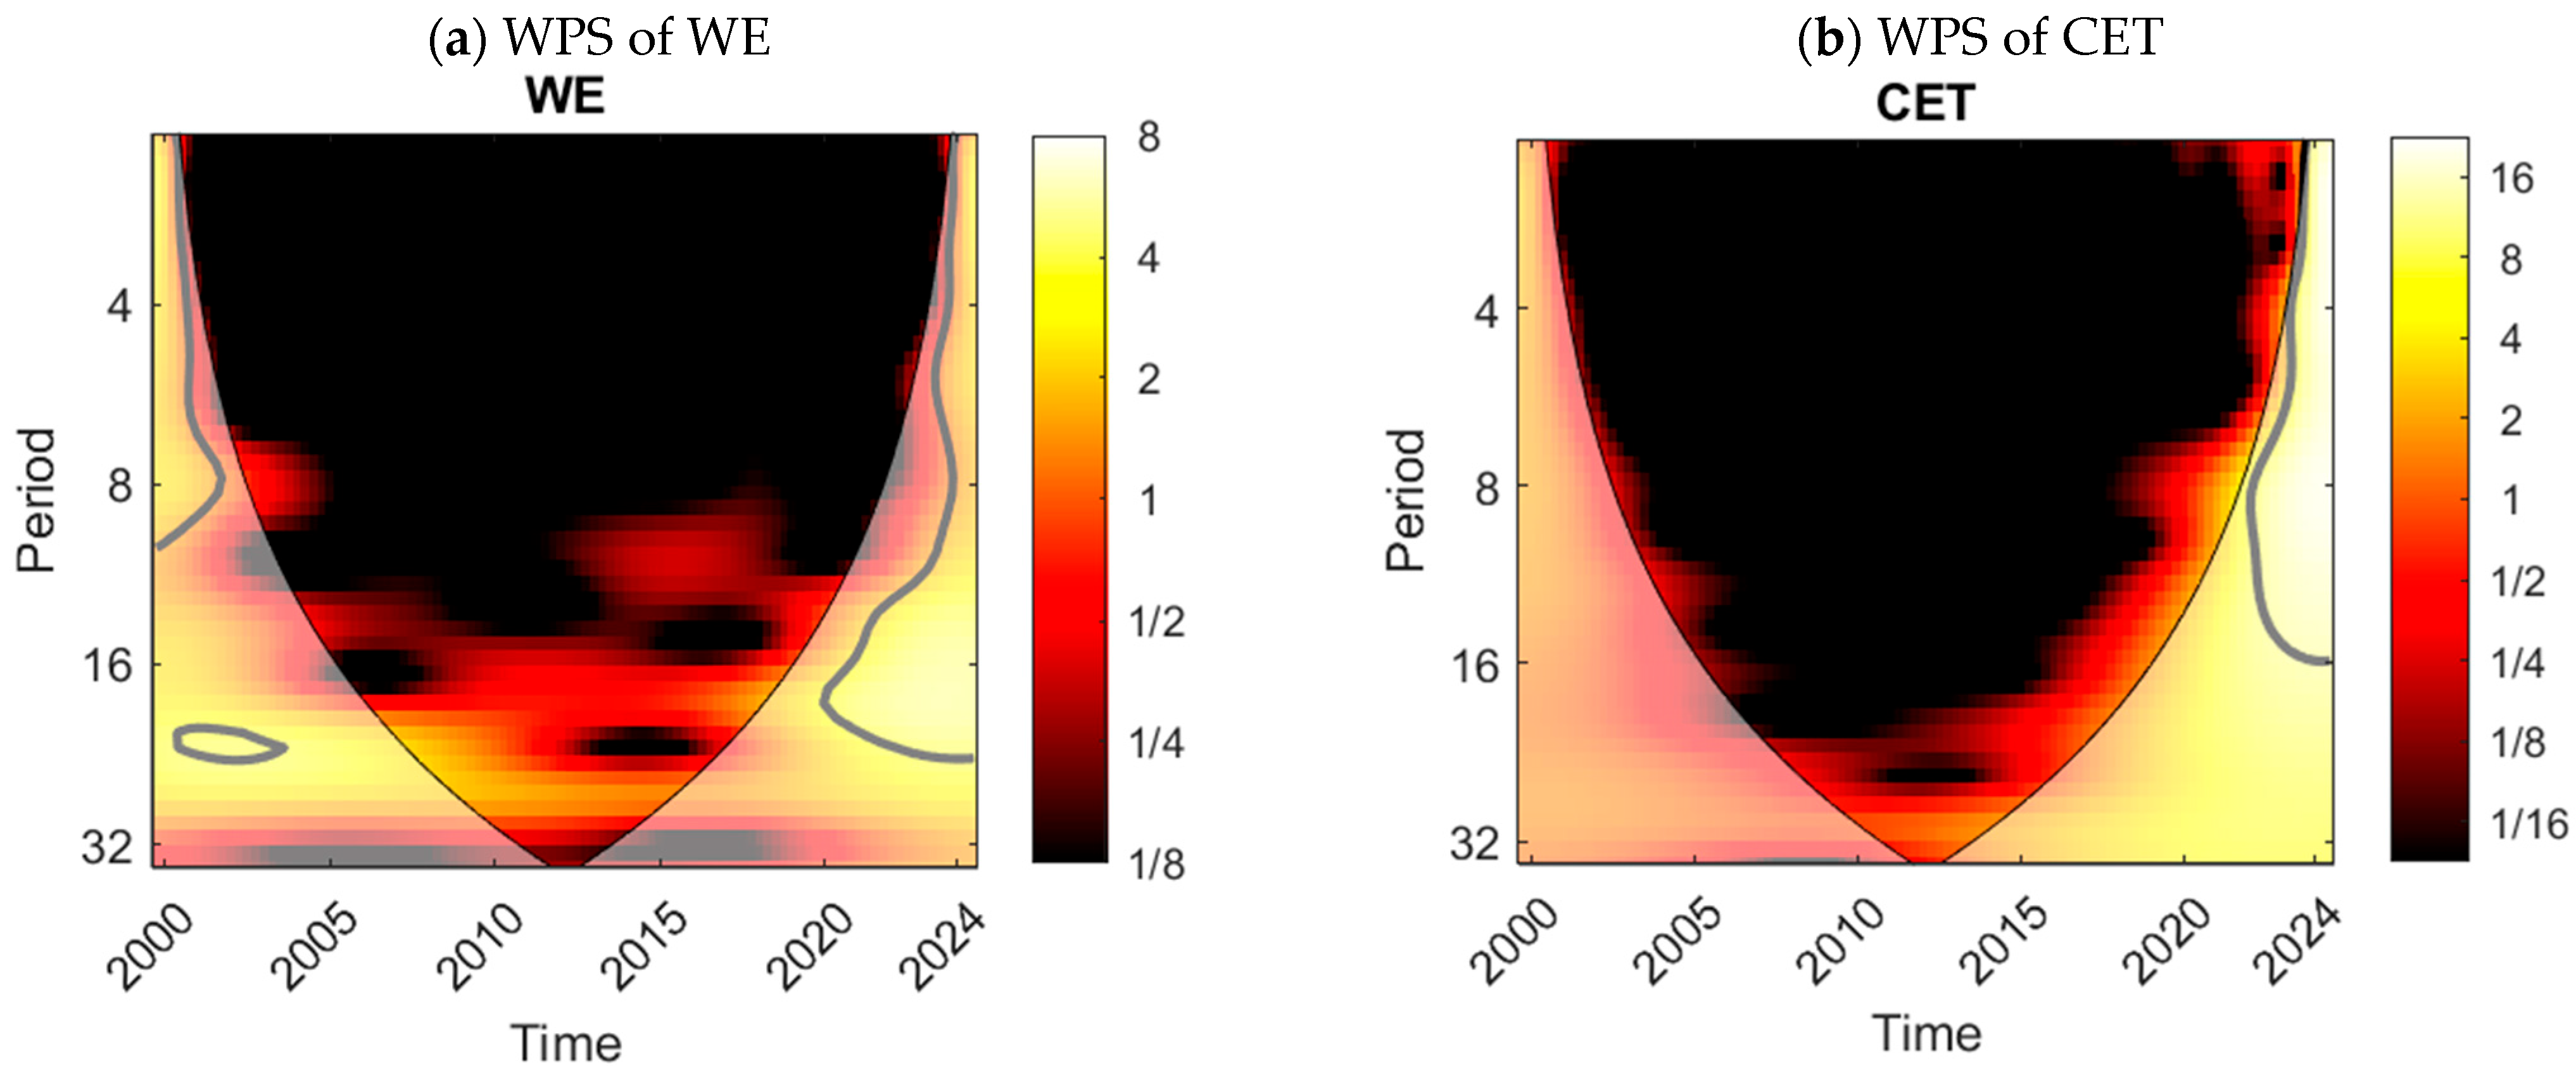
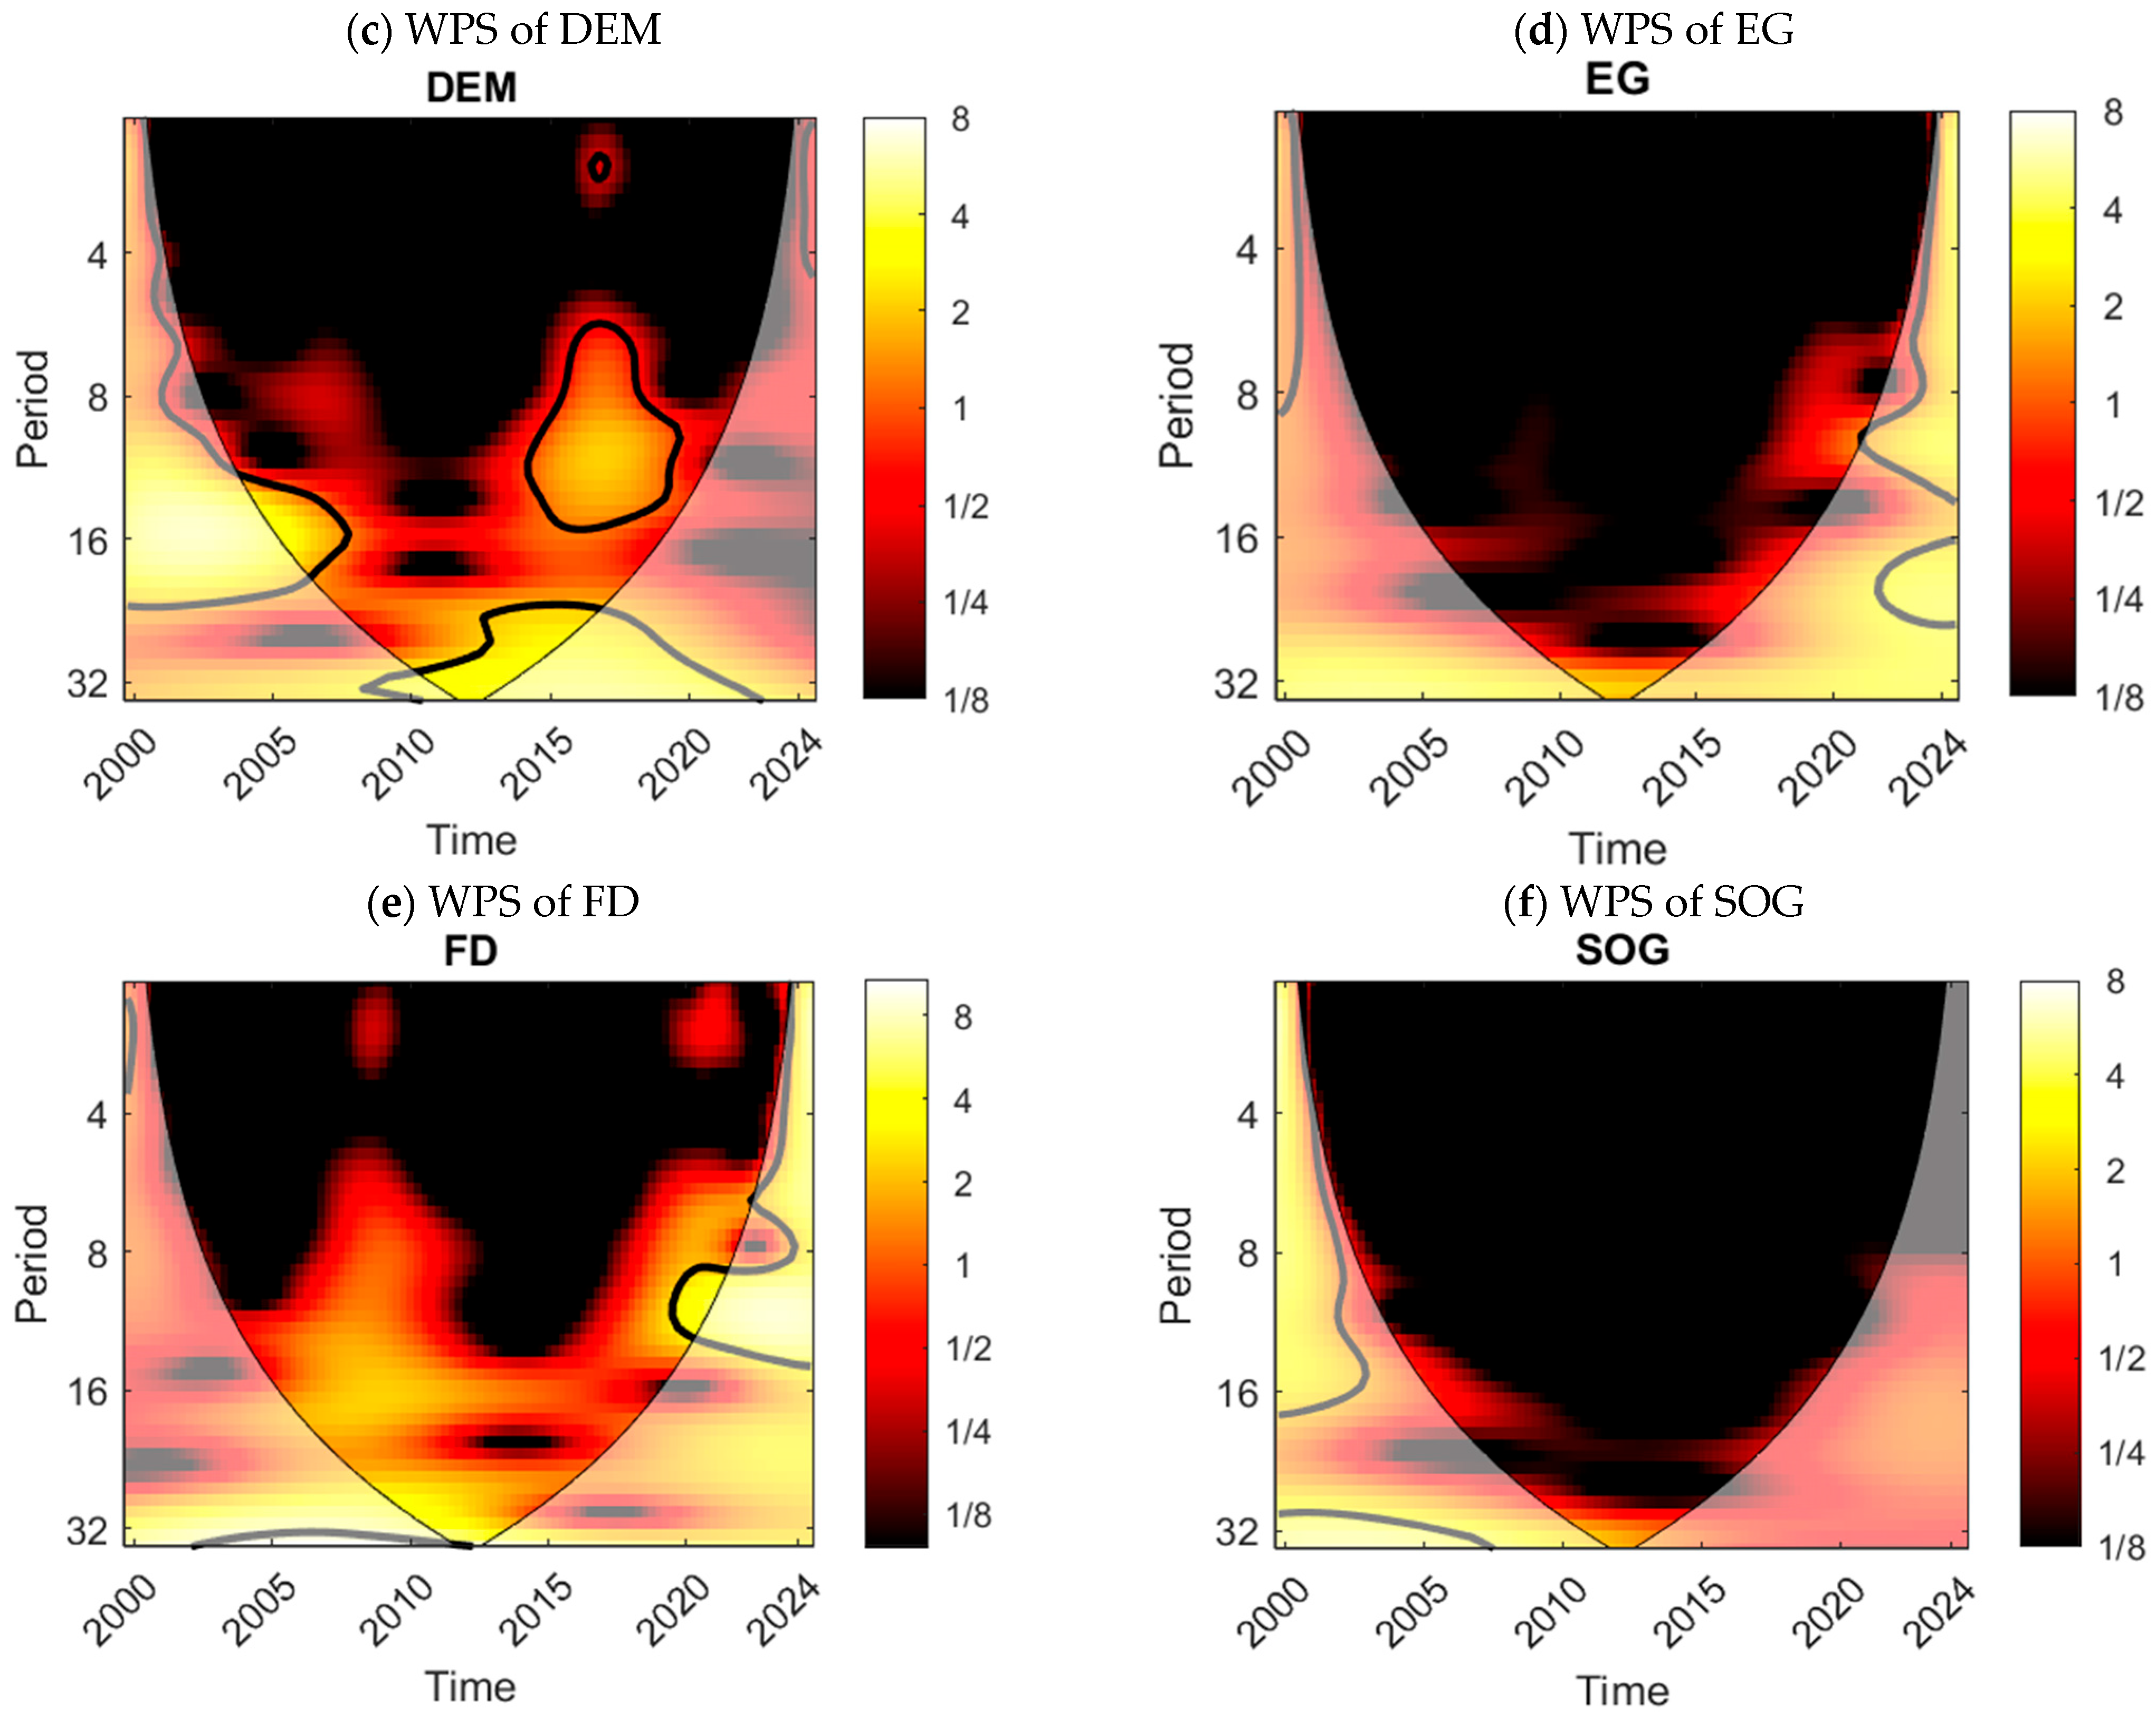
This study used the wavelet power spectrum (WPS) to capture the volatility of all the variables (see
Figure 3a–f). Each panel shows where the variance of a series “lives” in time and frequency: brighter colors (yellow/white) mean stronger power, dark colors mean weak power. The vertical axis displays period in quarters, so 4 ≈ 1 year, 8 ≈ 2 years, 16 ≈ 4 years, and 32 ≈ 8 years. A thick black contour encloses regions that are significant at the 5% level against a red-noise null; the curved cone of influence (COI) marks areas near the edges where results are less reliable. Interpreting WPS is therefore about spotting when (time) and at what horizon (period) the series becomes especially volatile or trend-dominated—without implying causality.
CET and EG both concentrate power at medium-to-long horizons (roughly 8–32 quarters), with notable bulges around the Great Recession and again near the pandemic window. That pattern is consistent with technology and growth responding in multi-year waves to policy and macro shocks: environmental and energy policies shape innovation with lags (e.g., support schemes and standards), while downturns/pandemics reallocate investment and amplify multi-year cycles. Empirical work shows policy instruments stimulate renewable-energy innovation (e.g., patents) and cost trajectories (like solar PV) evolve through long-run learning, both of which would register as power at 8–32 quarters [
36]. At the same time, crisis-linked slowdowns and recoveries (2008–2012, 2020–2022) naturally push EG’s variance toward longer periods, echoing findings that leverage/credit cycles amplify real activity over multi-year horizons [
37].
FD shows intermittent but strong power in the same medium-to-long bands, spiking around crisis epochs—exactly when credit, leverage, and liquidity conditions swung most. That is in accordance with evidence that financial cycles are long and that credit booms/busts propagate over several years [
37], so FD’s WPS “lights up” near 8–32 quarters in 2008–2012 and again around 2020–2023. By contrast, social globalization (SOG)—a component of the KOF Globalisation Index—evolves more gradually, so most of its energy sits at longer periods (16–32 quarters), with only brief mid-frequency pulses when communication flows and people-to-people linkages accelerate or pause (e.g., early-2000s digital diffusion, and pandemic-era travel and cultural flow disruptions).
DEM and WE variables are the slowest moving in this set, so it is expected that their strongest bands appear at the bottom of each panel (16–32 quarters). Democracy/governance indicators—such as those proxied by WGI dimensions—change only gradually, so significant power at long horizons is typical. Women’s education and skills development (WE) also loaded on long cycles, reflecting cohort dynamics and educational pipeline effects; U.S. evidence documents the long-run rise and reversal of the college gender gap and its macro relevance, which wavelets captured as low-frequency variance rather than short bursts. Moreover, the growth literature finds that gender gaps in education/employment depress growth—mechanisms that operate over many years—again matching the dominance of 16–32-quarter power.
5.5. Wavelet Coherence Results
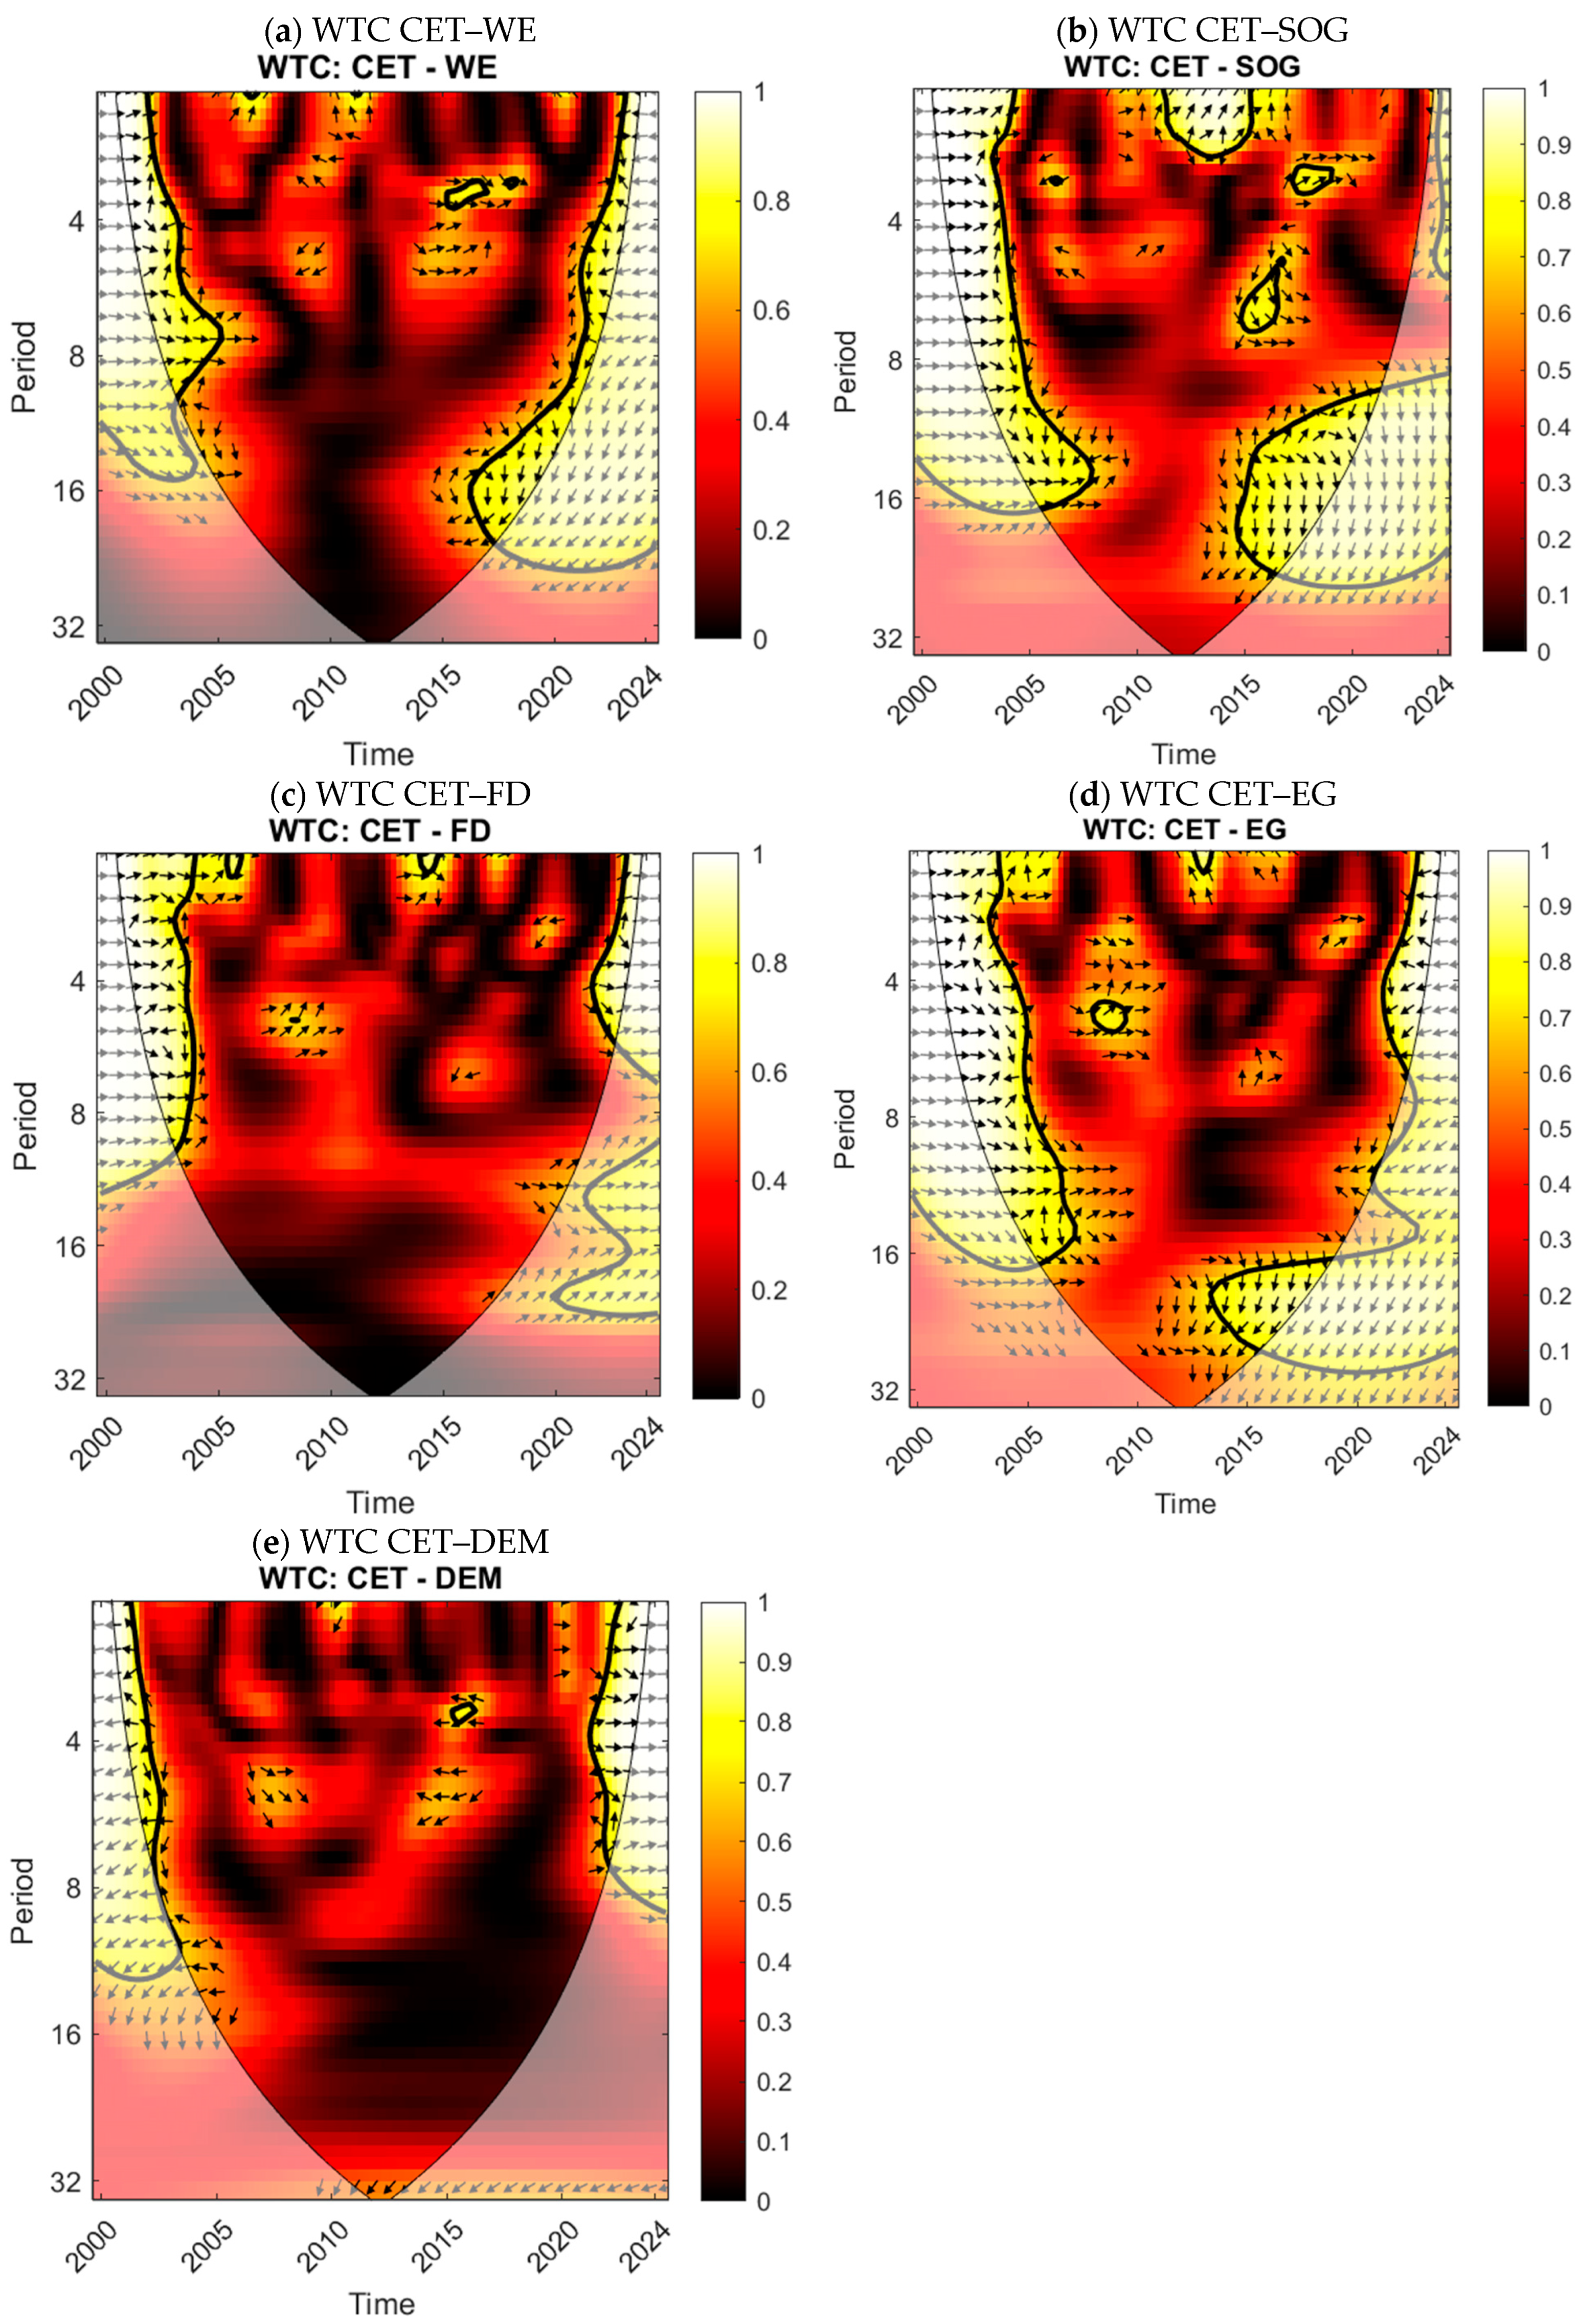
Next, we used the wavelet coherence (WTC) to examine the coherence between CEI and its determinants.
Figure 4a shows the clean energy technologies (CET) and women’s education/skills (WE) association. Coherence is strongest (yellow–red, inside the thick 5% contour) at medium frequencies of roughly 4–8 quarters during the early-to-mid 2000s and again around 2013–2018, with a smaller long-run patch near ~16 quarters circa 2016–2018. Arrows summarize phase: rightward = in-phase (positive association), leftward = anti-phase (negative), downward = CET leads WE, and upward = WE leads CET. In the significant mid-2000s band, many arrows are rightward with a slight downward tilt—consistent with positive comovement where CET tends to lead WE at 1–2-year horizons. In the 2013–2018 window, arrows are mostly rightward and often tilt upward—indicating continued positive comovement but with WE intermittently leading CET, especially as coherence strengthens at ~6–8 quarters and in a small ~16-quarter island. Results near the edges (e.g., 2020–2024) fall partly within the cone of influence, so they should be treated cautiously.
These time–frequency patterns align with evidence that human capital—especially women’s participation in STEM and decision-making—supports innovation and green technology outcomes: U.S. data show women’s participation in patenting has risen (though gaps remain), and diverse teams tend to produce more novel, higher-impact science; studies also link board gender diversity to stronger green innovation [
38]. Such findings are consistent with the dominant in-phase (rightward) patches and the mid-2010s zones where WE appear to lead CET at multi-quarter horizons. At the same time, the literature also documents mixed or context-dependent effects—meta-analyses and field evidence find that gender diversity does not always translate into stronger performance or technology adoption, and persistent STEM pipeline barriers can mute the education-to-innovation channel—matching the plot’s intermittent anti-phase pockets and weaker coherence in certain periods [
39]. Overall, the WTC suggests that CET and WE co-evolve most tightly at 1–4-year horizons in the United States, with leadership switching across episodes, but it remains correlational rather than causal [
40].
Figure 4b shows the association between clean energy technologies (CEI) and social globalization (SOG). We observed that coherence is most persistent at medium–long periods (≈6–16 quarters), with significant patches in the early-to-mid 2000s and again around 2014–2019; there is also a broader low-frequency band edging into 2020–2024 but partly inside the cone of influence (treat cautiously). In the early-2000s long band, many arrows lean leftward (negative association), whereas in 2014–2019, the arrows are mostly rightward (positive association) with alternating up- and down-tilts—i.e., leadership switches across 1½–4-year horizons. These patterns fit the idea that people-to-people ties, information flows, and cultural exchange (the KOF “social globalization” pillars) can accelerate or stall technology diffusion depending on the episode and scale [
41,
42].
The positive mid-2010s in-phase bands align with evidence that globalization—especially information and interpersonal connectivity—supports renewable adoption and green technology diffusion (e.g., globalization boosting renewable energy use; social networks aiding technology uptake). At the same time, the leftward (anti-phase) or weak-coherence intervals echo mixed findings: some studies report that (i) social globalization has insignificant effects on renewable energy in certain samples, or (ii) aspects of globalization can raise emissions or constrain clean-tech progress, implying that stronger global ties do not automatically translate into synchronized clean energy innovation. Overall, for the United States, the CET–SOG relationship is episodic and scale-dependent—mostly positive at 1½–4-year horizons in the 2014–2019 window, but negative or muted in parts of the early 2000s—highlighting that diffusion channels through social globalization can both amplify and lag clean energy dynamics across cycles. These discoveries affirmed the perspective of [
43,
44].
The CET–FD (see
Figure 4c) wavelet-coherence map for the United States reveals episode- and scale-dependent comovement. Statistically significant patches (inside the 5% contour) appear mainly at short-to-medium horizons of roughly 3–8 quarters in the early-to-mid-2000s and again around 2013–2019, with a thinner band extending toward longer periods (~12–16 quarters) late in the sample. In the early-2000s band, arrows are frequently leftward with mixed tilts, indicating a negative association and alternating leadership over 1–2-year horizons—consistent with the idea that swings in U.S. credit/market conditions can decouple from clean-tech activity during financial-cycle expansions and corrections. The literature documents that financial cycles are multi-year and need not be aligned with green investment, and that financial development can be neutral or even tilt toward activities that raise emissions, which helps rationalize the observed anti-phase intervals [
45,
46].
By contrast, during 2013–2019, the dominant patches are rightward with frequent slight upward tilts, indicating a positive association in which FD often precedes CET at 1–4-year horizons. This timing aligns with the rapid maturation of U.S. green finance—especially the surge in corporate green-bond issuance and broader financing channels that lower the cost of capital for clean technologies—findings echoed by firm- and country-level evidence that financial development and green finance mobilize investment and spur renewable deployment and innovation [
47,
48]. At the same time, mixed or nonlinear results in the literature (e.g., threshold or insignificant effects) caution that the finance–clean-tech link is contingent on market structure and policy design—consistent with the map’s intermittent weak-coherence/anti-phase pockets and the caution warranted near the sample edges.
Figure 4d shows the connection between clean energy technologies (CET) and democracy (DEM). Statistically significant patches (inside the 5% contour) cluster mainly at short-to-medium horizons of roughly 3–8 quarters in the early-to-mid 2000s and again during the mid-2010s, with a thinner band edging toward ~12–16 quarters around 2014–2018 (the lowest frequencies near ~2012 lie partly within the cone of influence and warrant caution). In the early-2000s band, the field shows pockets of leftward arrows (negative association) and alternating leadership, whereas the mid-2010s window is dominated by rightward arrows with mixed but frequent slight upward tilts, suggesting periods when democratic conditions or related political processes precede shifts in clean-technology dynamics over 1–2-year horizons. These patterns are consistent with evidence that more democratic polities tend to adopt stronger climate/energy policies and deploy more renewables—mechanisms that would produce the in-phase mid-2010s coherence and episodes where democracy appears to lead CET (e.g., policy adoption cycles, regulatory reforms). Reviews and cross-country studies [
6,
23,
49] find that democracies generate more ambitious climate policy outputs and are more likely to adopt renewable-energy policies such as feed-in tariffs; democracy is also associated with greater renewable use, and higher environmental-policy stringency fosters renewable deployment and innovation. At the same time, the early-2000s anti-phase pockets and intermittent weak coherence echo mixed findings in the literature.
5.6. Partial Wavelet Coherence Results
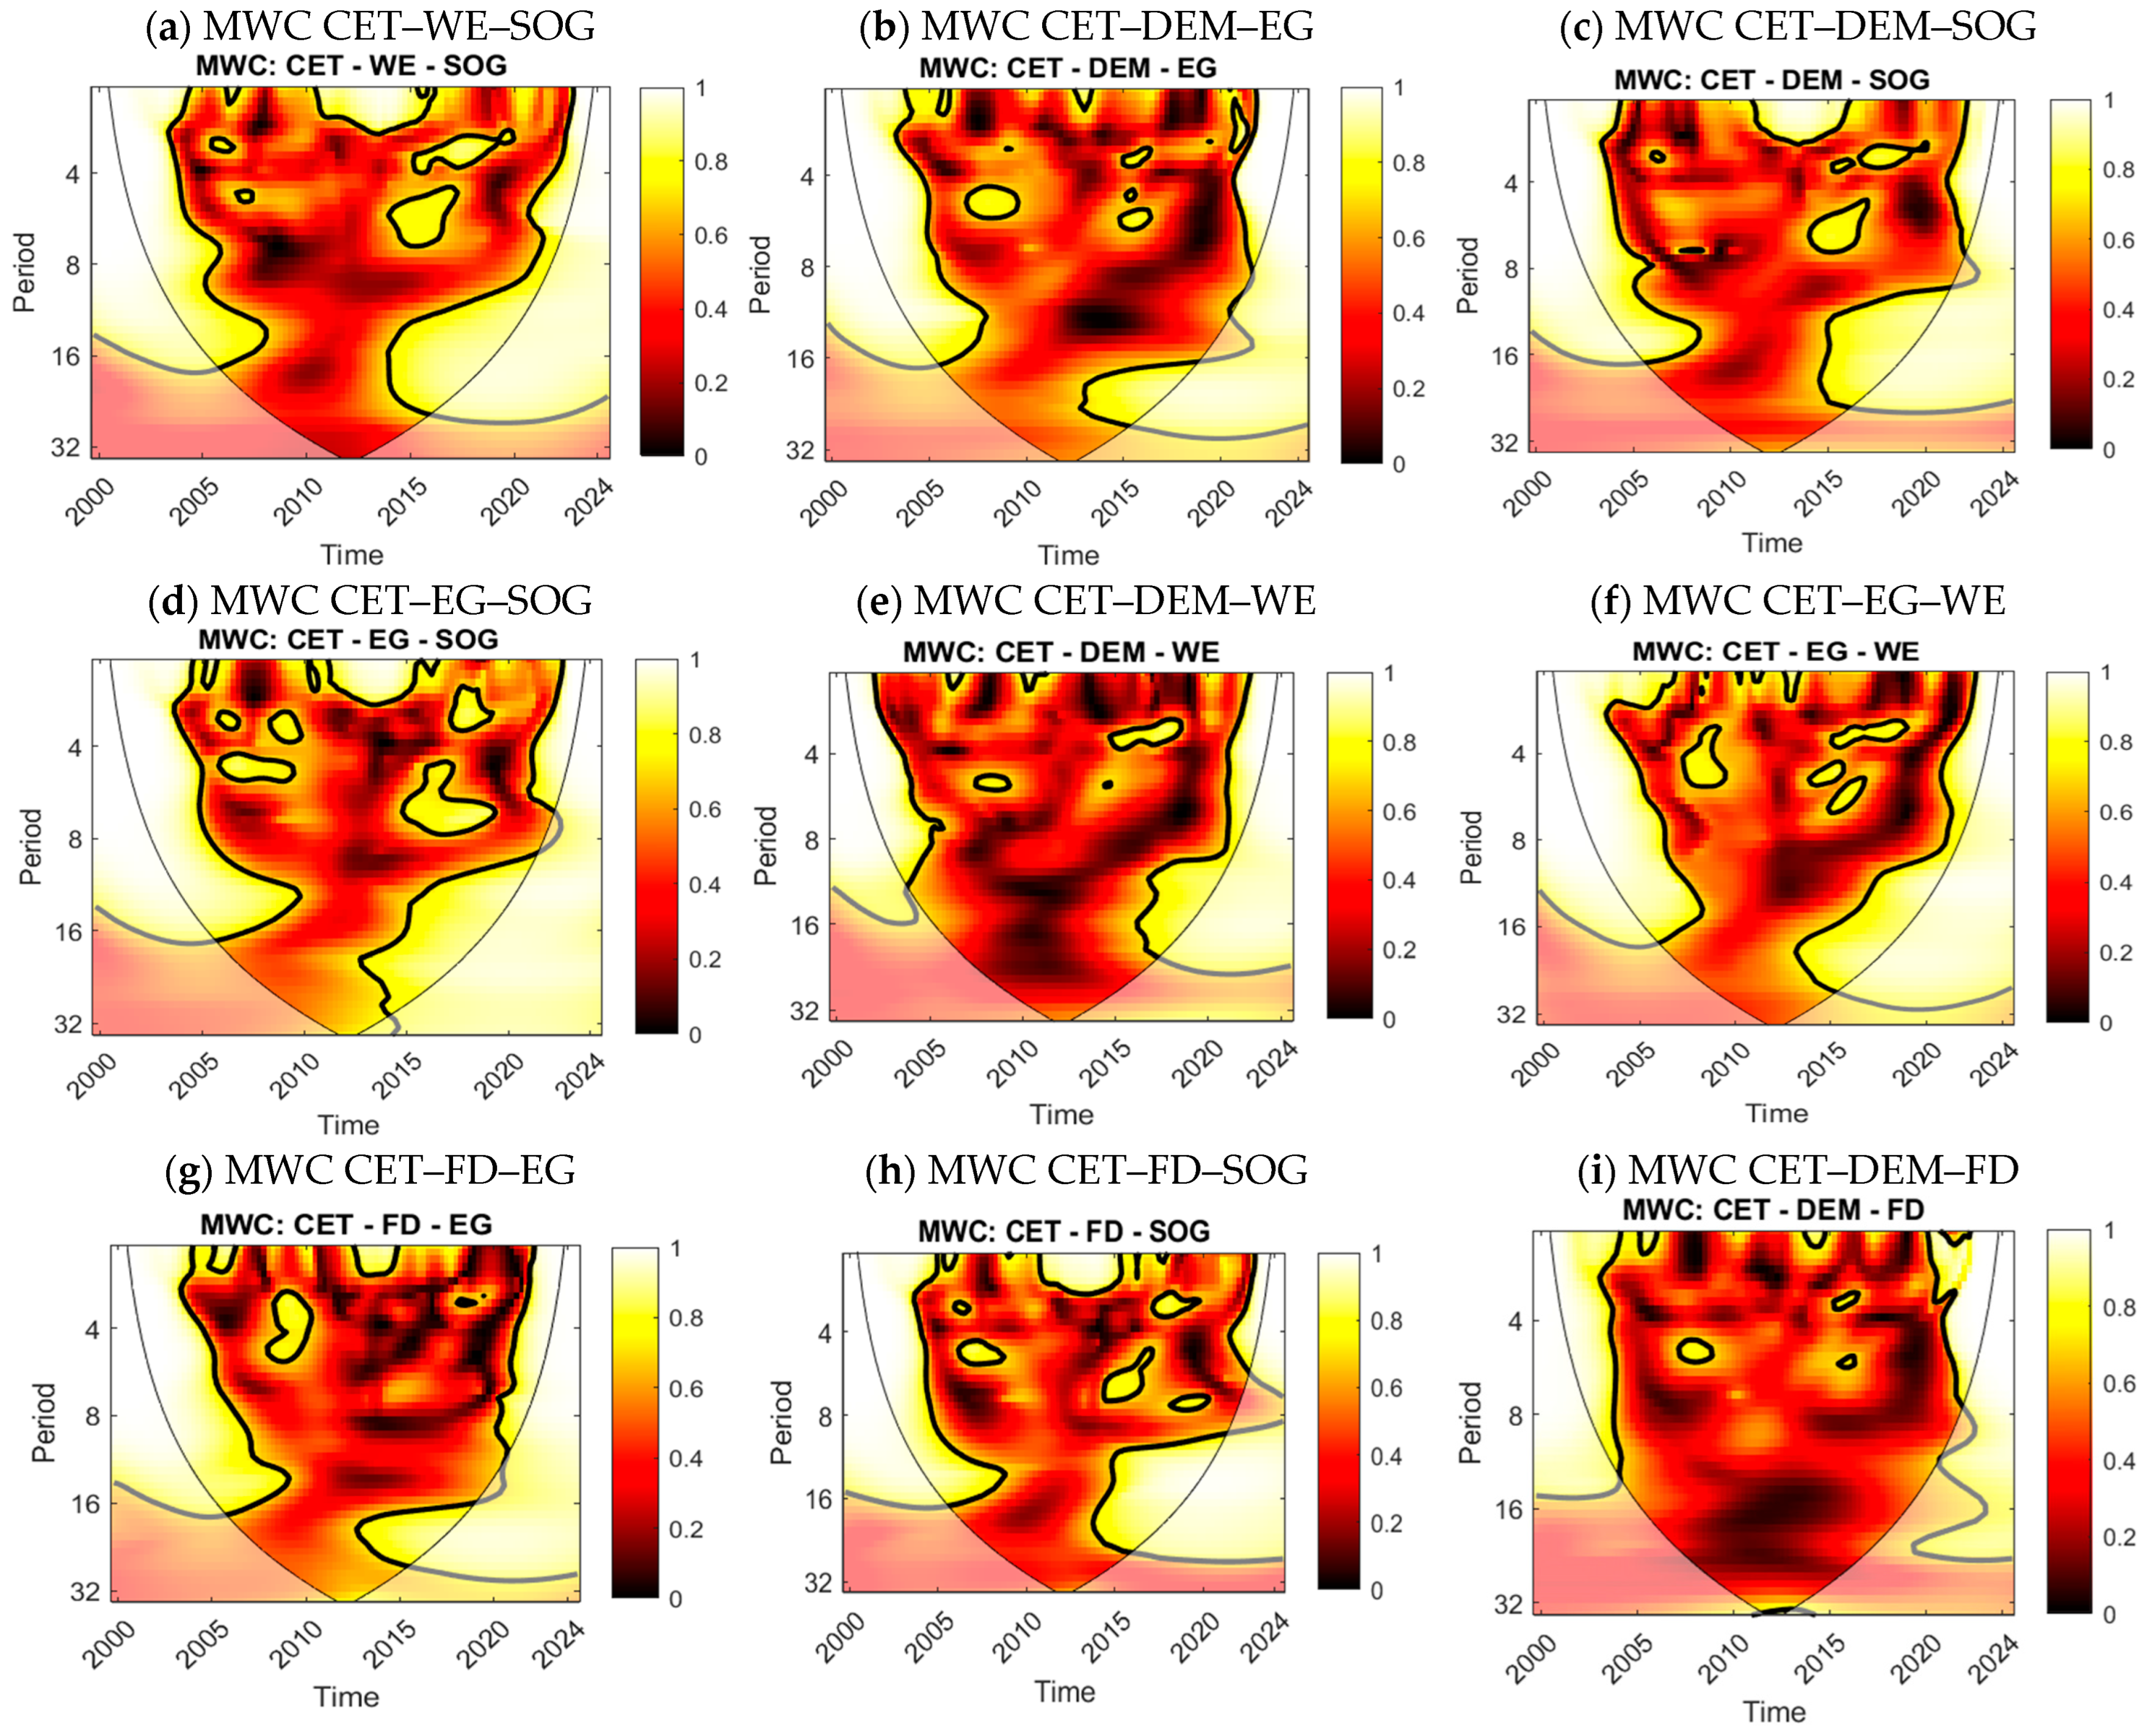
Next, we employed multiple wavelet coherence (MWC) to identify the effect of X1 on Y while considering X2.
Figure 5a–f presents MWC between CET and pairs DEM, WE, SOG, FD, and EG. Across panels, a consistent pattern emerges: the upper band (≈3–8 quarters) carries most of the statistically significant coherence, particularly in two broad windows—the mid-2000s and the mid-2010s—where CET co-moves strongly with institutional, social, human capital, financial, and macroeconomic conditions at business-cycle horizons. Patches near the extreme left/right and at very long periods lie partly within the cone of influence and should be interpreted cautiously.
Panels that include social and human capital channels—(a) CET–WE–SOG, (d) CET–EG–SOG, and (f) CET–EG–WE—show wide, significant “caps” in the 3–6 (up to 8) quarter range, especially from the early/mid-2000s through roughly 2011 and again around 2014–2019. This indicates that diffusion mechanisms (information flows, networks, and skills formation) align with CET dynamics primarily over 1–2-year cycles; extended, low-frequency islands are limited, consistent with the slower structural evolution of education and social connectivity. Panel (c) CET–DEM–SOG displays similar mid-frequency significance but with more fragmentation, suggesting that the joint operation of institutional quality and globalization for CET is episodic and sensitive to shocks. Overall, these four panels imply that knowledge diffusion and social connectedness amplify CET most reliably at medium horizons, while sustained multi-year (≥16-quarter) alignment is rarer.
Panels with institutions/finance/macroeconomy—(b) CET–DEM–EG, (e) CET–DEM–WE, (g) CET–FD–EG, (h) CET–FD–SOG, and (i) CET–DEM–FD—also peak at 3–8 quarters, but they exhibit thicker and more persistent mid-2010s significance, with occasional islands at ~12–16 quarters (notably in (g) and (i)). This suggests that policy/institutional shifts and financing conditions were jointly synchronized with CET during the mid-2010s, while early-2000s coherence is present but spottier (consistent with alternating cycles of policy experimentation, credit conditions, and growth). The finance-anchored panels ((g) and (h)) are notable for stronger mid-frequency coherence after 2013, consistent with the maturation of green-finance channels and broader capital-market support for clean technologies, whereas the DEM-anchored combinations ((b), (e), and (i)) indicate that institutional settings tend to reinforce the CET link with growth, education, and finance at business-cycle scales.
5.7. Wavelet Granger Causality Results
Next, we used wavelet Granger causality (WGC), suggested by [
35], because it detects time- and scale-specific predictive relationships, handling nonstationarity and structural changes by decomposing series into frequencies across the sample. In contrast, standard Granger causality assumes a single, time-invariant lag structure and can miss localized, horizon-dependent causality that varies across business-cycle and long-run bands.
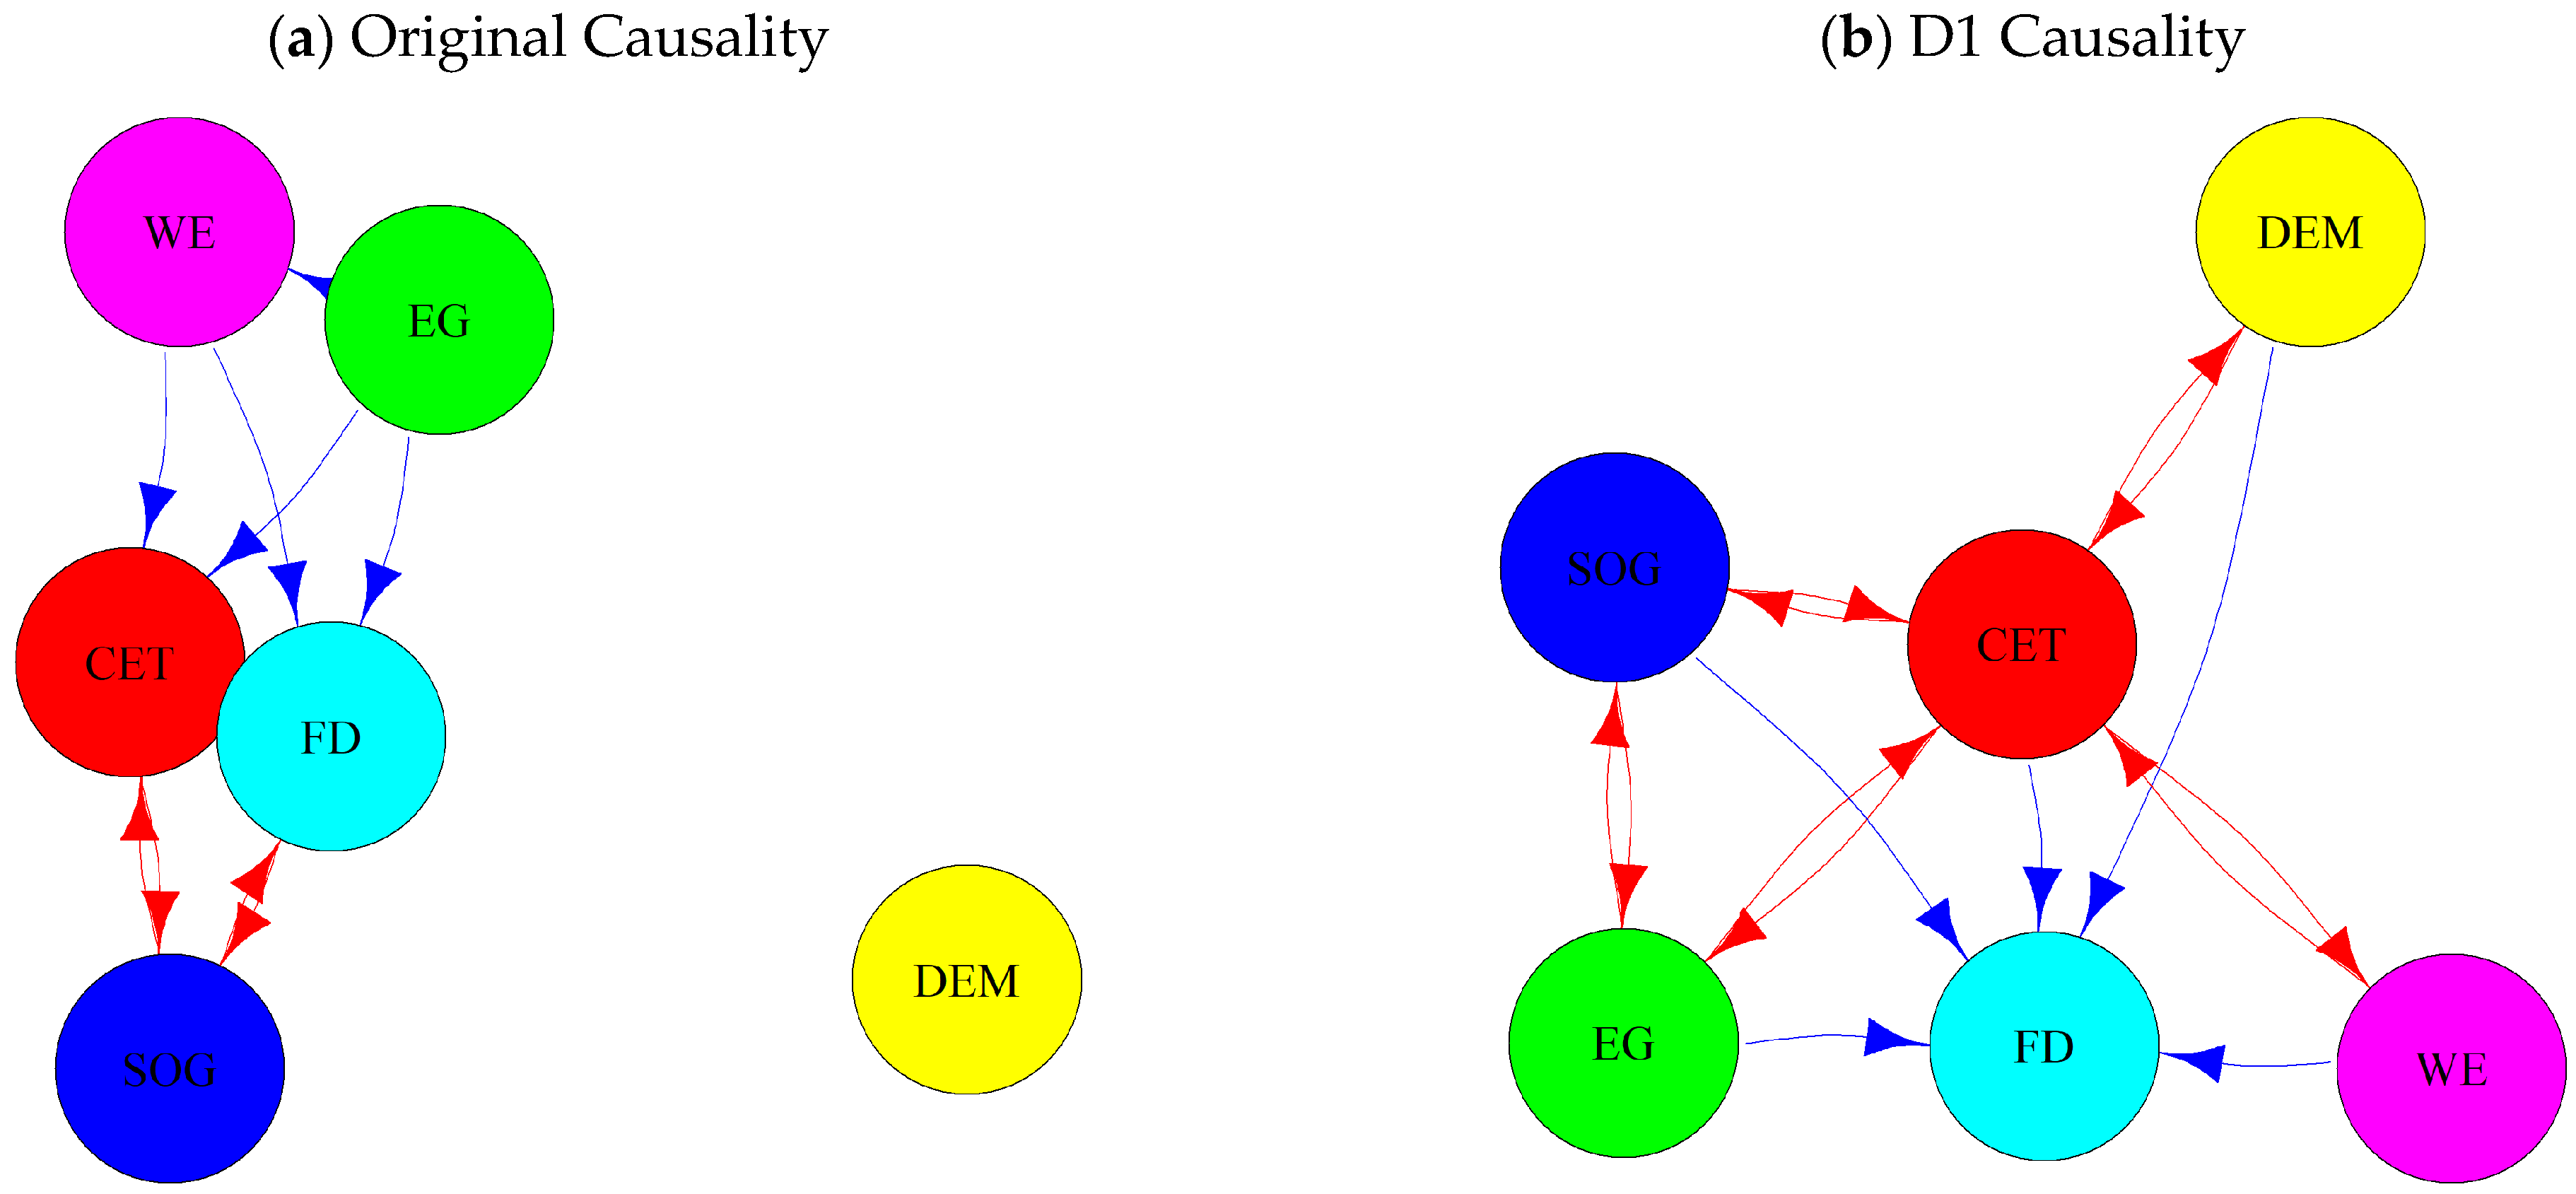
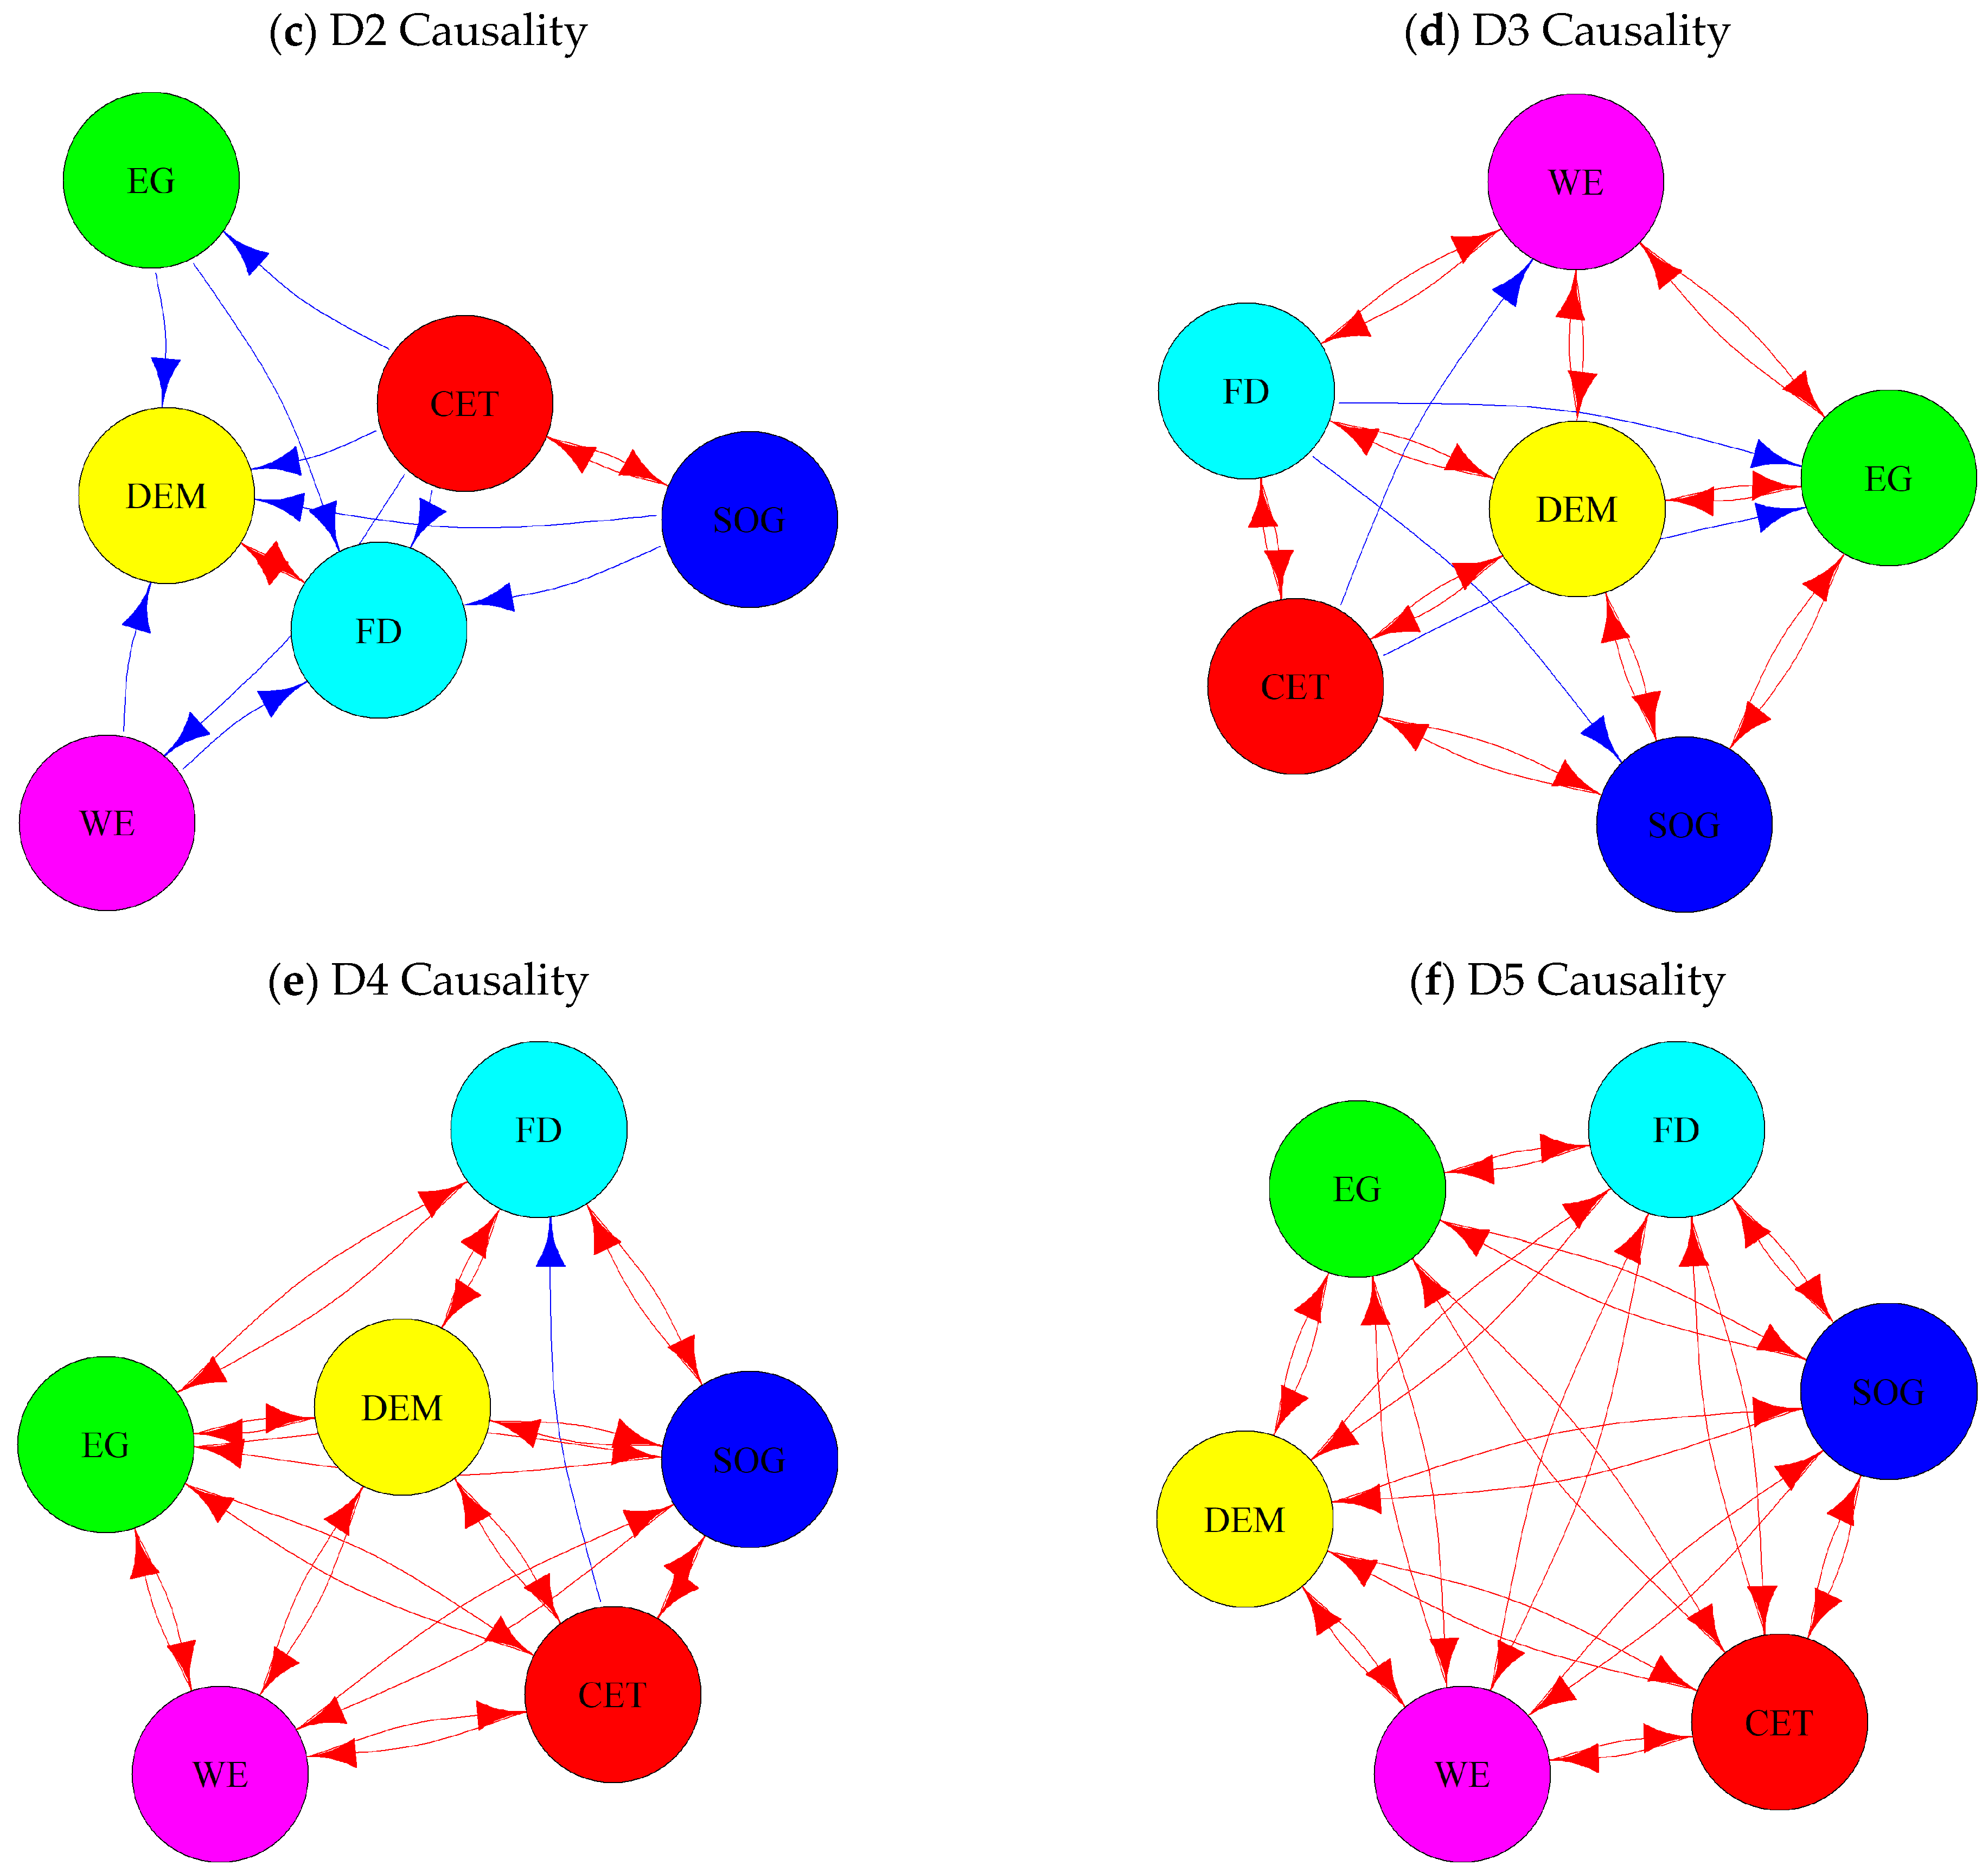
Figure 6a–f summarize WGC networks for the United States with clean energy technologies (CET) as a focal node. WGC decomposes the series into frequency bands (D1–D5) and tests Granger predictability at each horizon; directed edges indicate statistically significant scale-specific causality. By design, red links mark bidirectional feedback, whereas blue links indicate unidirectional effects. In the undifferentiated, “Original” panel (a), CET is already embedded in a multi-channel system: it exchanges information most clearly with social globalization (SOG) (bidirectional red), while women’s education (WE), economic growth (EG), and financial development (FD) show predominantly one-way (blue) impacts toward CET, consistent with a baseline in which human capital, macro activity, and finance help to predict clean-tech activity, but with limited immediate feedback to those drivers. Democracy (DEM) appears weakly connected in the full-sample view, hinting that its influence may be horizon-dependent.
Short-run decompositions D1–D2 (panels b–c) reveal a more granular picture. At the very short horizon (D1), CET forms reciprocal (red) relations with SOG and DEM and maintains active two-way ties with EG, while FD predominantly absorbs shocks from other nodes (several blue arrows pointing into FD), suggesting that financial variables adjust to near-term movements in CET, EG, and SOG rather than driving them contemporaneously. Moving to D2, DEM becomes more central, connecting bidirectionally with EG and FD and exerting clearer short-run influence on CET, while CET–SOG reciprocity persists. Together, D1–D2 imply that at business-cycle-type horizons (months to a couple of years), CET co-evolves with social linkages and the political environment, whereas finance tends to react rather than lead.
At medium and long horizons (D3–D5, panels d–f), the network densifies and feedback loops dominate. In D3 (medium term), CET exhibits bidirectional links with WE, DEM, SOG, EG, and FD, indicating mutually reinforcing dynamics between clean technology and the broader socio-institutional and macro-financial system. In D4 the graph becomes almost fully red, with only isolated blue edges (e.g., a residual one-way link between FD and DEM), and by D5 the structure is near-complete bidirectional connectivity. The implication is that over multi-year horizons, CET and its determinants co-determine each other: gains in human capital, institutional quality, globalization, growth, and finance not only help forecast clean-tech development, but advances in CET also feed back into these domains (e.g., by shaping financial products, skills demand, policy ambition, and trade/people flows). In sum, CET is most reactive at very short horizons, increasingly interactive at medium horizons, and becomes systemically co-evolving with the rest of the economy and society in the long run.
5.8. Discussion of Findings
The wavelet power spectrum results provide a clear mapping of how volatility in clean energy technologies (CET) and their determinants is distributed across time and frequency, highlighting the inherently multi-scale nature of clean energy dynamics in the United States. CET and economic growth display pronounced power at medium- to long-term horizons of approximately 8–32 quarters, particularly during the Great Recession and the COVID-19 pandemic. This concentration of variance at multi-year frequencies suggests that clean energy innovation and macroeconomic activity are shaped primarily by slow-moving policy, investment, and adjustment processes rather than short-lived shocks. From an SDG perspective, this pattern aligns with SDGs 7 and 13, which emphasize sustained structural change, long-term investment, and learning processes as prerequisites for energy transitions. The results further indicate that crisis episodes reallocate capital and labor over extended periods, reinforcing the importance of policy credibility and recovery-oriented frameworks.
Financial development exhibits a similarly episodic medium- to long-frequency profile, with volatility spikes concentrated around systemic crises. These dynamics reflect the long financial cycle, consistent with SDG 9, where credit expansions and contractions unfold over several years and strongly condition innovation capacity during periods of stress. In contrast, social globalization evolves more smoothly, with dominant power at longer horizons and only brief mid-frequency bursts during episodes of accelerated or disrupted cross-border interaction. This distinction highlights that while finance can amplify shocks rapidly, social integration influences CET primarily through gradual diffusion of knowledge, norms, and networks, supporting SDGs 17 and 12.
Wavelet coherence analysis further clarifies how CET co-moves with its determinants across horizons. The CET–women’s education relationship is strongest at medium horizons of roughly 4–8 quarters, with alternating leadership across episodes. Periods in which women’s education leads CET, particularly in the mid-2010s, are consistent with SDG 5 targets emphasizing empowerment through education and skills, where human capital improvements translate into innovation outcomes with observable lags. However, the episodic nature of coherence cautions against assuming a uniform relationship, suggesting that institutional conditions and structural barriers can mediate the effectiveness of education-led innovation pathways.
Similar scale-dependent patterns characterize CET’s coherence with social globalization, financial development, democracy, and economic growth. Financial development and democratic governance display clearer positive coherence with CET during the mid-2010s at business-cycle horizons, reflecting the maturation of green finance and the strengthening of participatory and accountable policy frameworks consistent with SDGs 16 and 5.c. Importantly, multiple wavelet coherence and wavelet-based Granger causality reveal that these relationships intensify and become increasingly bidirectional at medium and long horizons. While CET remains relatively reactive in the short run, over multi-year horizons it becomes embedded in a co-evolving system shaped by gender equality, institutions, finance, globalization, and growth. This progression underscores that clean energy transitions emerge from sustained, mutually reinforcing interactions across the socioeconomic system rather than from isolated drivers.
6. Conclusions and Policy
6.1. Conclusions
Investments in women’s education and skills development, social globalization, and financial development jointly support clean energy technologies by strengthening empowerment pathways, facilitating knowledge diffusion, and mobilizing long-term capital, thereby positioning SDG 5 (Gender Equality) as a foundational driver of clean energy innovation systems. Using quarterly data for the United States from 2000 to 2024 and wavelet-based methods, the study shows that clean energy technologies, economic growth, and financial development fluctuate predominantly at medium- to long-term horizons, with pronounced episodes around the global financial crisis and the COVID-19 period, while women’s education, social globalization, and democratic institutions evolve more gradually. Time-varying co-movement patterns indicate that clean energy technologies are positively associated with women-centered human capital and social globalization at medium horizons and that their relationship with financial development shifts from weak or negative in the early 2000s to persistently positive after the early 2010s, reflecting the maturation of green finance and supportive institutional frameworks. Overall, the findings reveal short-run adjustment in financial variables and increasingly bidirectional interactions between clean energy technologies and their socio-institutional drivers over longer horizons. By explicitly integrating women’s empowerment, skills formation, and participatory institutions into the analysis, the study advances understanding of SDG-5-centered sustainability transitions and provides a basis for gender-responsive policy measures, including targeted education and training initiatives, inclusive financial instruments, and institutional reforms that enhance women’s participation in clean energy decision-making.
6.2. Policy Implications
The time–frequency findings yield several policy-relevant implications when interpreted through the Sustainable Development Goals (SDGs). First, the concentration of CET, economic growth, and financial development volatility at medium- to long-term horizons (approximately 8–32 quarters), particularly during the 2008–2012 financial crisis and the 2020–2022 pandemic, highlights the importance of counter-cyclical and horizon-sensitive policy design. In line with SDGs 7 and 9, policymakers should establish stabilization mechanisms, such as dedicated clean-technology investment facilities with automatic counter-cyclical triggers, to prevent contraction in clean energy innovation during macroeconomic downturns. Such instruments can smooth cyclical fluctuations while sustaining long-term innovation pathways consistent with SDG 13.
Second, the evolving CET–financial development relationship underscores the need to strengthen the capacity of financial systems to support clean energy transitions. The shift from a weak or negative association in the early 2000s to a stronger positive linkage after 2013 suggests that financial development contributes more effectively once green finance instruments mature. To ensure alignment with SDGs 7 and 12, regulators should deepen green bond markets, standardize sustainable finance taxonomies, and expand blended finance mechanisms that mobilize private capital toward clean energy technologies.
Third, the strong mid-frequency coherence between CET, women’s education, and social globalization points to the central role of human capital and social diffusion channels in advancing clean energy innovation. Policies that promote women’s participation in STEM education, expand targeted scholarships and skills-training programs, and facilitate international knowledge exchange directly support SDG 5 while reinforcing SDGs 7 and 9. Addressing structural barriers to women’s education ensures that human capital gains translate into innovation spillovers over short- to medium-term horizons.
Finally, the observed coherence between CET and democratic governance underscores the importance of institutional quality for sustainable transitions. Transparent, stable, and inclusive governance frameworks, consistent with SDG 16 and SDG 5.c, enhance policy credibility, reduce investor uncertainty, and strengthen societal legitimacy. Expanding inclusive participation in energy and climate decision-making bodies can therefore align institutional development with sustained CET advancement.
6.3. Managerial Implications
Managers in the clean energy sector should recognize that the drivers of clean energy technologies (CET) operate differently across time horizons, with important implications for SDG-aligned strategic decision-making. In the short run, CET responds more rapidly to changes in democratic conditions and social globalization, while financial factors primarily adjust. This pattern calls for agile managerial strategies that closely monitor regulatory developments, public participation signals, and cross-border knowledge flows, in line with SDGs 16 and 17. At the same time, managers should mitigate short-term financial exposure through flexible financing arrangements and stable partnerships that support continuity in innovation and deployment, consistent with SDGs 7 and 9.
Over longer horizons, CET co-evolves with financial development, human capital accumulation, globalization, and institutional quality, underscoring the need for integrated and forward-looking management strategies. Aligning clean-technology investments with workforce development, inclusive skills formation, and gender-responsive training initiatives directly support SDG 5 by strengthening women’s participation in clean energy value chains. Moreover, sustained engagement with financial institutions and policy actors can enhance access to long-term capital and policy stability, reinforcing progress toward SDGs 7, 9, and 13. By embedding these SDG considerations into strategic planning, managers not only improve firm-level resilience and competitiveness but also contribute to the broader clean energy ecosystem and the inclusive sustainability transitions envisioned under Agenda 2030.
6.4. Limitation and Future Direction
This study is not without limitations. The reliance on aggregate, country-level quarterly data may mask heterogeneity across sectors or states where clean energy adoption and innovation differ substantially. Moreover, while wavelet-based methods provide a powerful tool to capture scale- and time-specific interactions, they remain correlational and do not fully eliminate concerns of endogeneity or omitted variables. Future research should therefore extend the analysis by integrating firm- or sector-level data, applying complementary methods such as structural VAR or machine learning-enhanced wavelet models, and conducting cross-country comparisons. Such efforts would help clarify causal mechanisms, uncover micro-level dynamics, and assess whether the U.S. patterns identified here generalize across different institutional and market contexts.