1. Introduction
Urbanization constitutes a central component of national modernization; however, the rapid expansion of high-density urban forms has profoundly reshaped residents’ living environments and the configuration of public resources [
1]. Currently, more than half of the global population resides in urban areas that occupy less than 3% of the world’s land surface, intensifying spatial competition and exacerbating inequities in public resource allocation [
2,
3]. Among these challenges, inequitable access to urban green spaces has emerged as a critical concern not only in urban governance and public health, but also in the pursuit of sustainable and socially inclusive urban development.
As essential public service infrastructure, urban green spaces deliver multiple ecological, social, and health benefits. They contribute to mitigating urban heat island effects, improving air quality, reducing noise pollution, and alleviating urban flooding, while also providing spaces for recreation, social interaction, and physical activity [
4,
5,
6]. A growing body of public health research indicates that both access to green spaces and the level of daily exposure are significantly associated with cardiovascular health, psychological stress, and overall well-being [
7,
8,
9]. Consequently, green space equity has become a key issue linking environmental sustainability, social sustainability, and health equity, extending beyond conventional spatial planning concerns. In the context of urban governance in China, green space equity has also been incorporated into policy frameworks such as “Ecological Civilization” and the “Park City” initiative. These frameworks emphasize the institutionalized planning and fine-grained design of green public resources to ensure inclusive access and equitable sharing under conditions of high-density urban development, thereby enhancing urban sustainability and social inclusiveness.
In recent years, research on urban green space equity has expanded substantially. Nevertheless, due to differences in analytical perspectives and indicator systems, existing studies have often produced inconsistent or even contradictory conclusions. Most assessments rely on single indicators—such as green space coverage [
10,
11], accessibility [
12,
13], or the green view index (GVI) [
12]—to evaluate distributional equity. While these metrics capture specific aspects of green space provision, they fall short of addressing the core question of whether residents actually encounter and experience green spaces in their daily lives. From a sustainability perspective, such single-indicator approaches risk overlooking experiential inequities that accumulate over time and undermine long-term urban livability and social sustainability.
Against this backdrop, GSE has gained increasing attention as a more experience-oriented and integrative concept. GSE emphasizes residents’ actual contact with green spaces during everyday activities across multiple dimensions, including visual exposure, physical accessibility, and spatial availability [
3,
14,
15]. Unlike traditional green space indicators, GSE is not a simple aggregation of metrics; rather, it adopts a human–environment interaction perspective to reveal potential structural mismatches between nominal green space provision and lived environmental experience. This conceptual shift enhances its explanatory power and policy relevance for sustainable urban governance, particularly in high-density cities where spatial resources are severely constrained.
Existing empirical evidence demonstrates substantial inter-city disparities in GSE levels and equity. For instance, Wu et al. (2023) [
16], analyzing 1028 cities worldwide, found that improvements in per capita GSE in cities of the Global South occurred at nearly four times the rate observed in cities of the Global North. Han et al. (2022) [
17], based on a comparative analysis of 1013 cities, further identified systematic inequalities in GSE between northern and southern cities globally. At the national scale, Lu et al. (2023) [
18] examined 263 Chinese cities and revealed pronounced inequities across dimensions of green space quantity, quality, and spatial distribution. However, these studies predominantly adopt cross-sectional designs and focus on inter-city comparisons, limiting insights into the temporal evolution of intra-urban GSE inequity and its implications for long-term sustainable urban development.
Moreover, constraints related to data availability and methodological approaches have resulted in a predominant reliance on remotely sensed green space coverage at relatively coarse spatial resolutions. Such approaches are insufficient for capturing eye-level green space perception and often fail to incorporate micro-scale environmental exposure along streets and daily travel routes. These temporal and spatial limitations hinder a systematic understanding of the dynamic nature of GSE equity, weakening its applicability to evidence-based sustainability-oriented planning and policy evaluation.
Addressing these gaps, this study takes Hangzhou as a case study and integrates multi-source, multi-temporal data to examine the spatiotemporal evolution of urban GSE and its equity. By combining remote sensing imagery with large-scale street view data, this research adopts a multi-dimensional perspective to assess GSE across visual, accessibility, and availability dimensions. The specific objectives are to:
(1) Evaluate the overall level and spatiotemporal dynamics of GSE in Hangzhou from 2013 to 2023;
(2) Characterize the temporal evolution and spatial differentiation of GSE equity during the same period;
(3) Compare patterns across different dimensions and equity indicators, explore their underlying mechanisms, and propose planning and policy recommendations to enhance equitable and sustainable urban green space provision.
2. Materials and Methods
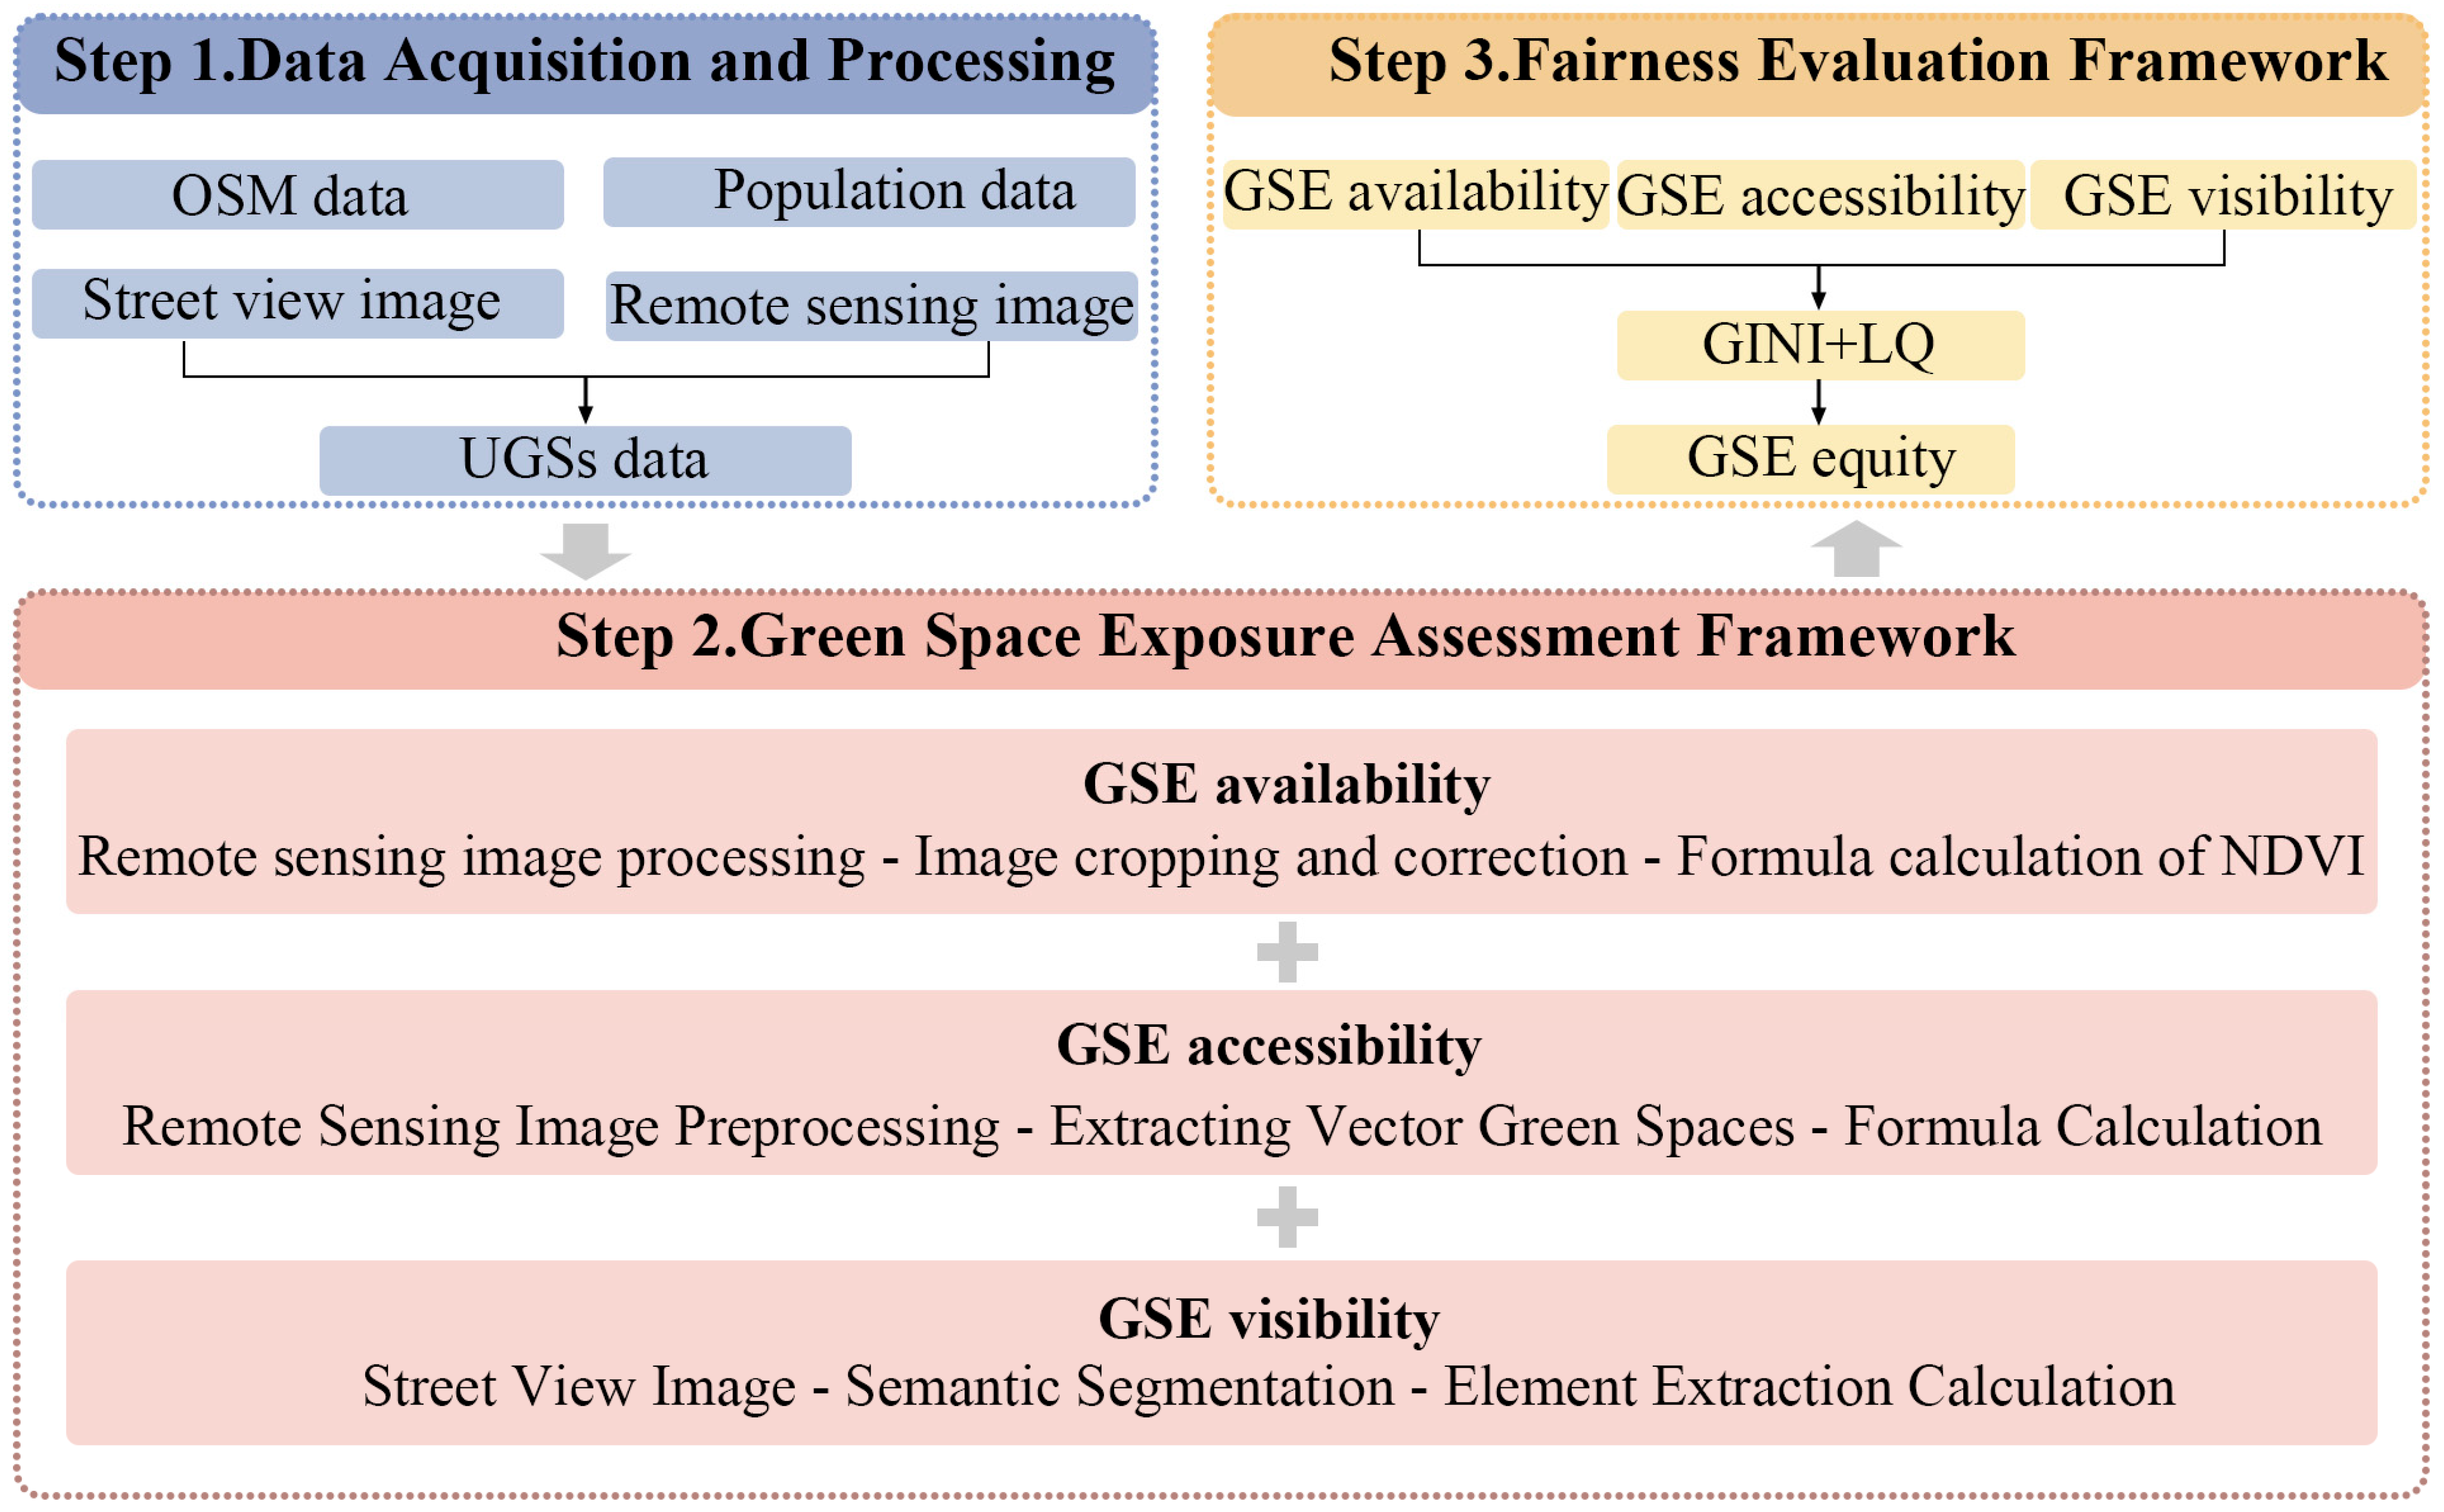
This study proposes a multi-dimensional framework to assess GSE and its spatiotemporal equity by integrating multi-source spatial data. Three dimensions of GSE—availability, accessibility, and visibility—are quantified using remote sensing imagery, vector-based green space and population data, and street view images with semantic segmentation techniques, respectively. Based on these indicators, GSE equity is evaluated using inequality metrics to reveal spatial and temporal patterns.
Figure 1 illustrates the overall workflow of data acquisition, processing, GSE assessment, and equity evaluation.
2.1. Case Study Area
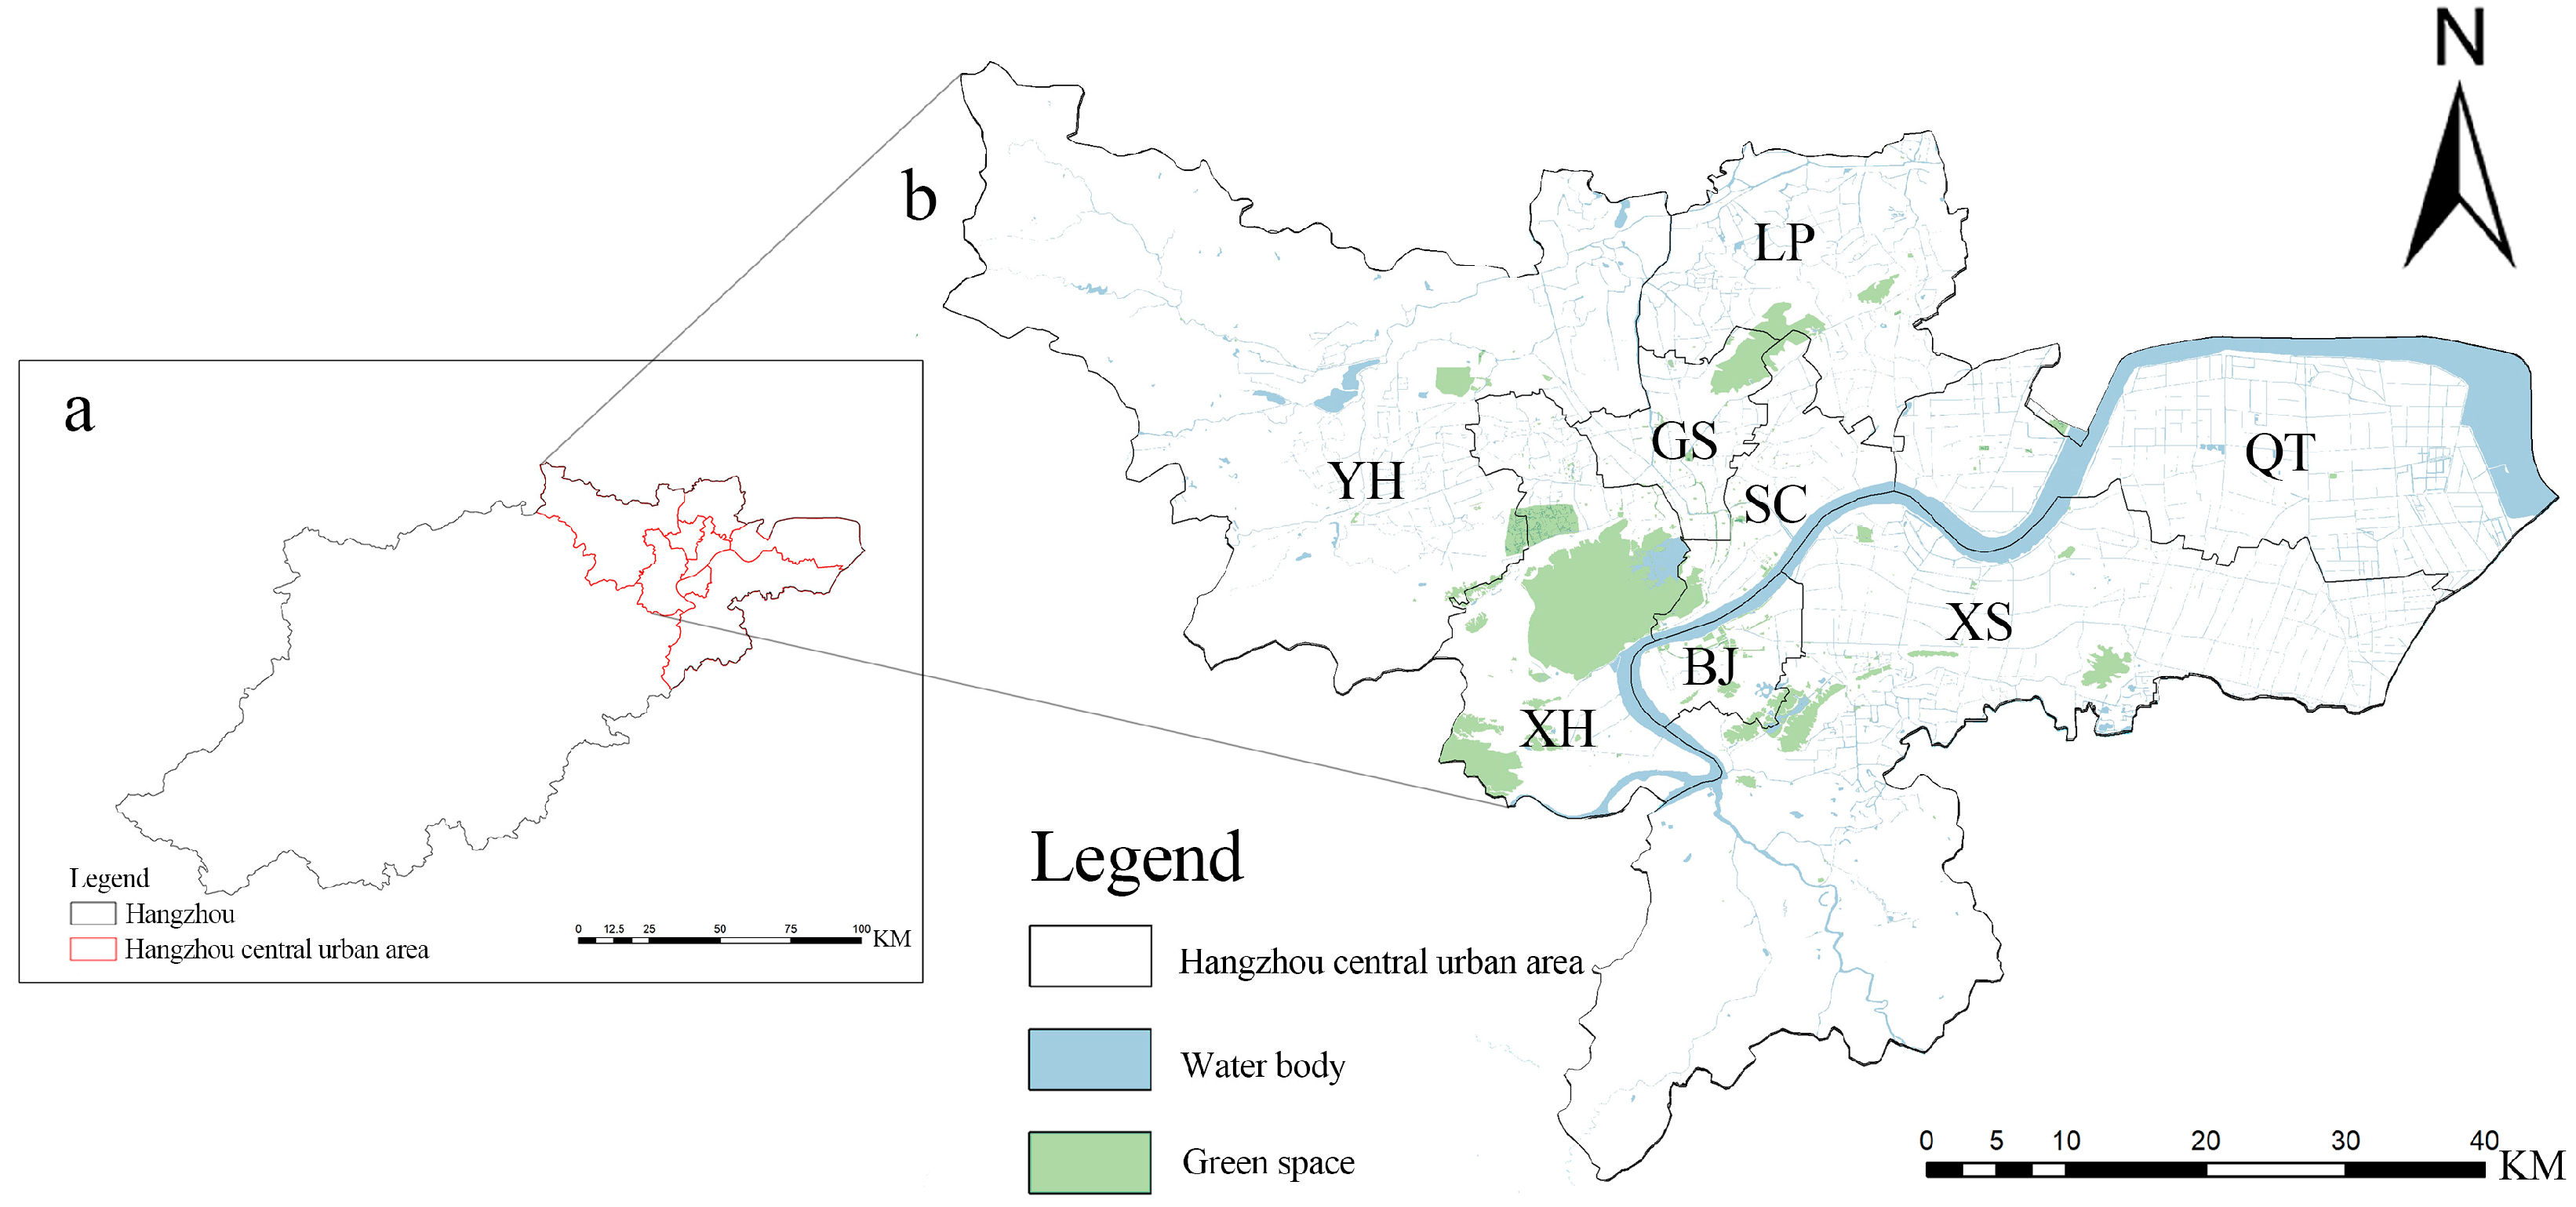
This study selected the central urban area of Hangzhou, China, as the study area (
Figure 2), primarily due to its typicality and representativeness in the co-evolution of rapid urbanization and green space development in Chinese cities. As one of the core cities in the Yangtze River Delta region, Hangzhou has experienced substantial population growth, intensified land development, and significant restructuring of its urban spatial pattern over the past decade. By the end of 2023, the city’s permanent resident population had reached 12.376 million, while the built-up area continued to expand, exhibiting a distinctive coexistence of high-density urban development and high-intensity green space construction.
From the perspective of internal urban structure, pronounced differences exist among subareas of Hangzhou’s central urban area in terms of land-use composition, development stage, and residential population characteristics. For example, the old urban districts (e.g., Shangcheng and Xihu) are dominated by high-density residential land and relatively mature public green space systems, whereas the peripheral new districts (e.g., Yuhang, Qiantang, and Linping) are characterized by newly developed construction land and rapidly advancing green space planning. This marked spatial heterogeneity provides an ideal context for examining intra-urban disparities in green space exposure and associated equity issues.
Accordingly, selecting Hangzhou as the case city not only facilitates an in-depth investigation of the spatiotemporal evolution of green space exposure under rapid urbanization, but also enables a comparative exploration of equity differences in green space availability, accessibility, and visibility across areas at different development stages and with distinct spatial characteristics.
This study focuses on the most recent decade of accelerated urbanization and green space development (2013–2023) and selects 2013, 2018, and 2023 as representative time points. The analysis covers the central urban area of Hangzhou, including Gongshu (GS), Shangcheng (SC), Xihu (XH), Yuhang (YH), Binjiang (BJ), Qiantang (QT), Xiaoshan (XS), and Linping (LP) districts (
Figure 2b), with a total area of 3334.17 km
2, to examine the spatiotemporal evolution of GSE equity.
2.2. Data Sources and Processing
The data used in this study primarily include administrative boundary data, road network data, residential community data, remote sensing imagery, and street view images (
Table 1).
2.2.1. Remote Sensing Imagery
Remote sensing imagery was obtained from the Geospatial Data Cloud of the Computer Network Information Center, Chinese Academy of Sciences (
http://www.gscloud.cn/search, accessed on 10 May 2024). Landsat 8 satellite imagery was selected as the primary data source. Images acquired during the growing season (April–August) of 2013, 2018, and 2023, with cloud coverage less than 10%, were selected to minimize cloud-related interference in vegetation extraction and to ensure comparability of vegetation conditions across different years. All remote sensing images have a spatial resolution of 30 m.
2.2.2. Street View Imagery
Street view imagery was acquired through the Baidu Maps API (Application Programming Interface). Based on the urban road network data provided by OpenStreetMap (
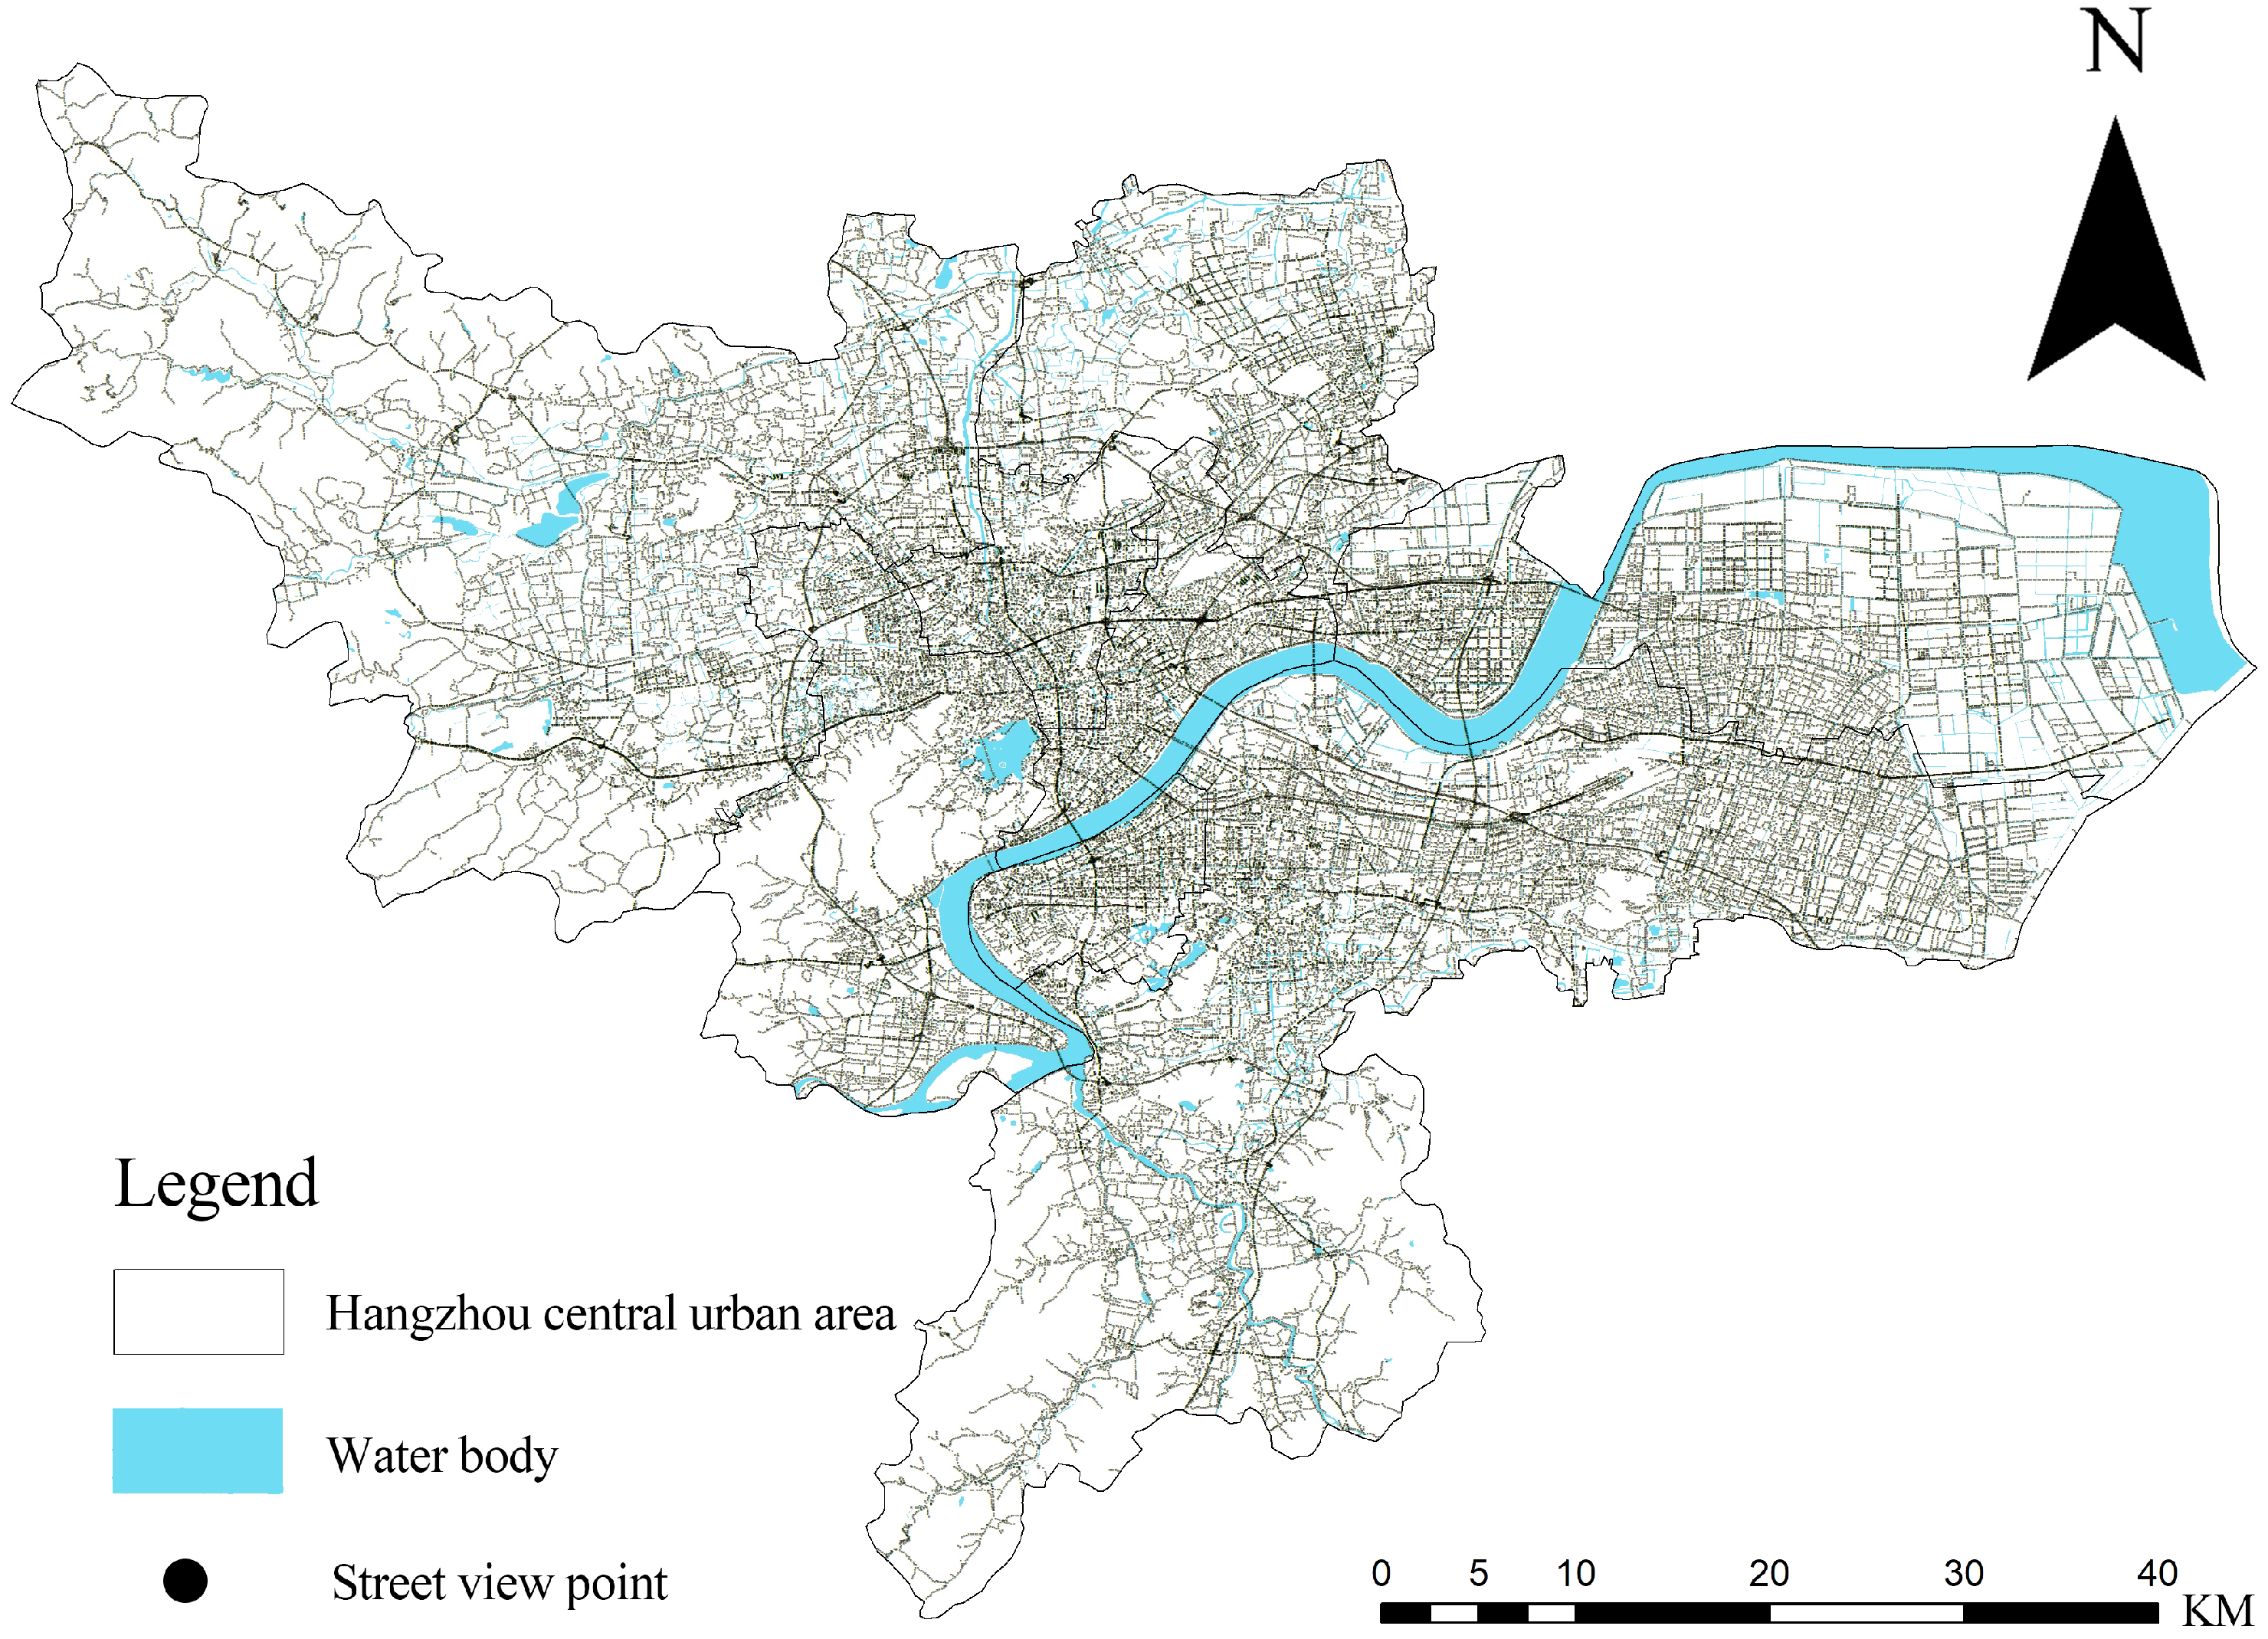
https://www.openstreetmap.org/, accessed on 10 May 2024), sampling points were randomly generated at 100 m intervals along the road network (
Figure 3). For each point, panoramic static images were retrieved, covering a vertical field of view from 0° to 90° and a horizontal field of view from 0° to 360° [
19].
Using the temporal metadata associated with street view images, images captured in 2013 (from January 1 to 31 December 2013) were first identified. A manual visual inspection was then conducted to exclude images taken during non-green seasons (e.g., winter or periods of vegetation senescence). For sampling locations lacking street view images from the target year, images from the closest adjacent years (2012 or 2014) were used as substitutes to ensure spatial continuity and sample completeness.
The same screening and cleaning procedures were applied to construct the street view datasets for 2018 and 2023. Subsequently, all images underwent unified quality control to further remove images with severe occlusion, poor image quality, or those not meeting the definition of street view scenes. After preprocessing, a total of 42,410 valid street view images across the three time points were retained for the calculation and analysis of the GVI.
2.2.3. Population Data
Population data were sourced from two major Chinese real estate platforms, Anjuke (
https://www.anjuke.com/, accessed on 13 May 2024) and Lianjia (
https://wh.lianjia.com/xiaoqu/, accessed on 13 May 2024). Using Python-based web scraping techniques (Python version 3.9), data on residential communities in Hangzhou were collected as of the end of 2023. The extracted information includes the number of households, community name, year of completion, and administrative district. For records with missing household numbers or construction years, supplementary information was obtained through manual inspection of street view maps and consultation with real estate agents. After data cleaning, a total of 5600 valid residential community records were retained. Based on the year of completion, 4026 communities completed by or before 2013 were identified, and 5037 communities completed by or before 2018 were obtained using the same procedure.
Compared with conventional rectangular grid systems, hexagonal grids have equal distances from the centroid to all six directions, which helps reduce sample bias caused by boundary effects and improves the stability of spatial analysis results. Therefore, this study employed a regular hexagonal aggregation approach, constructing hexagonal grids with a side length of 250 m. Residential community points within each hexagon were aggregated to the grid centroid. This process yielded 1505 aggregated residential points for 2013, 1875 for 2018, and 2049 for 2023, facilitating subsequent quantitative analysis.
Population size at each aggregated residential point was calculated based on the total number of households within each hexagon, as shown in Equation (1):
In Equation (1), is the estimated population of hexagon k; denotes the set of residential communities within hexagon k; is the number of households in community ; M is the average number of people per household in the corresponding year.
To provide a basic empirical check of the population estimation approach, a small-scale validation was conducted at the residential community level. For example, in Hemuxincun, Hemu Subdistrict, Gongshu District, the officially reported population is 9757, while the estimated population derived from housing data is 9735.75, corresponding to a relative error of 0.22%. This comparison suggests that the housing-based method provides a close approximation of actual population counts at the residential community scale. This localized comparison serves as a consistency check rather than a comprehensive assessment of population estimation accuracy.
2.3. Measurement of GSE
GSE in this study is measured through a multi-dimensional composite framework that integrates availability, accessibility and visibility. These dimensions reflect different aspects of residents’ interaction with urban green space. The measurement approach is as follows.
2.3.1. Measurement of GSE Availability
The Normalized Difference Vegetation Index (NDVI) is a widely used remote sensing indicator that accurately reflects surface vegetation coverage. It is commonly employed to characterize the spatial distribution of and temporal variation in green spaces.
In this study, Landsat 8 satellite imagery was preprocessed using ENVI 5.6.2 software. First, radiometric calibration was performed to convert digital numbers into surface reflectance values. Atmospheric correction was then applied to reduce atmospheric effects on surface reflectance. Subsequently, image mosaicking and clipping were conducted to obtain imagery for the study area.
NDVI was calculated using the Band Math function according to Equation (2):
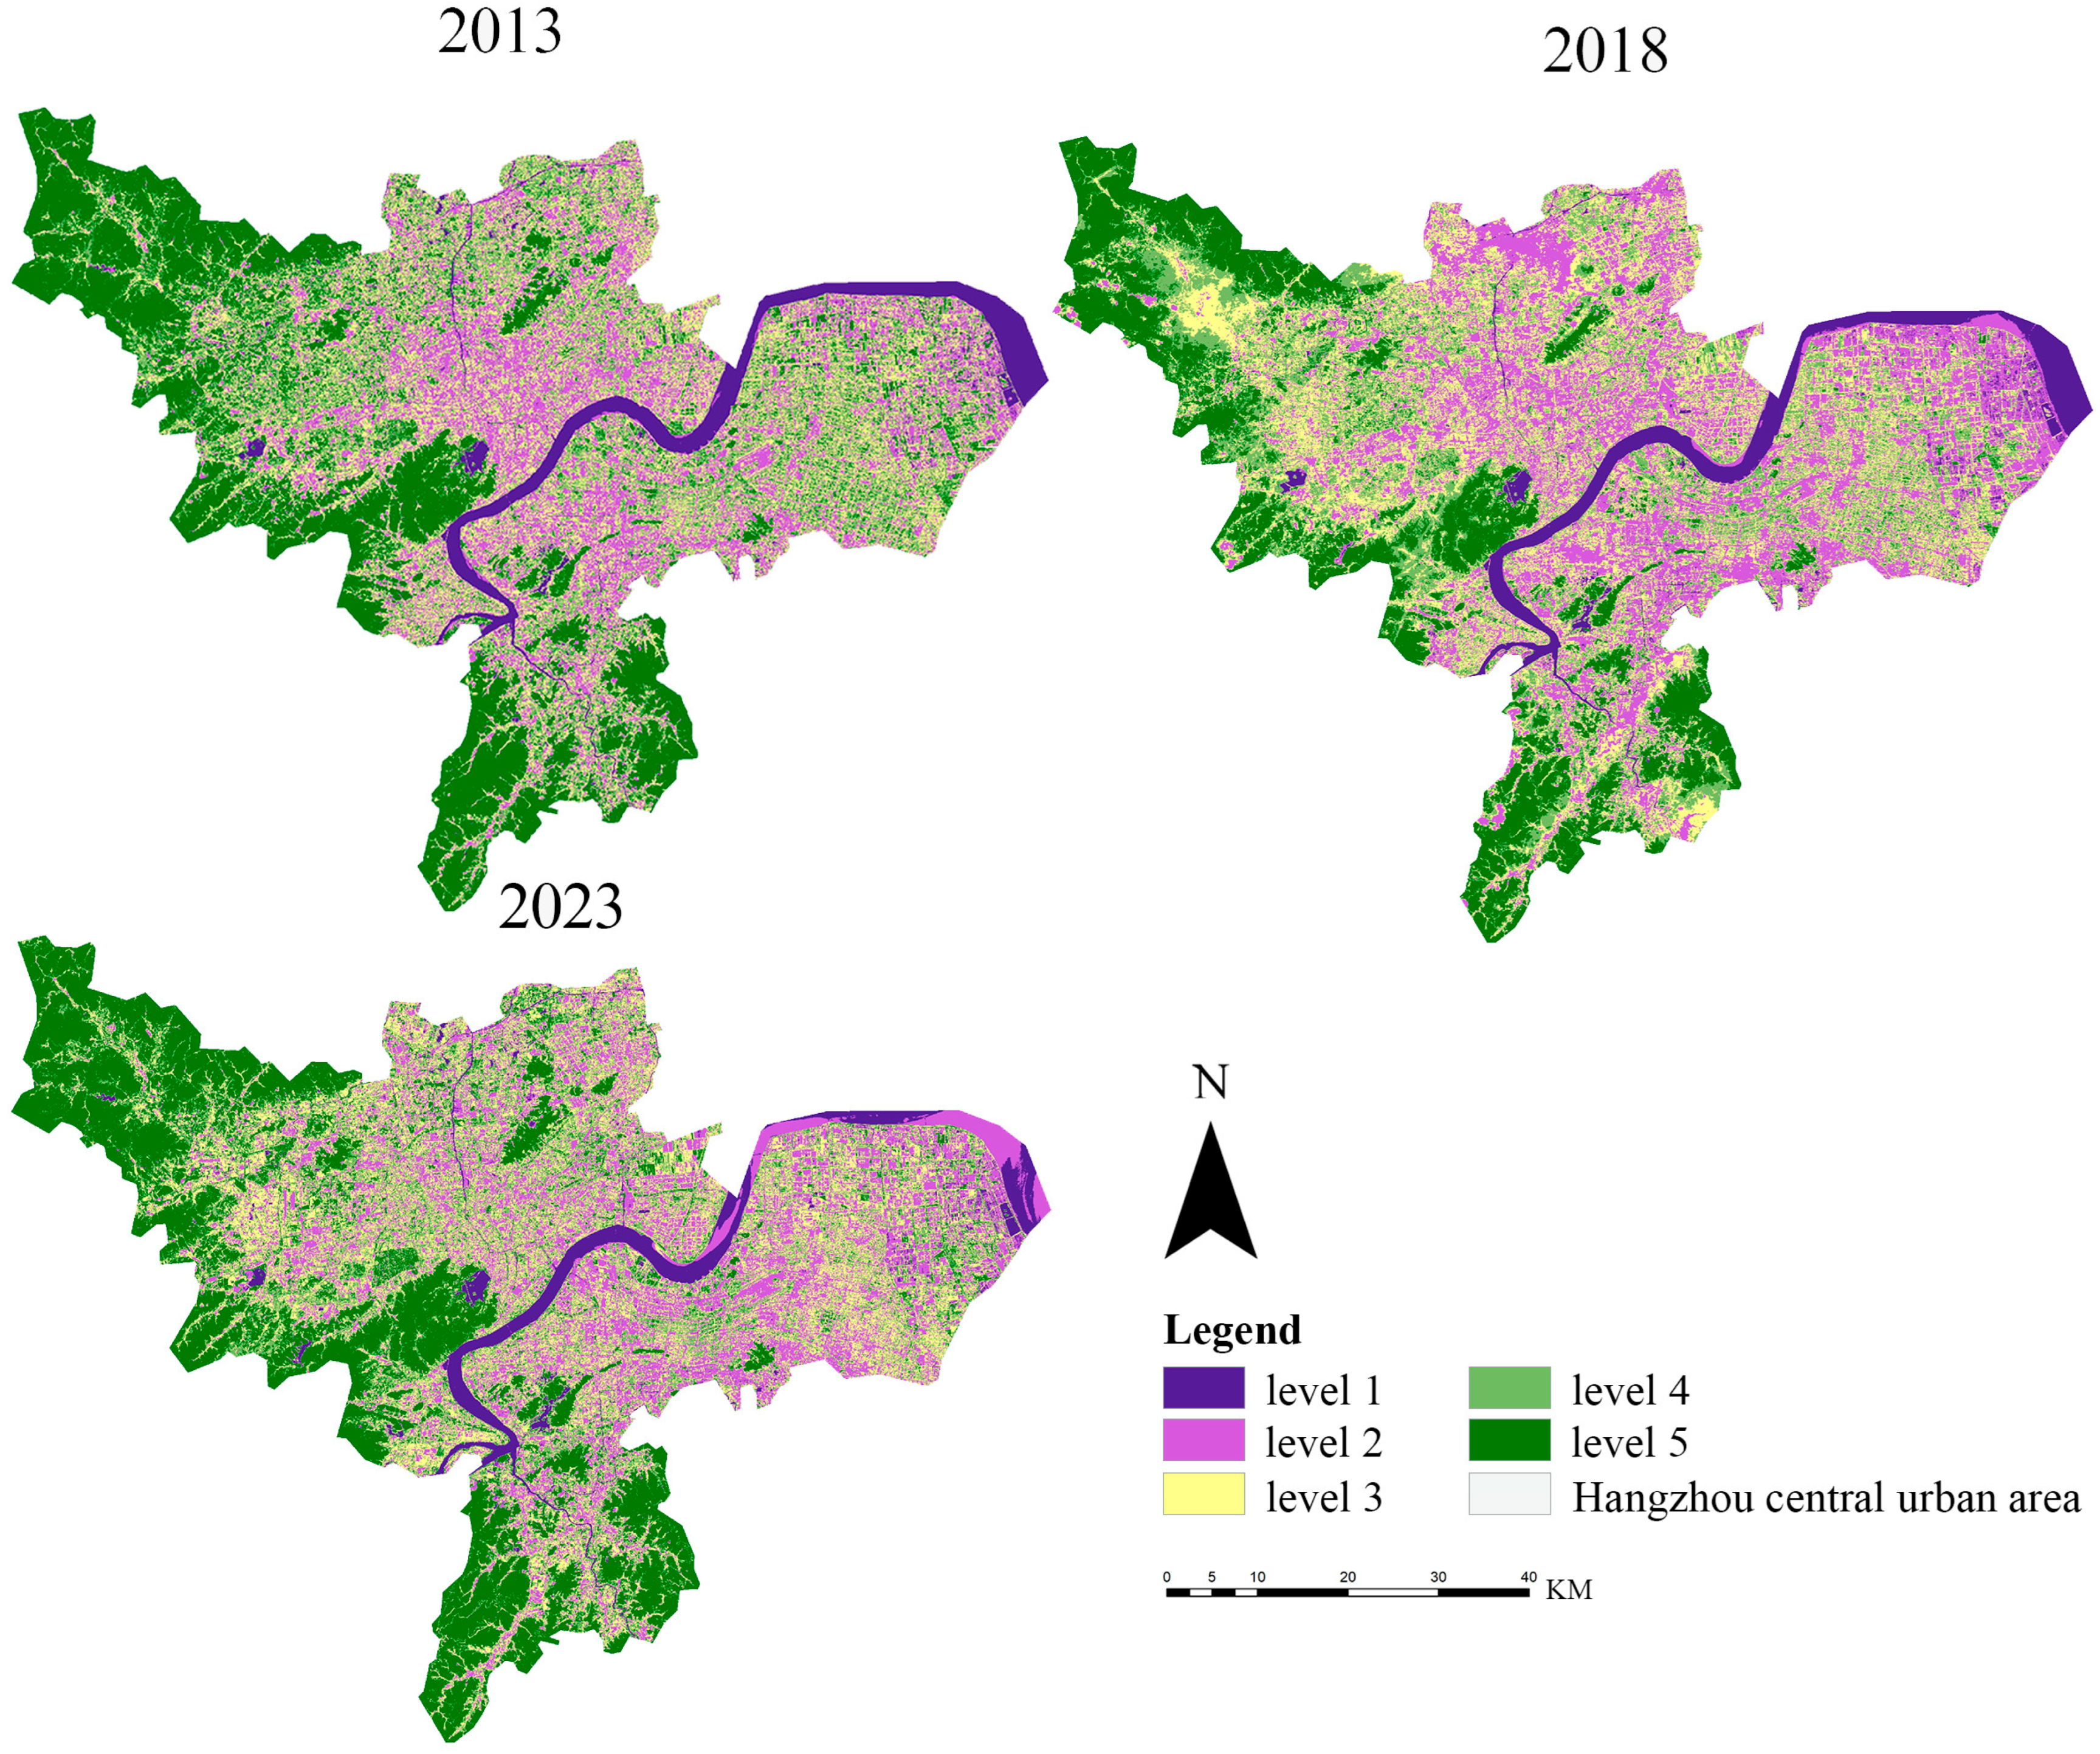
In Equation (2), NIR represents the near-infrared band, and RED represents the red band of the electromagnetic spectrum. The resulting NDVI values were normalized using the Compute Statistics function, and mean NDVI values were obtained for subsequent analysis. NDVI serves as an important indicator of vegetation coverage and greenness, with higher values indicating denser vegetation. Following previous studies, NDVI values were classified into five levels using the thresholds ≤0.2, 0.2–0.4, 0.4–0.6, 0.6–0.8, and ≥0.8, corresponding to Level 1 through Level 5, which represent low, below-average, average, above-average, and high green space availability, respectively.
2.3.2. Measurement of GSE Accessibility
Accessibility refers to the extent to which residents can obtain GSE resources within a certain range. Due to its computational simplicity and the ease of data acquisition, it has been widely used to assess the supply-demand balance of urban green spaces. In this study, Landsat 8 imagery was preprocessed using ENVI 5.6.2 software, including image fusion and orthorectification. Urban green spaces were then extracted, and the resulting green space vector data were further processed for accessibility analysis.
This study adopts the Gaussian two-step floating catchment area (Gaussian 2SFCA) method, which incorporates a Gaussian decay function to simulate the gradual attenuation of service effectiveness with increasing distance. Compared with traditional methods using fixed boundaries, this approach better reflects the continuous variation in service intensity in real-world settings and effectively mitigates abrupt changes in accessibility outcomes.
Using ArcGIS 10.8, the service capacity of each park green space was calculated. For each green space
, a spatial distance threshold
was defined to establish its service catchment. According to the
Guidelines for the Construction and Service of 15-Minute Quality Cultural Living Circles [
20] issued by the Hangzhou municipal government—which specify a 15 min walking distance and a maximum service radius of 1000 m for daily community public spaces—the distance threshold
was set to 1000 m in this study.
Within the catchment area, the population of demand points
was weighted using a Gaussian distance decay function to estimate the total potential population served by green space
. The supply–demand ratio
of each green space was then calculated as follows:
where
denotes the population of demand unit
;
represents the walking time cost between residential point
and green space
;
is the supply capacity (area) of green space
; and
is the Gaussian distance decay function accounting for spatial friction, defined as:
Finally, green space accessibility at each residential location
was calculated by summing the weighted supply–demand ratios of all green spaces within the threshold distance, as shown in Equation (5):
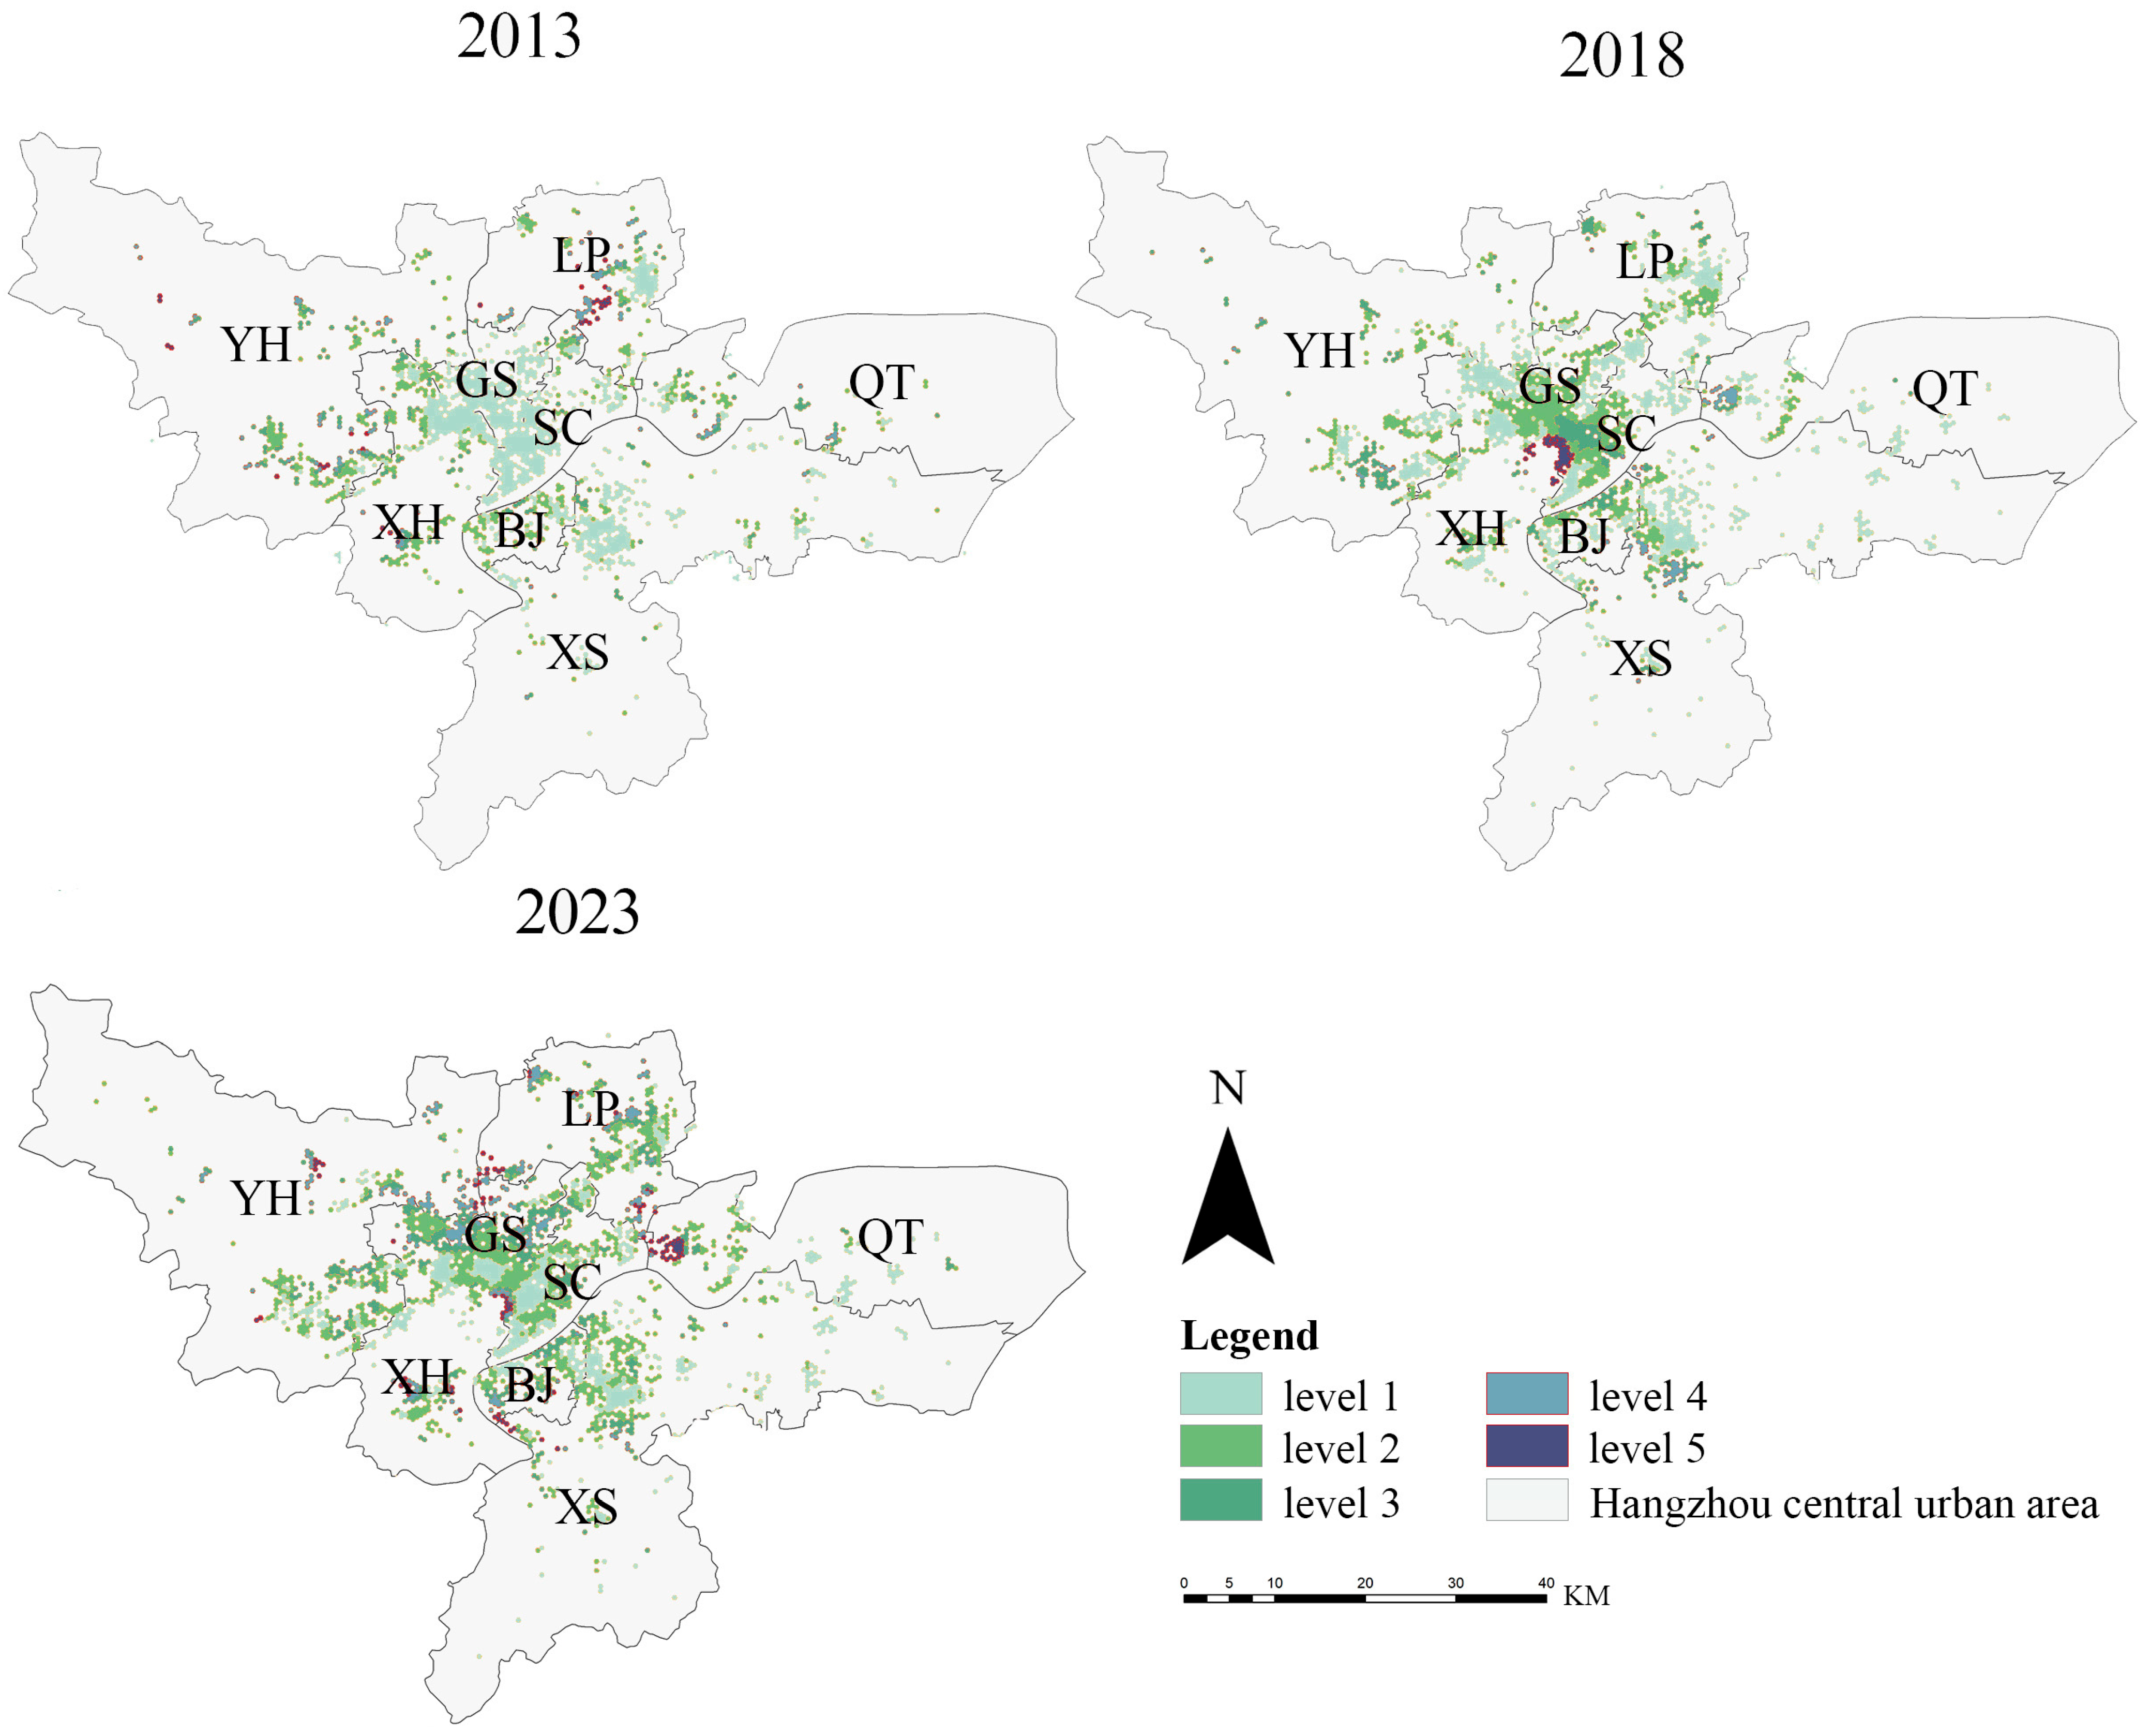
Following previous studies, the resulting accessibility indices were classified into five levels using the thresholds 0–1, 1–1.5, 1.5–2.5, 2.5–3.8, and ≥3.8, corresponding to Level 1 through Level 5, representing low, below-average, average, above-average, and high accessibility, respectively.
2.3.3. Measurement of GSE Visibility
The GVI is an important indicator for measuring urban three-dimensional greenery, and has been widely applied in recent years to assess urban greening levels. In this study, street view images were processed using the fully convolutional neural network DeepLabv3+ for semantic segmentation to extract green space–related pixel information. DeepLabv3+ has demonstrated stable and robust performance on mainstream benchmark datasets such as PASCAL VOC 2012 and Cityscapes, achieving pixel-level accuracies of 89.0% and 82.1% on their respective test sets, and has been widely applied in complex urban scene analysis [
21].
In practice, pretrained model parameters based on the ADE20K dataset were adopted. The ADE20K dataset contains more than 20,000 high-resolution images with 150 categories of pixel-level annotations, covering typical urban scene elements such as vegetation, roads, and buildings, and is characterized by high scene diversity and annotation accuracy [
22]. Benchmark evaluations indicate that leading models supported by this dataset exhibit strong performance in semantic segmentation tasks under complex scene conditions [
23].
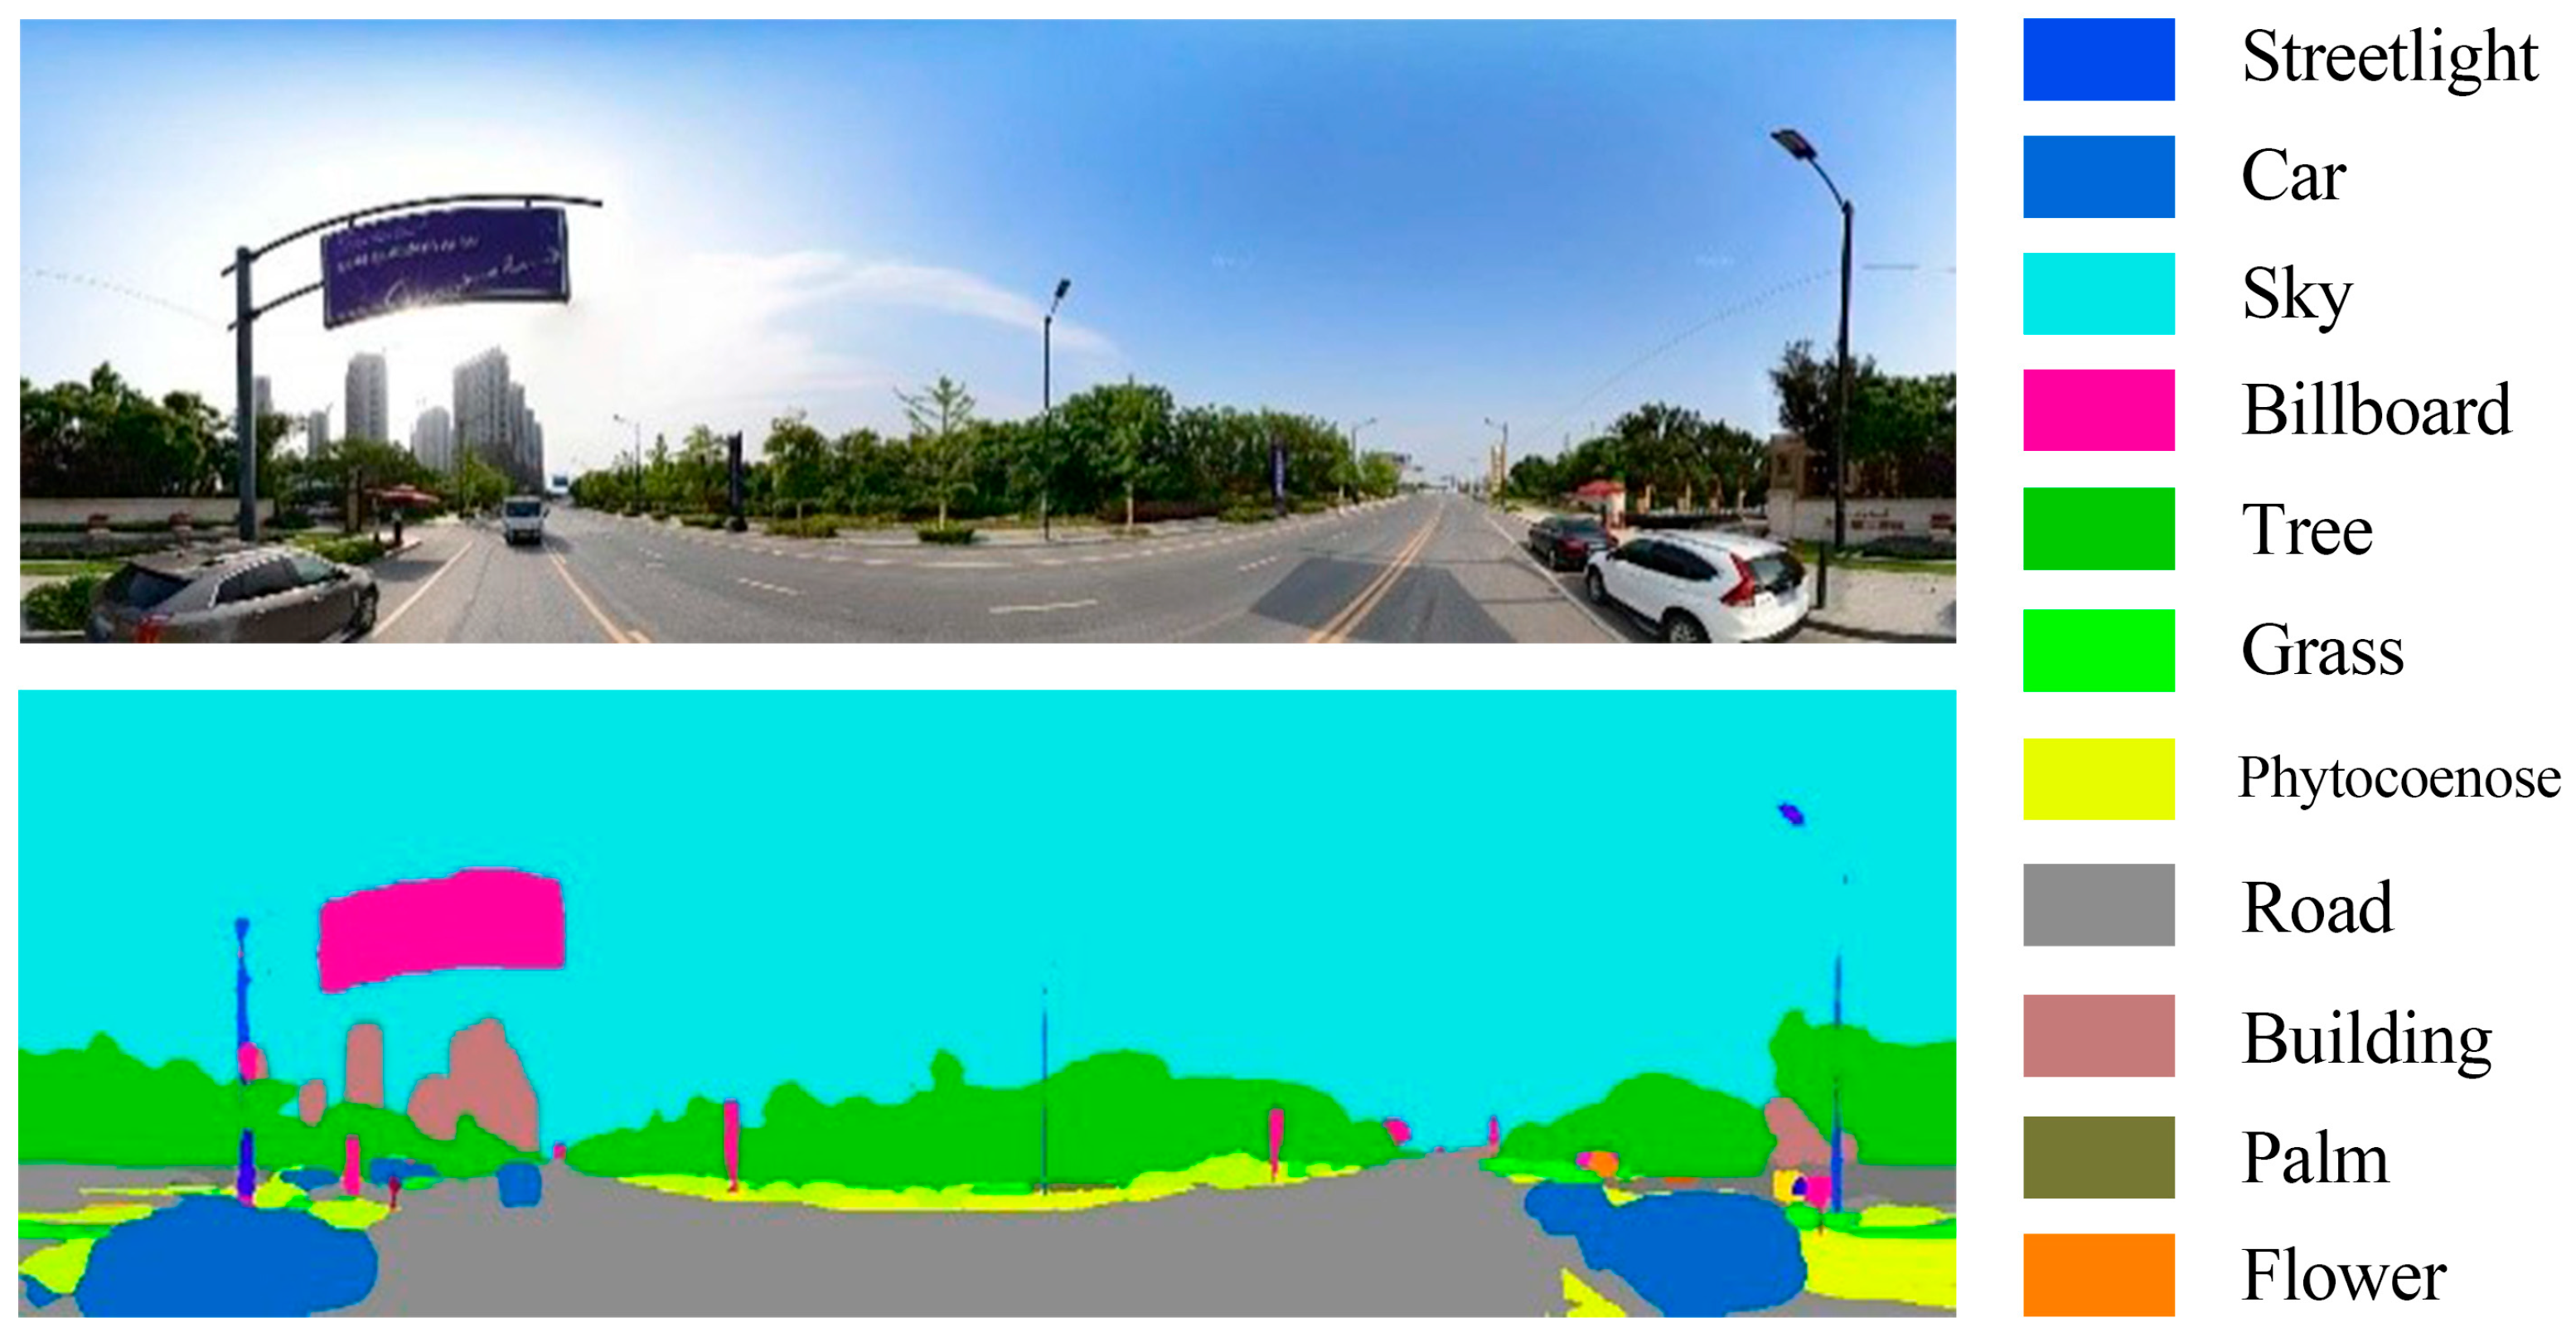
After semantic segmentation, different object types in the images were assigned distinct labels. Green elements visible to residents—including trees, grass, vegetation clusters, palm trees, and flowers—were identified and aggregated. The proportion of these green elements relative to all image elements was calculated to derive the GVI (
Figure 4).
It should be noted that this study did not conduct additional manual annotation or model retraining for street view images in the study area. Instead, the pretrained model was directly applied, a practice commonly adopted in existing studies that estimate GVI using street view imagery. Potential uncertainties associated with this approach are discussed in the limitations section.
With reference to previous studies [
20,
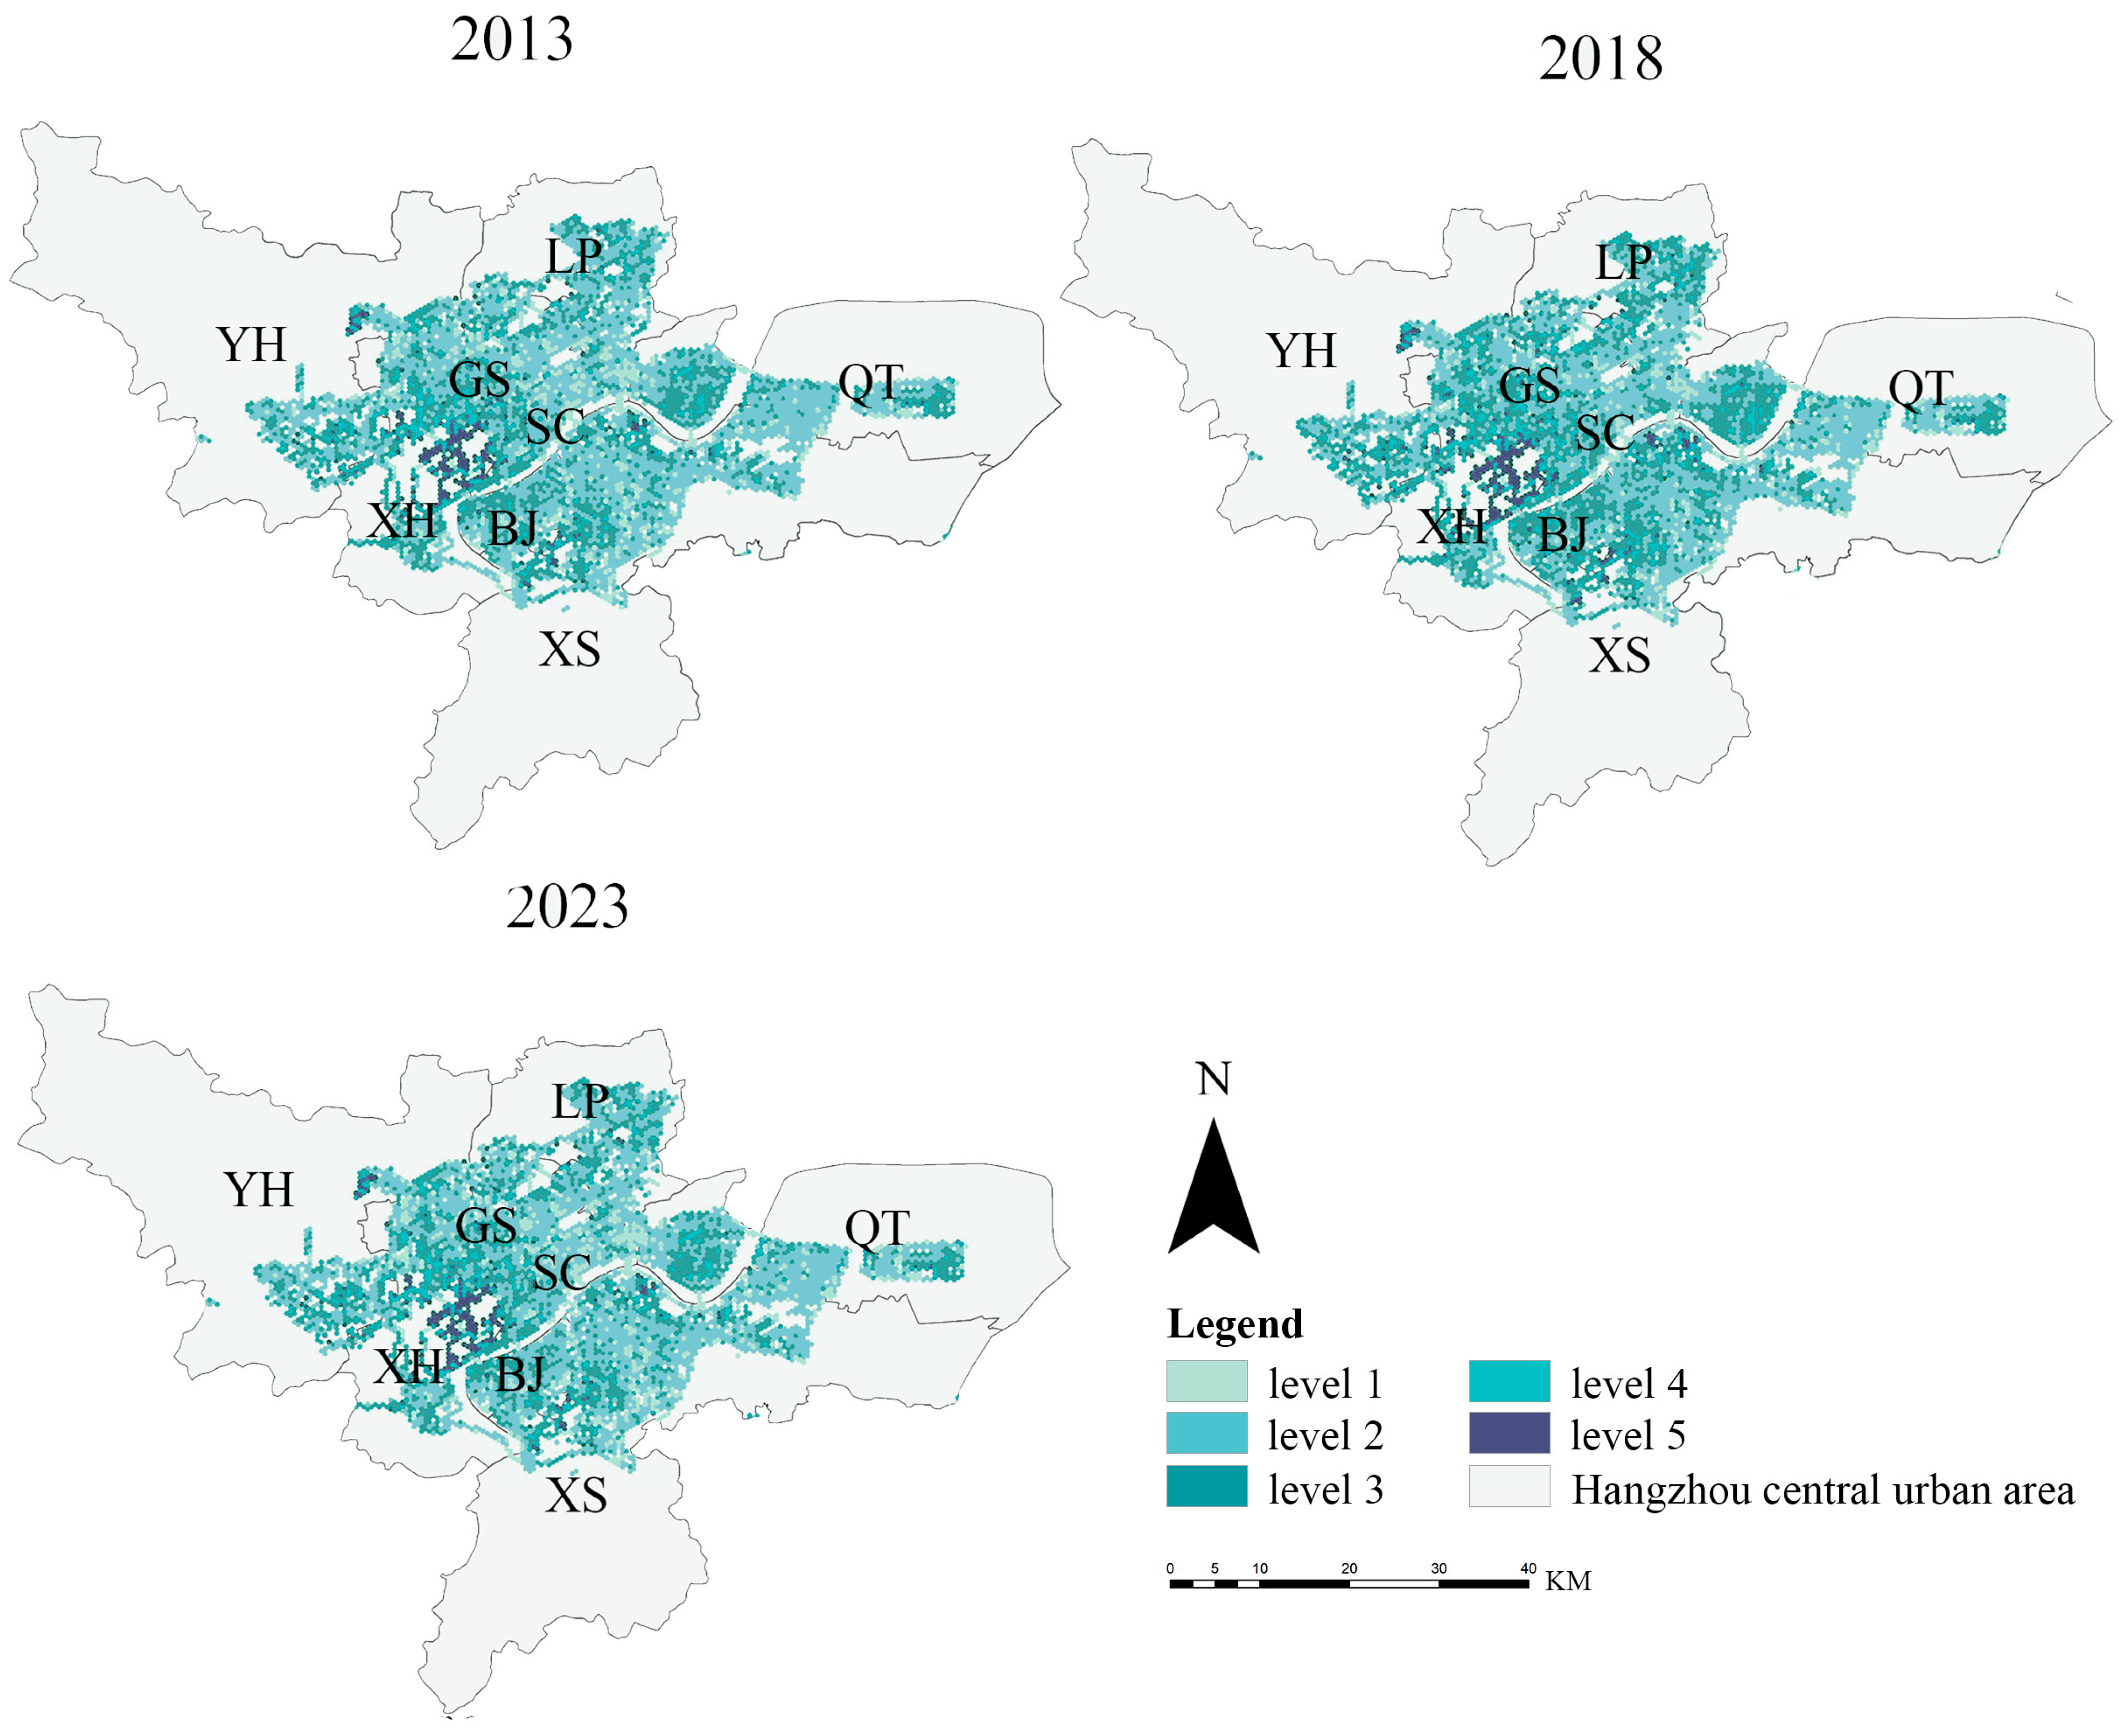
21], the calculated visibility results were classified into five categories based on ≤5%, 5%~15%, 15%~25%, 25%~35% and ≥35%,, corresponding to Level 1 through Level 5, where the intervals denote low, below average, average, above average, and high, respectively.
2.4. Gini Coefficient and Lorenz Curve
The Gini coefficient was originally developed to measure the equity of income distribution [
22], but in recent years, it has been widely extended to the field of environmental equity, where it is commonly used to assess the distributional fairness of public resources, particularly in evaluating the distributional fairness of GSE [
23,
24,
25]. One of its key advantages lies in its ability to capture overall inequality without relying on specific spatial form assumptions, making it applicable across different spatial scales.
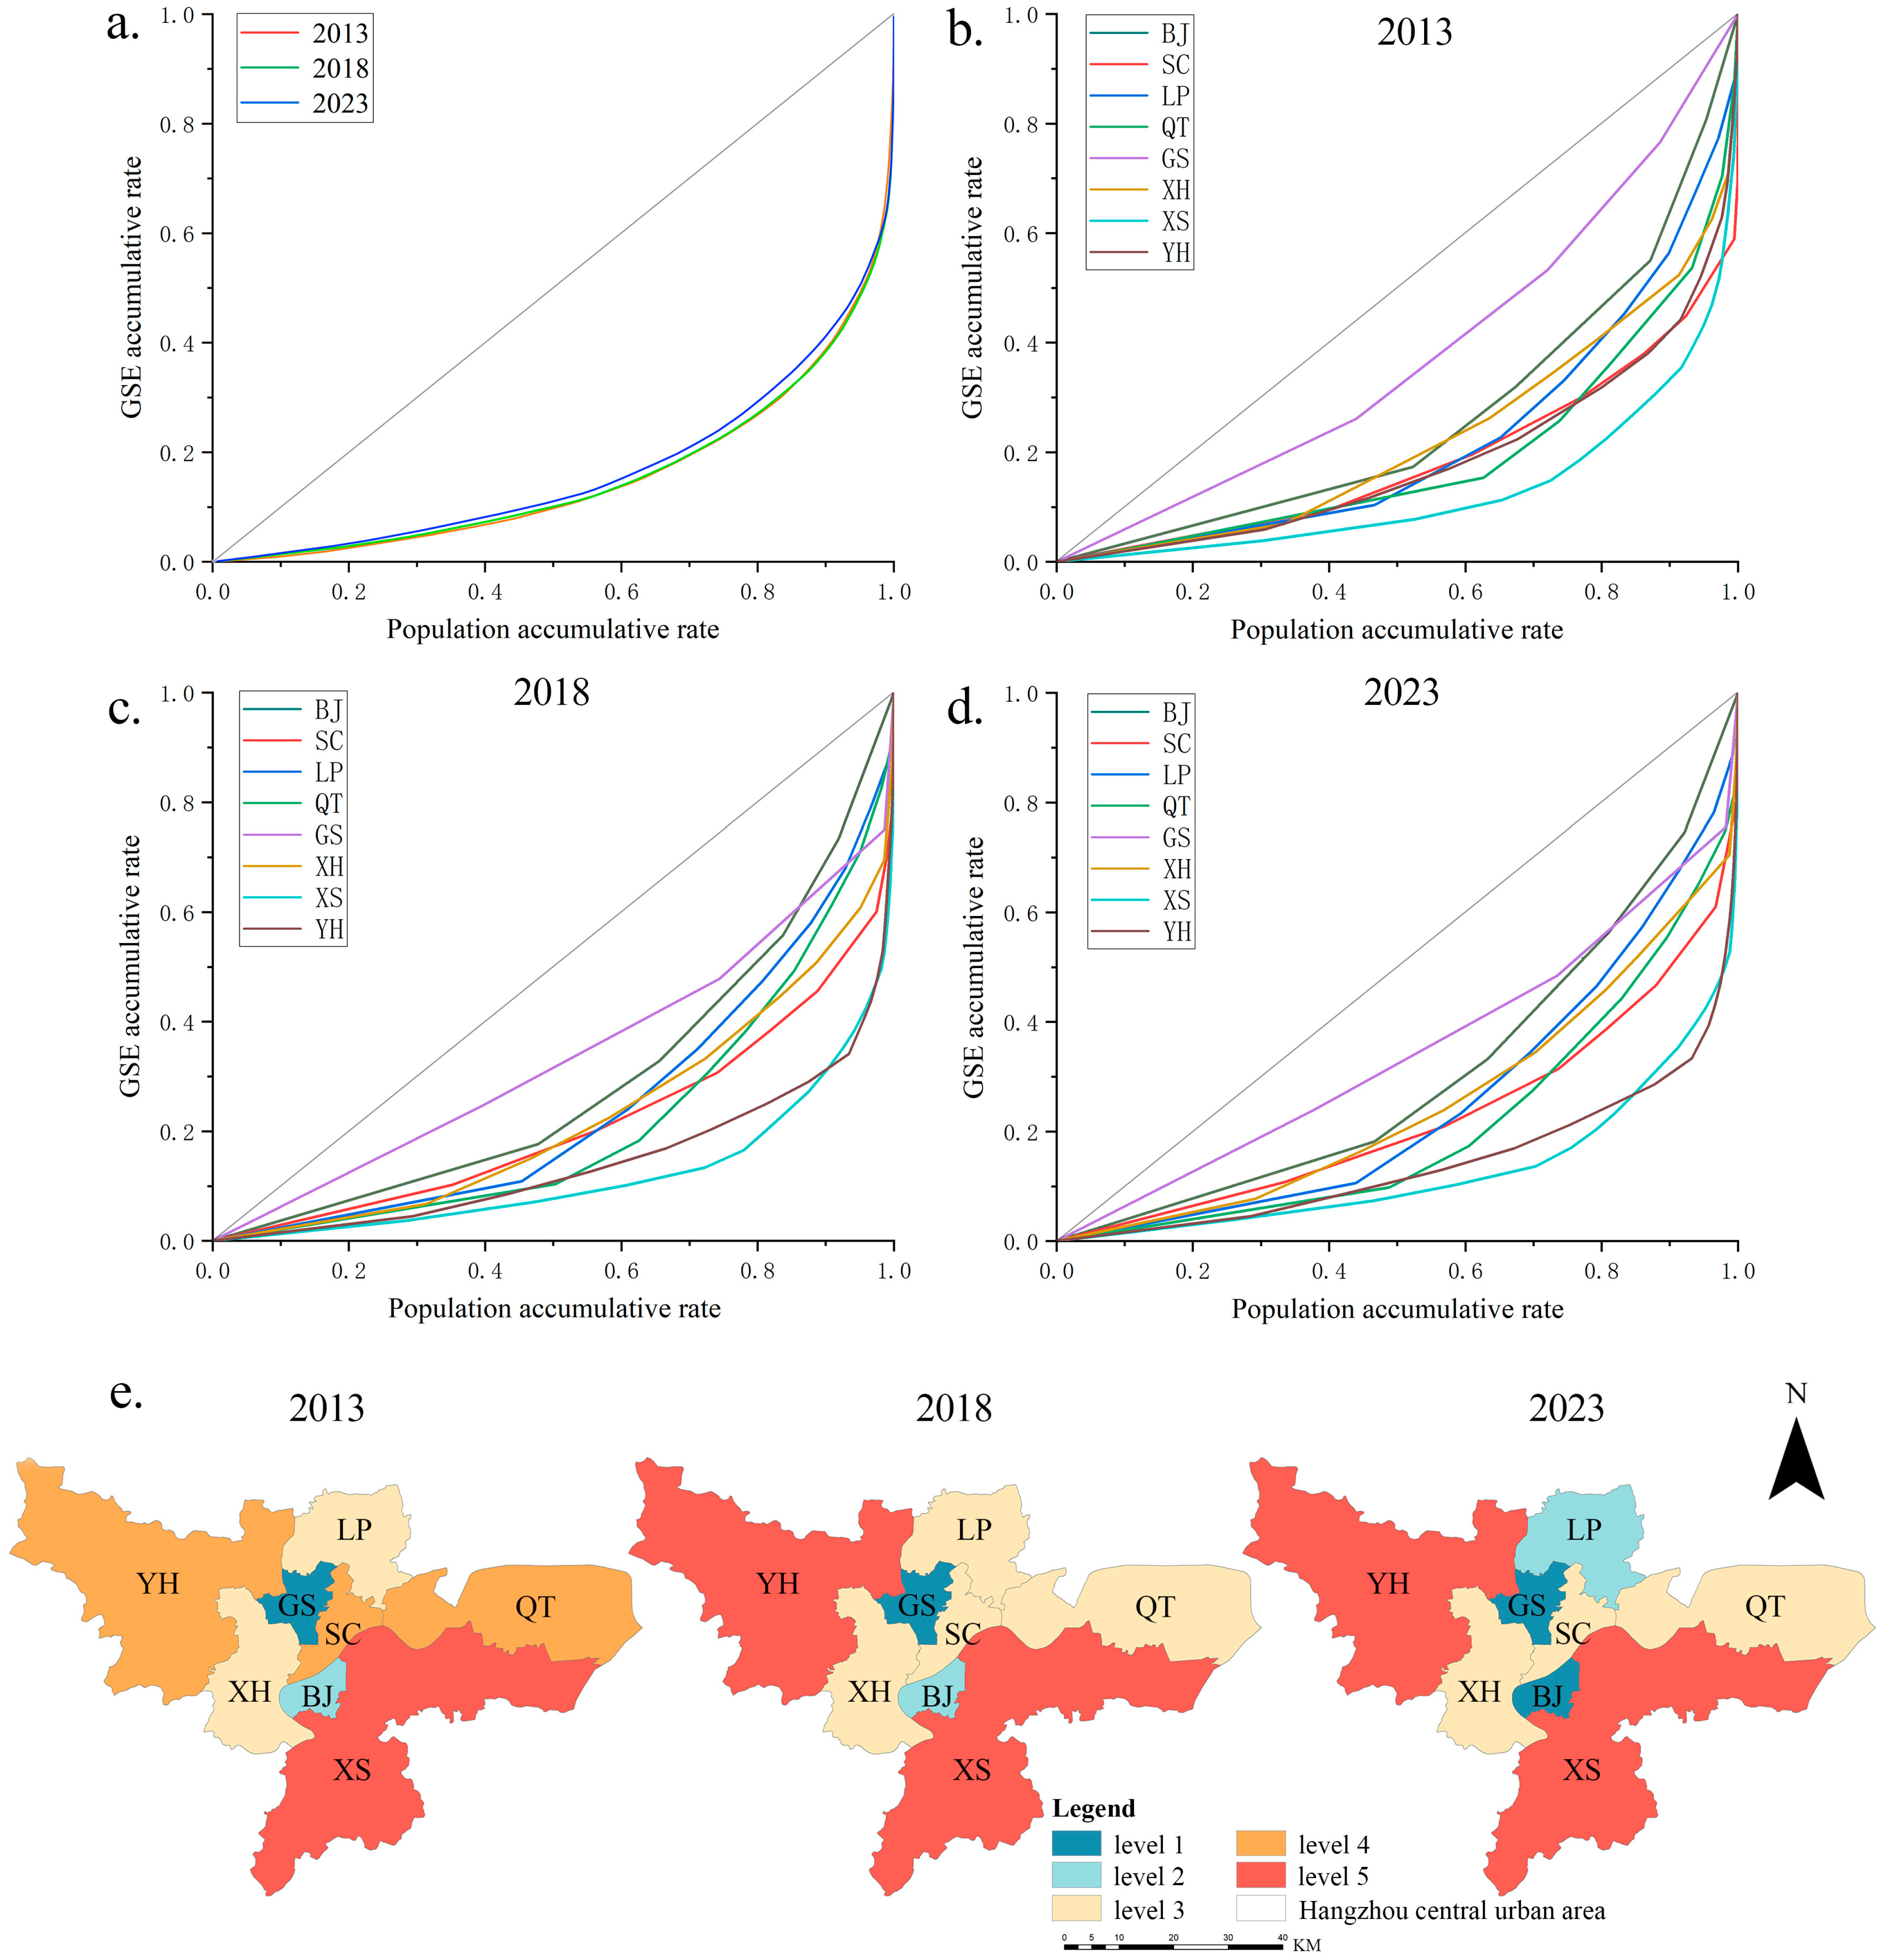
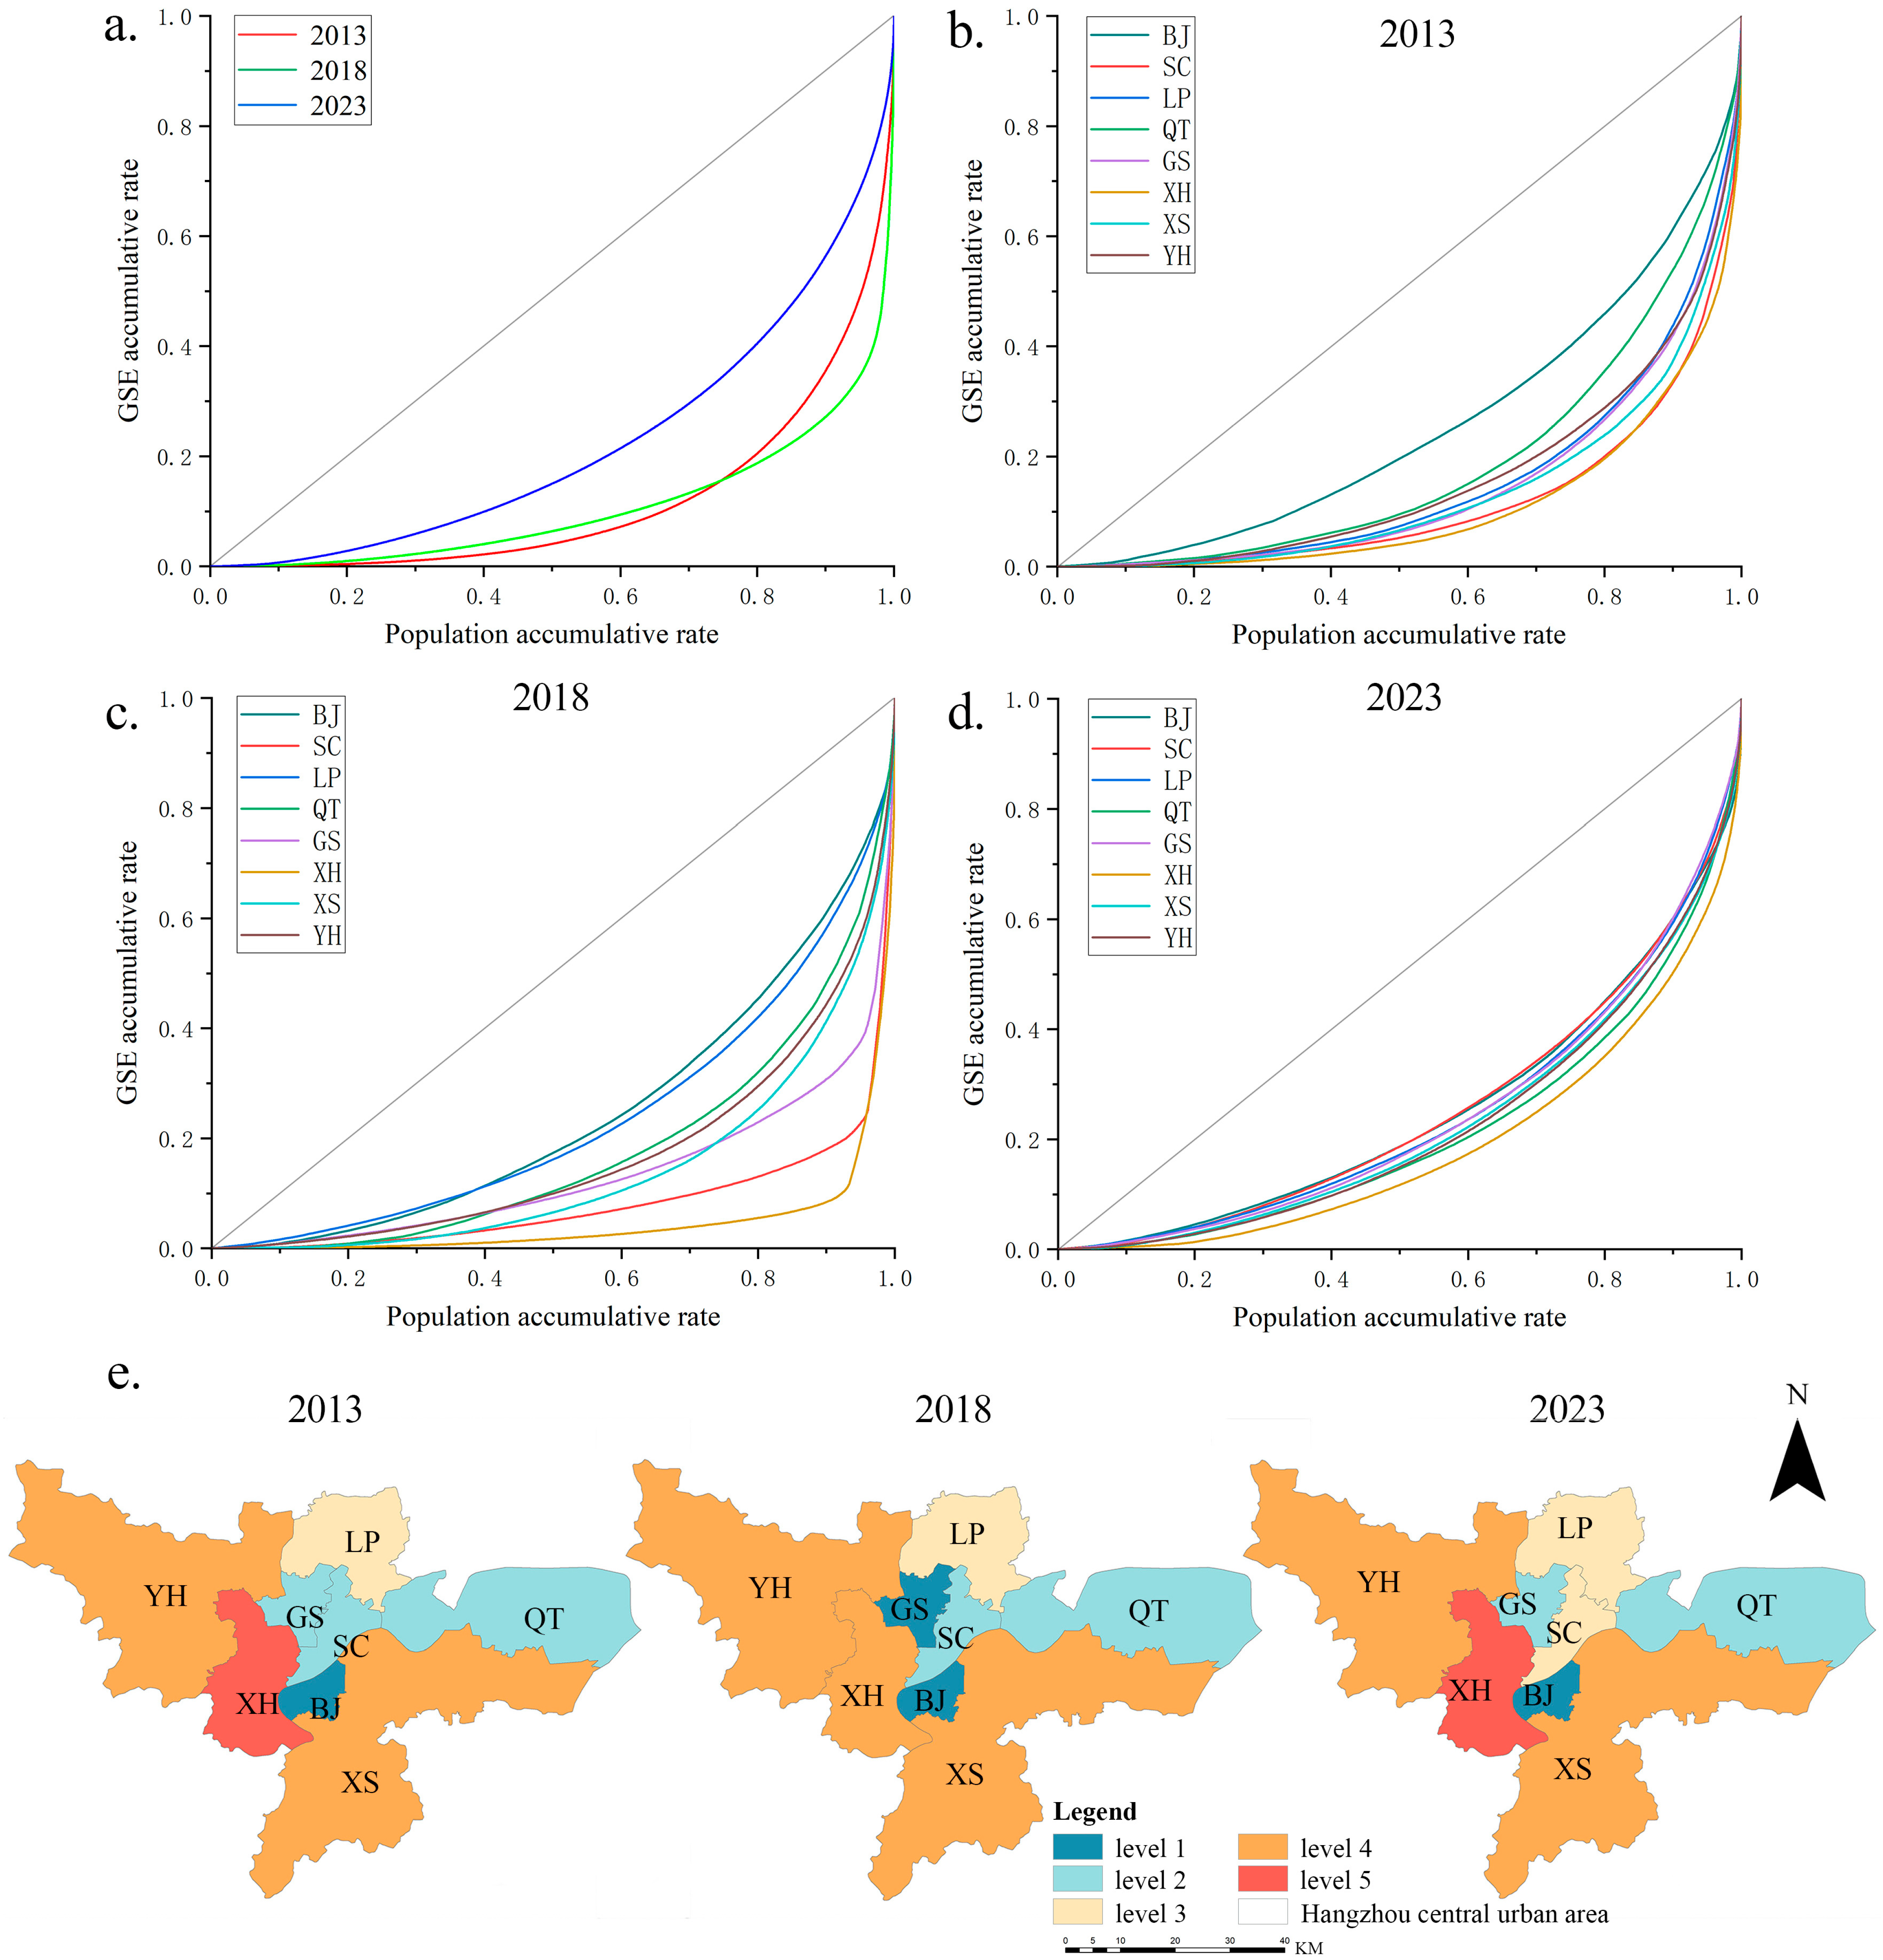
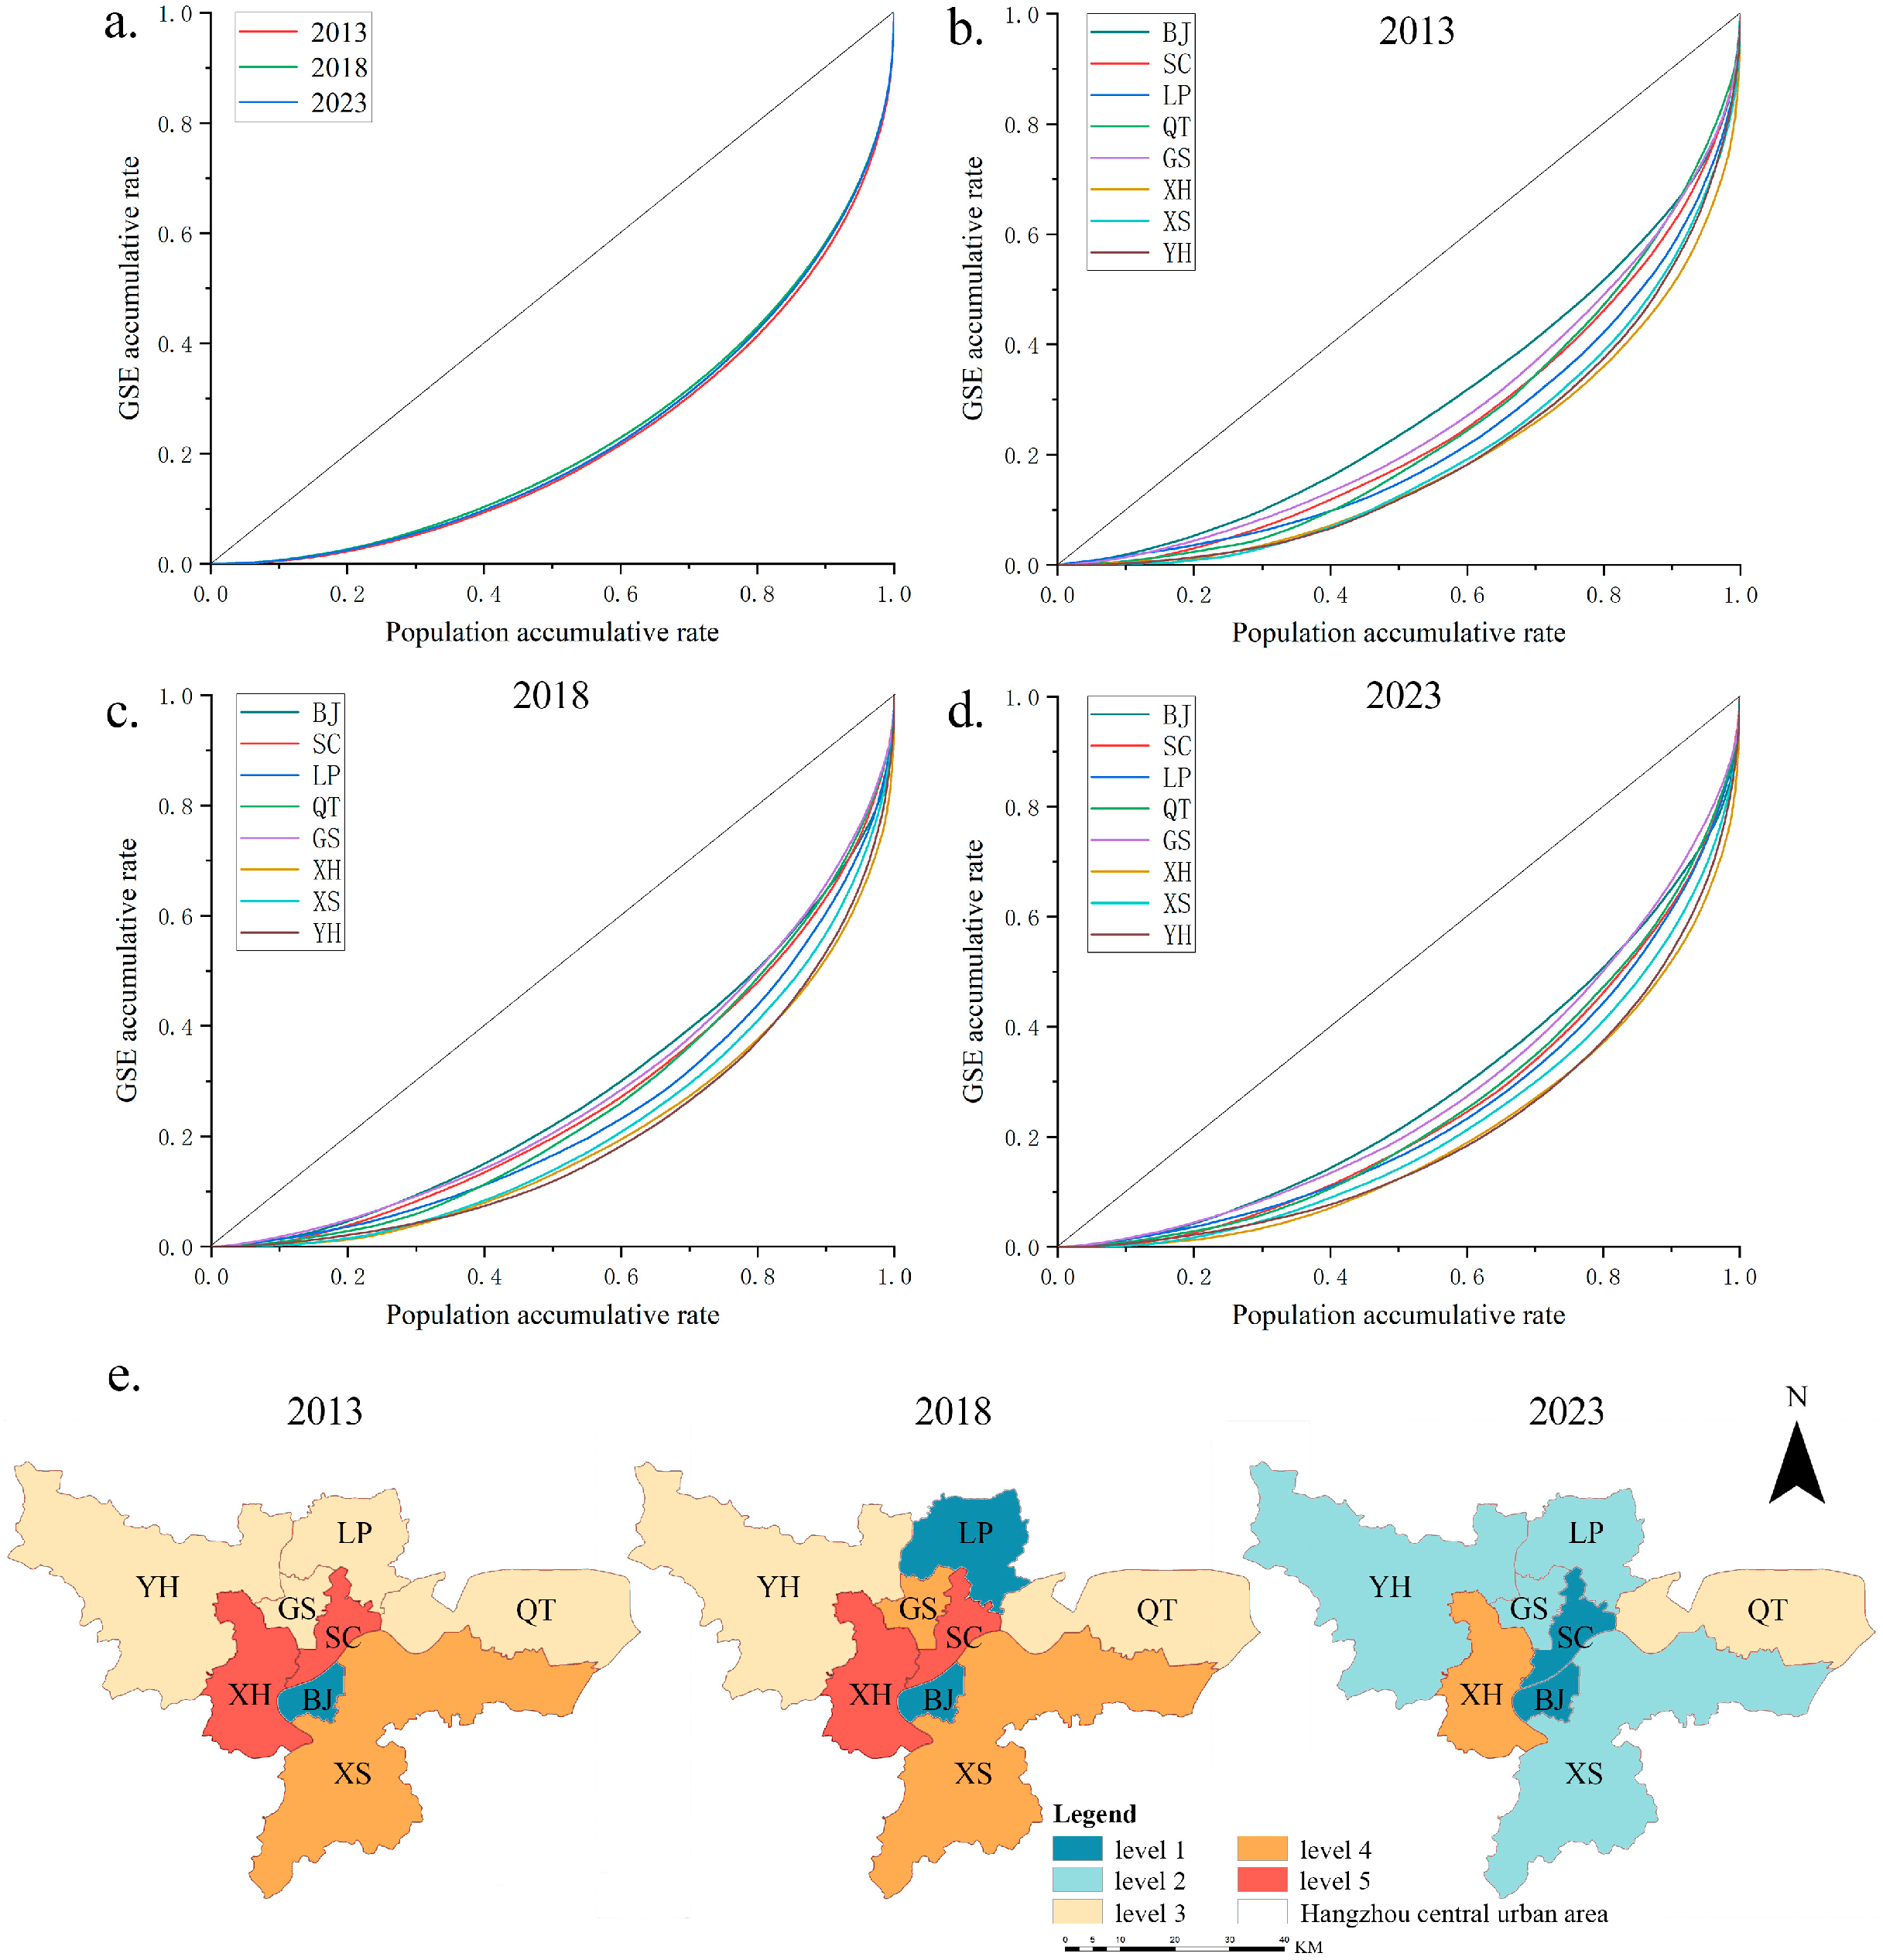
In this study, the Lorenz curve is used to illustrate the cumulative distribution of GSE across the residential population. The X-axis represents the cumulative percentage of the population, while the Y-axis represents the cumulative percentage of GSE enjoyed by the corresponding population.
The Gini coefficient is derived based on the curvature of the Lorenz curve. The greater the curve’s deviation from the 45-degree line of perfect equality, the higher the Gini coefficient, indicating a more unequal distribution of GSE resources. This deviation visually reflects the extent of inequity, and the corresponding Gini coefficient provides a quantitative measure of the degree of inequality. The Gini coefficient is calculated using the following formula:
In Equation (6), n represents the total population, ranked in ascending order based on their level of GSE; k ranges from 0 to n; is the cumulative proportion of the population, with = 0 and = 1; is the cumulative proportion of GSE received by the corresponding population, with = 0 and = 1. The area under the line of perfect equality and above the axes is 0.5, which serves as the normalizing constant for calculating the Gini coefficient.
According to international standards and conventions for the Gini coefficient [
8], its value ranges from 0 to 1, where 0 indicates perfect equality and 1 represents extreme inequality. In general: A Gini coefficient below 0.2 is considered absolutely equal; Between 0.2 and 0.3, it is considered relatively equal; Between 0.3 and 0.4, it is regarded as relatively reasonable; Between 0.4 and 0.5, it reflects a significant disparity; A Gini coefficient above 0.5 suggests severe inequality. In this study, these five ranges are further classified as Level 1 through Level 5, respectively.
2.5. Spatial Clustering Analysis
To further explore the spatial differentiation characteristics of GSE equity across different dimensions, this study further conducts spatial clustering analysis. Given that GSE equity is inherently multi-dimensional, a single indicator is insufficient to comprehensively capture the integrated disparities between areas. Therefore, it is necessary to identify spatial differentiation patterns from the perspective of multi-dimensional equity combinations.
Specifically, the natural breaks (Jenks) classification method is first applied to classify equity levels of GSE availability, accessibility, and visibility into five categories for each dimension. These levels, ranked from low to high, represent a transition from more unequal to more equitable distributions of GSE resources within each dimension. The Jenks method is well suited to environmental equity data with pronounced spatial heterogeneity, as it maximizes inter-class variance while minimizing intra-class variance.
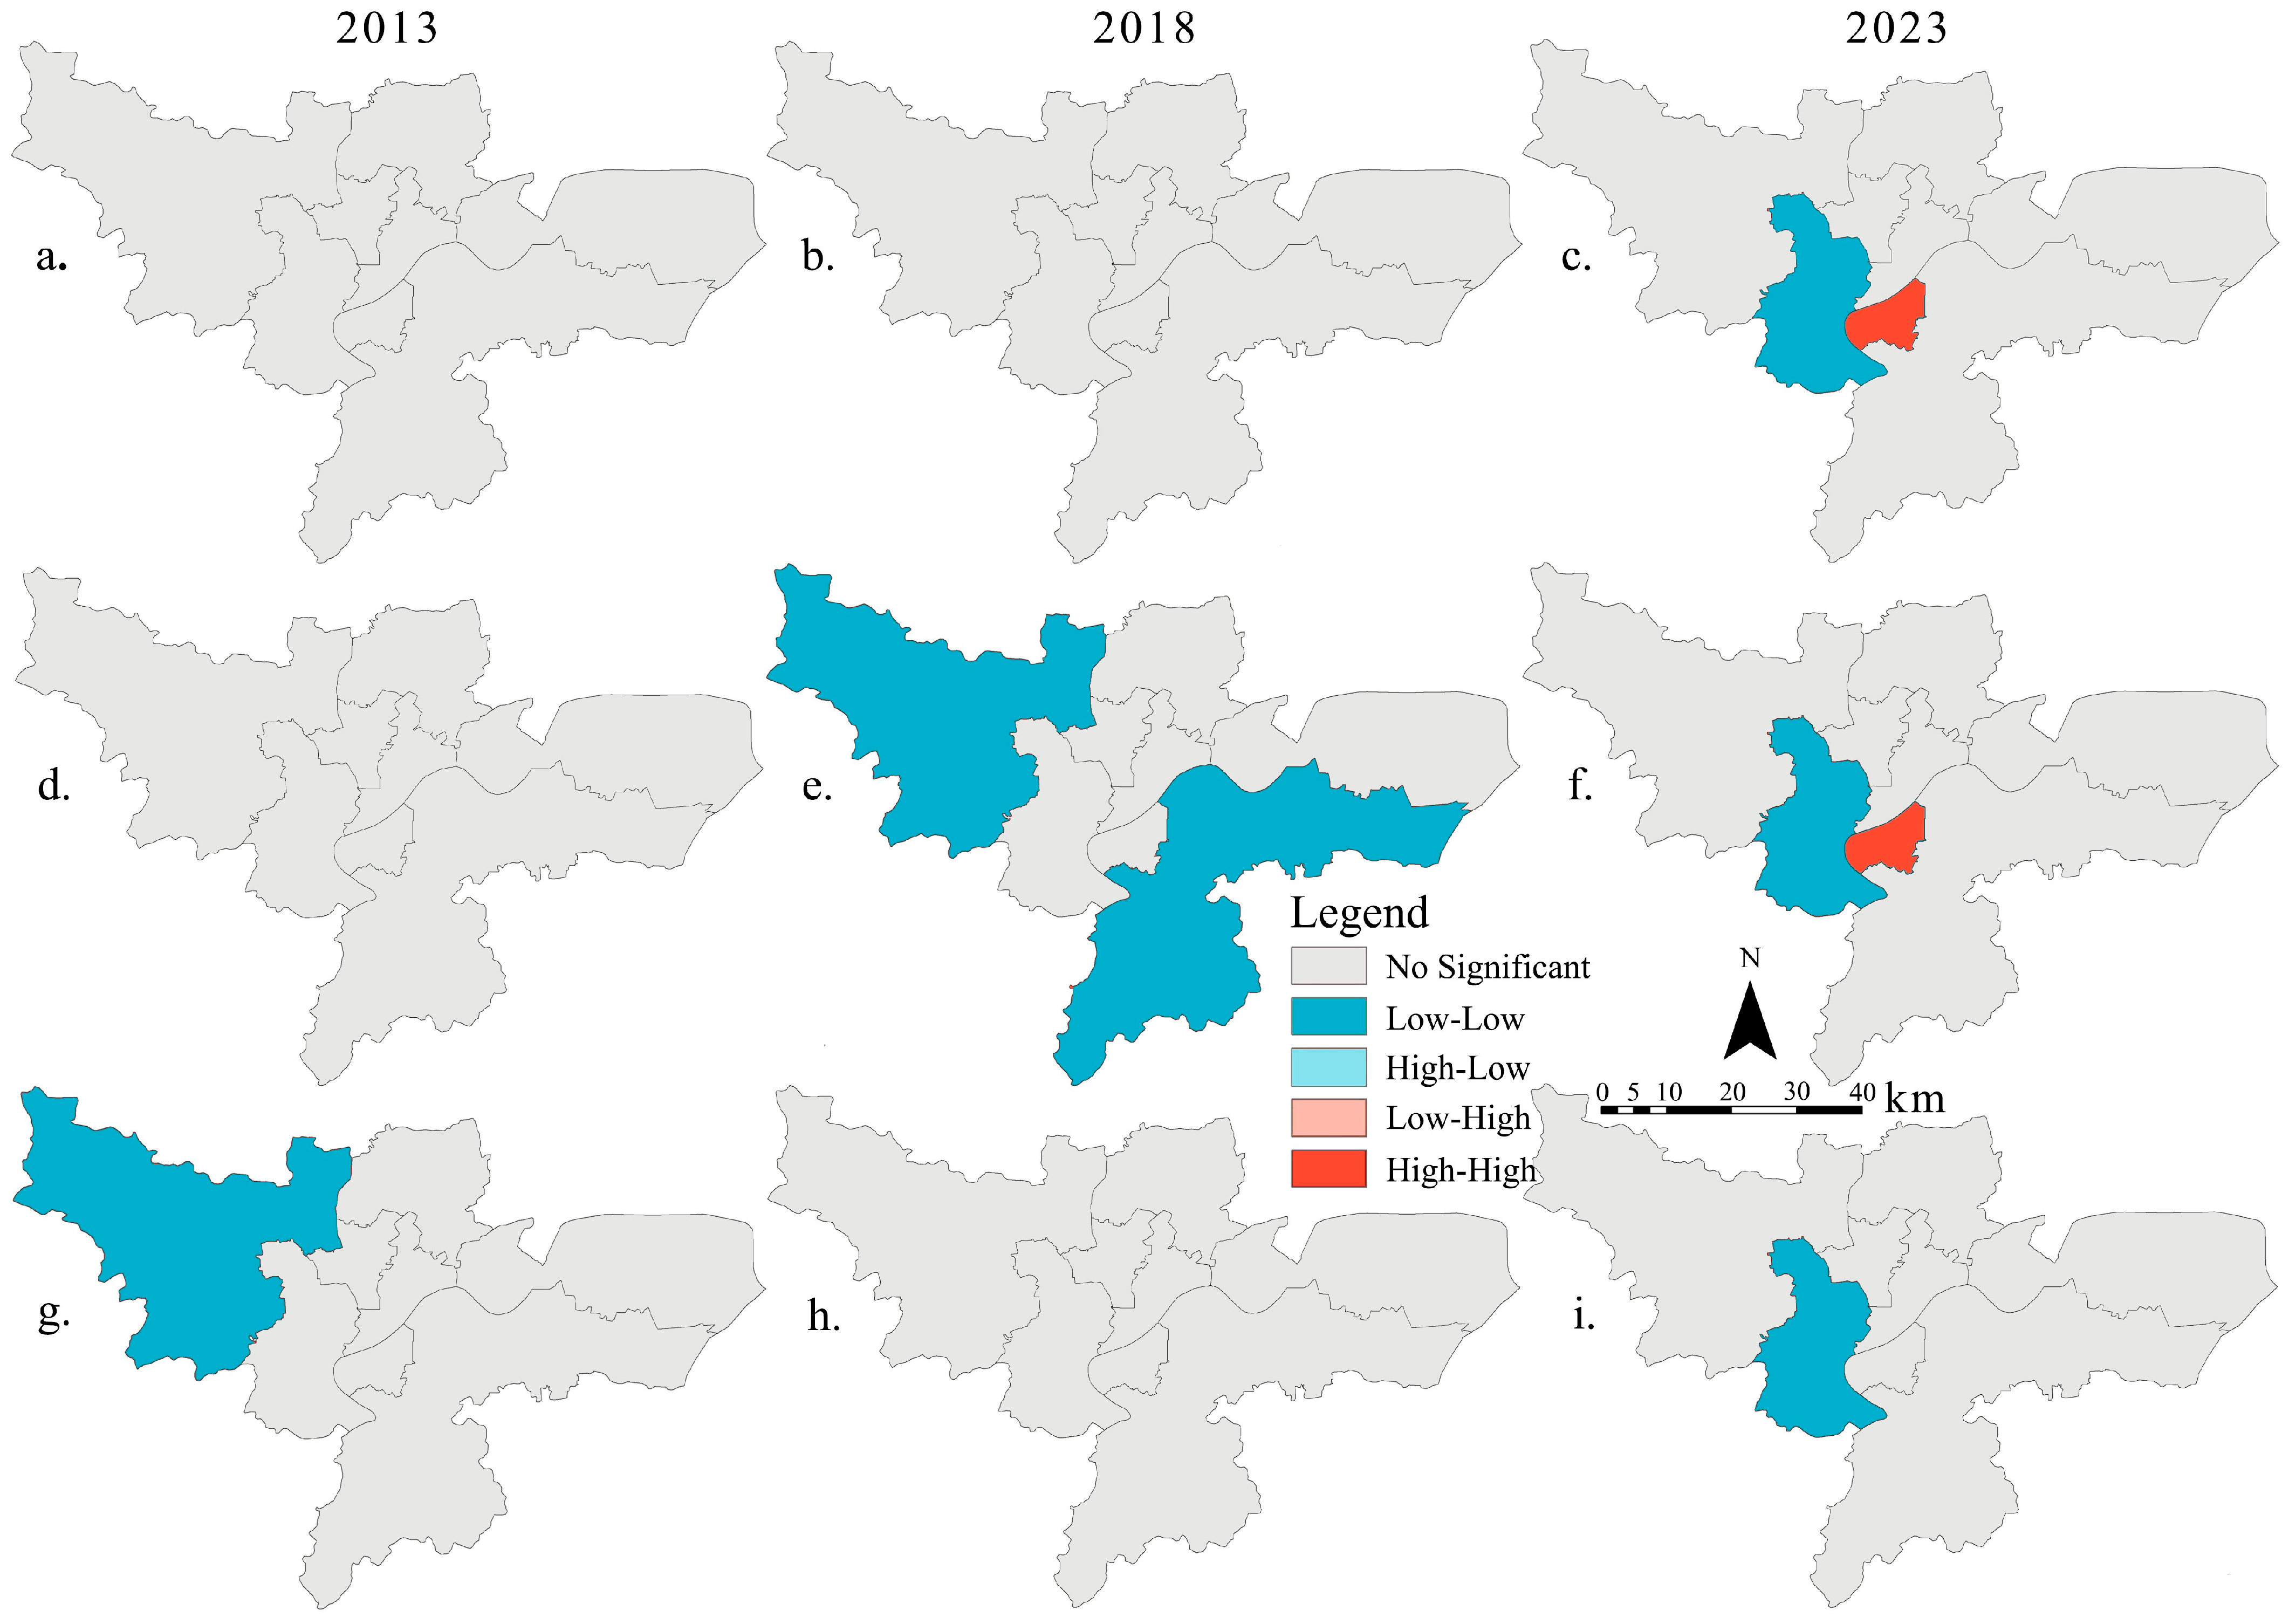
Based on this classification, pairwise combinations of different equity dimensions within the same time slice are conducted to identify spatial clustering types of multi-dimensional equity characteristics. Through this approach, twelve typical equity combination types are constructed, including:
(1) Availability–Accessibility combinations:
High availability equity–high accessibility equity; Low availability equity–low accessibility equity; High availability equity–low accessibility equity; Low availability equity–high accessibility equity.
(2) Availability–Visibility combinations:
High availability equity–high visibility equity; Low availability equity–low visibility equity; High availability equity–low visibility equity; Low availability equity–high visibility equity.
(3) Visibility–Accessibility combinations:
High visibility equity–high accessibility equity; Low visibility equity–low accessibility equity; High visibility equity–low accessibility equity; Low visibility equity–high accessibility equity.
Among these, the “high–high (H–H)” type indicates areas where GSE resources across different dimensions are relatively evenly distributed in spatial terms, whereas the “low–low (L–L)” type reflects areas characterized by compounded deficiencies in multi-dimensional GSE and represents potential clusters of GSE inequity. In contrast, the “high–low (H–L)” or “low–high (L–H)” types reveal structural imbalances between different dimensions, indicating that improvements in a single dimension do not necessarily lead to a synchronous enhancement of overall equity.
By analyzing the spatial distribution and temporal evolution of these equity combination types, this study further elucidates the spatial clustering characteristics and evolutionary trajectories of GSE equity in Hangzhou. The results provide a basis for identifying priority intervention areas and formulating differentiated green space optimization strategies.
Through this pairing and spatial analysis, the study aimed to capture the interrelationships and spatial heterogeneity among different dimensions of GSE equity, as well as their spatial clustering characteristics and evolutionary trajectories, offering a more comprehensive understanding of urban green space distribution justice and providing a basis for identifying priority intervention areas and formulating differentiated green space optimization strategies.
4. Discussion
4.1. Driving Mechanisms of Overall GSE Improvement and Causes of Spatial Inequality
This study finds that GSE in the central urban area of Hangzhou exhibited a sustained upward trend during the study period, with the most pronounced improvement observed in the accessibility dimension. However, this growth was not spatially uniform; instead, it displayed clear regional differentiation. This result indicates that improvements in GSE are not driven solely by the expansion of green space area, but are more fundamentally shaped by the combined effects of urban development strategies, land-use patterns, and the orientation of public investment.
At the national level, policies promoting new-type urbanization and Ecological Civilization have stimulated continuous increases in urban greening investment. At the local level, Hangzhou has adopted the “Park City” vision and systematically advanced the development of park systems and greenway networks, significantly enhancing residents’ opportunities to access green spaces on foot. This trend is consistent with findings reported by Wang et al. (2020) [
26] and Cao et al. (2022) [
27], who documented overall improvements in GSE across Chinese cities, further confirming the pivotal role of policy-driven interventions in enhancing GSE.
Nevertheless, the uneven spatial growth of GSE reflects substantial differences in land resource endowments and functional positioning across urban areas. Newly developed districts, characterized by relatively abundant land supply and greater planning flexibility, are better positioned to enhance GSE through the provision of new parks and green spaces. In contrast, older urban districts are constrained by high development intensity and rigid land-use structures, leaving limited room for green space enhancement and resulting in comparatively lagging improvements in GSE. While this “increment-oriented” greening pathway contributes to overall gains, it may also reinforce pre-existing spatial disparities. This spatial imbalance aligns with findings from a similar study conducted in Wuhan [
25].
4.2. Spatial Mechanisms of GSE Inequity and Planning Implications
Although overall GSE equity in Hangzhou improved during the study period, the magnitude of improvement remained limited for most dimensions except accessibility. This pattern suggests that gains in GSE equity have not progressed in tandem with overall increases in GSE, with the primary constraint stemming from supply–demand mismatches under conditions of rapid population concentration.
Previous studies have highlighted a structural contradiction common to Chinese cities, wherein the pace of green space expansion struggles to keep up with population growth (Huang et al., 2017 [
28]; Xie et al., 2023 [
29]). Despite substantial annual increases in green space provision during the study period, Hangzhou experienced sustained population inflows into its central urban areas, significantly diluting improvements in per capita GSE. This effect is particularly pronounced in older urban districts, where high population density combined with land scarcity further constrains the flexibility of public green space provision, thereby limiting the scope for equity improvement.
At the same time, functional differentiation across urban areas has intensified spatial mismatches in GSE allocation. Districts with high concentrations of educational, commercial, and administrative functions attract large permanent and transient populations but face difficulties in synchronously providing green spaces of corresponding scale. Conversely, some newly developed areas exhibit relatively favorable green space conditions but lower population intensity and utilization levels, resulting in a structural imbalance characterized by “green space surplus–demand deficit”. By shifting the analytical focus from single indicators to population–exposure relationships, this study extends previous approaches to green space equity assessment and underscores the necessity of evaluating equity from a resident-centered exposure perspective.
4.3. Formation Mechanisms of Different GSE Equity Types and Policy Implications
This study further reveals pronounced spatial differentiation among different dimensions of GSE equity, with Low–Low clusters emerging as the most prominent and spatially stable pattern across all three dimensions. This finding indicates that GSE inequity exhibits a distinctly structural character within urban space, rather than arising from random spatial variation.
Low–Low clusters are closely associated with historical land-use patterns and infrastructure configurations. In older urban areas, early planning stages placed limited emphasis on green space provision, while road spaces were predominantly designed to prioritize motorized traffic, restricting opportunities for street greening and improvements in pedestrian-accessible green spaces. In addition, some industry-oriented districts have deprioritized the provision of livability-oriented public spaces due to their functional positioning. Similar path-dependent effects have also been identified in Wu et al.’s (2022) study of Shenzhen [
30].
The pronounced clustering of “low visibility–low accessibility” equity further highlights the critical role of street space in shaping GSE equity. Compared with centralized parks, street greenery and green exposure along daily travel routes exert a more direct influence on residents’ everyday experiences. When street design prioritizes vehicular efficiency, GSE is constrained both visually and behaviorally, resulting in stable zones characterized by low exposure and low equity.
By contrast, spatial matching between availability-based equity and other dimensions is generally weaker and lacks long-term stable clustering patterns, reflecting fundamental differences in the underlying formation mechanisms of GSE dimensions. Availability is more strongly dependent on the city’s natural ecological base and land-use structure, whereas accessibility and visibility are more directly influenced by transportation systems and street-space design. This lack of coordinated evolution across dimensions further demonstrates that single indicators are insufficient for capturing the complex realities of GSE equity in cities.
Accordingly, differentiated planning strategies are required for different types of inequitable areas. For stable Low–Low clusters, priority should be given to improving daily exposure through enhanced street greening, optimization of slow-mobility systems, and the embedded development of pocket parks. For newly developed areas, GSE equity indicators should be incorporated into land-use and transportation system design at early planning stages to prevent the emergence of structural inequities.
5. Conclusions
5.1. Main Findings and Research Contributions
By integrating multi-temporal remote sensing imagery, street-view big data, and population data, this study systematically examined the spatiotemporal evolution of GSE (GSE) and its equity in the central urban area of Hangzhou from 2013 to 2023. The main findings are summarized as follows:
(1) During the study period, overall GSE in Hangzhou exhibited a sustained upward trend, with accessibility showing the most pronounced improvement. This indicates that policy-oriented greening practices centered on park development and the expansion of green space networks have been effective in enhancing residents’ opportunities for green space contact.
(2) The growth of GSE displayed significant spatial unevenness. Areas with higher growth were mainly concentrated in regions with relatively abundant ecological resources or lower development intensity, whereas densely built-up areas and industry-oriented districts experienced more limited improvement. This suggests that expansion models driven primarily by land supply and functional zoning are insufficient to simultaneously mitigate intra-urban disparities in GSE.
(3) Although overall equity in GSE improved to some extent, the magnitude of improvement remained limited, with only accessibility-based equity exhibiting a substantial enhancement. This reflects the persistence of structural mismatches between population concentration and green space provision under rapid urbanization.
(4) Different dimensions of GSE equity demonstrated markedly differentiated spatial patterns and evolutionary trajectories. In particular, Low–Low clusters characterized by low availability, low accessibility, and low visibility showed strong spatial stability, indicating the long-term existence of structurally disadvantaged greening areas within the city.
(5) By integrating availability, accessibility, and visibility dimensions, this study developed a multidimensional and time-series-based framework for assessing GSE equity. This framework provides methodological support and empirical evidence for identifying urban greening blind spots, optimizing green space spatial allocation, and promoting inclusive urban planning.
5.2. Limitations and Future Directions
Despite integrating multi-source, time-series remote sensing and street-view data to systematically characterize the spatiotemporal evolution of GSE and its equity in Hangzhou from the perspectives of availability, accessibility, and visibility, this study has several limitations that warrant further investigation.
First, at the data level, population distribution was primarily represented using residential address point data obtained from real estate platforms. While this approach captures the general spatial pattern of residential population, it does not explicitly account for housing vacancy rates or variations in actual occupancy intensity. In newly developed or investment-oriented areas in particular, high vacancy rates may lead to overestimation of population size, thereby underestimating per capita GSE and affecting the accuracy of equity measurements. Future studies could integrate census data, mobile signaling data, or nighttime light data to dynamically adjust population distributions and assess the impacts of such systematic biases through scenario analysis or sensitivity testing.
Second, in the measurement of accessibility, this study adopted a Gaussian two-step floating catchment area (2SFCA) method with a fixed distance threshold and decay function parameters based on local planning standards. While this policy-consistent parameterization enhances interpretability and comparability, accessibility outcomes may still be sensitive to alternative choices of catchment size or decay settings. Future research could conduct systematic sensitivity analyses across multiple distance thresholds and decay parameters to further assess the robustness of accessibility and equity estimates.
Third, regarding street-view data and semantic segmentation methods, although the DeepLabv3+ model employed in this study was pre-trained on well-established datasets such as ADE20K and has been widely validated across various urban contexts, no additional manual annotation was conducted to verify segmentation accuracy for the study area. Moreover, due to constraints in the availability of historical street-view imagery, inconsistencies in acquisition timing and update frequency across different years may introduce uncertainty into GVI estimation. Future research could improve robustness by constructing small-scale manually labeled samples or applying multi-model comparison approaches to validate semantic segmentation results.
Fourth, in terms of analytical scope, this study primarily focused on the supply-side characteristics of GSE and its spatial equity, while individual-level differences and actual usage behaviors were not explicitly examined. Residents with different age structures, income levels, or travel modes may exhibit substantially different demands for and interactions with green spaces, yet such socioeconomic factors were not fully incorporated into the current framework. Future studies could integrate socioeconomic statistics or survey data to deepen the interpretation of GSE inequities from the perspectives of environmental justice and health equity.
Finally, regarding spatial scale and generalizability, this study focused on the central urban area of Hangzhou as a case study, and its findings are influenced to some extent by the city’s development stage, planning institutions, and natural geographic conditions. Future research could extend this multidimensional GSE equity framework to other types of cities through cross-city comparisons or multi-case studies, in order to identify both common patterns and contextual differences in GSE inequities. In addition, alternative equity indicators and evaluation methods could be explored to develop a more robust and generalizable assessment system for urban GSE equity.