1. Introduction
The presence of pesticide micropollutants, known as emerging contaminants, in surface waters and treated wastewater poses a global ecological and health challenge. Contemporary agricultural intensification is associated with the massive use of agrochemicals, among which neonicotinoids, a group of potent systemic insecticides with neurotoxic effects, play a particularly important role [
1,
2,
3,
4]. This family of substances, and specifically the chloronicotinoid subgroup (often also classified as nitroguanidine compounds), includes imidacloprid (IM), which for years was one of the most widely used plant protection products in the world [
2,
3].
Imidacloprid was the first neonicotinoid registered by the US EPA as a pesticide, and since its introduction in 1992, its use has increased year on year, becoming one of the world’s best-selling pesticides in 2001–2002 [
5]. The environmental problem associated with IM results from its unique physicochemical properties: high solubility in water and low adsorption capacity in soils with low organic matter content, which translates into a very high mobility of the substance [
2,
6]. At the same time, this property poses a high risk of IM leaching into groundwater and surface water, where its concentrations regularly exceed ecotoxicological safety thresholds [
6]. Additionally, IM is characterized by significant durability—in the soil environment, its half-life can exceed 1000 days, which leads to dangerous accumulation of sewage sludges when used repeatedly [
7]. Furthermore, the data indicate that the presence of IM was detected in sunflower grown in soil contaminated with residual IM even after two growing seasons, indicating the long-term availability of the compound for uptake by plants grown in subsequent years [
8]. The greatest threat, however, is the extreme toxicity of IM to non-target organisms, especially pollinators [
9]. Commission Implementing Regulation (EU) 2018/783 of 29 May 2018 amending the conditions of approval of the active substance imidacloprid limits its use to crops in permanent greenhouses [
10,
11].
Currently used conventional wastewater treatment methods are insufficient to remove IM. To address these limitations and simultaneously utilize the properties of IM’s easy solubility and migration in the aquatic environment, it seems reasonable to use phytoremediation methods to purify water, wastewater, and soil from neonicotinoid residues. Phytoremediation is a technology that uses plants to remove or neutralize pollutants in soil and water. It encompasses several mechanisms: phytoextraction, phytostabilization, phytovolatization, rhizofiltration, and phytodegradation. The effectiveness of each mechanism depends on the plant species, soil conditions, and the characteristics of the pollutant [
12,
13]. A key advantage of this technology is its low cost compared to physicochemical methods, which, in addition to high operating costs, are characterized by a destructive impact on soil structure and the generation of secondary contaminant streams. In this context, phytoremediation emerges as a highly sustainable, green, and economically viable alternative in situ technology. In the case of organic pollutants, phytodegradation (metabolization of the compound by plant enzymes into less toxic metabolites) and phytostabilization and rhizosphere biodegradation (phytostimulation) are particularly important, limiting the contaminant’s mobility in the soil profile and its migration to groundwater while simultaneously stimulating the enzymatic and metabolic activity of soil microorganisms through root exudates [
14]. Microorganisms inhabiting the rhizosphere are of great importance here, including those belonging to PGPR/PGPF (plant growth-promoting bacteria/fungi), which include
Pseudomonas,
Bacillus and fungi [
4]. Phytoremediation methods have been successfully used to remove neonicotinoids, including IM, using plant species such as
Plantago major L.,
Cyperus alternifolius and
Cyperus papyrus [
15,
16].
Rapeseed is one of the plants used in phytoremediation and is widely used as a model plant in phytoremediation research, primarily due to its agronomic characteristics: rapid growth, high above-ground biomass production, and tolerance to stress conditions. Although it is not a hyperaccumulator, its high biomass production brings its total biomass accumulation capacity close to that of hyperaccumulators. Additionally,
Brassicaceae plants are distinguished by their ability to synthesize glutathione and phytochelatins, which support their growth under pollution-induced stress [
17]. The research conducted so far on the use of
Brassica napus L. in environmental clean-up processes focuses almost exclusively on the phytoremediation of soils contaminated with heavy metals [
18,
19,
20]; however, significantly less attention has been paid to this species’ ability to absorb, translocate, and metabolize organic pollutants, including pesticide residues. An additional argument for the use of rapeseed in research is the energy potential of rapeseed biomass, distinguishing it from many other species tested in the phytoremediation of organic pollutants, which is consistent with the circular economy [
21,
22,
23].
Implementing phytoremediation technologies in degraded areas or under model conditions often faces a significant barrier in the form of extremely unfavorable physicochemical properties of the substrate. A key solution to this problem is bioaugmentation of the substrate through the application of exogenous organic matter in the form of stable compost produced from municipal sewage sludge. Compost is a rich source of stable organic carbon, humic substances (humic and fulvic acids), and essential nutrients (N, P, K, Mg), which improve substrate structure, aeration, and water retention, thus promoting plant growth, stimulating root system development, and enhancing microbial activity [
24]. Furthermore, by providing microorganisms with nutrients, compost contributes to the growth of soil microbial populations, which is crucial for the biodegradation of organic pollutants. The literature on the remediation of pesticide-contaminated soils indicates that additives such as compost or manure increase the rate and scope of biodegradation by introducing microorganisms and the carbon and energy needed for their metabolism, including co-metabolism processes additionally supported by plant root exudates [
25,
26]. It is worth mentioning that the organic matter of compost increases the sorption capacity of the substrate towards organic compounds [
27]. The combination of these mechanisms makes compost a practical and inexpensive tool for increasing the effectiveness of phytoremediation, where organic additives consistently improved both the plant condition and the rate of pollutant removal from the substrate [
28].
Soil microorganisms and enzymes are considered the fastest bioindicators of changes occurring under the influence of chemical stress and agrotechnical treatments, because they respond to disturbances in the soil environment much faster than physicochemical parameters [
29]. Among the enzymatic indicators, the activity of dehydrogenases (DHAs) is of particular importance, reflecting the general respiratory activity of living cells of microorganisms and being one of the most sensitive parameters to the presence of neonicotinoids, as is the activity of β-glucosidase, which is related to the carbon cycle in the soil and the mineralization of organic matter [
30,
31,
32]. In the microbiological layer, it is important to analyze the number of bacteria and mold fungi as a measure of the pressure exerted by IM and the mitigating effect of compost, with a special role played by bacteria of the
Pseudomonas genus, belonging to the rhizosphere plant growth-promoting bacteria (PGPR) and capable of participating in the biodegradation of xenobiotics [
33]. Archaea—a group that is rarely included in standard culture analyses—also play a significant role in soil functioning (including in the nitrogen cycle) and show clear sensitivity and metabolic activity in conditions of chemical and pesticide contamination [
34].
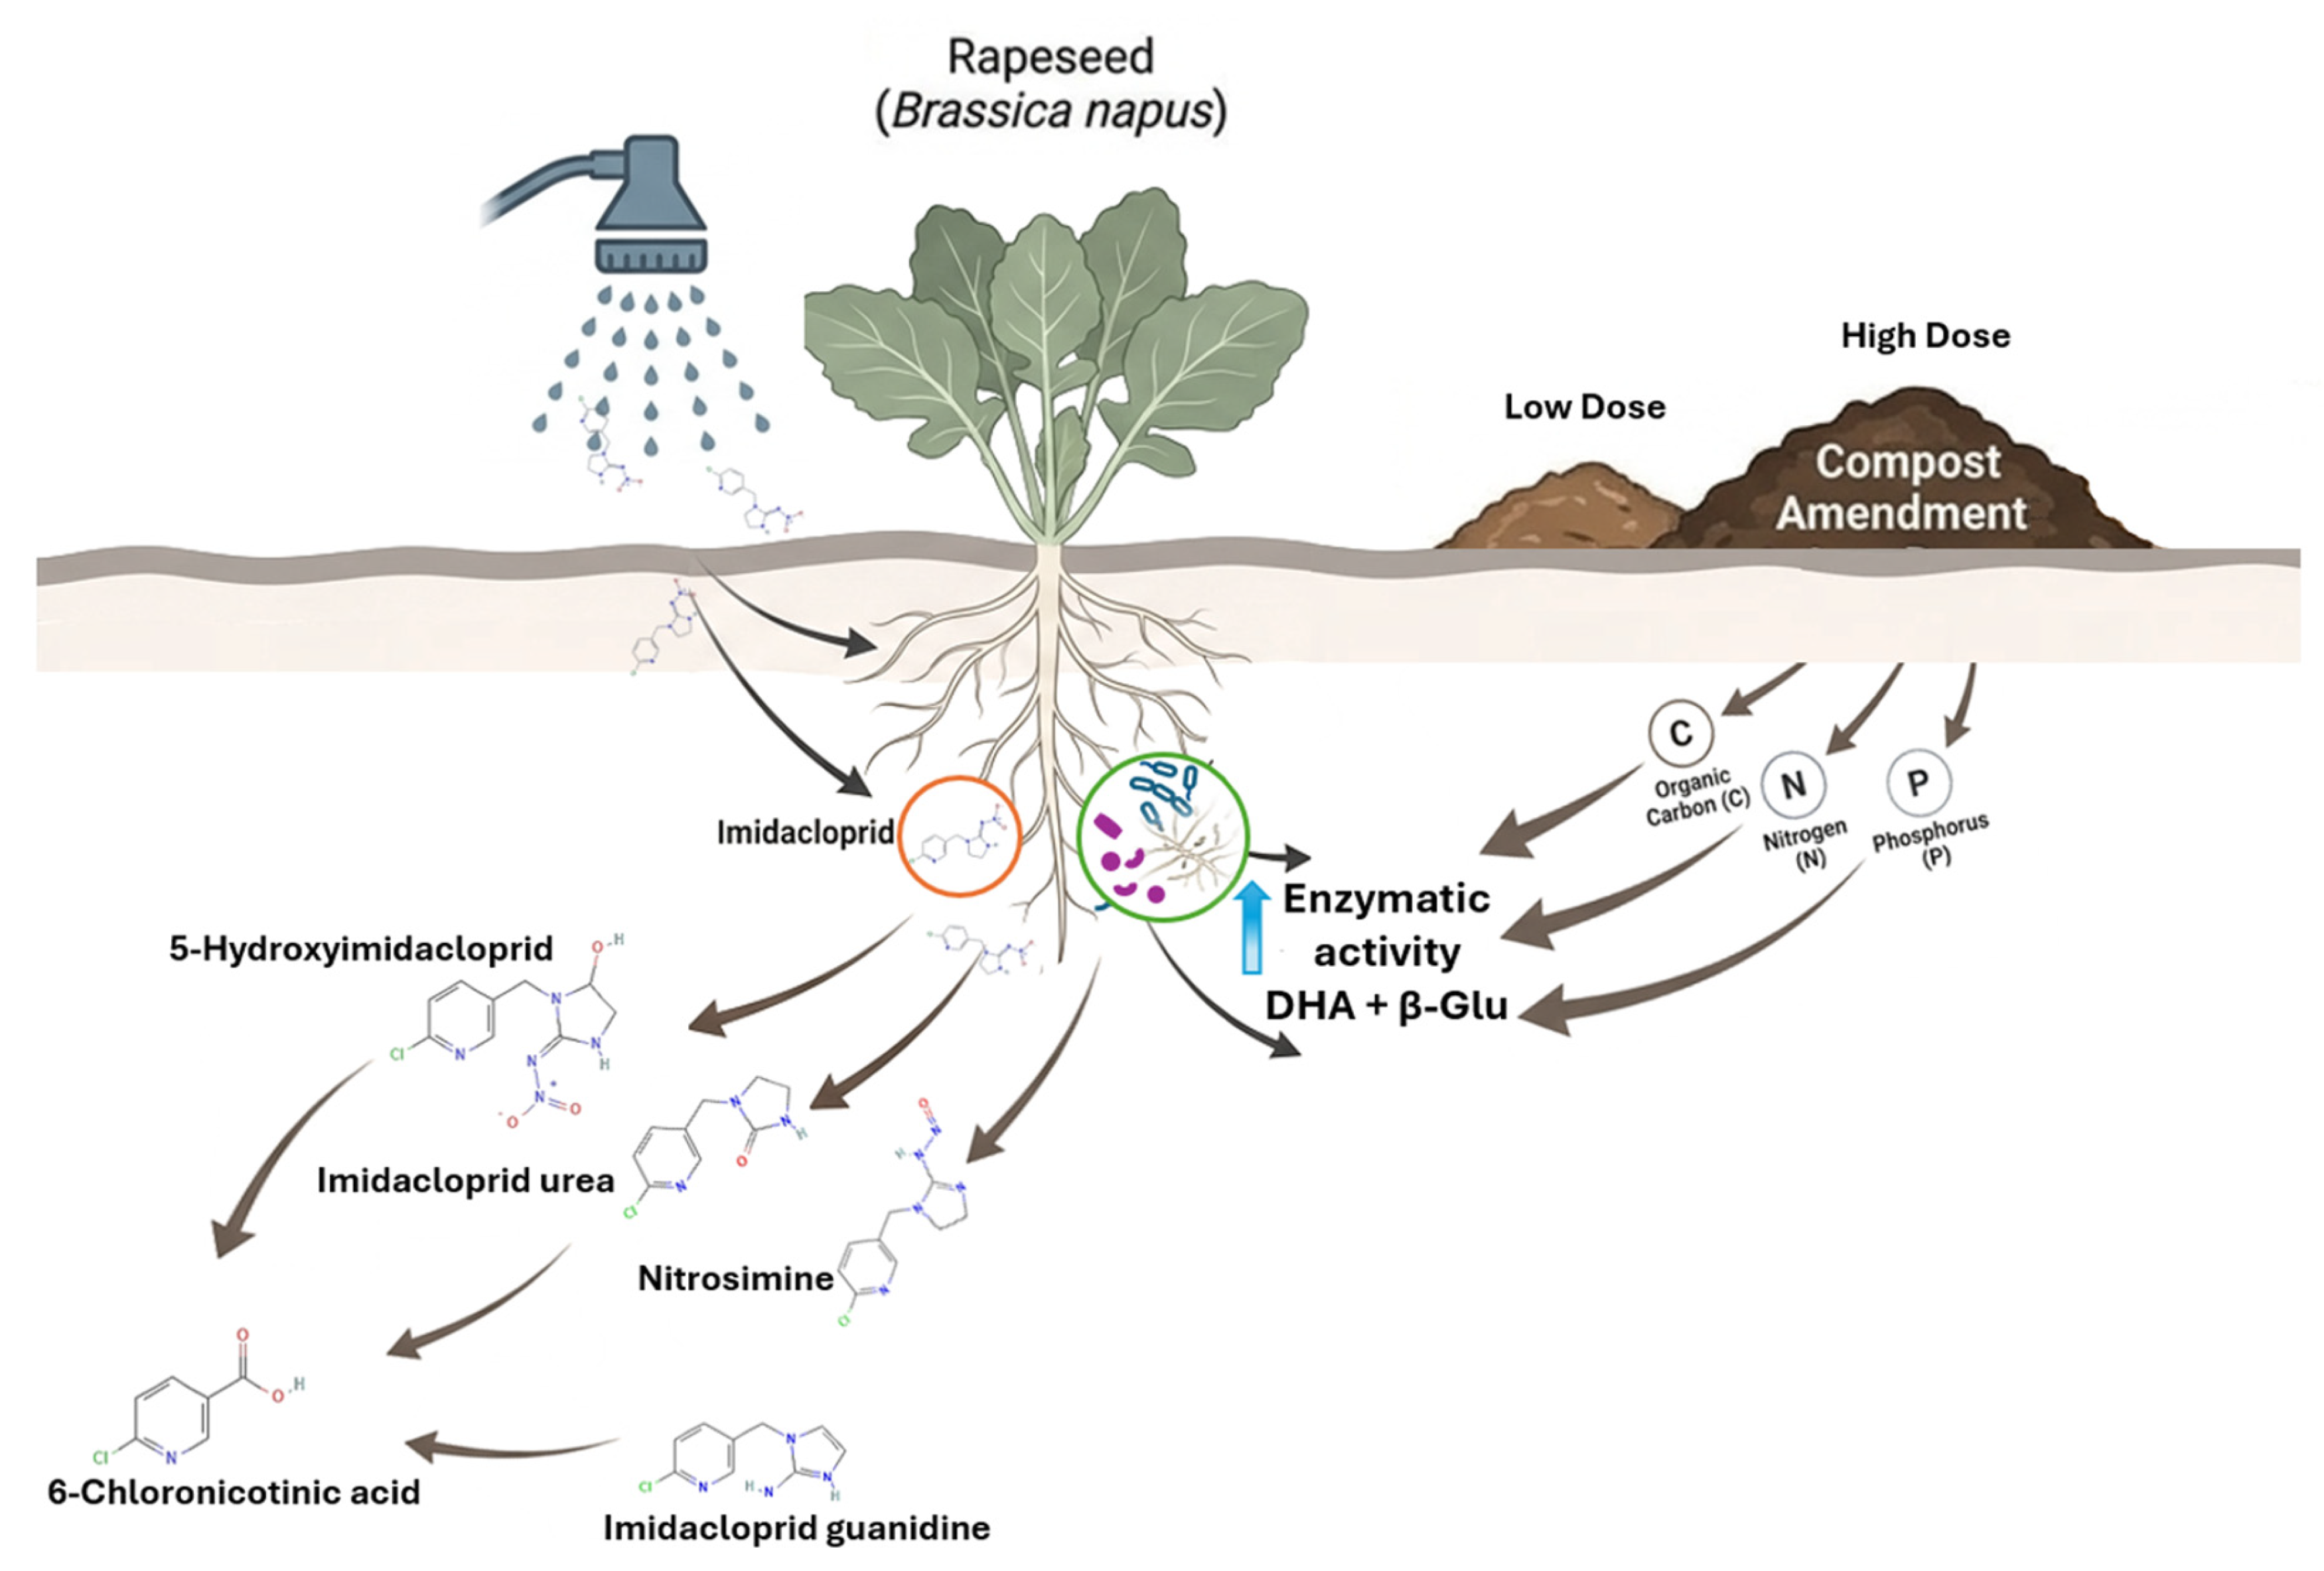
There are few studies comprehensively combining the dynamics of IM uptake by rapeseed oil with simultaneous assessment of microbiological activity in controlled substrates supplemented with various compost doses. Consequently, this study focused on examining the interactions between pollution, compost, plants, and microorganisms in the experimental phytoremediation system (
Figure 1) under laboratory conditions. Therefore, the aim of this study was to evaluate the effectiveness of imidacloprid removal from the substrate using rapeseed (
Brassica napus L.). Another objective of the experiment was to analyze the combined effect of the imidacloprid concentration and the compost dose (4 vs. 8 kg m
−2) on plant biomass, enzymatic activity, and microbiological parameters of the substrate in a water phytoremediation model. The following hypotheses were adopted: (i) a higher dose of sewage sludge compost (8 kg m
−2 compared to 4 kg m
−2) will increase the number and activity of substrate microorganisms and mitigate any possible toxicity caused by the presence of imidacloprid; and (ii) a higher dose of compost will cause an increase in the biomass of the above-ground part of rapeseed, which will affect the amount of imidacloprid accumulated in the above-ground tissue of the plant.
2. Materials and Methods
2.1. Pot Experiment Design
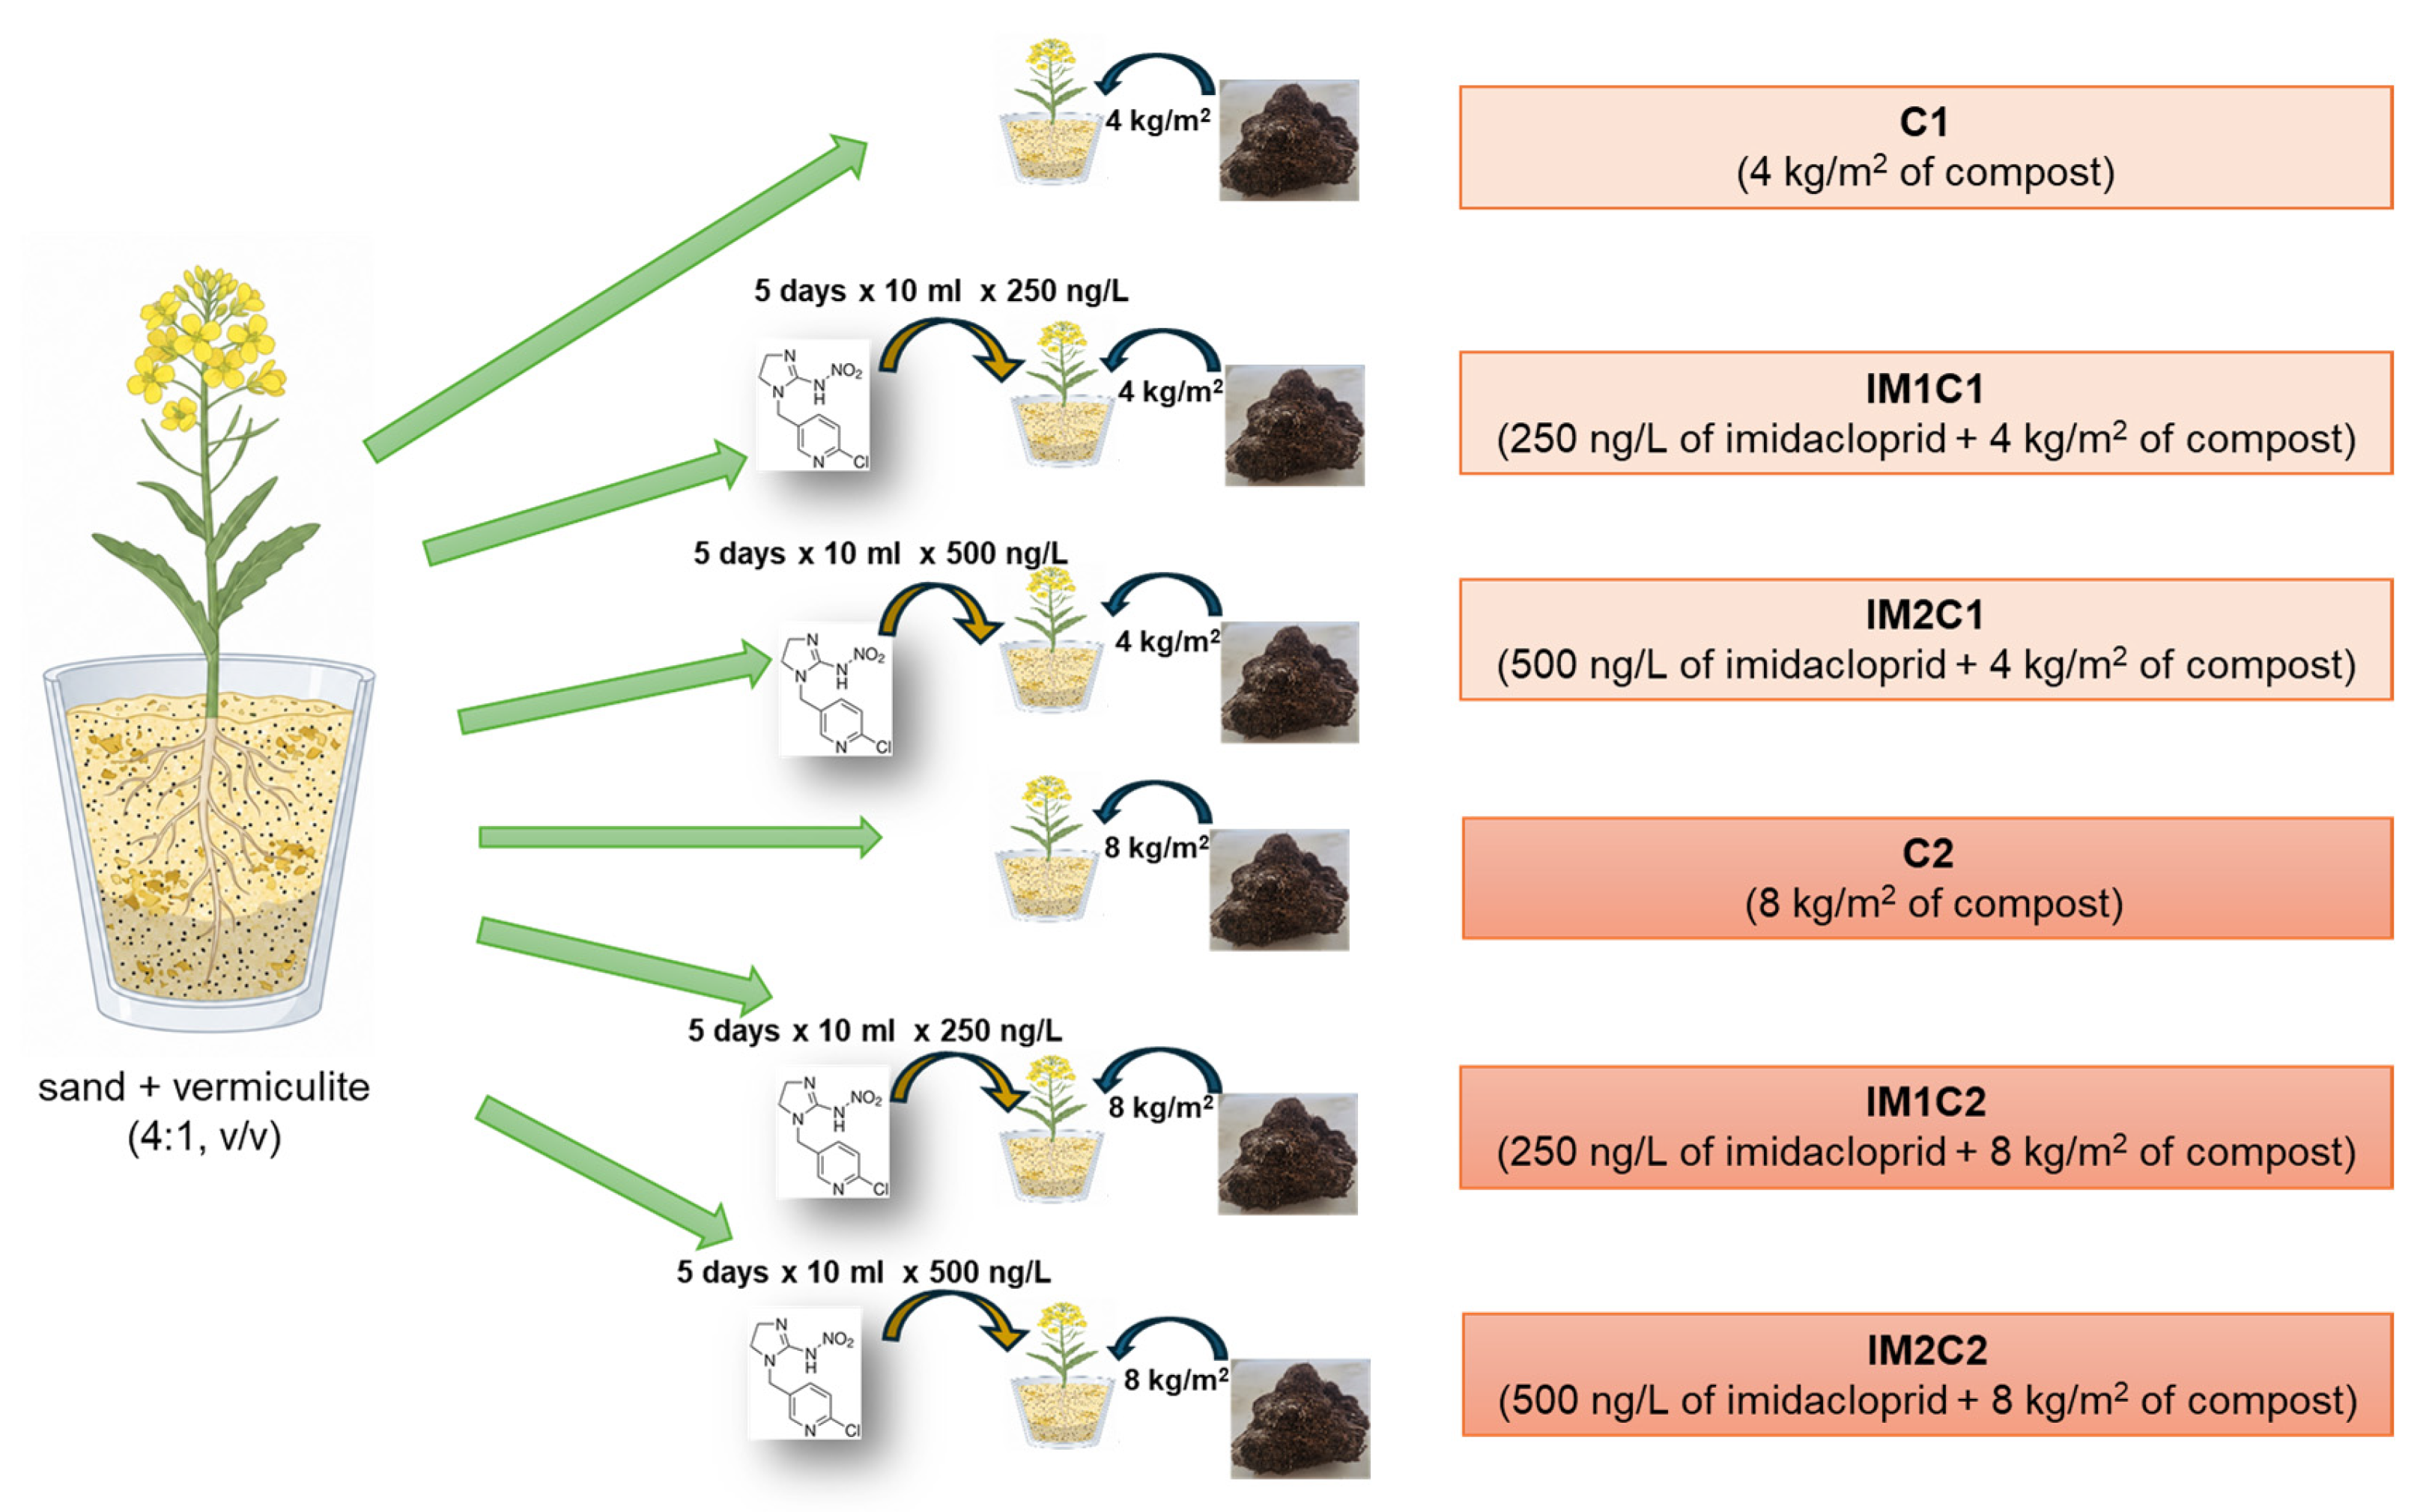
The ecological rationale for this study is based on a phytofilter model in which plants grown in a permeable solid substrate (sand/vermiculite/compost) are used for tertiary treatment of agricultural runoff, treated sewage, or contaminated surface water containing low but environmentally relevant concentrations of pesticides. The substrate used acted as a root environment and biofilter, while water containing imidacloprid (IM) represented the influent undergoing phytoremediation. In connection with the above, the pot experiment was conducted in a closed system, with three independent replicates for each experimental condition. The pot experiment was carried out in a vegetation hall under controlled conditions: photoperiod 16/8 h (light/dark), temperature 22 ± 2 °C (day) and 16 ± 2 °C (night), relative air humidity 60–70% and photosynthetic photon flux density (PPFD) of 300–350 µmol m
−2 s
−1, provided by LED lamps. The experiment was carried out using pots filled with a mineral substrate consisting of a mixture of sand and vermiculite in a 4:1 (
v/
v) volume ratio (
Figure 2). The pots had a diameter of 11 cm, a height of 8.5 cm, and a volume of 0.5 L. The pots were lined with a uniform polyethylene film, which prevented leachate formation and allowed for maintaining a strict mass balance for imidacloprid and nutrients. To stimulate biological and phytoremediation processes, the mineral substrate was enriched with compost produced from sewage sludge from the Municipal Wastewater Treatment Plant in Sokółka (Sokółka, Poland). The basic properties of the compost are summarized in
Table 1. The compost was applied to the substrate at two rates: C1—4 kg/m
2 and C2—8 kg/m
2. The selection of compost doses was based on the total nitrogen (TN) content in the compost used and the annual plant demand for this nutrient. The pots were filled with a homogeneously mixed substrate. The dry mass of the substrate consisting of sand, vermiculite, and compost was 208 ±8 g/pot for C1 and 227 ±12 g/pot for C2. Rapeseed (
Brassica napus L.) seedlings were sown as 10 seeds per pot. Winter rapeseed ‘Monolit’, obtained from Strzelce Plant Breeding Sp. z o.o., IHAR Group (Strzelce, Poland), was sown. For the phytoremediation experiment, 5 seedlings per pot were left to ensure uniform planting.
The application of IM started when the rapeseed reached BBCH 19 stage (Biologische Bundesanstalt, Bundessortenamt und CHemische Industrie). At 14 days after emergence, imidacloprid was applied by evenly applying it to the substrate surface. For five consecutive days, aqueous solutions of imidacloprid (IM) were applied in a volume of 10 mL/pot per surface to the substrate at two doses: IM1—250 ng/L and IM2—500 ng/L, which corresponded to a total IM mass of 12.5 and 25 ng/pot. The IM concentrations used in the studies correspond to those detected in surface waters and in treated wastewater. The solution volume was adjusted to provide a substrate moisture level of 60% of the field water holding capacity (WHC). A control combination was prepared in parallel, consisting of mineral substrate with an appropriate compost addition (dose of 4 or 8 kg/m2) but without insecticide. The control pot was irrigated with deionized water. All pots were arranged in a completely randomized design (CRD), and their position was changed every 3 days to minimize marginal microclimatic effects.
After the five-day period of exposure to IM and throughout the remainder of the experiment in all experimental variants (both contaminated and control), the substrate moisture content was monitored and supplemented to the required water capacity with deionized water.
2.2. Collection and Analysis of Substrate and Rapeseed Samples
2.2.1. Physicochemical Analyses
Substrate samples for physicochemical analyses were collected at the end of the pot experiment (42 days after IM application). The samples were air-dried, then sieved through 2 mm mesh sieves and placed in airtight containers at 4 °C for further analysis.
The substrate pH was determined in the samples in a 1:2.5 (
m/
v) suspension of substrate and distilled water using a Metler-Toledo pH meter. Organic carbon (TOC) and total nitrogen (TN) were determined using a Multi N/C 3100 Analytik Jena analyzer (Jena, Germany). Total phosphorus (TP) was determined using an Agilent 8800 ICP–MS Triple Quad (ICP–QQQ) (Agilent Technologies, Inc., Santa Clara, CA, USA) [
35]. Analyses were performed in triplicate.
Samples of the above-ground parts of the rapeseed were collected at the end of the pot experiment (42 days after the IM application). The dry weight of the above-ground parts of the rapeseed was determined using the drying-weighing method [
36]. The results are given as shoot biomass in g obtained from the pot (g/plot).
2.2.2. Determination of Substrate Enzyme Activity and the Number of Selected Microorganisms
Substrate enzyme activity and microbial numbers (total bacterial number, fluorescing Pseudomonas number, and mold fungi number) were determined in fresh field-moisture substrate samples collected three times after IM application: 7 days (T1), 21 days (T2), and 42 days (T3). The number of ammonia-oxidizing archaea was determined in fresh substrate samples collected after the completion of the pot experiment (42 days after IM application, T3).
Substrate dehydrogenase (DHA) activity was determined by the colorimetric method, using TTC (2,3,5-triphenyltetrazolium chloride) as a substrate at a concentration of 3% after incubation for 20 h and extraction with methanol [
30]. The enzyme activity was determined on a LambdaBio+ spectrophotometer (PerkinElmer, Boston, MA, USA) at a wavelength of 485 nm and expressed as µg TTC/g d.m/20 h.
The β-glucosidase activity was determined by the colorimetric method using p-nitrophenyl-β-D-glucopyranoside as a substrate and after 1 h of incubation [
37]. Enzyme activity was determined at λ = 400 nm and expressed as µg of p-nitrophenol (pNP) per gram of dry matter and incubation time (µg pNP./g d.m./h).
The total bacterial number (TNB) was determined by culturing on Agar Nutrient medium with the following composition (g/L): peptone—5 g; beef extract—3 g; agar—15 g; pH—6.8. The appropriately diluted substrate suspension was inoculated using the surface method, and then the Petri dishes were incubated for 72 h at 28 °C.
The number of fluorescing bacteria of the Pseudomonas genus (NPF) was determined on King B medium with the following composition (g/L): peptone—20 g; glycerol—10 mL; MgSO4—1.5 g; K2HPO4—1.5 g; agar—15 g; pH—7.2. The appropriately diluted substrate suspension was plated on Petri dishes using the surface method and then incubated for 72 h at 28 °C. After incubation, the colonies that fluoresced under UV light were counted.
The number of mold fungi (NMF) was determined on rose bengal medium using deep inoculation [
38]. Petri dishes were incubated at 25 °C for 7–14 days.
Bacterial (TNB, NPF) and mold fungi (NMF) numbers were converted to log10 CFU/g d.m. of substrate.
The number of ammonia-oxidizing archaea (AOA) was determined by digital PCR (dPCR) on a QIAcuity device (Qiagen, Hilden, Germany). DNA was isolated from fresh substrate samples (up to 250 mg) using the DNeasy PowerSoil Pro Kit (Qiagen) according to the manufacturer’s instructions. DNA was quantified and qualitatively assessed using a Lambda Bio+ spectrophotometer (PerkinElmer, Boston, MA, USA) with the ultra-micro sample volume spectrometer cell TrayCell (Hellma GmbH, Müllheim/Baden, Germany). A specific pair of primers was used for the PCR reaction: 967F: AATTGGCGGGGGAGCAC; 1060R: GGCCATGCACCACCTCTC [
39]. The composition of the reaction mixture (for Nanoplate 26K (24-well)) in the amount of 40 µL/well was as follows: 3x EvaGreen PCR Master Mix (FAM channel)—13.3 µL, Primer F (10µM)—2 µL, Stater R (10 µM)—2 µL, RNase-free water—17.7 µL, and DNA (5 ng/µl)—5 µL. The temperature program was set according to the manufacturer’s recommendation for the mastermix used (EvaGreen PCR mastermix) and taking into account the primers: PCR initial heat activation, 1 cycle at 95 °C for 2 min; then 40 cycles of denaturation for 15 s at 95 °C, annealing for 15 s at 60 °C, and extension for 15 s at 72 °C; and 1 cycle of cooling down for 5 min at 40 °C. The obtained results were expressed as log10 gene copies per gram of dry substrate matter (log10 gene copies/g d.m.).
2.3. Determination of IM Content in Substrate and Plant Samples
The IM content in the substrate samples and rapeseed shoots was determined at the end of the pot experiment (42 days after IM application).
Ten grams of air-dried, homogenized substrate was weighed into a 50-mL centrifuge tube. The extraction was then performed using the QuEChERS method [
40]: 10 mL of deionized water was added to the sample and shaken for 1 min, and then 10 mL of 1% acetic acid in acetonitrile was added and shaken again for 5 min. Next, 4 g of MgSO
4 and 1 g of sodium acetate were added, and the samples were shaken for 1 min and centrifuged for 5 min at 4000 rpm. The organic supernatant was collected, subjected to purification using 1 g of anhydrous sodium sulfate and 400 mg of PSA (primary-secondary amine) and centrifuged for 5 min at 4000 rpm. The extract was concentrated under an inert gas atmosphere (nitrogen) to 1 mL and diluted to 5 mL in the initial mobile phase (A). Samples were filtered through a 0.2 µm syringe filter (Whatman, Florham Park, NJ, USA) and analyzed using a 1260 Infinity LC system coupled to a 6420 LC/MS Triple Quadrupole mass analyzer (Agilent Technologies, Santa Clara, CA, USA) with ESI+ ionization. Detection was performed in selected reaction monitoring (MRM) mode. Chromatographic analysis was performed using a Zorbax Eclipse Plus C18 column (2.1 × 50 mm, 1.8 μm). The mobile phase consisted of 0.2% formic acid and 5 mM ammonium formate in water (A) and 0.2% formic acid and 5 mM ammonium formate in methanol (B). Initially, 100% A was used, followed by a 15 min gradient to 100% B, which was held for 2 min. A 2 min recovery time was applied to the initial conditions (100% A) and held for 5 min. The flow rate was set at 0.2 mL/min, and the injection volume was 10 μL. During detection, transitions of the molecular ion 256.3
m/
z [M+H]+ to ions 209.2
m/
z and 175.2
m/
z were monitored.
The IM extraction procedure in rapeseed shoot samples was performed using the QuEChERS method [
41]: To 10 g of fresh, homogenized plant sample, 10 mL of 1% acetic acid in acetonitrile was added and shaken for 5 min. Next, 4 g of MgSO
4 and 1 g of sodium acetate were added, shaken for 1 min, and centrifuged for 5 min at 4000 rpm. The purification and detection process was carried out in a similar manner as for the substrate.
The limit of quantification (LOQ) was 1.0 ng/kg, and the limit of detection (LOD) was 0.33 ng/kg. The recovery for substrate samples was 94%, and for plant samples, it was 96%.
2.4. Shoot Concentration Factor (SCF), Shoot Uptake, Phytoextraction Share (PS) and IM Recovery (RE)
The shoot concentration factor of IM in the above-ground parts of rapeseed (SCF) was determined as the quotient of the IM content in the above-ground parts of the rapeseed (IMP, ng/kg d.m.) relative to the IM content in the substrate (IMS; ng/kg d.m.).
The uptake of IM by the rapeseed shoots per pot (Shoot uptake) was determined as the product of the IM content in the shoot (IMP; ng/kg d.m.) and the obtained rapeseed biomass in the pot (mP; kg s.m./pot) and was expressed in ng/pot.
The phytoextraction share was calculated by dividing the shoot uptake by the IM dose applied per pot (12.5 ng or 25 ng/pot) and was expressed as %.
The IM recovery (Recovery, %) was calculated as the sum of the IM content in the substrate in the pot (ng/pot) and the shoot uptake (ng/pot) in relation to the IM dose applied per pot and was expressed as %.
2.5. Analysis of Results
For the physicochemical properties of the substrate and the phytoremediation factors, the results are presented as the mean ± standard deviation (mean ± SD), while for the biological parameters (TNB, NPF, NMF, AOA, rapeseed dry biomass), they are presented as the mean ± standard error of the mean (mean ± SEM). The statistical methods were adapted to the sampling scheme and the time variability of the parameters studied. To assess the effect of the experimental factors on parameters such as the pH, TOC, TN, TP, dry biomass accumulation, IM content in the substrate and plant and phytoremediation factors, ANOVA was performed, and in the case of significant differences, the means were compared using Tukey’s test at p < 0.05. These parameters were assessed once at the end of the experiment (two factors: compost dose and IM dose). For parameters measured repeatedly during the experiment at different sampling times (microbial abundance and enzyme activity), linear mixed-effects models (LMMs) were used to account for repeated measurements from the same experimental pots. The compost dose, imidacloprid dose, sampling time, and all interactions among these factors were included as fixed effects, whereas pot identity was included as a random intercept. The general model structure was: response ~ compost dose × imidacloprid dose × sampling time + (1|pot). The significance of fixed effects and their interactions was evaluated using Type III tests with Kenward–Roger approximation of denominator degrees of freedom. Model assumptions were evaluated by residual-versus-fitted plots and normal Q–Q plots. The Shapiro–Wilk test was used as an additional assessment of residual normality and Levene’s tests for homoscedasticity. Because significant interactions were detected, the estimated marginal means (EMMs) were calculated for individual compost dose × imidacloprid dose × sampling time combinations. Pairwise comparisons among EMMs were performed using Tukey adjustment for multiple comparisons. Thus, treatment combinations could be compared while retaining the repeated-measures structure of the experiment.
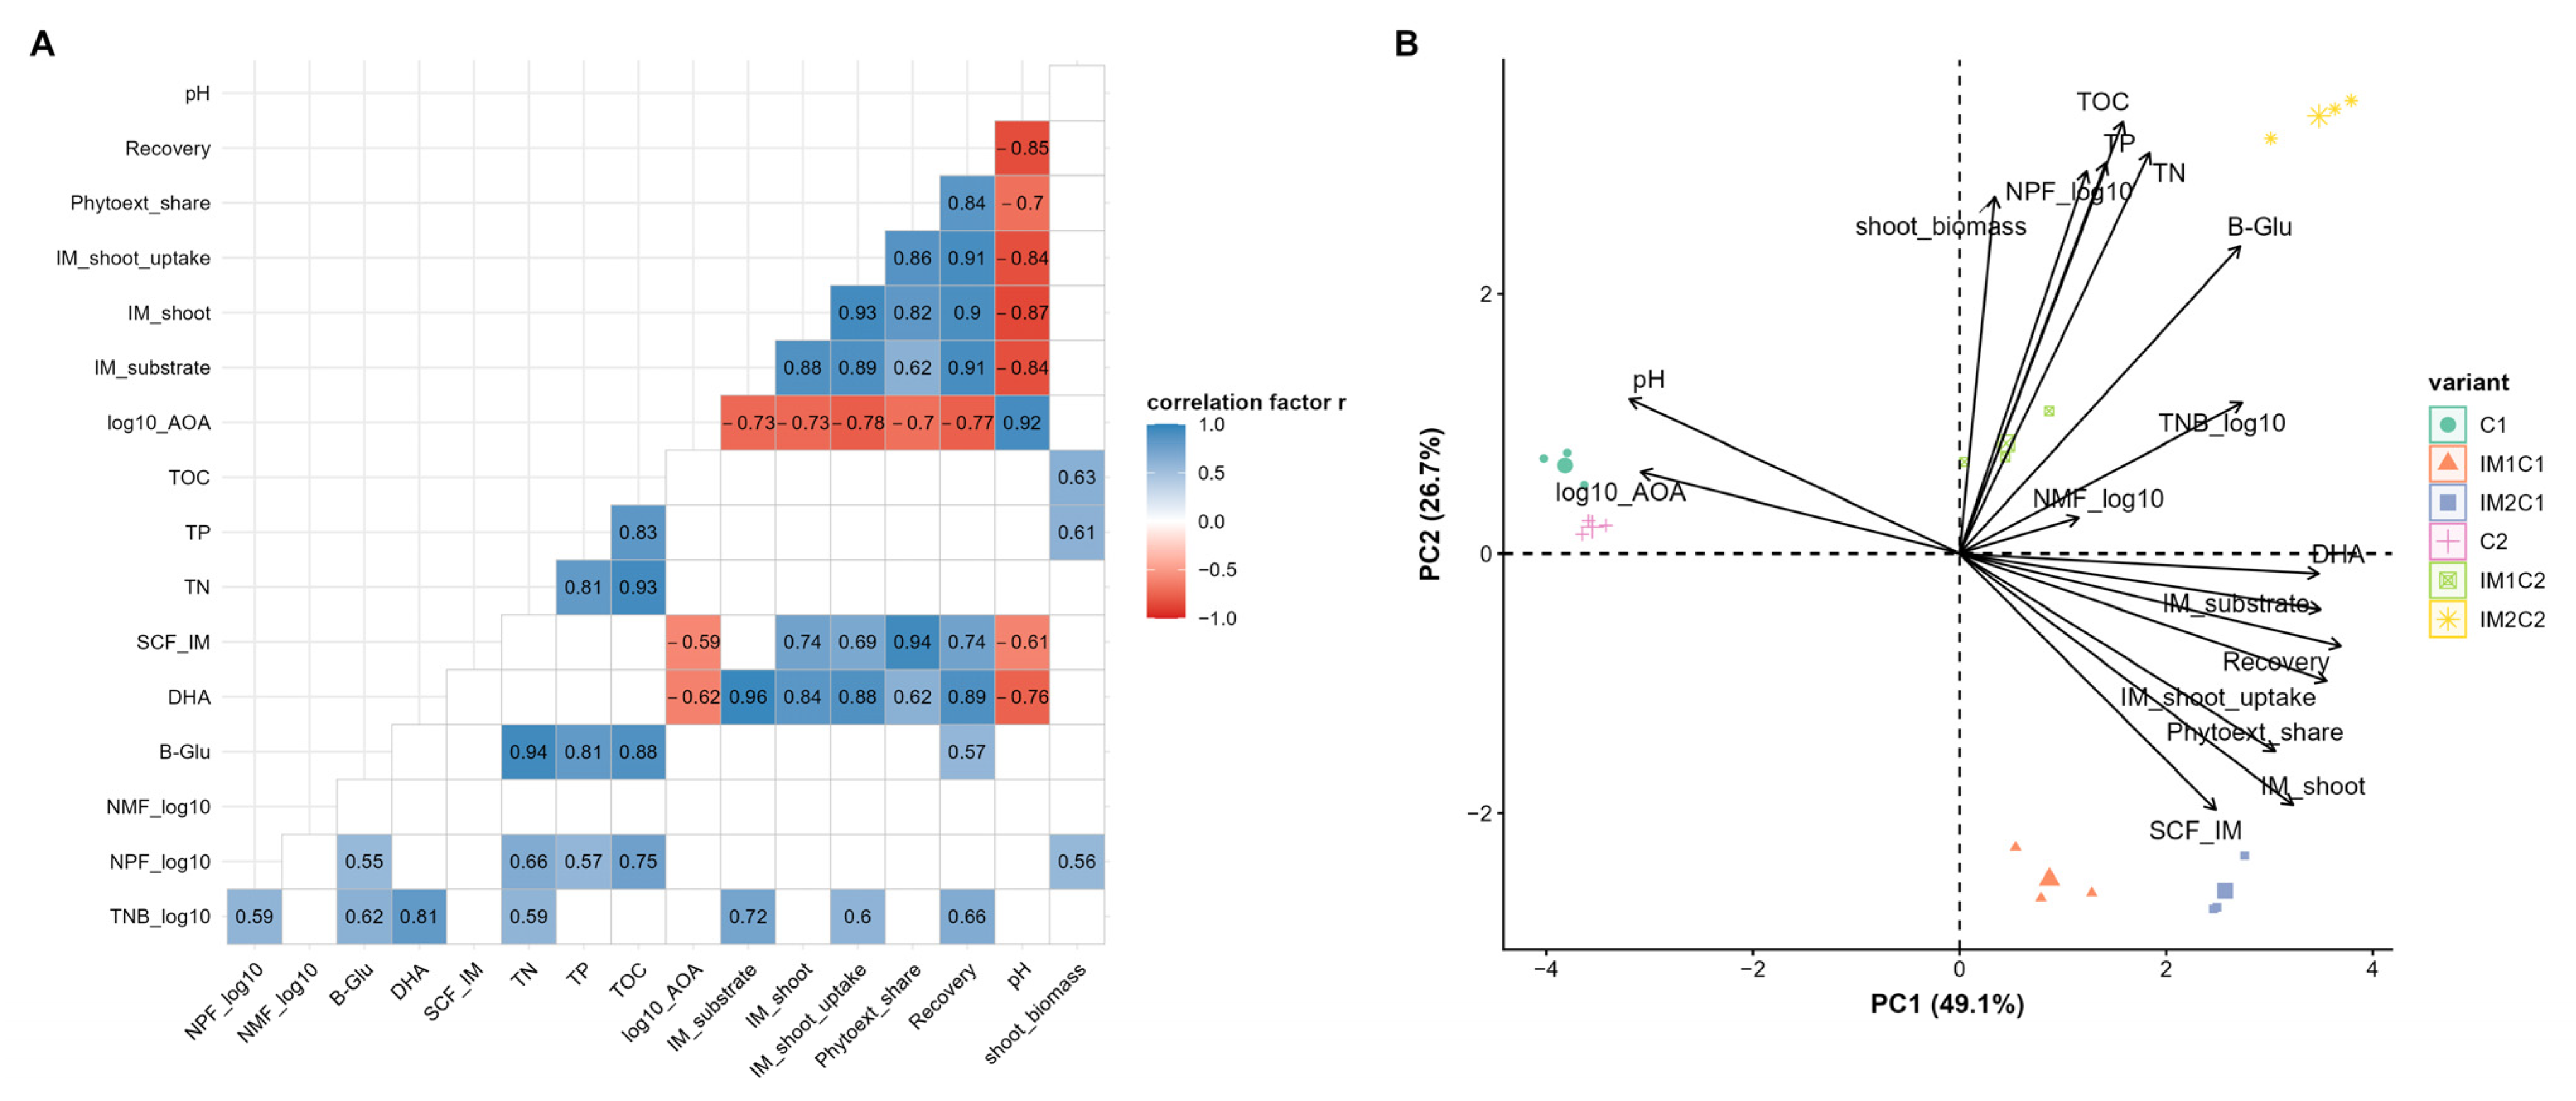
Pearson correlation analysis was used to examine associations among the studied physicochemical, microbiological, and imidacloprid-related parameters at the T3 sampling time (42 days after imidacloprid application). This decision was made because the substrate physicochemical parameters and phytoremediation indicators (plant biomass, IM uptake, SCF) were determined only once at the end of the experiment (T3). Using microbiological data exclusively from T3 allowed us to maintain the assumption of independence of the observed variables. To account for multiple testing, correlation p-values were adjusted using the Benjamini–Hochberg false discovery rate (FDR) procedure. Correlations were considered statistically significant at an FDR-adjusted p < 0.05. A heatmap plot was used to visualize correlations that were significant at p < 0.05. PCA was also performed, and the relationships are presented as a biplot. The calculations and visualization of the analysis results were performed using R (version 4.4.2).
3. Results
3.1. Substrate and Rapeseed Properties
3.1.1. Physicochemical Properties of Substrate
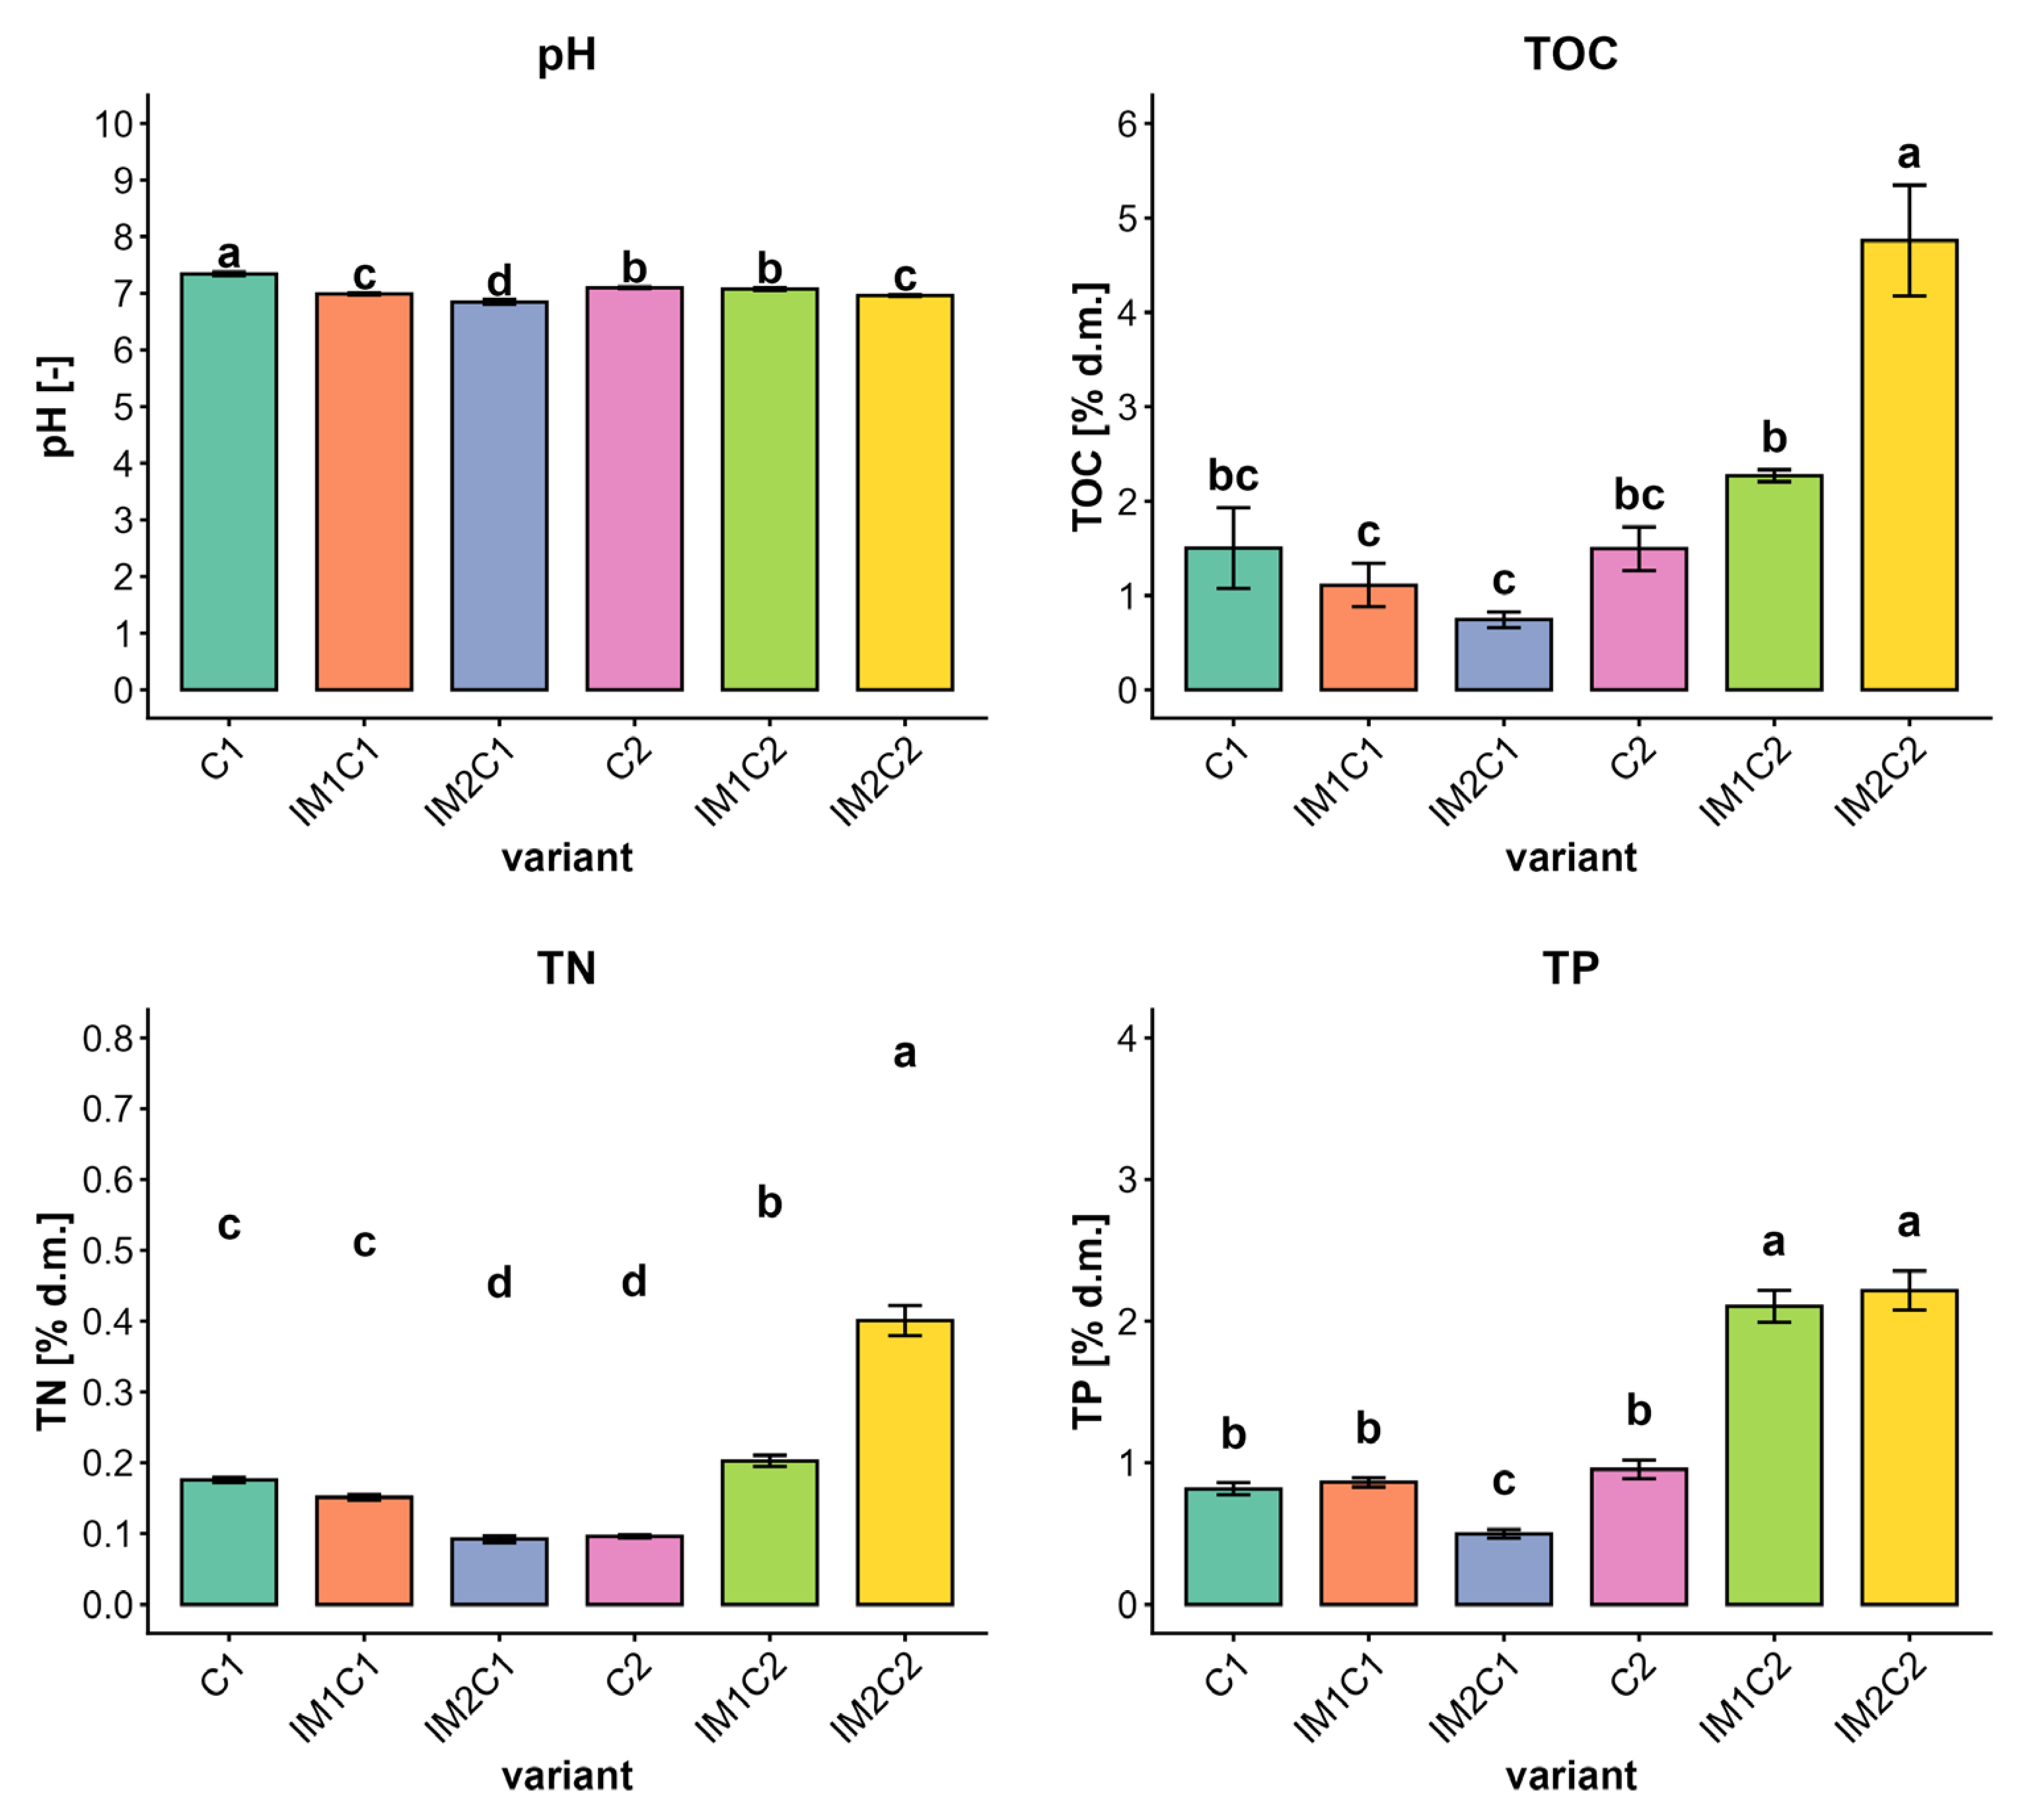
Figure 3 shows the main physicochemical properties of the substrate: pH, TOC (total organic carbon content), TN (total nitrogen content), and TP (total phosphorus content).
The pH values of the substrate ranged from 6.85 to 7.35, which corresponds to a neutral reaction. The highest pH value was recorded for the control treatment with a compost application rate of 4 kg/m2 (C1, 7.35), while the lowest was observed for the IM2C1 treatment (6.85). In general, significantly lower pH values were recorded in samples with a higher IM dose (IM2, 500 ng/L) compared with samples with a lower dose (IM1, 250 ng/L) and those without IM.
The TOC content ranged from 0.74% d.m. (IM2C1) to 4.75% d.m. (IM2C2). It was found that significantly higher TOC levels were observed in samples with a higher compost application rate (C2 variants) compared with the other experimental variants.
The TN content varied significantly depending on the experimental variant, ranging from 0.09% d.m. (IM2C1) to 0.40% d.m. (IM2C2). In contrast, the TP content was lowest in IM2C1 (0.50% d.m.), whereas the highest values were recorded in the IM1C2 (2.11% d.m.) and IM2C2 (2.22% d.m.) variants.
3.1.2. Shoot Biomass of Rapeseed
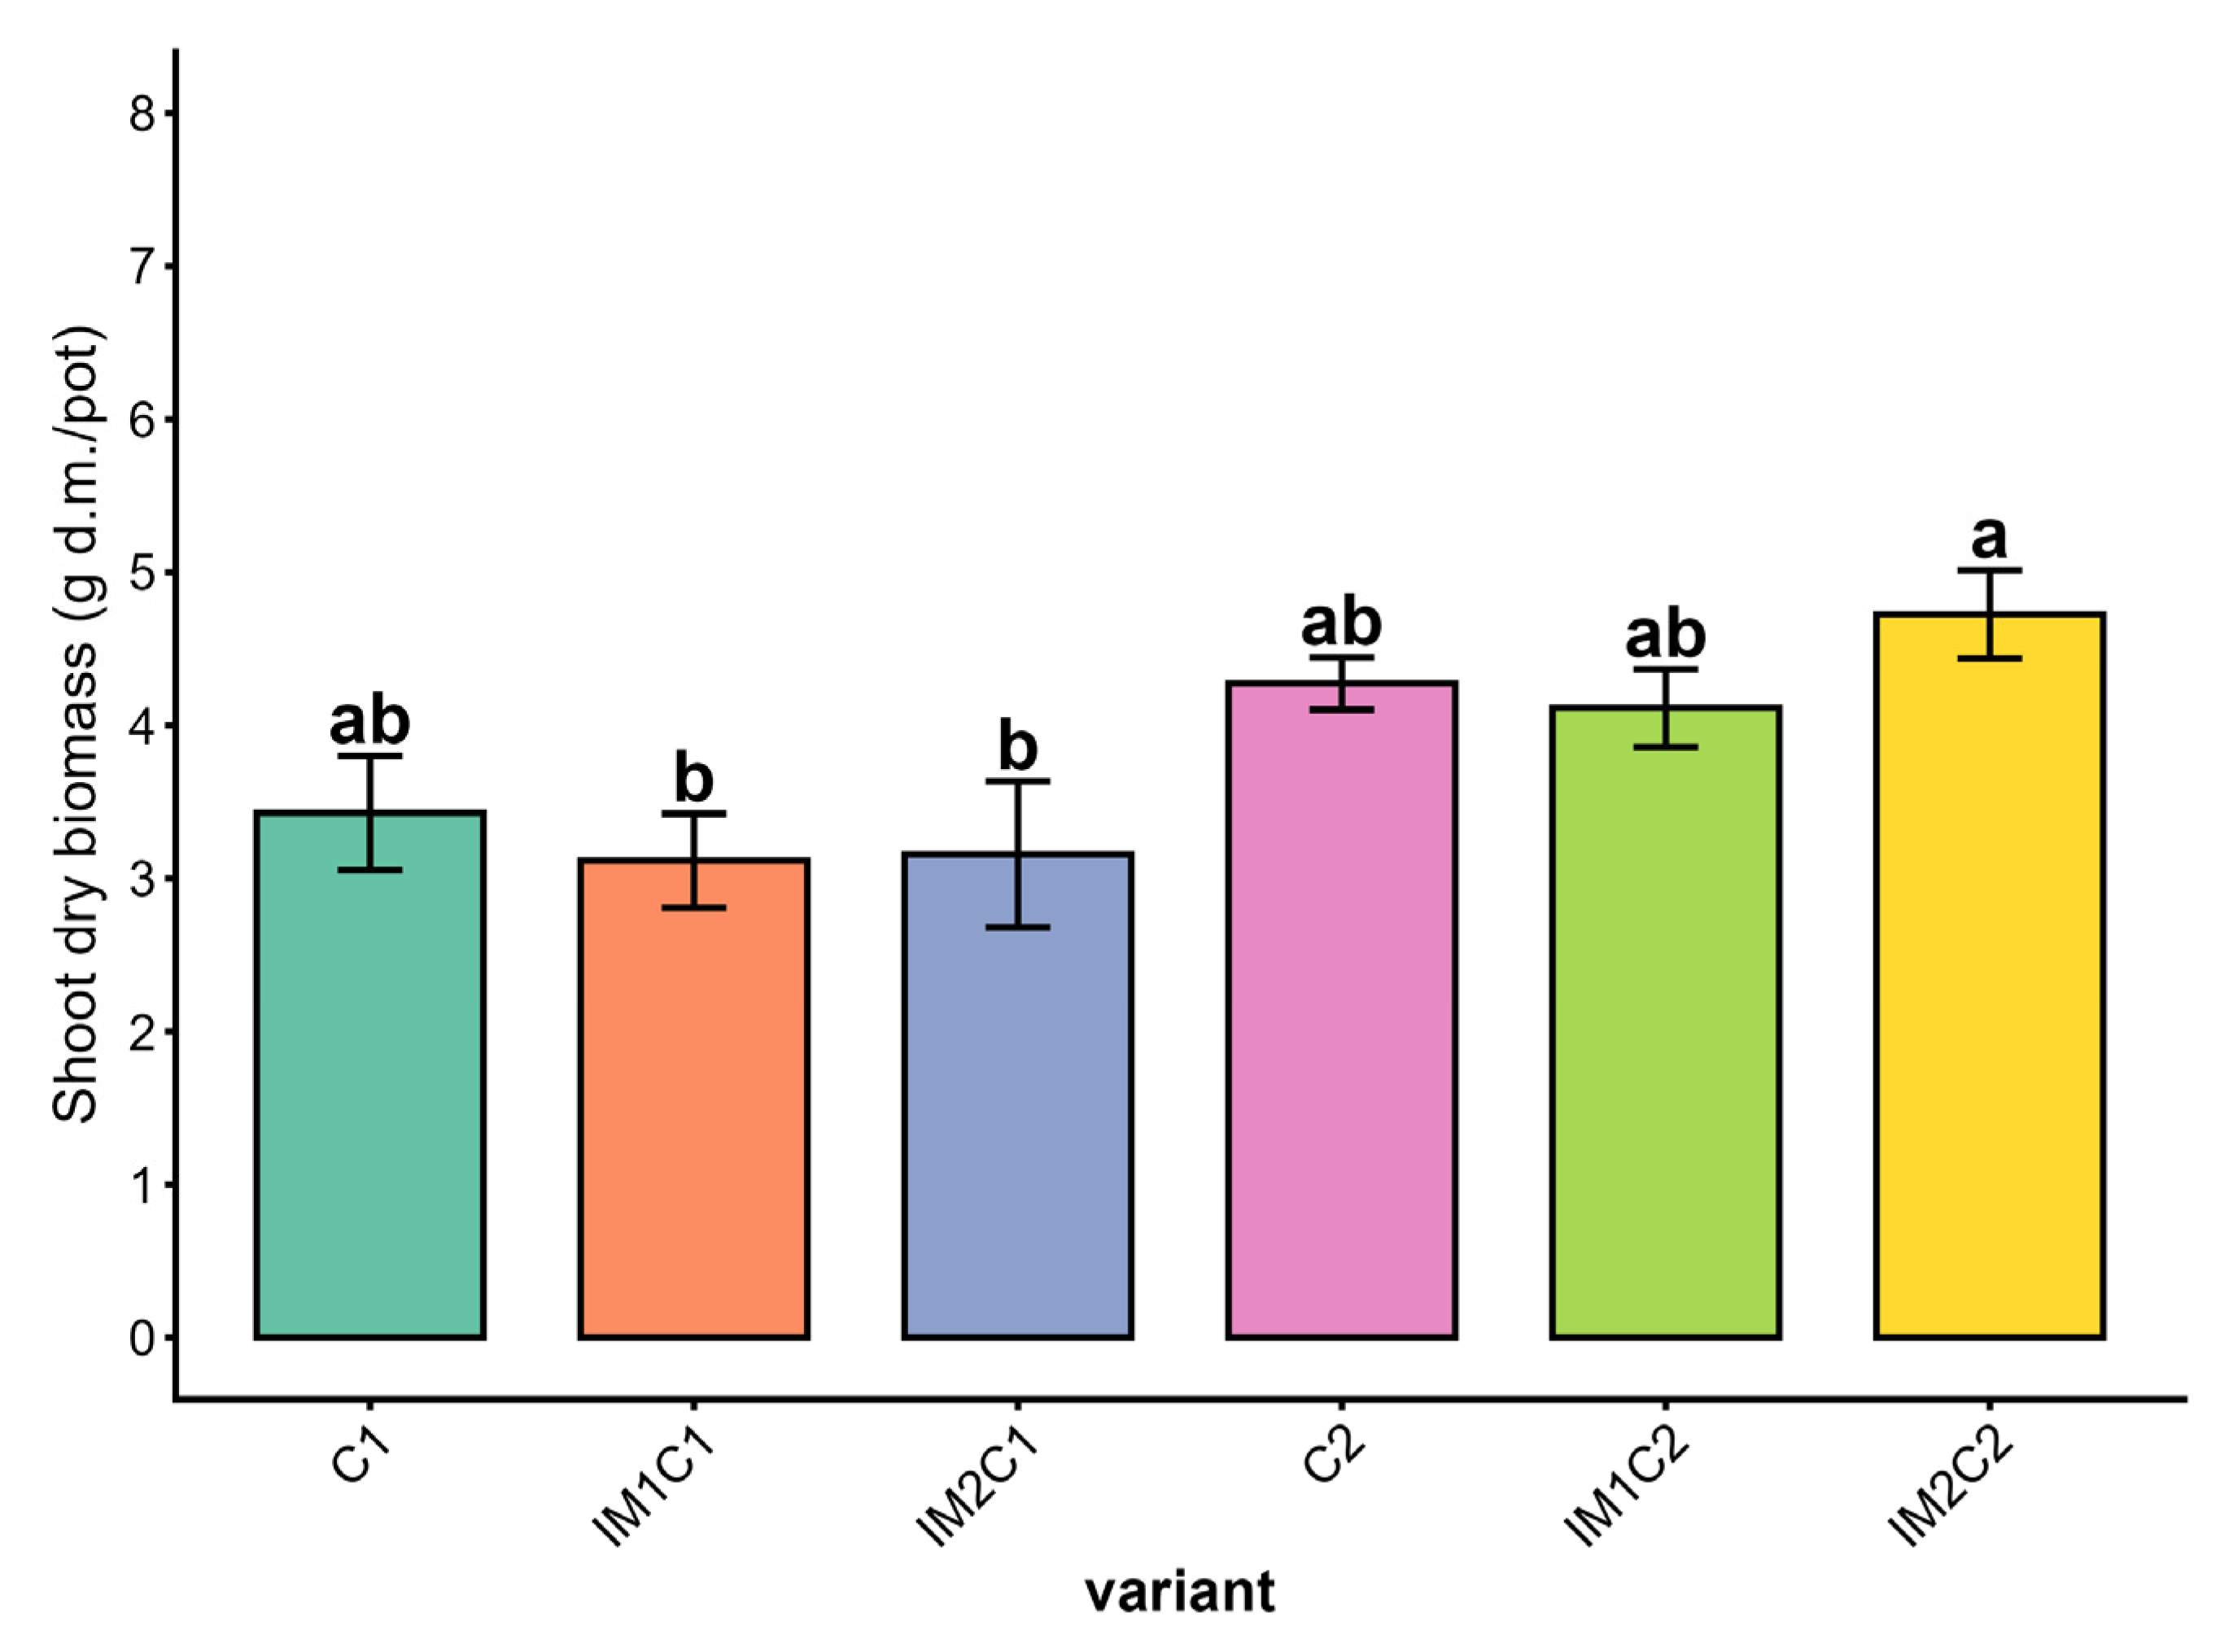
The dry matter content of the plants’ above-ground parts ranged from 3.12 and 3.16 g d.m./pot (IM1C1 and IM2C1, respectively) to 4.73 g d.m./pot (IM2C2) (
Figure 4). The dry biomass of the rapeseed shoots recorded for the IM2C2 treatment was significantly higher than in the IM1C1 and IM2C1 treatments. Generally, higher values of shoot dry biomass were obtained for treatments with a higher compost application rate (C2).
3.1.3. Substrate Enzyme Activity and Microbial Abundance
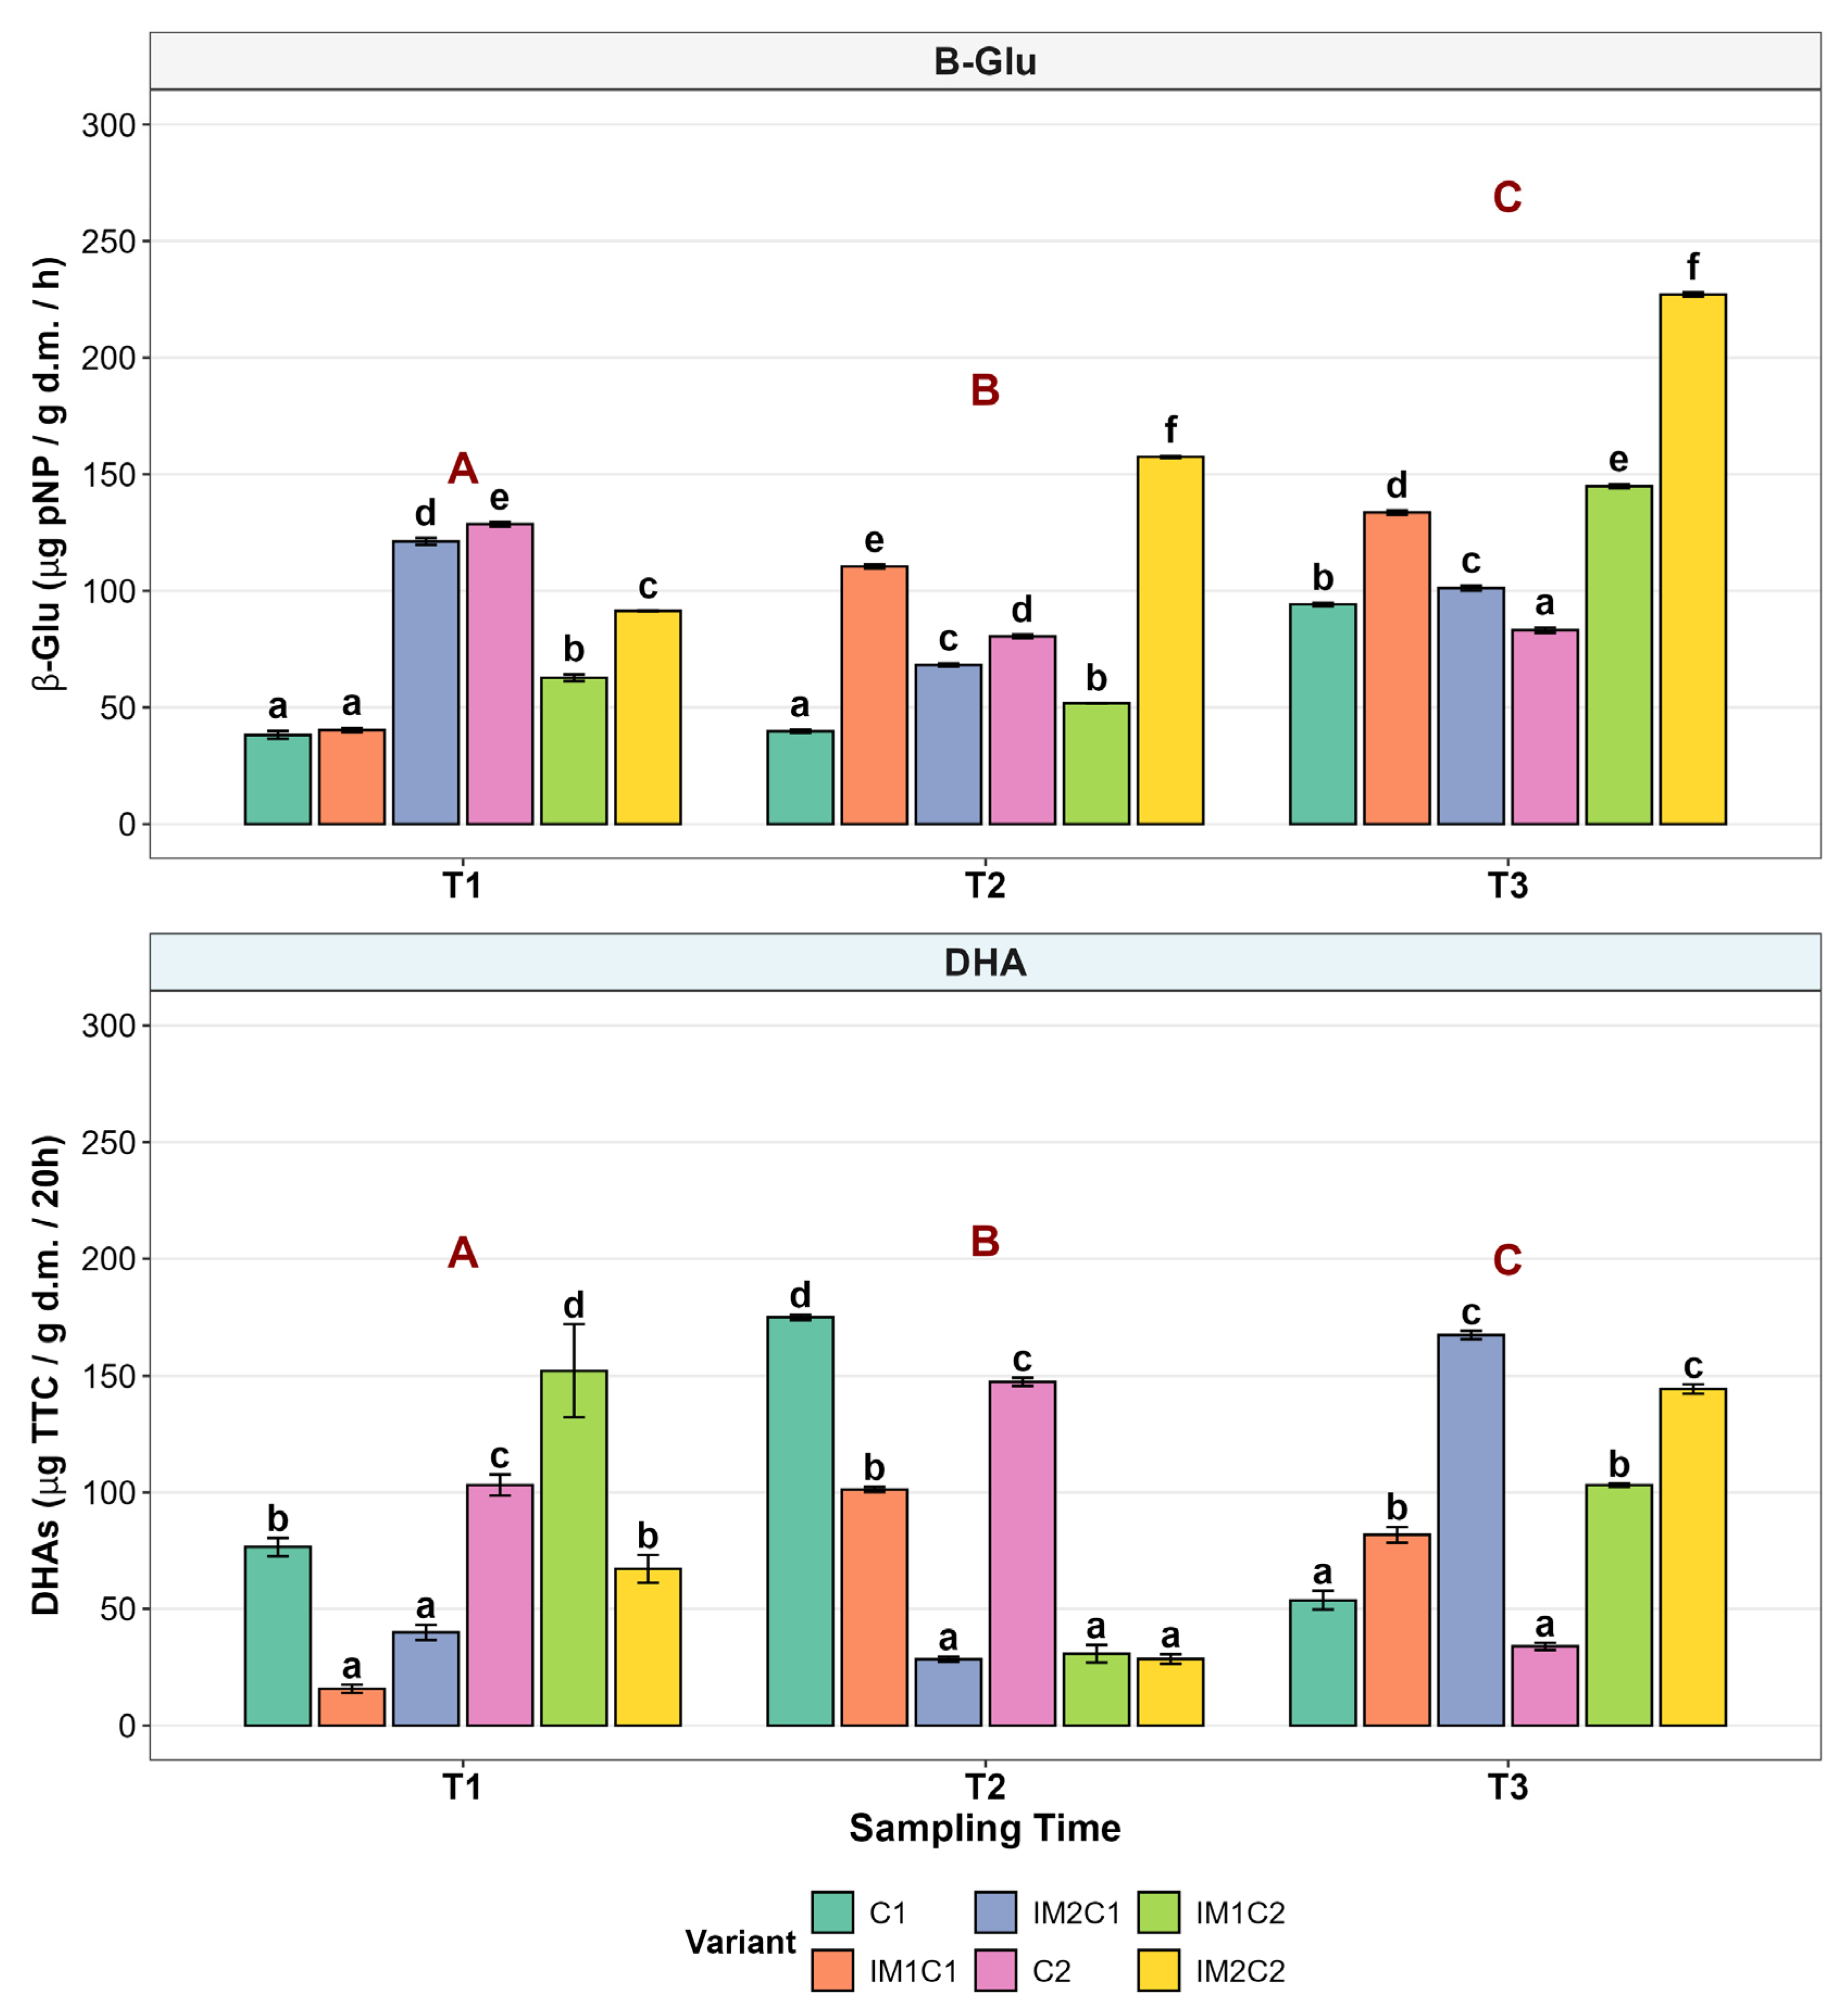
Figure 5 summarizes the results for the β-glucosidase (B-Glu) and dehydrogenase (DHA) activities in the substrate depending on the experimental variant and the date of sampling.
Figure 5.
Activity of substrate enzymes (B-Glu—β-glucosidase; DHAs—dehydrogenases) depending on the experimental variant: C1, C2—compost at a dose of 4 kg/m
2 and 8 kg/m
2, respectively; IM1, IM2—imidacloprid at a dose of 250 ng/L and 500 ng/L, respectively; T1, T2, T3—sampling time at 7 days, 21 days and 42 days after IM application, respectively; values represent means ± SEMs (
n = 3). Uppercase letters (A, B, C) indicate significant differences between sampling times (main effect of time,
p < 0.05). Lowercase letters (a, b, c, d, e, f) indicate significant differences among treatment variants within a given sampling time (interaction effect of IM dose x compost dose,
p < 0.05, Tukey’s HSD test). As shown in
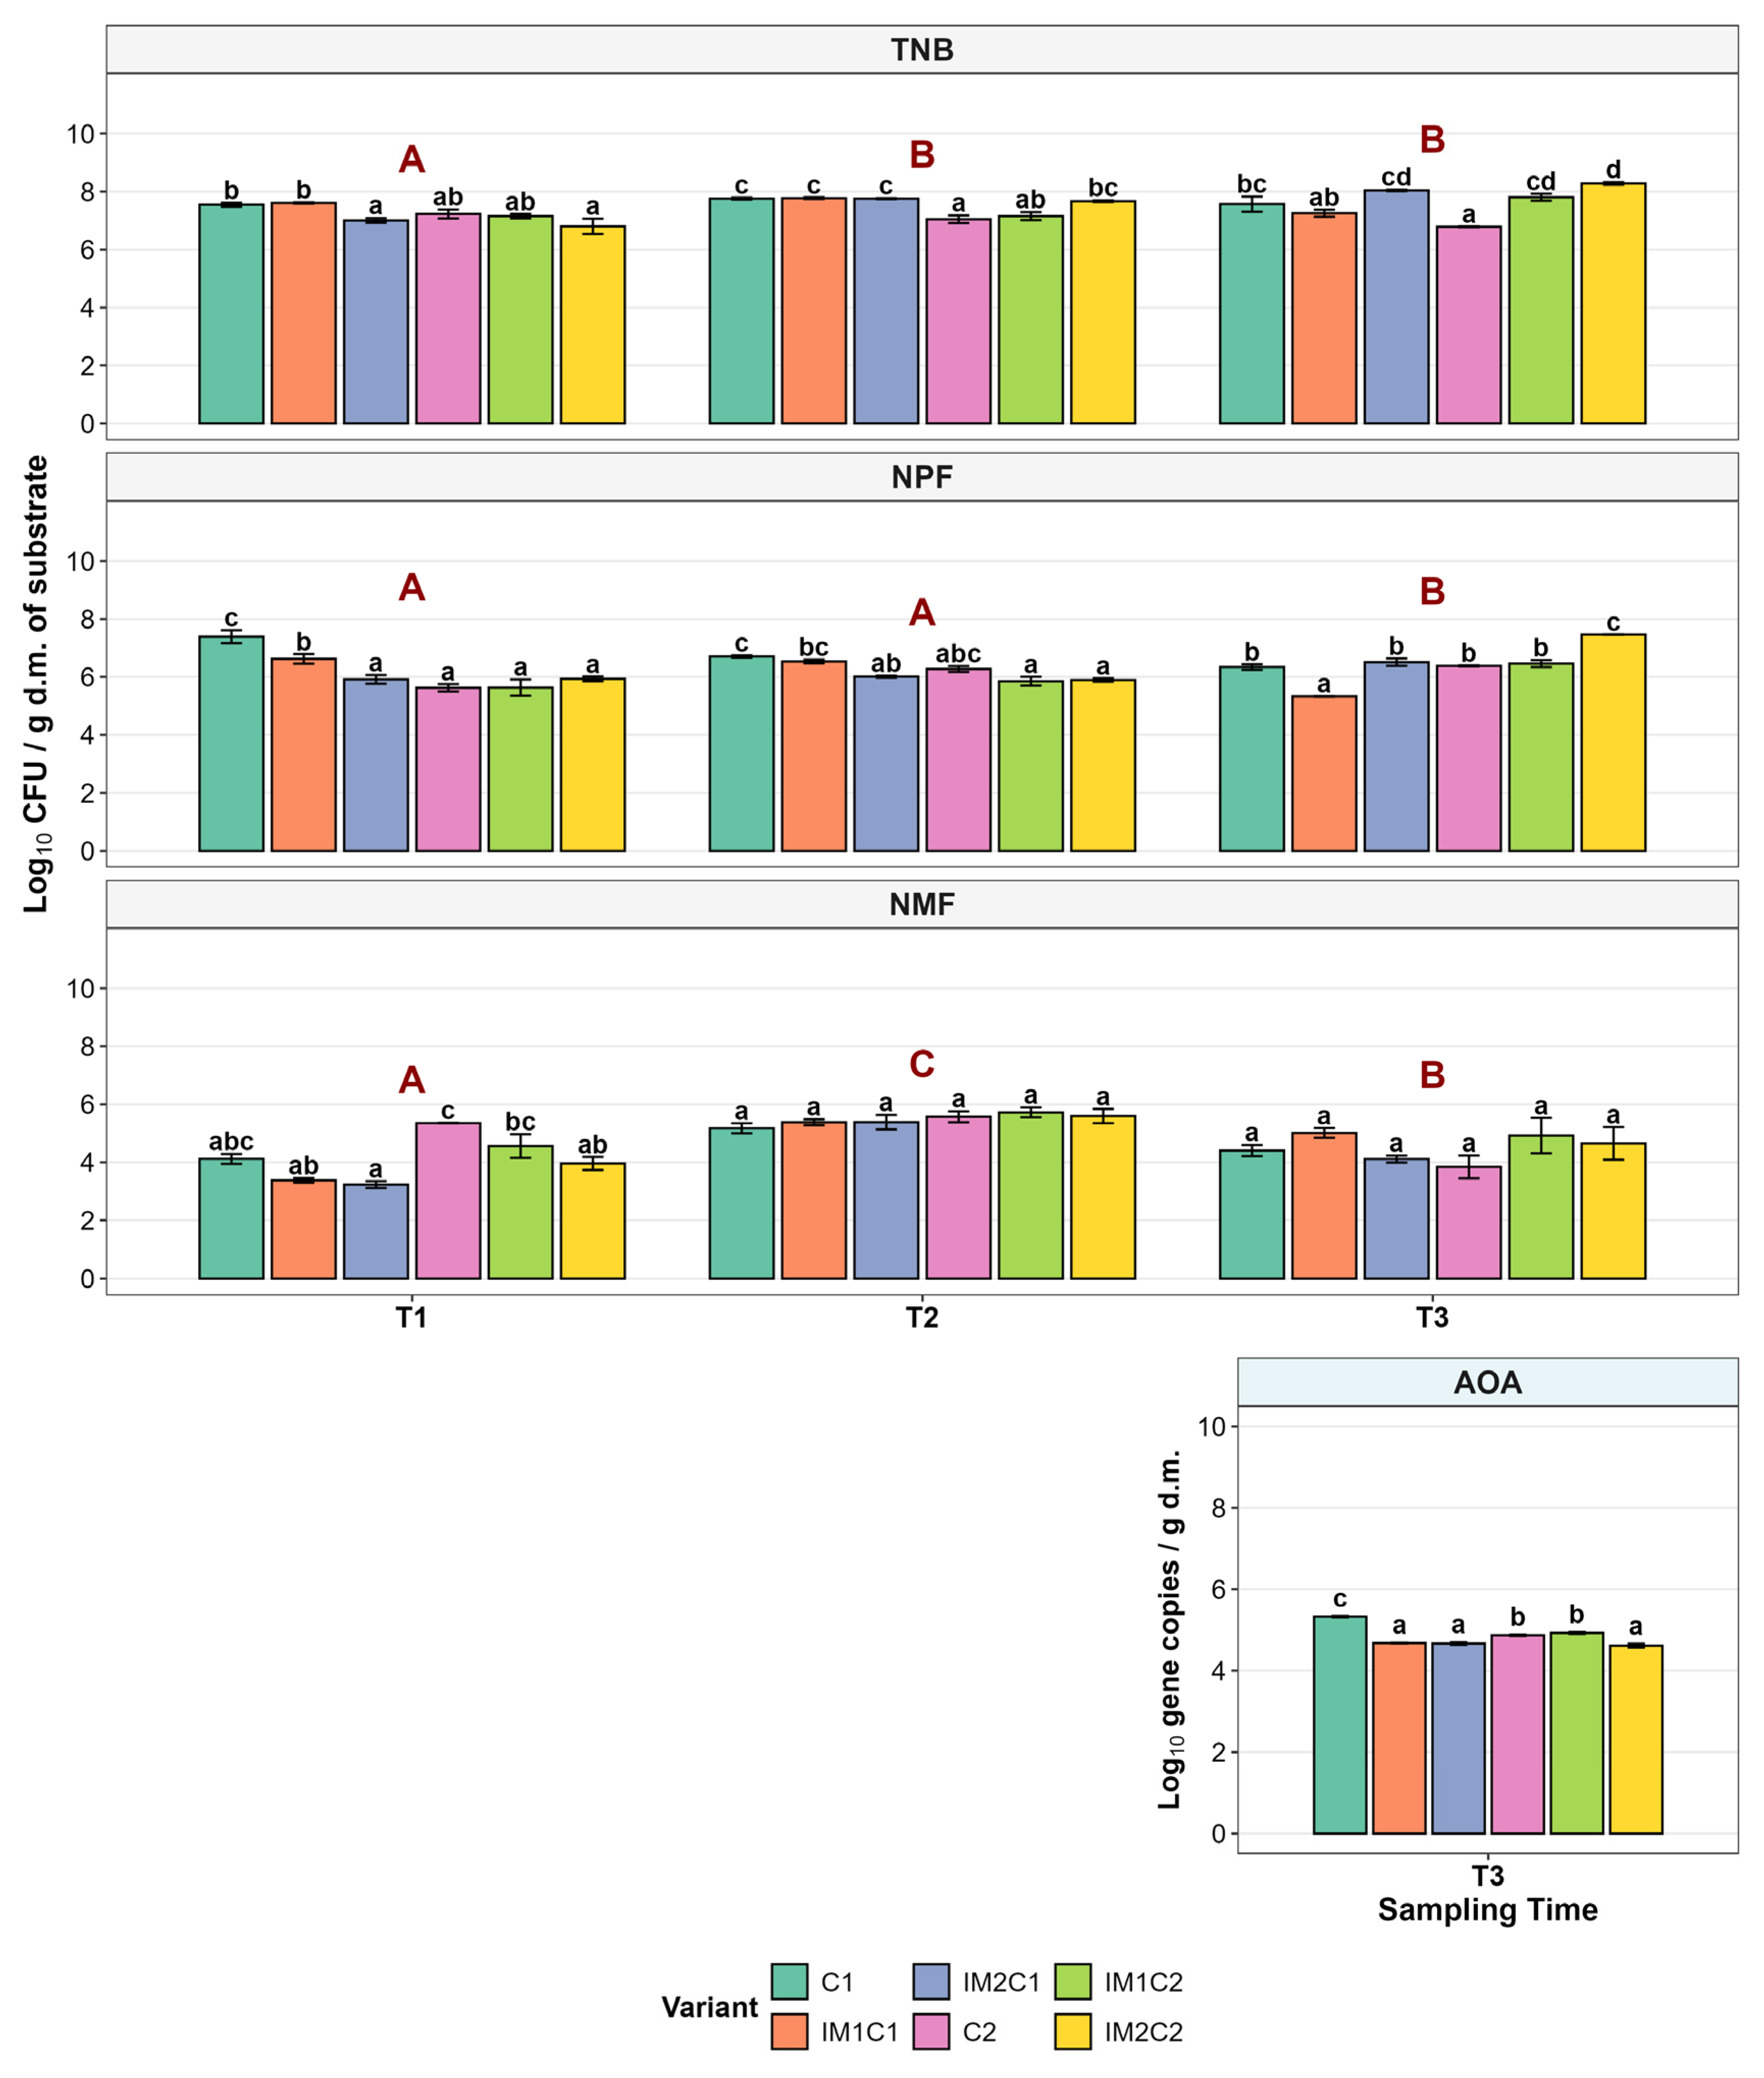
Figure 6, the abundance of selected microorganisms—including total bacterial number (TNB), the number of fluorescent
Pseudomonas (NPF), the number of molds (NMF) and the number of archaea (AOA)—is presented depending on the sampling date and experimental variants.
Figure 5.
Activity of substrate enzymes (B-Glu—β-glucosidase; DHAs—dehydrogenases) depending on the experimental variant: C1, C2—compost at a dose of 4 kg/m
2 and 8 kg/m
2, respectively; IM1, IM2—imidacloprid at a dose of 250 ng/L and 500 ng/L, respectively; T1, T2, T3—sampling time at 7 days, 21 days and 42 days after IM application, respectively; values represent means ± SEMs (
n = 3). Uppercase letters (A, B, C) indicate significant differences between sampling times (main effect of time,
p < 0.05). Lowercase letters (a, b, c, d, e, f) indicate significant differences among treatment variants within a given sampling time (interaction effect of IM dose x compost dose,
p < 0.05, Tukey’s HSD test). As shown in
Figure 6, the abundance of selected microorganisms—including total bacterial number (TNB), the number of fluorescent
Pseudomonas (NPF), the number of molds (NMF) and the number of archaea (AOA)—is presented depending on the sampling date and experimental variants.
With respect to the activity of β-glucosidase, at the first sampling time, the activity of this enzyme ranged from 38.22 µg pNP/g d.m./h (C1) to 128.62 µg pNP/g d.m./h (C2). At T2, β-Glu activity ranged from 39.74 µg pNP/g d.m./h (C1) to 157.45 µg pNP/g d.m./h (IM2C2). At T3, the activity of this enzyme ranged from 83.10 µg pNP/g d.m./h (C2) to 227.14 µg pNP/g d.m./h (IM2C2). In general, β-Glu activity increased over the course of the experiment for most variants, with IM2 (IM2C1, IM2C2) reaching a maximum at T3. In variant C1, this activity remained at a low, similar level at T1 and T2 before increasing at T3. In variant C2, the highest activity was observed at T1, followed by a decrease at T2 and T3.
The DHA activity of the substrate also differed significantly across sampling times. With respect to DHA activity, in the samples collected at the first time point (T1), the highest values were recorded in IM1C2 (152.08 µg TTC/g d.m./20 h), while the lowest were in IM1C1 (15.77 µg TTC/g d.m./20 h). At T2, the activity of this enzyme ranged from 28.40 µg TTC/g d.m./20 h (IM2C1) and 28.53 µg TTC/g d.m./20 h (IM2C2) to 174.87 µg TTC/g d.m./20 h (C1). At the T3 sampling time, the highest activity was observed for IM2C1 (approx. 167.27 µg TTC/g d. m./20 h), and the lowest was for C2 (33.93 µg TTC/g d.m./20 h). When analyzing the differences in DHA activity depending on the compost dose, at T1 and T2, the C2 variant exhibited DHA activity that was higher than or similar to that of C1, whereas at T3, the DHA activity values in C1 were higher than those in C2. Taking into account the effect of the IM dose, it was noted that at T1, higher DHA activity was recorded for the IM1 variants compared to IM2; at T2, the IM1C1 values exceeded those of IM2C1; at T3, the relationship was reversed, with IM2 (IM2C1, IM2C2) exhibiting significantly higher DHA activity than the corresponding IM1 variants.
The total number of microorganisms in the substrate varied significantly depending on the experimental treatment and the time of sampling. Analyzing TNB, at time T1, the TNB values ranged from approximately 6.8 (IM2C2) to 7.6 log10 CFU/g d.m. (IM1C1), although the differences between most variants were not statistically significant. At T2, bacterial counts were generally higher and more balanced (ranging from 7.05 to 7.77 log10 CFU/g d.m.), with the lowest value for C2 and the highest for C1, IM1C1 and IM2C1. At time point T3, the greatest variation was observed—the highest TNB value was recorded for IM2C2 (8.28 log10 CFU/g d.m.), and the lowest was for C2 (6.79 log10 CFU/g d.m.). The overall trend indicates an increase in TNB at successive measurement time points for most variants, which was most pronounced for IM2C1 and IM2C2.
Considering NPF, at the T1 time sampling, the highest abundance of these microorganisms was reported for C1 (7.39 log10 CFU/g d.m.) and the lowest for C2 and IM1C2 (5.63 log10 CFU/g d.m.). At T2, the highest number was again recorded for C1 (6.71 log10 CFU/g d.m.), while the lowest was for IM1C2 (5.85 log10 CFU/g d.m.) and IM2C2 (5.89 log10 CFU/g d.m.). At T3, the NPF level ranged from 5.33 log10 CFU/g d.m. (IM1C1) to 7.46 log10 CFU/g d.m. (IM2C2). Analyzing the obtained data, the NPF abundance increased over time, mainly in the variants with a higher compost dose (C1, IM1C2 and IM2C1).
Regarding the number of mold fungi (NMF), it was noted that at T1, this ranged from 3.23 log10 CFU/g dry matter (IM2C1) to 5.35 log10 CFU/g dry matter (C2). At T2, the NMF values were consistent across all test variants, ranging from 5.17 (C1) to 5.72 log10 CFU/g d.m. (IM1C2). At T3, the number of microorganisms analyzed ranged from 3.84 log10 CFU/g d.m. (C2) to 5.01 log10 CFU/g d.m. (IM1C1). Generally, the NMF abundance increased from T1 to T2 for most variants, followed by a decrease at T3 to a level similar to that in T1. The greatest variation between T1 and T3 was observed for IM1C1 and C2.
Analyzing the number of AOA gene copies in the individual experimental variants, it was found that the highest values were observed for C1 (4.93 log10 gene copies/g d.m.), whereas the lowest were for IM2C2 (4.62 log10 gene copies/g d.m.).
Figure 6.
Abundance of selected microorganisms in substrate (TNB—total number of bacteria; NPF—number of fluorescent Pseudomonas; NMF—number of mold fungi, AOA—ammonia-oxidizing archaea) depending on the experimental variant: C1, C2—compost at a dose of 4 kg/m2 and 8 kg/m2, respectively; IM1, IM2—imidacloprid at a dose of 250 ng/L and 500 ng/L, respectively; T1, T2, T3—sampling time at 7 days, 21 days and 42 days after IM application, respectively; values represent means ± SEMs (n = 3). Uppercase letters (A, B, C) indicate significant differences between sampling times (main effect of time, p < 0.05). Lowercase letters (a, b, c, d) indicate significant differences among treatment variants within a given sampling time (interaction effect of IM dose x compost dose, p < 0.05, Tukey’s HSD test).
Figure 6.
Abundance of selected microorganisms in substrate (TNB—total number of bacteria; NPF—number of fluorescent Pseudomonas; NMF—number of mold fungi, AOA—ammonia-oxidizing archaea) depending on the experimental variant: C1, C2—compost at a dose of 4 kg/m2 and 8 kg/m2, respectively; IM1, IM2—imidacloprid at a dose of 250 ng/L and 500 ng/L, respectively; T1, T2, T3—sampling time at 7 days, 21 days and 42 days after IM application, respectively; values represent means ± SEMs (n = 3). Uppercase letters (A, B, C) indicate significant differences between sampling times (main effect of time, p < 0.05). Lowercase letters (a, b, c, d) indicate significant differences among treatment variants within a given sampling time (interaction effect of IM dose x compost dose, p < 0.05, Tukey’s HSD test).
3.2. IM Content in Substrate and Shoots of Rapeseed
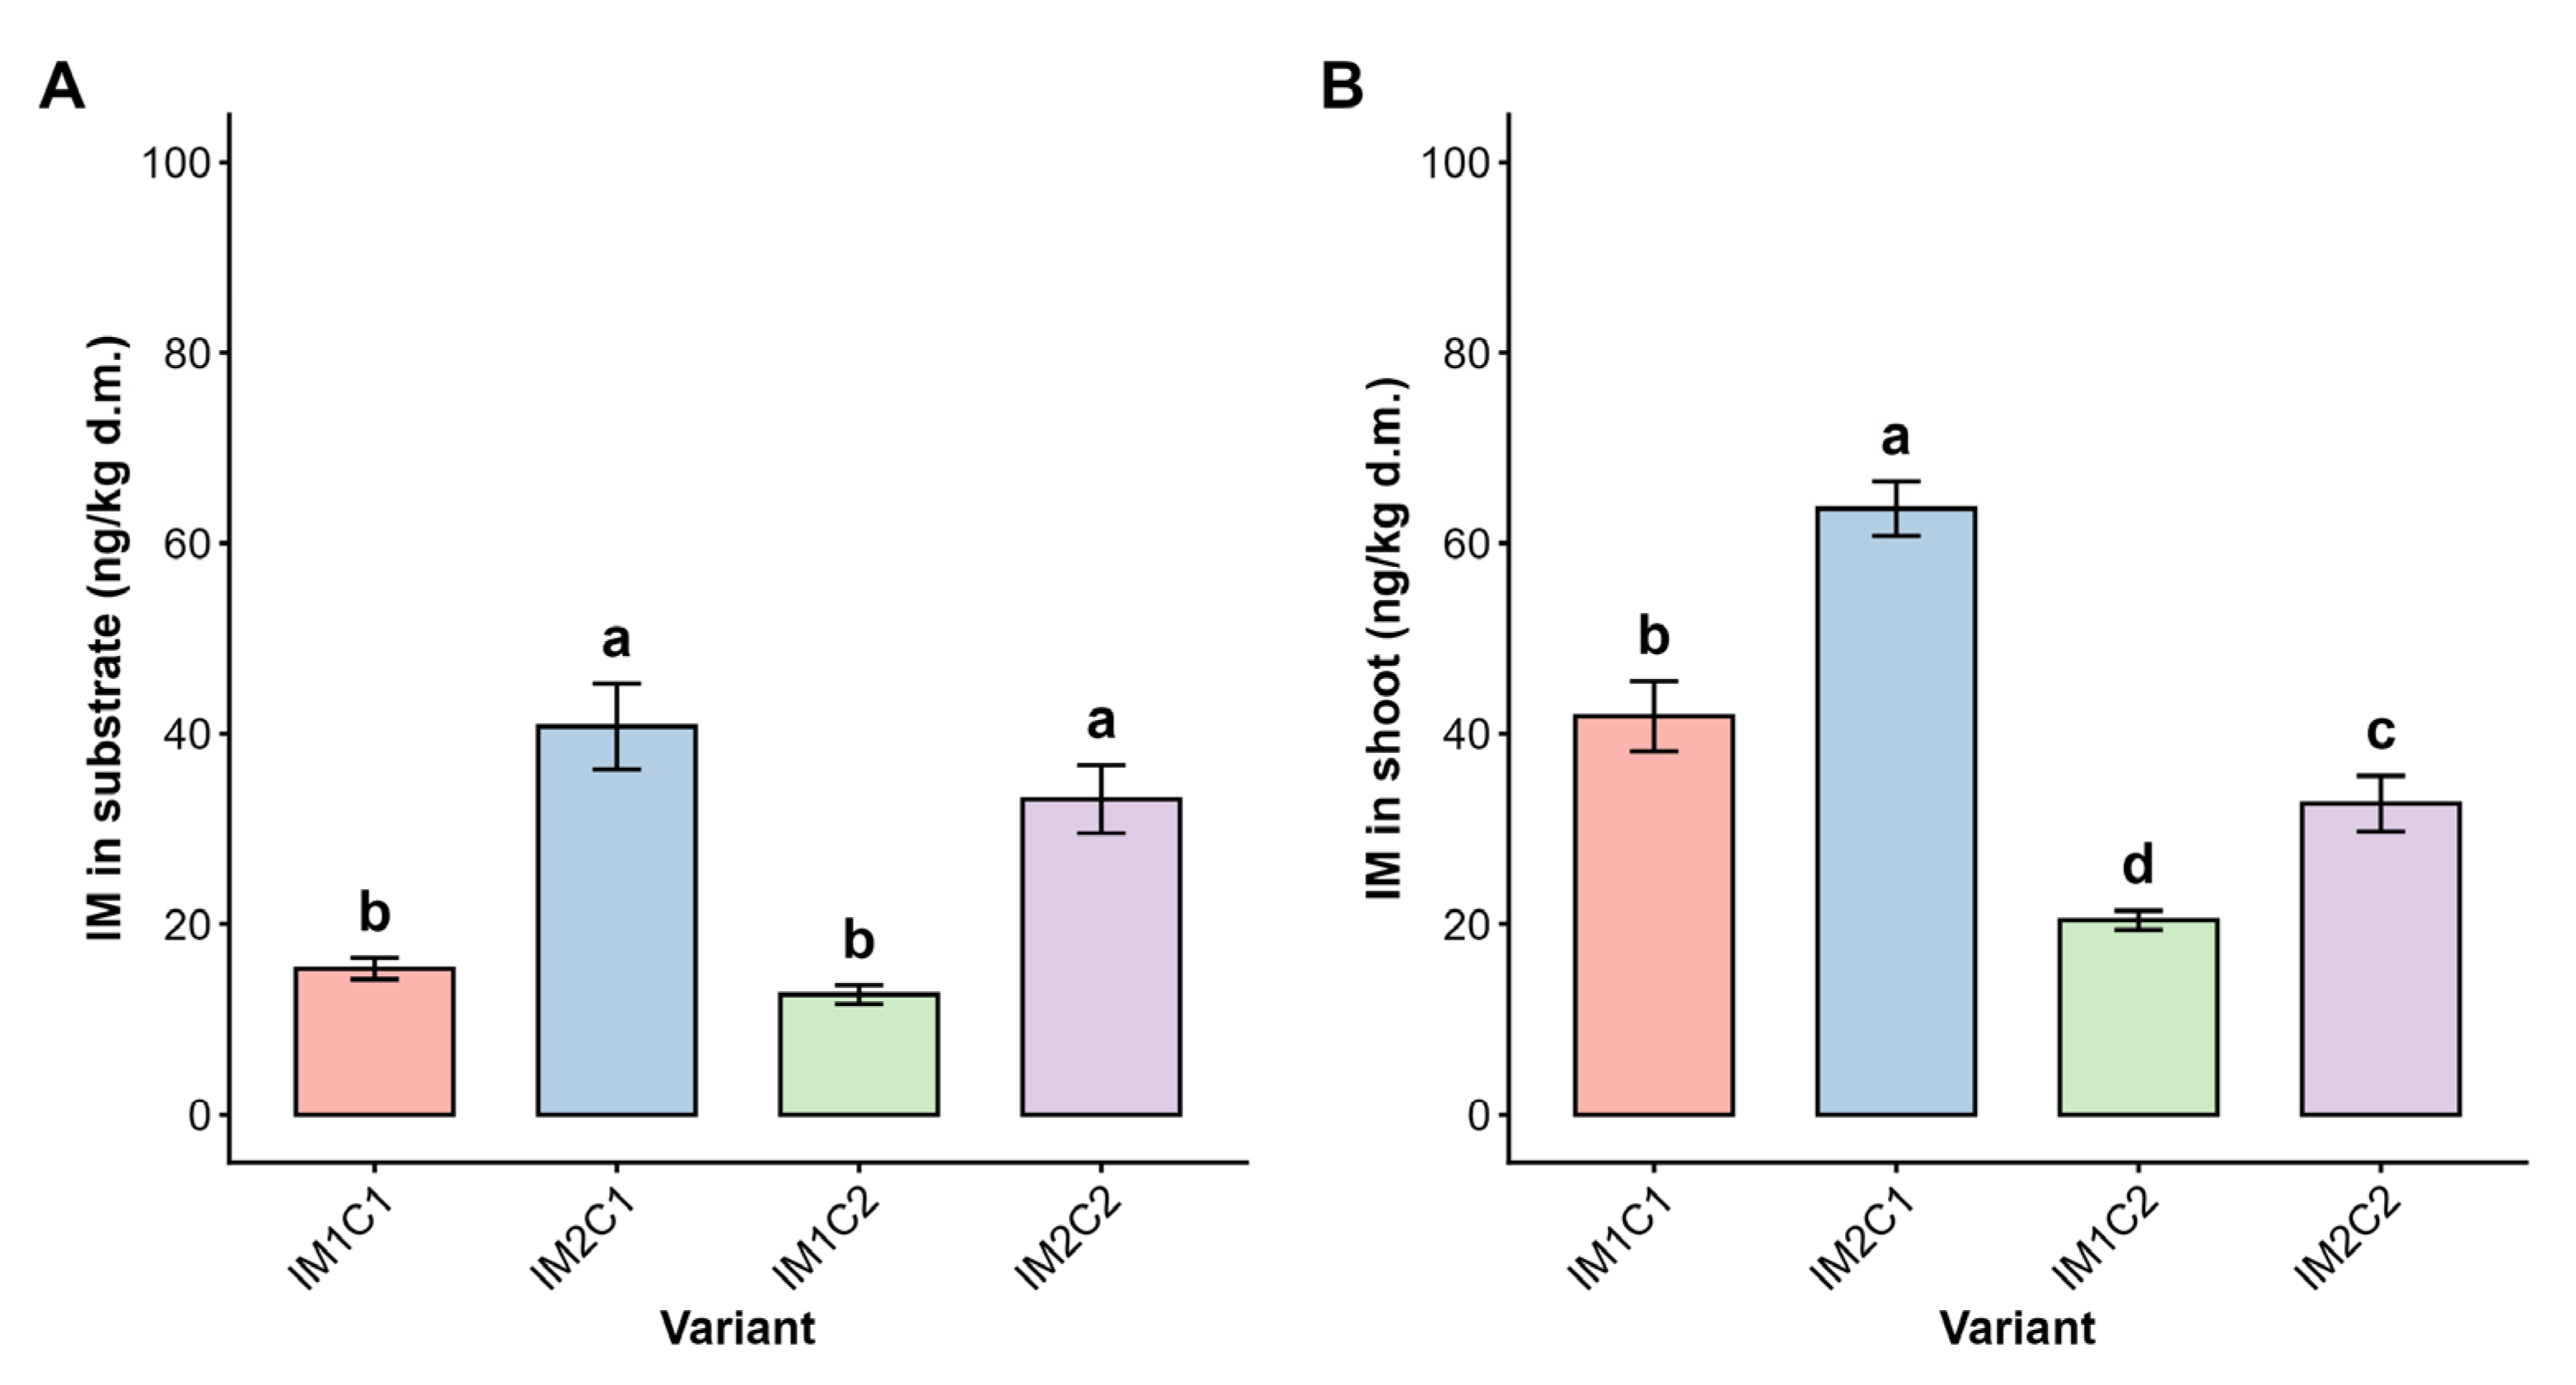
According to the results presented in
Figure 7A, the highest IM content in the substrate was detected for the IM2C1 variant (40.75 ng/kg d.m.), while the lowest was observed for IM1C2 (12.60 ng/kg d.m.) and IM1C2 (15.31 ng/kg d.m.). In general, significantly higher imidacloprid concentrations in the substrate were recorded in the variants containing IM2 than in those containing IM1.
Based on the IM content in the rapeseed shoots (
Figure 7B), the lowest values were recorded in the IM1C2 treatment (20.41 ng/kg d.m.), with the highest in the IM2C1 variant (63.63 ng/kg d.m.). When comparing the variants with IM1 and IM2, similarly to the substrate, the variants with IM2 exhibited a higher IM content in the above-ground parts than their corresponding IM1 variants. Furthermore, in substrates with C1 and C2, for both the IM1 and IM2 variants, the IM content in the above-ground parts of plants grown on substrate with C1 (IM1C1, IM2C1) was significantly higher than those grown on substrate with C2 (IM1C2, IM2C2).
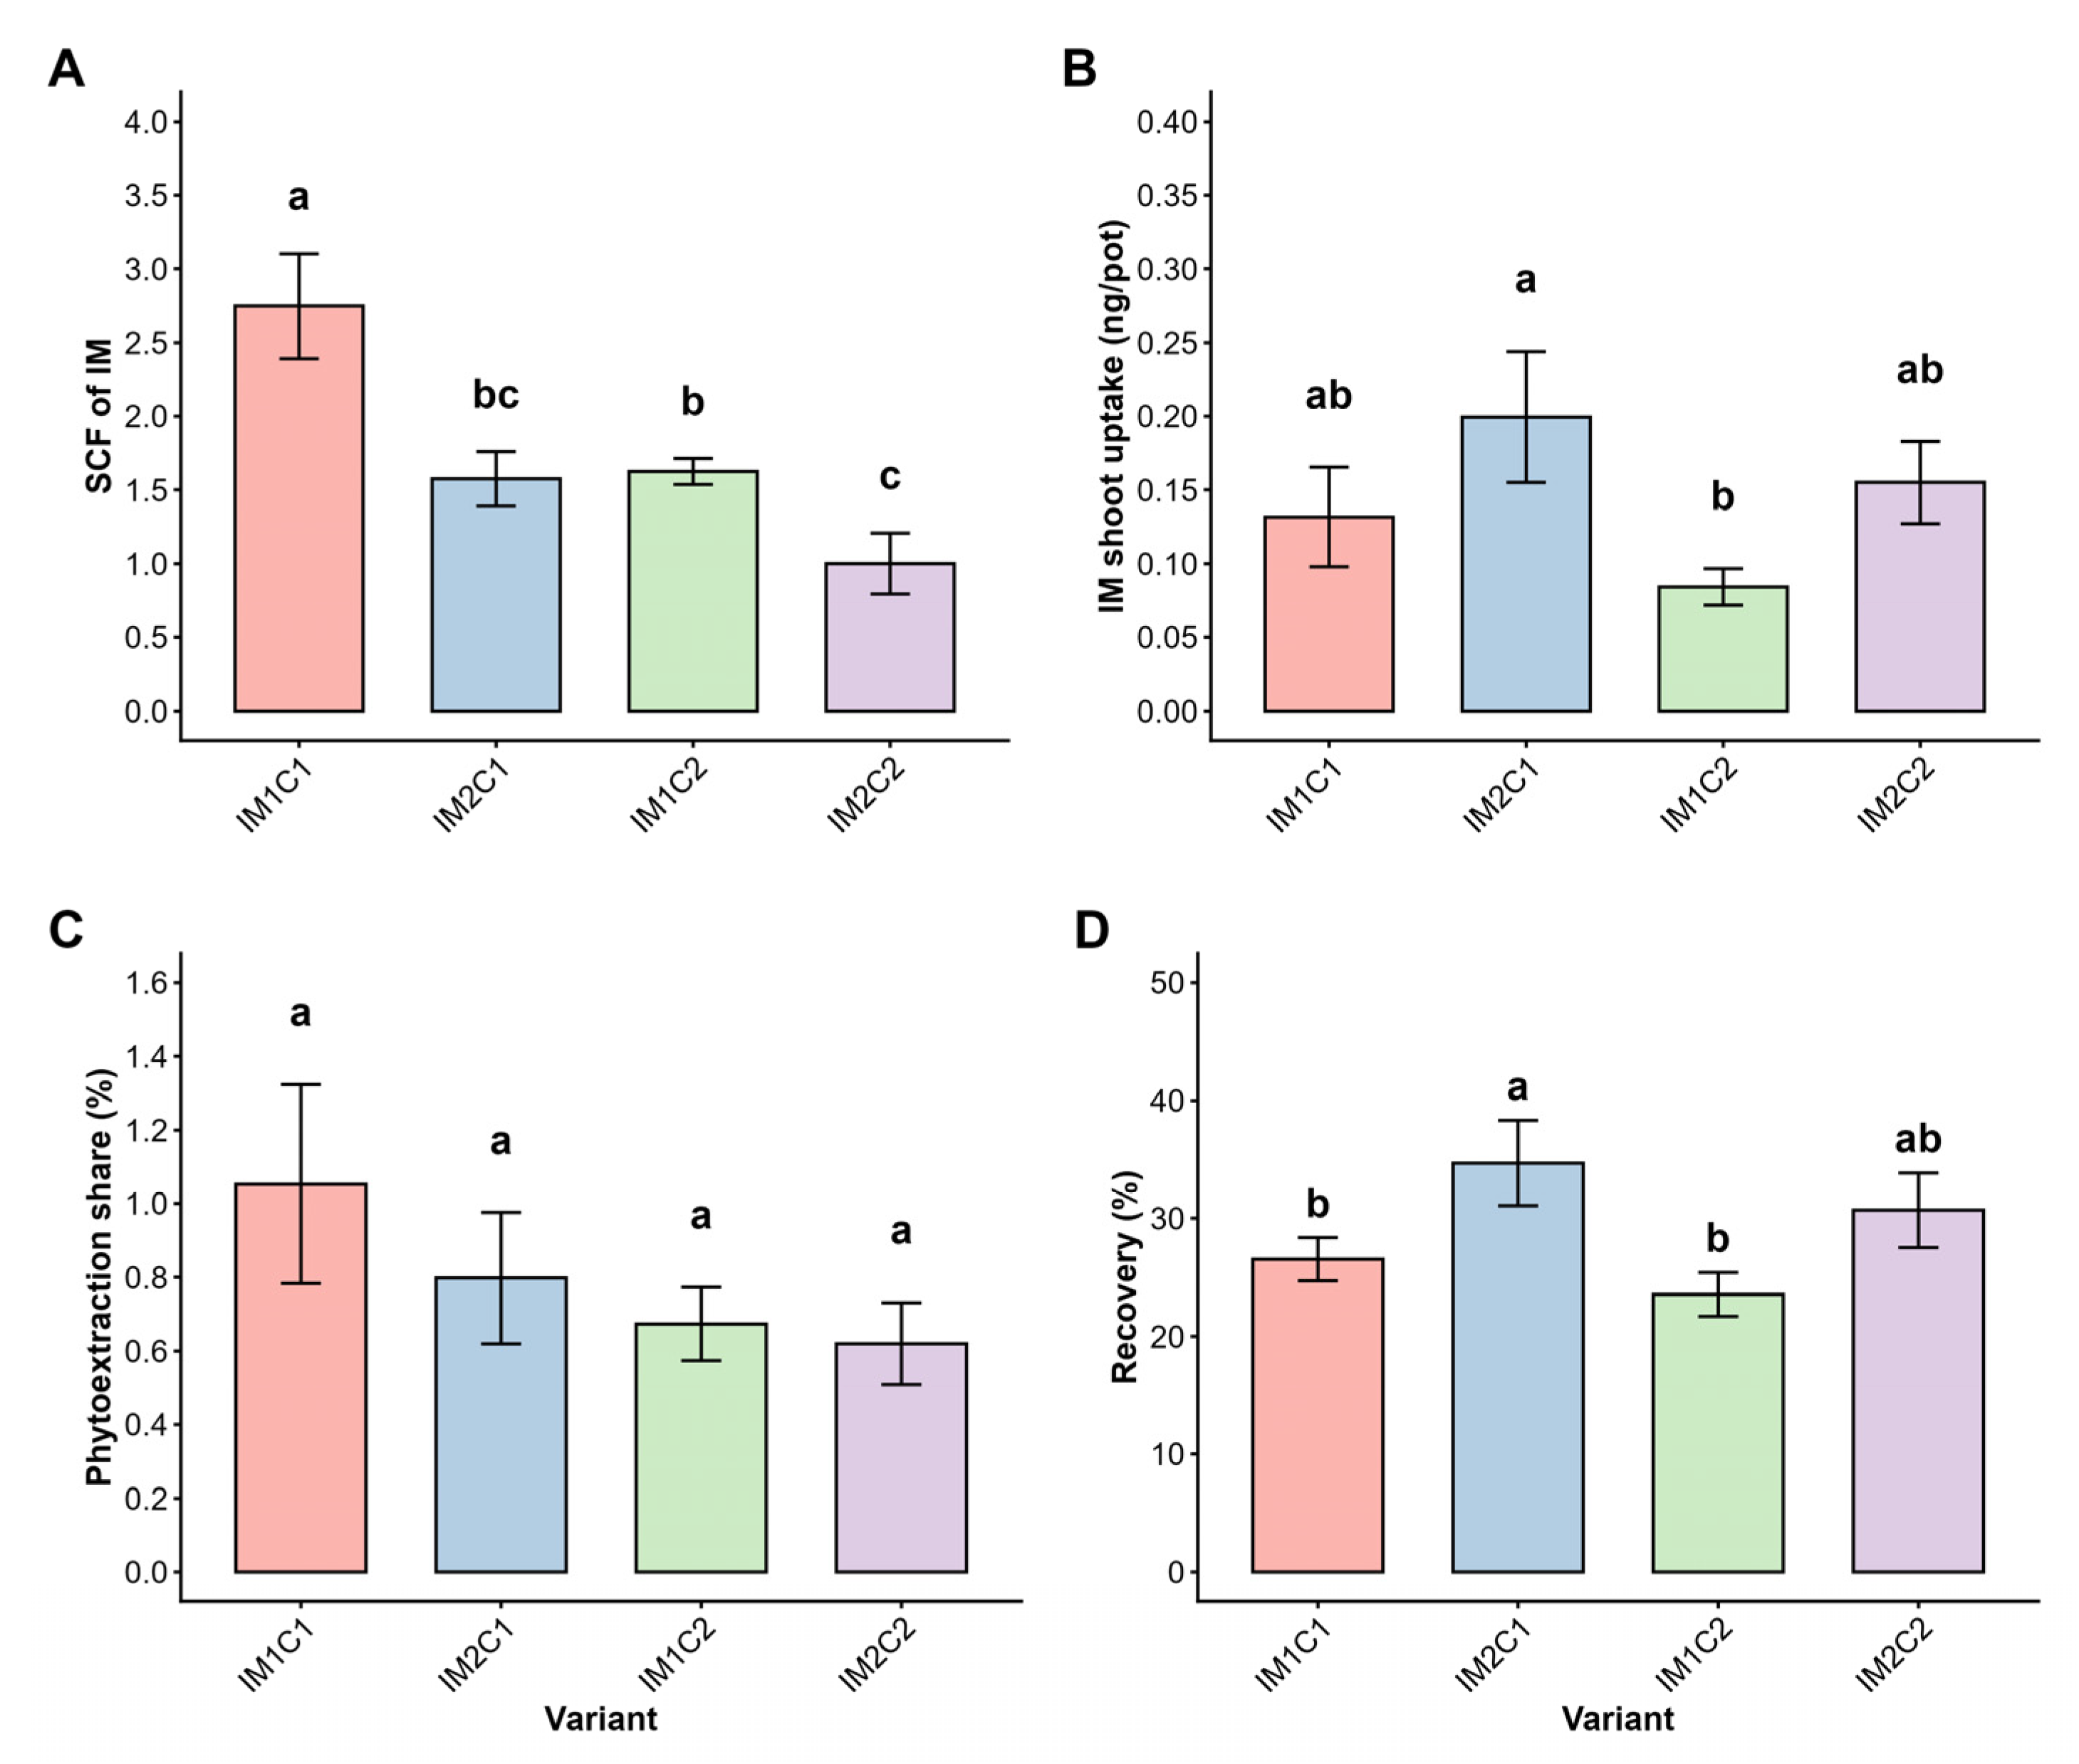
3.3. Shoot Concentration Factor (SCF), Shoot Uptake, Phytoextraction Share and IM Recovery
In
Figure 8, the main parameters related to determining the efficiency of contaminant uptake by plants are summarized: the shoot concentration factor (SCF), uptake by rapeseed shoot biomass (Shoot uptake), the percentage phytoextraction rate of IM by rapeseed (Phytoextraction share) and the percentage recovery of the pesticide in rapeseed shoots and in the growing medium relative to the initial value in the pot (Recovery).
As shown in
Figure 8A, the SCF ranged from 1.0 (IM2C2) to 2.75 (IM1C1). The IM2C1 and IM1C2 variants exhibited similar, intermediate SCF values, which were 43% and 41% lower than the IM1C1 value, respectively.
The highest IM uptake in the above-ground parts (
Figure 8B) was recorded for the IM2C1 variant (0.20 ng/pot), and the lowest was for the IM1C2 variant (0.08 ng/pot). When comparing substrates with C1 and C2, for both the IM1 and IM2 variants, IM uptake was significantly higher in the C1 substrate than in the C2 substrate.
According to the data in
Figure 8C, the highest rate of phytoextraction in rapeseed shoots was observed for variant IM1C1 (1.05%), and the lowest was for variant IM2C2 (0.62%). Despite the apparent differences between the mean values, no significant differences were noted between the variants under study. When comparing the substrates according to compost dose, a trend towards a higher phytoextraction rate was observed for the C1 variants compared with the C2 variants.
The highest IM recovery in the system (
Figure 8D) was observed for the IM2C1 variant (35%), and the lowest was for IM1C2 (24%) and IM1C1 (27%). Generally, more IM remained in the system in the variants with a higher IM dose (IM2C1 and IM2C2), but the greatest loss of imidacloprid in the system was recorded in the variants containing IM1 (approx. 75%; IM1C1 and IM1C2).
3.4. Links Between Studied Parameters
As shown in
Figure 9A, the correlation analysis revealed strong, positive correlations between the parameters describing the accumulation and uptake of imidacloprid in the plant–substrate system. The strongest correlation was observed between the IM content in the above-ground parts (IM_shoot) and the IM uptake by the shoot (IM_shoot_uptake; r = 0.93;
p < 0.001) and recovery (r = 0.90;
p < 0.001), as well as between IM_shoot_uptake and the phytoextraction share (Phytoext_share; r = 0.86;
p < 0.001) and between recovery and the phytoextraction share (r = 0.84,
p < 0.001). A strong positive correlation was also found between the IM content in the substrate (IM_substrate) and the IM content in shoots (r = 0.88,
p < 0.001), and between IM_substrate and IM_shoot_uptake (r = 0.89;
p < 0.001).
Among the biological parameters, the total number of bacteria (TNB_log10) was positively correlated with parameters such as the IM shoot uptake (r = 0.60; p = 0.009) and recovery (r = 0.66, p = 0.003). The activity of β-Glu was positively correlated with IM shoot uptake (r = 0.47, p = 0.0498) and recovery (r = 0.57, p < 0.013), while DHA activity was positively correlated with IM shoot (r = 0.84, p < 0.001), IM shoot uptake (r = 0.88, p < 0.001), phytoextraction share (r = 0.62, p = 0.0172) and recovery (r = 0.89, p < 0.001).
Strong negative correlations were also observed between the pH value and parameters describing the uptake and accumulation of imidacloprid by the rapeseed shoot. There was a negative correlation between pH and the IM content in the substrate and the IM uptake by the rapeseed shoots (r = –0.84; p < 0.001), the IM content in the shoot (r = –0.87; p < 0.001), the phytoextraction share (r = –0.70; p = 0.0011) and IM recovery (r = –0.85, p < 0.001).
It was also shown that the accumulation of rapeseed dry matter of the shoot was positively correlated with the TP content (r = 0.61, p = 0.0217) and TOC content (r = 0.63, p = 0.0159) in the substrate, as well as with the number of Pseudomonas (r = 0.56, p = 0.0382). Furthermore, significant positive correlations were found between the contents of TP, TN and TOC in the substrate and the number of Pseudomonas NPF (TN: r = 0.66, p = 0.0099; TP: r = 0.57, p = 0.0356; TOC: r = 0.75, p = 0.0015) and between the TN and the total number of bacteria (r = 0.59, p = 0.0265).
Taking into account the effect of IM in the substrate on the biological parameters, a positive correlation was found between the IM substrate and TNB (r = 0.72, p < 0.001) and DHA (r= 0.96, p < 0.001), and a negative correlation was found between the IM content in the substrate and the abundance of AOA (r = –0.73, p = 0.0024).
Figure 9B, which presents the PCA, shows that the first two principal components together accounted for 75.8% of the total variance in the data (PC1—49.1%, PC2—26.7%). Control variants C1 and C2 clearly separated along PC1 (negative values) from the IM-added variants, clustering adjacent to the pH and log10_AOA vectors. On the opposite side of the array (positive PC1), the IM_substrate, IM_shoot, IM_shoot_uptake, SCF_IM, Recovery, and DHA vectors were located in the immediate vicinity of the IM1C1 and IM2C1 variants. The shoot_biomass vector was directed almost perpendicularly to the PC1 axis (towards positive PC2 values, close to the TOC, TP, and NPF_log10 vectors).
5. Conclusions
The conducted pot study allowed for the assessment of the phytoremediation potential of rapeseed (Brassica napus L.) against imidacloprid and for the determination of how the use of different doses of sewage sludge-based compost and the pesticide dose modify the microbiological and enzymatic activity of the substrate.
The use of compost at a higher dose significantly increased the organic matter and nutrient content of the substrate, which translated into increased enzymatic activity (β-glucosidase, dehydrogenases) and the abundance of selected groups of heterotrophic microorganisms compared to the lower rate of substrate. However, the presence of imidacloprid was shown to have a negative effect on the abundance of ammonia-oxidizing archaea (AOA), and this effect was mitigated by compost at a higher dose and only at a lower pesticide dose.
The higher compost dose significantly increased the production of above-ground rapeseed biomass, a beneficial effect supporting the use of this plant in phytoremediation programs. However, this did not translate into a proportional increase in phytoextraction efficiency—the shoot concentration coefficient and the share of phytoextraction in the total imidacloprid mass balance remained low in all treatments, and in treatments with a higher organic matter content and higher doses of the compound, a decrease in the relative efficiency of its uptake by plants was observed. The results suggest that the compost dose should be adjusted to the imidacloprid level in the substrate. At lower concentrations, better phytoextraction is observed with the lower compost dose, but it is still very low. This indicates that the role of rapeseed in the studied phytoremediation system was achieved less through direct phytoextraction and more through accompanying processes with several possible pathways for loss or transformation of the relationship that were not resolved in this study.
The use of different doses of compost produced from sewage sludge as an amendment supporting phytoremediation is in line with the principles of the circular economy and the UN Sustainable Development Goals, including SDG 6: Clean Water and Sanitation and SDG 12: Responsible Consumption and Production.
The obtained results indicate the need for further research, mainly in the IM root concentration, identification of IM metabolites in the experimental system and the detection of specific taxa and metabolic pathways responsible for the microbial degradation of imidacloprid, including in field conditions. Furthermore, a longer duration of the experiment, covering the full growing season or several crop cycles, would allow for a more reliable assessment of the long-term effectiveness of the proposed remediation system and the durability of the observed microbiological effects and is a recommended direction for future research.




 ,
,