3.1. Dendrometric Structure and Field-Derived Above-Ground Biomass
The field inventory included 661 trees distributed among three species/health-status groups: 467 individuals of
Pinus halepensis, 122 healthy individuals of
Cedrus atlantica, and 72 declining individuals of
Cedrus atlantica. The dendrometric characteristics of the sampled trees are summarized in
Table 5.
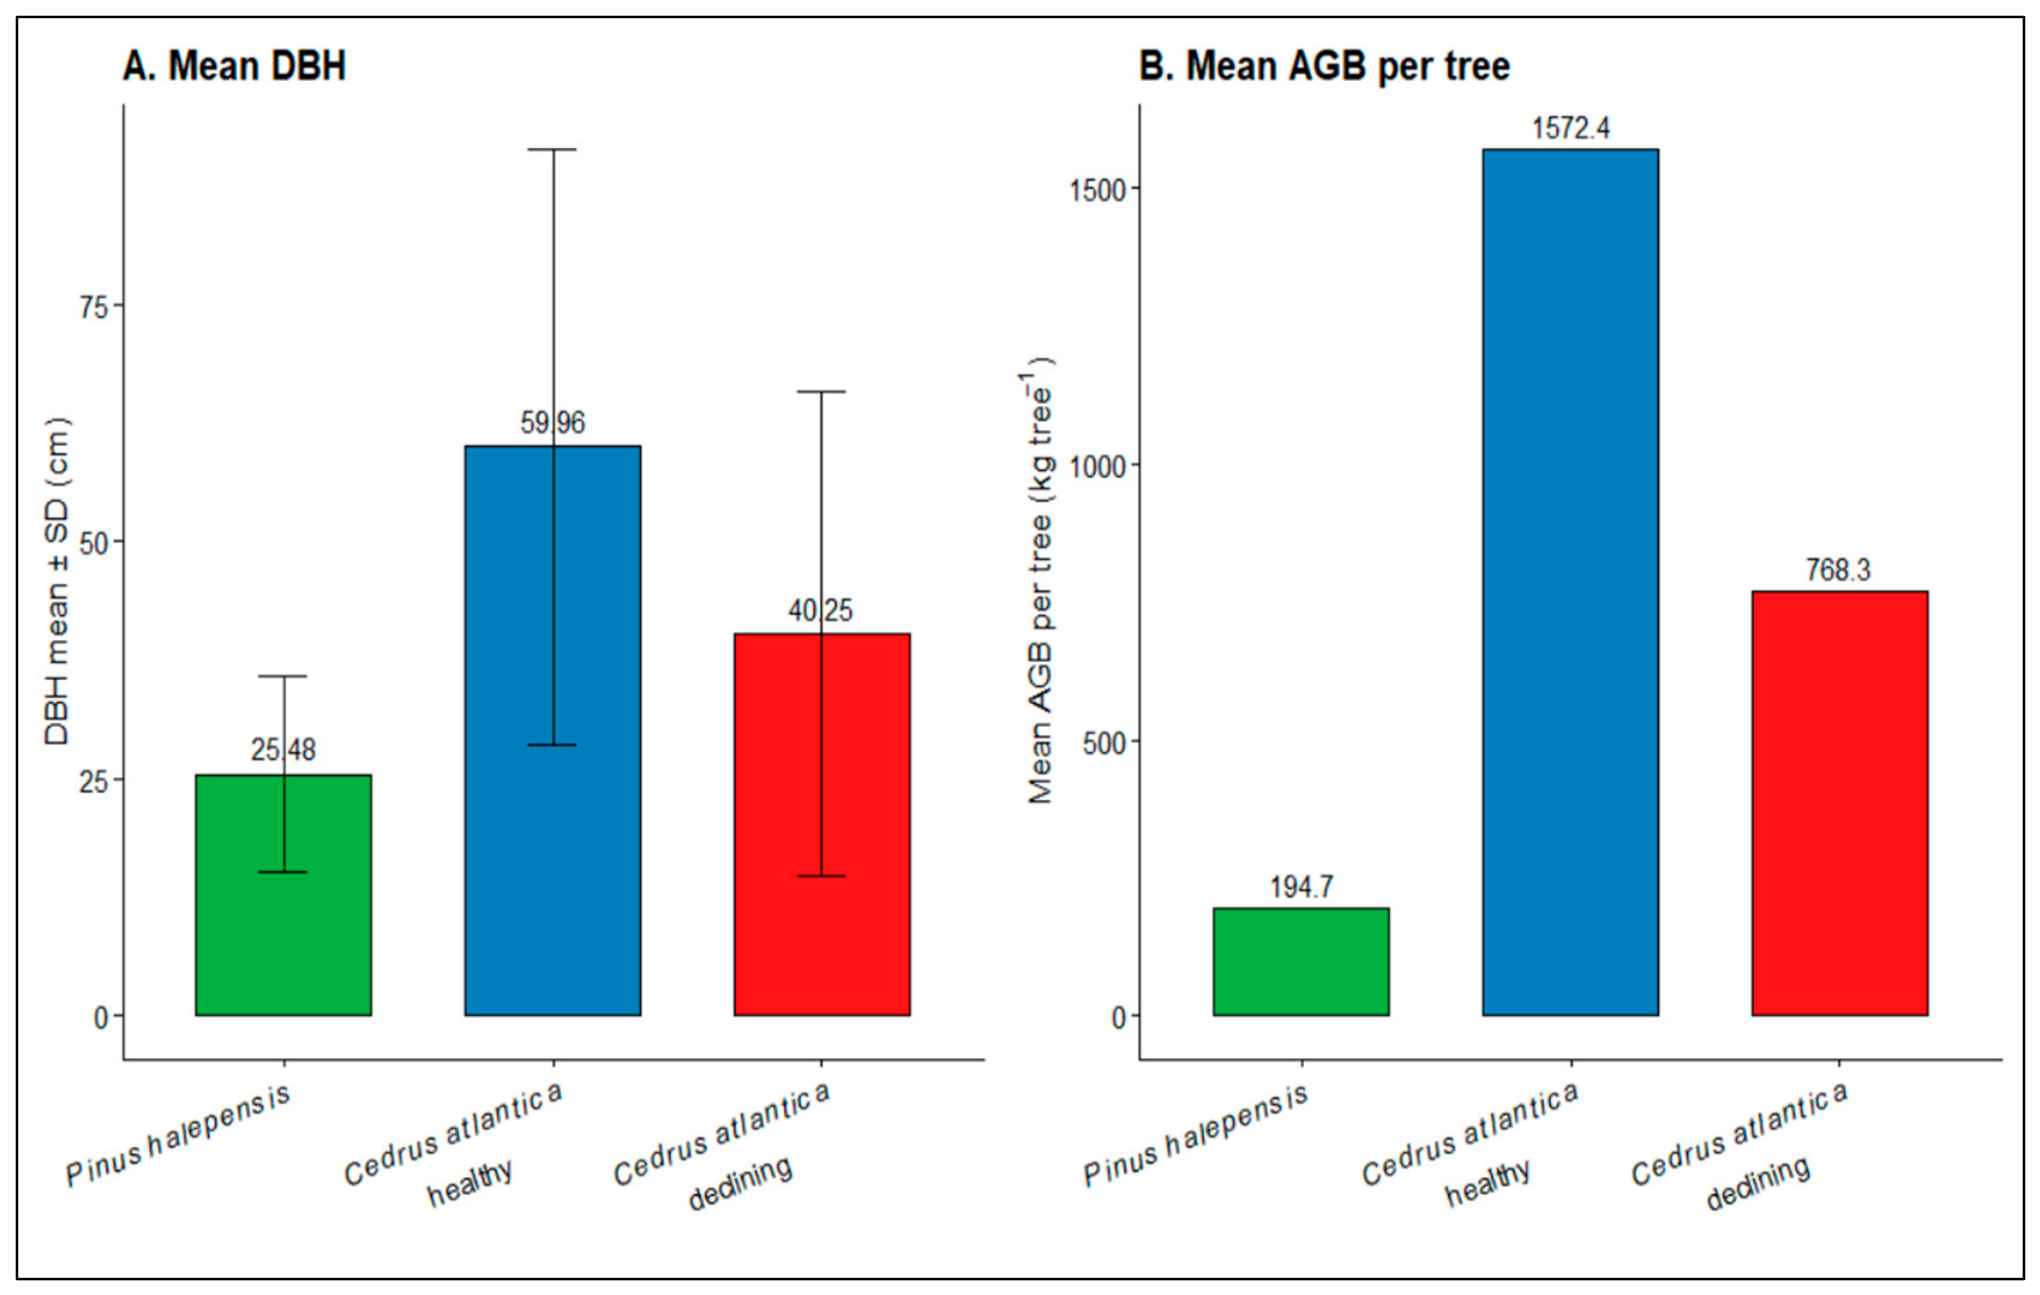
The results show clear structural differences among species and health-status classes. Healthy
Cedrus atlantica trees exhibited the highest mean DBH and the highest mean above-ground biomass per tree, whereas declining cedar individuals showed lower DBH and lower biomass values.
Pinus halepensis represented the largest number of measured trees but had lower mean DBH, height, and individual biomass compared with cedar trees [
6] (
Figure 6).
The comparison of dendrometric characteristics and individual above-ground biomass revealed that healthy
Cedrus atlantica trees stored the highest mean AGB per tree, reaching 1572.4 kg tree
−1. Declining
Cedrus atlantica individuals stored 768.3 kg tree
−1, indicating a reduction of approximately 51% compared with healthy cedar trees. In contrast,
Pinus halepensis showed the lowest mean AGB per tree, with 194.7 kg tree
−1, despite being the most abundant species in the inventory [
23].
These results indicate that healthy Atlas cedar trees contribute disproportionately to above-ground biomass storage because of their larger stem diameter and higher individual biomass [
5]. The lower biomass observed in declining cedar trees suggests that health status may influence biomass accumulation and carbon storage, which is consistent with previous studies reporting growth decline, dieback, and productivity reduction in drought-stressed Atlas cedar forests [
7]. This structural contrast also supports the use of species-specific allometric equations for estimating forest biomass and carbon stocks, because biomass allocation varies among species, tree size classes, and ecological conditions [
17].
3.2. Field-Derived Above-Ground Biomass by Species and Plot
Species-specific allometric equations applied to the 54 stocked plots yielded a total AGB of 338.07 Mg over the sampled area. Pinus halepensis contributed 90.93 Mg, representing 26.9% of total AGB, whereas Cedrus atlantica contributed 247.14 Mg, corresponding to 73.1% of total AGB. Although cedar trees were less abundant than pine trees, they stored the dominant biomass share because they had larger stem diameters and higher individual biomass. Healthy Cedrus atlantica showed the highest mean AGB per tree (1572.4 kg tree−1), followed by declining Cedrus atlantica (768.3 kg tree−1) and Pinus halepensis (194.7 kg tree−1). Declining cedar individuals therefore showed approximately 51% lower mean biomass than healthy cedar trees. This difference should be interpreted cautiously because tree size, age, site conditions and the use of the same allometric equation for healthy and declining cedar may influence the comparison.
At plot level, AGB showed strong spatial variability, ranging from low values in sparse or degraded plots to high values in cedar-dominated stands with large-diameter trees. The mean field-derived AGB was 62.61 Mg ha
−1, reflecting the heterogeneous structure of the Ouled Yagoub Forest, where young pine stands, open formations, declining cedar patches, and mature cedar stands coexist within the same massif (
Table 6).
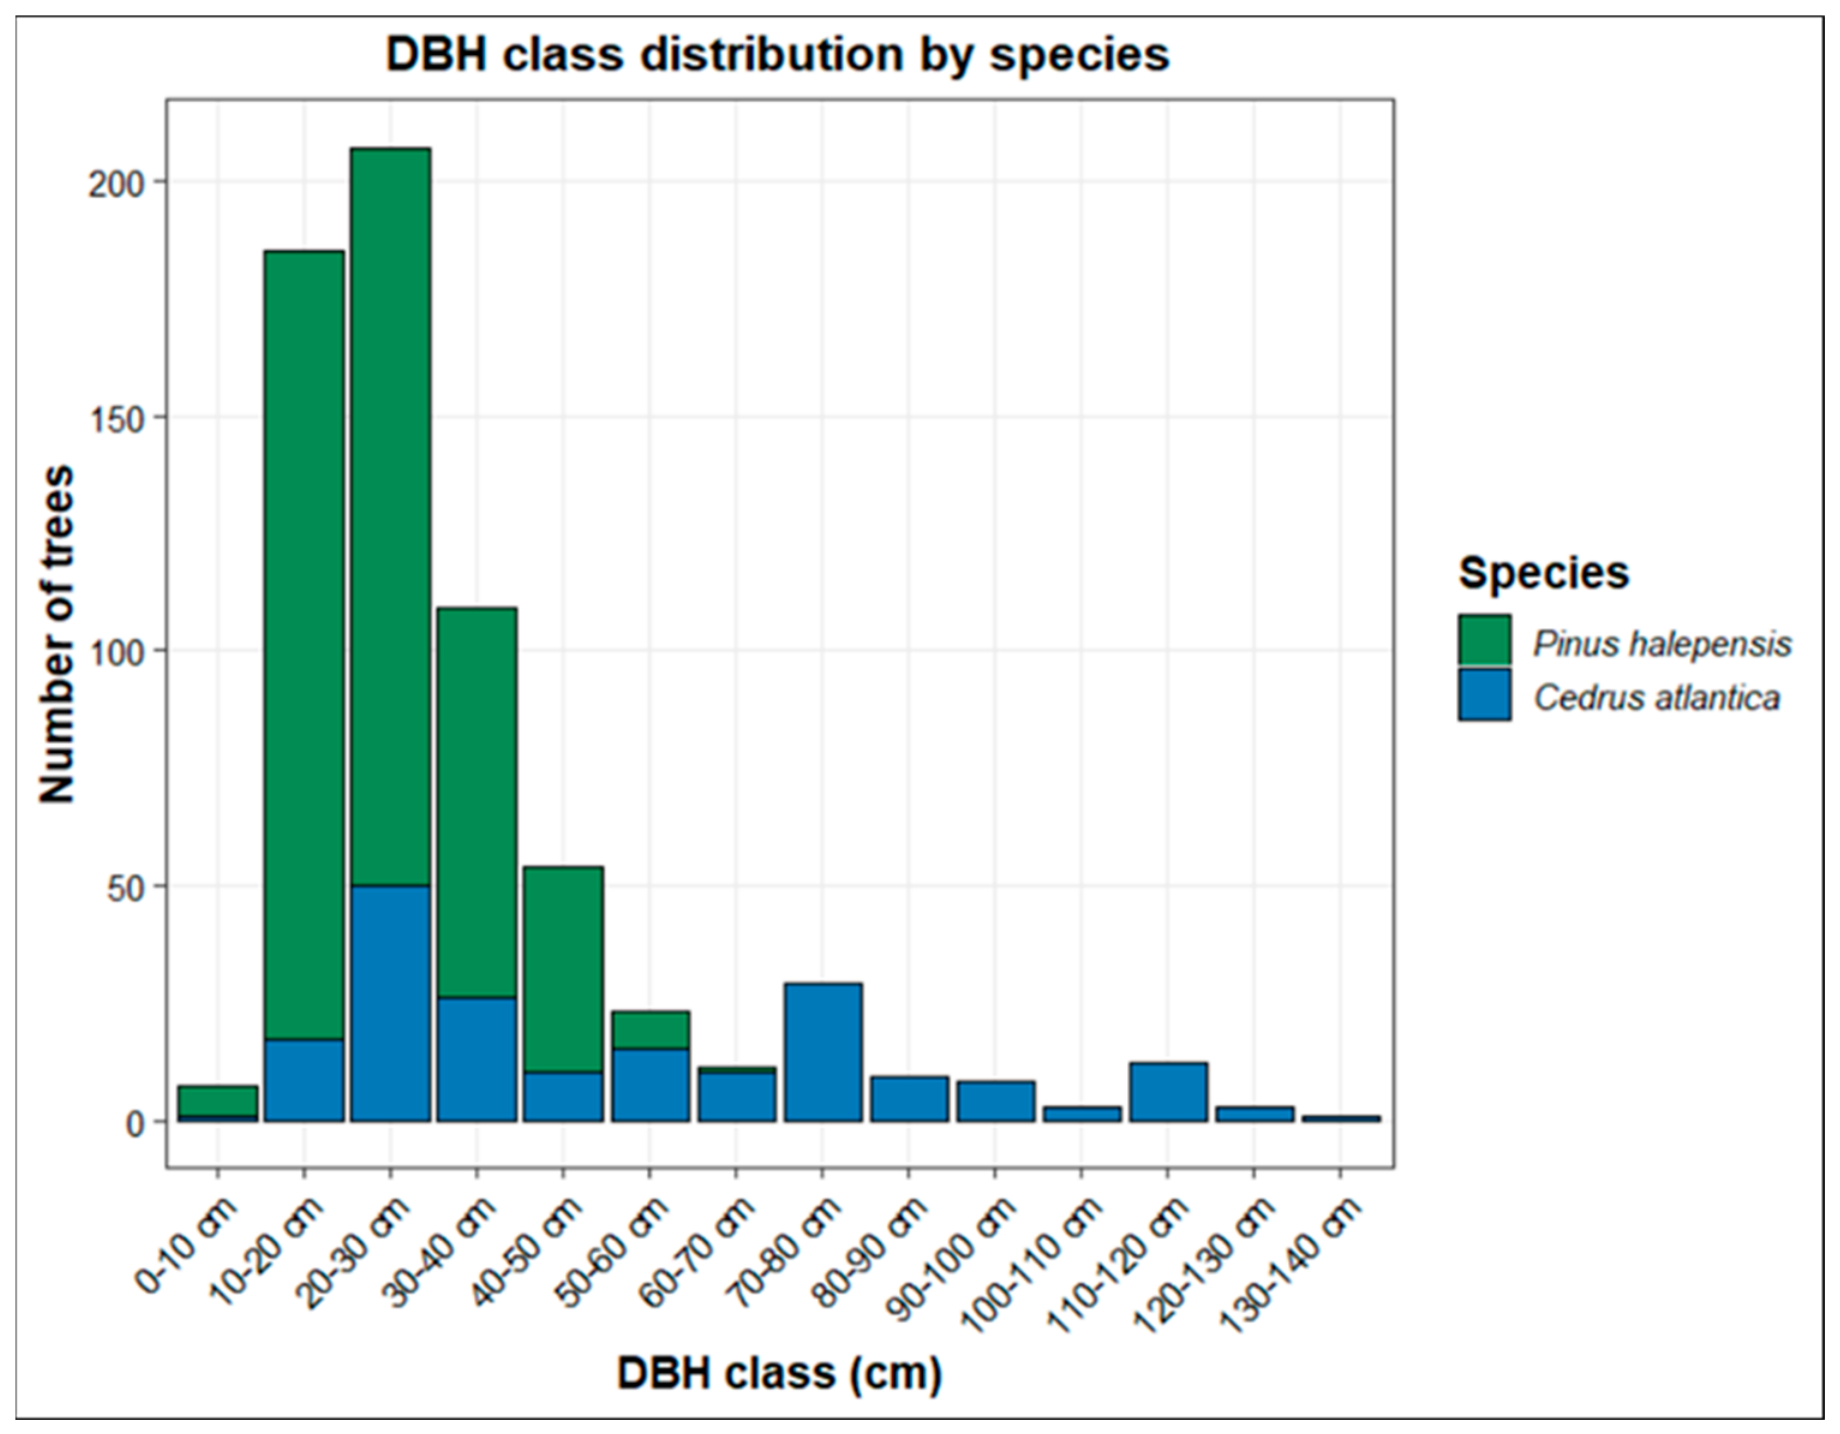
The per-hectare field values reported in this section were calculated only for the 54 stocked plots retained for biomass modelling. Therefore, they represent a stocked-plot carbon baseline rather than a mean carbon stock for the entire forest area. Treeless and severely degraded plots were not included in the primary per-hectare field estimate, and this limitation should be considered when interpreting the spatial carbon baseline. The DBH class distribution showed a clear dominance of small to medium diameter classes, indicating an uneven-aged and structurally heterogeneous forest stand.
Pinus halepensis was mainly concentrated in the 10–50 cm DBH classes, with the highest number of individuals recorded between 10 and 30 cm. In contrast,
Cedrus atlantica displayed a wider DBH distribution, extending from small diameter classes to larger classes above 100 cm. This pattern reflects differences in stand structure, growth stage, and ecological status between the two species (
Figure 5).
The dominance of smaller DBH classes, particularly for
Pinus halepensis, suggests active regeneration or a relatively young stand structure. In contrast, the broader DBH distribution of
Cedrus atlantica, including large-diameter individuals, indicates the presence of older trees and highlights the structural importance of cedar stands in the Ouled Yagoub Forest. This interpretation is consistent with the field inventory, where
P. halepensis was numerically dominant but showed lower mean DBH and lower mean AGB per tree, whereas healthy
C. atlantica showed the highest mean DBH and individual biomass (
Figure 7).
This diameter structure is particularly important for biomass and carbon-stock estimation because larger trees contribute disproportionately to above-ground biomass. In the present study, healthy C. atlantica trees had a mean DBH of 59.96 cm and a mean AGB of 1572.4 kg tree−1, whereas P. halepensis had a mean DBH of 25.48 cm and a mean AGB of only 194.7 kg tree−1. This confirms that cedar trees, especially large healthy individuals, play a key role in forest biomass storage despite being less abundant than Aleppo pine.
The strong relationship between tree diameter and biomass is also supported by allometric biomass studies. Montero et al., [
23] developed biomass and CO
2-fixation models using destructive sampling and dry-matter determination, showing that allometric models linking tree diameter to dry biomass are essential for forest carbon assessment. Similarly, ref. [
17] emphasized the importance of species-specific biomass and carbon parameters for
Cedrus atlantica, confirming that cedar biomass and carbon-stock estimation should rely on adapted dendrometric relationships rather than generic assumptions.
3.3. AGB Modelling with NDVI, SAVI and Elevation
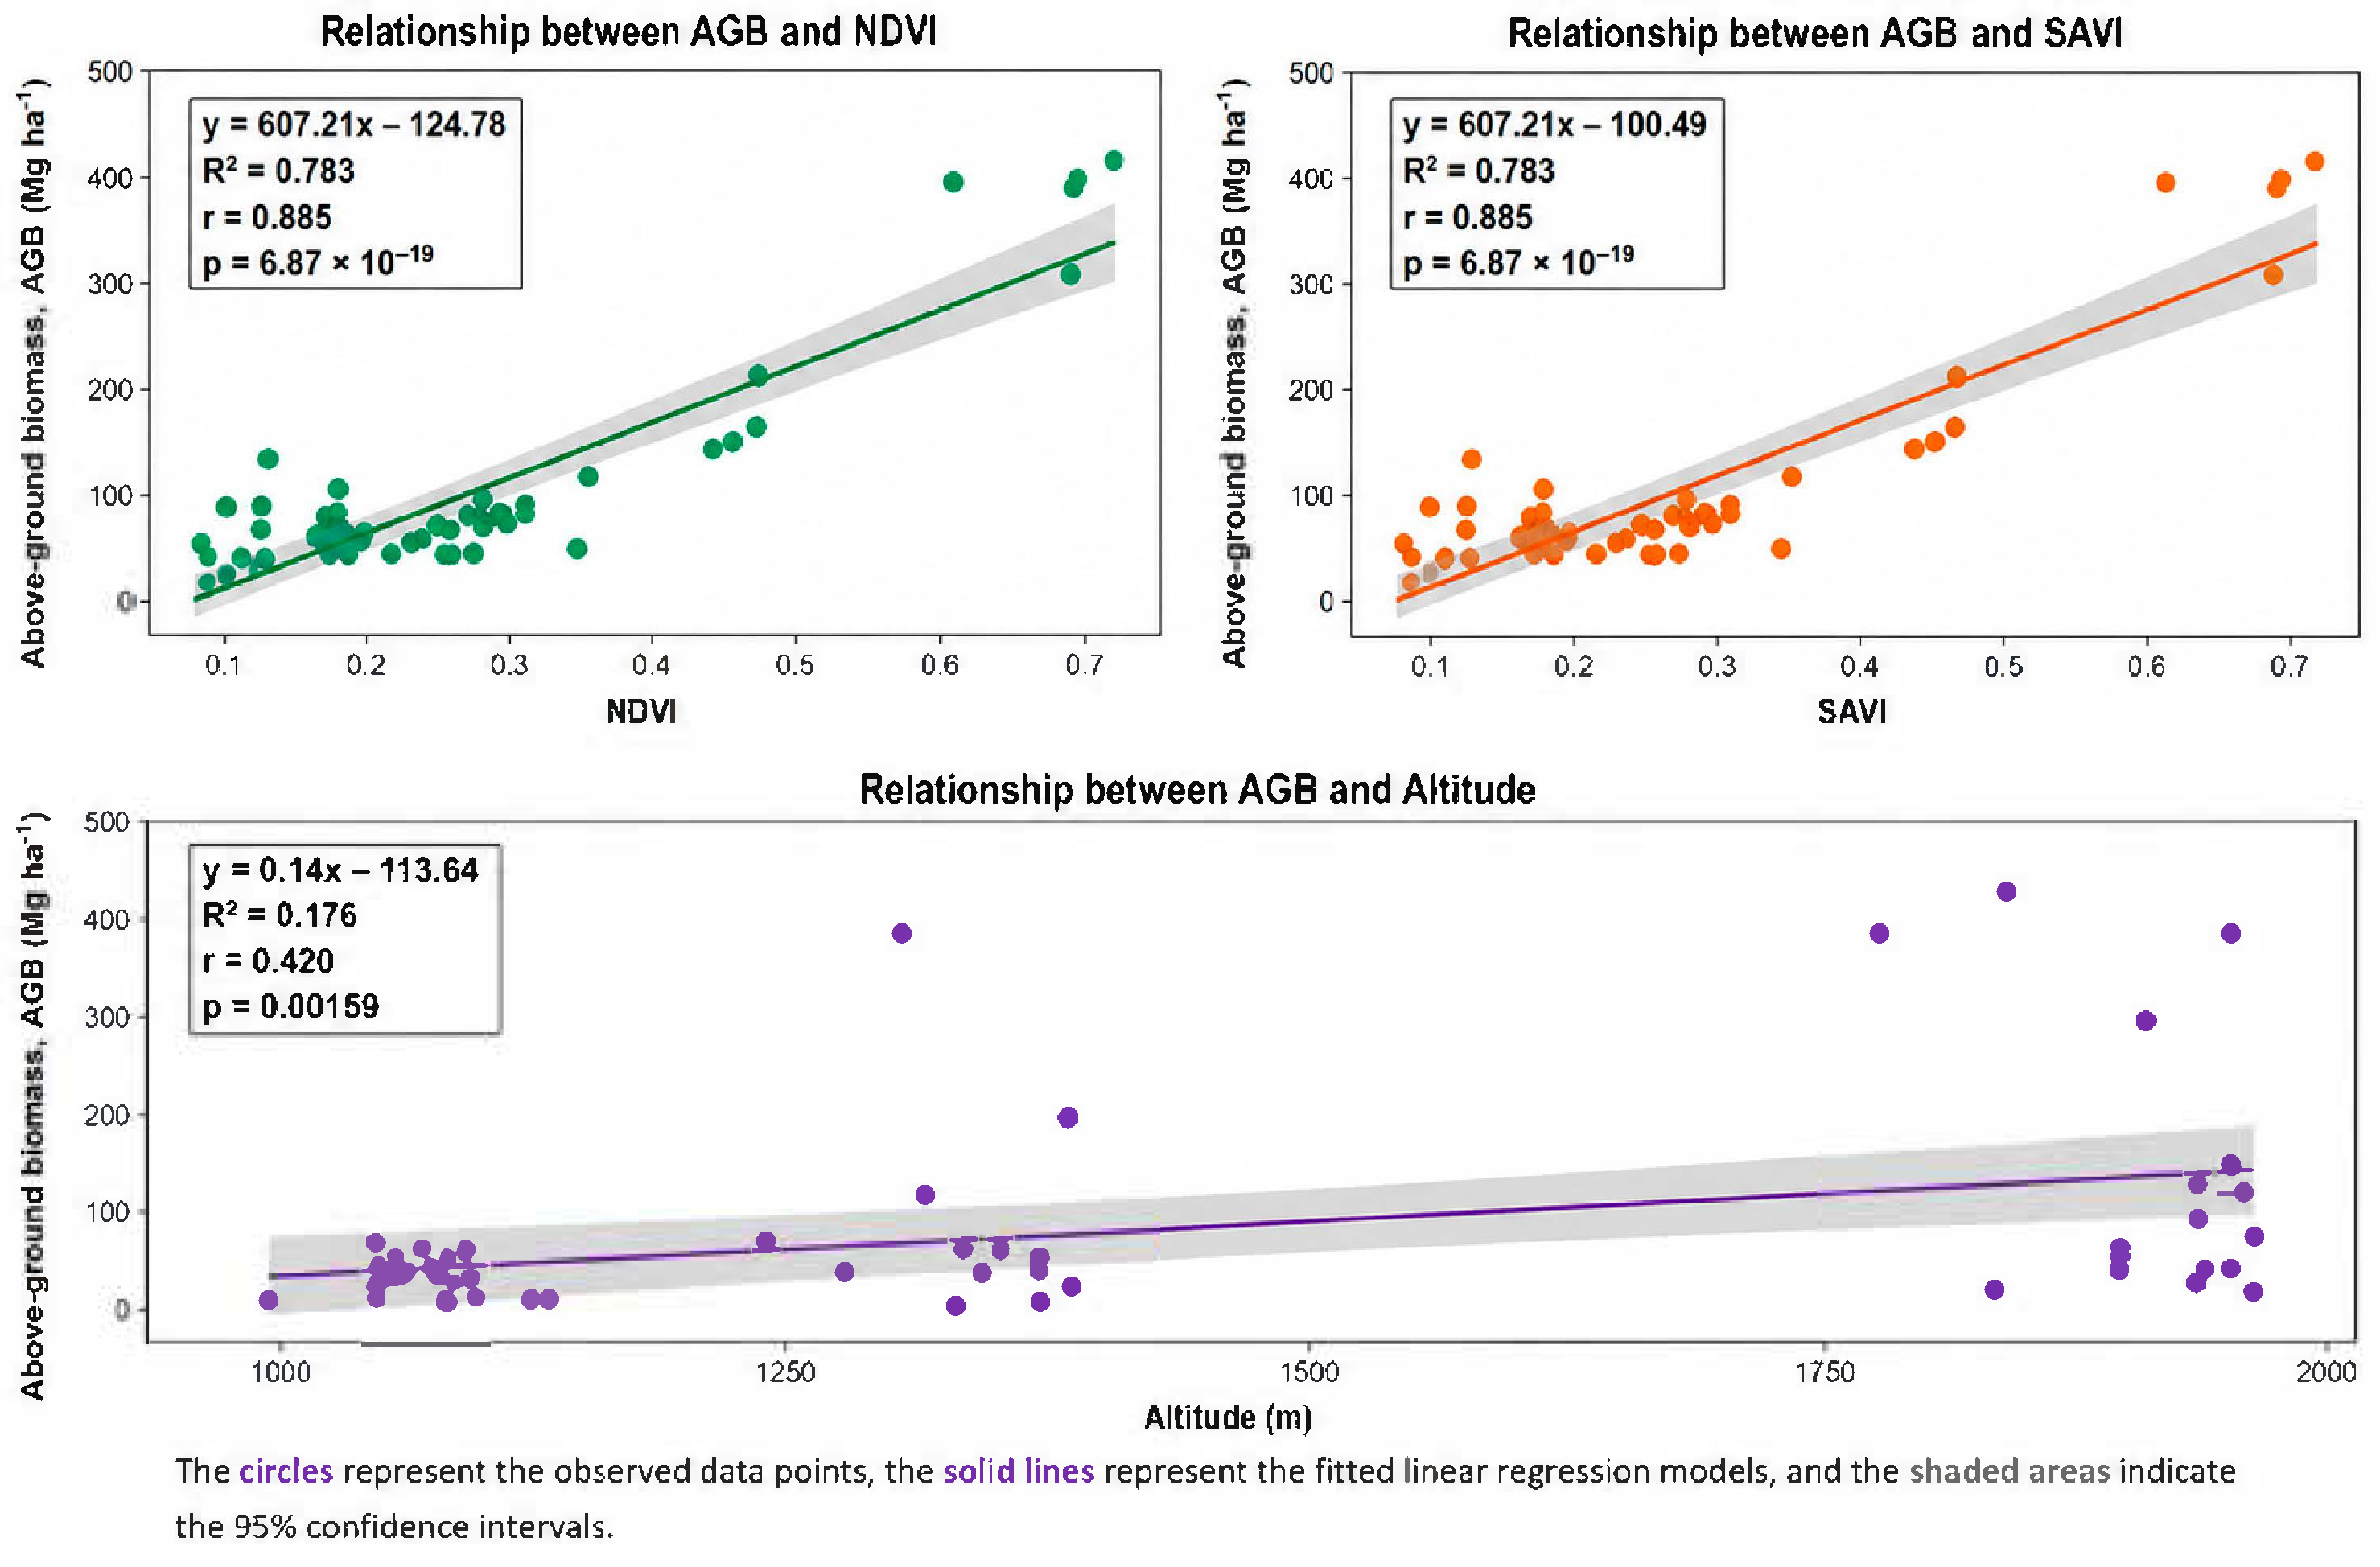
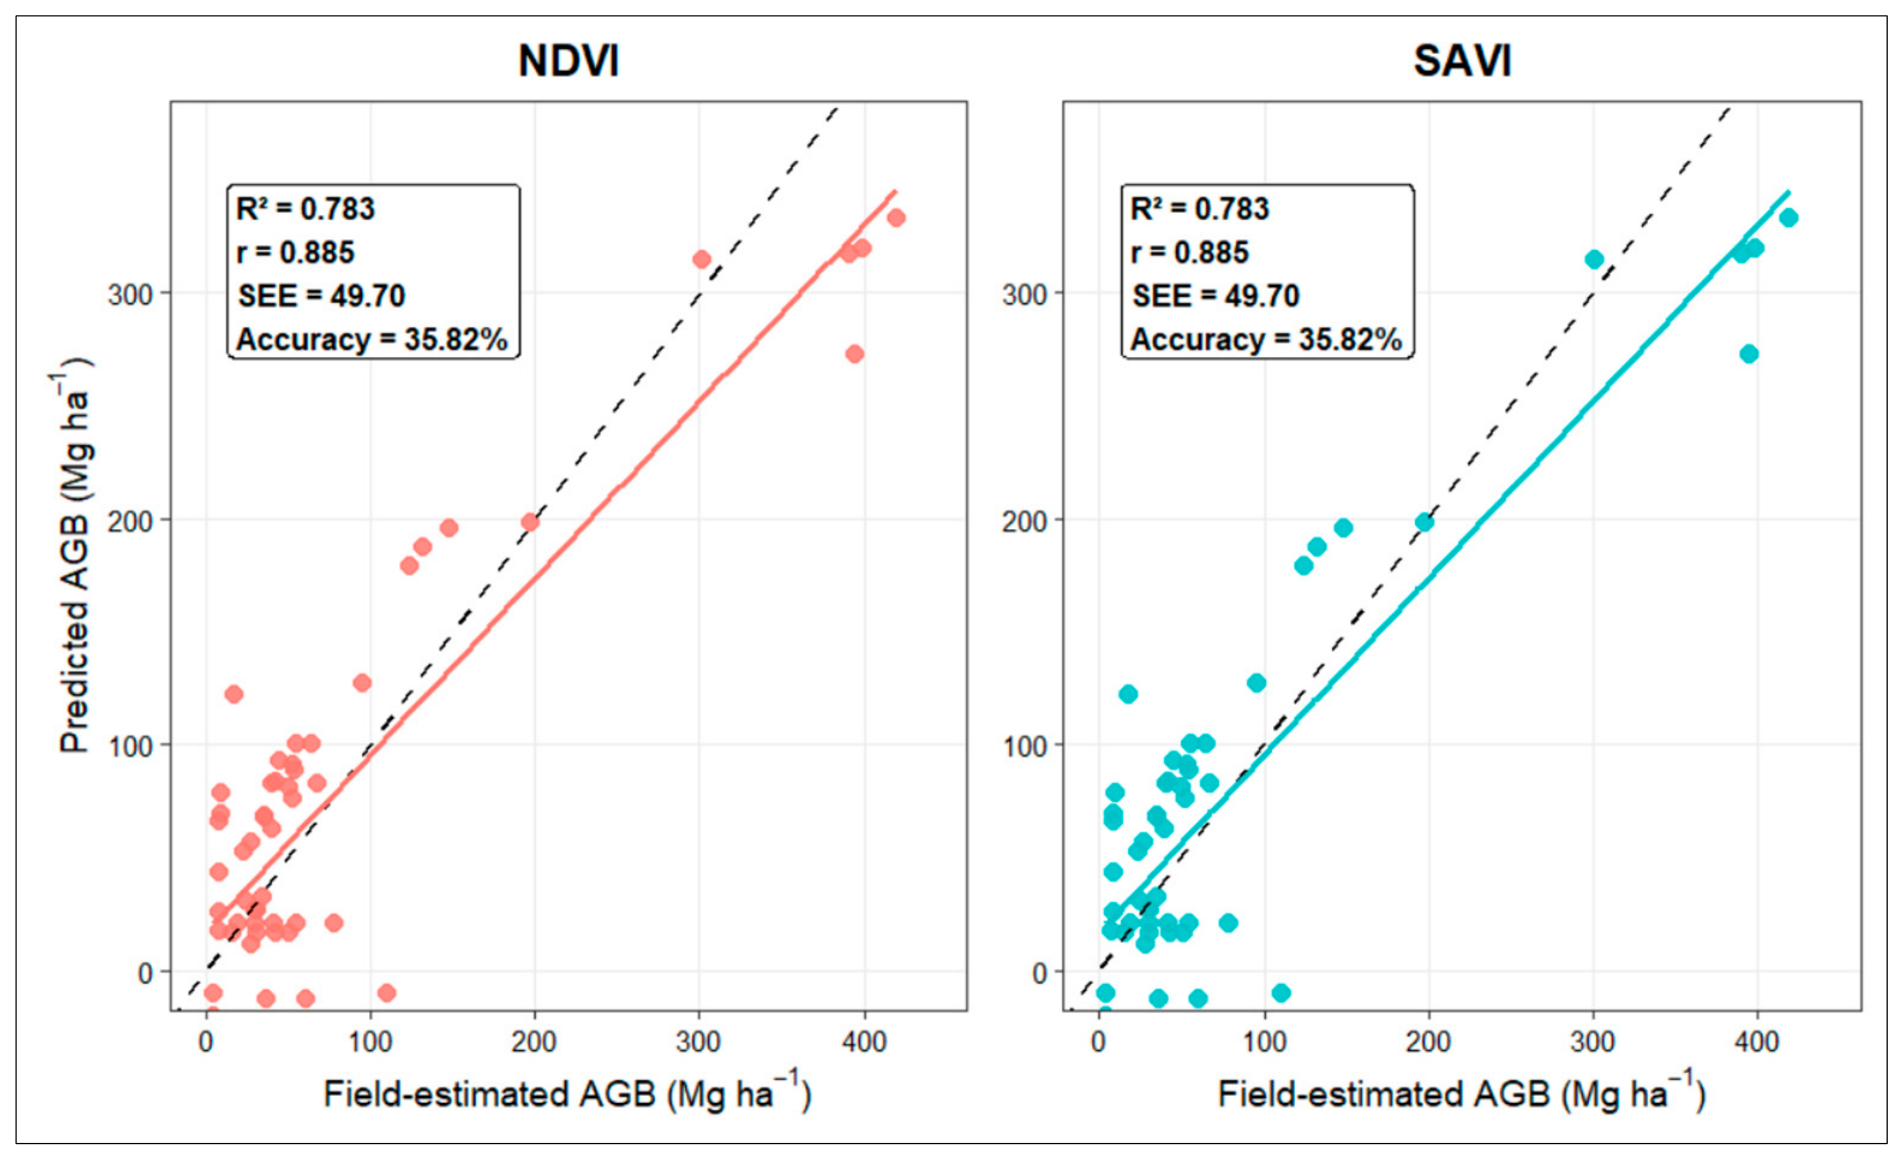
Regression analysis showed a strong relationship between field-estimated above-ground biomass and Sentinel-2 vegetation indices. The NDVI-based model explained 78.3% of AGB variability, with Pearson’s r = 0.885, RMSE = 48.77 Mg ha
−1, MAE = 39.14 Mg ha
−1, and SEE = 49.70 Mg ha
−1. The SAVI-based model produced exactly the same statistical performance, indicating that SAVI did not provide additional independent information compared with NDVI in the present dataset. Calibration and cross-validation performances of the tested models are summarized in
Table 7.
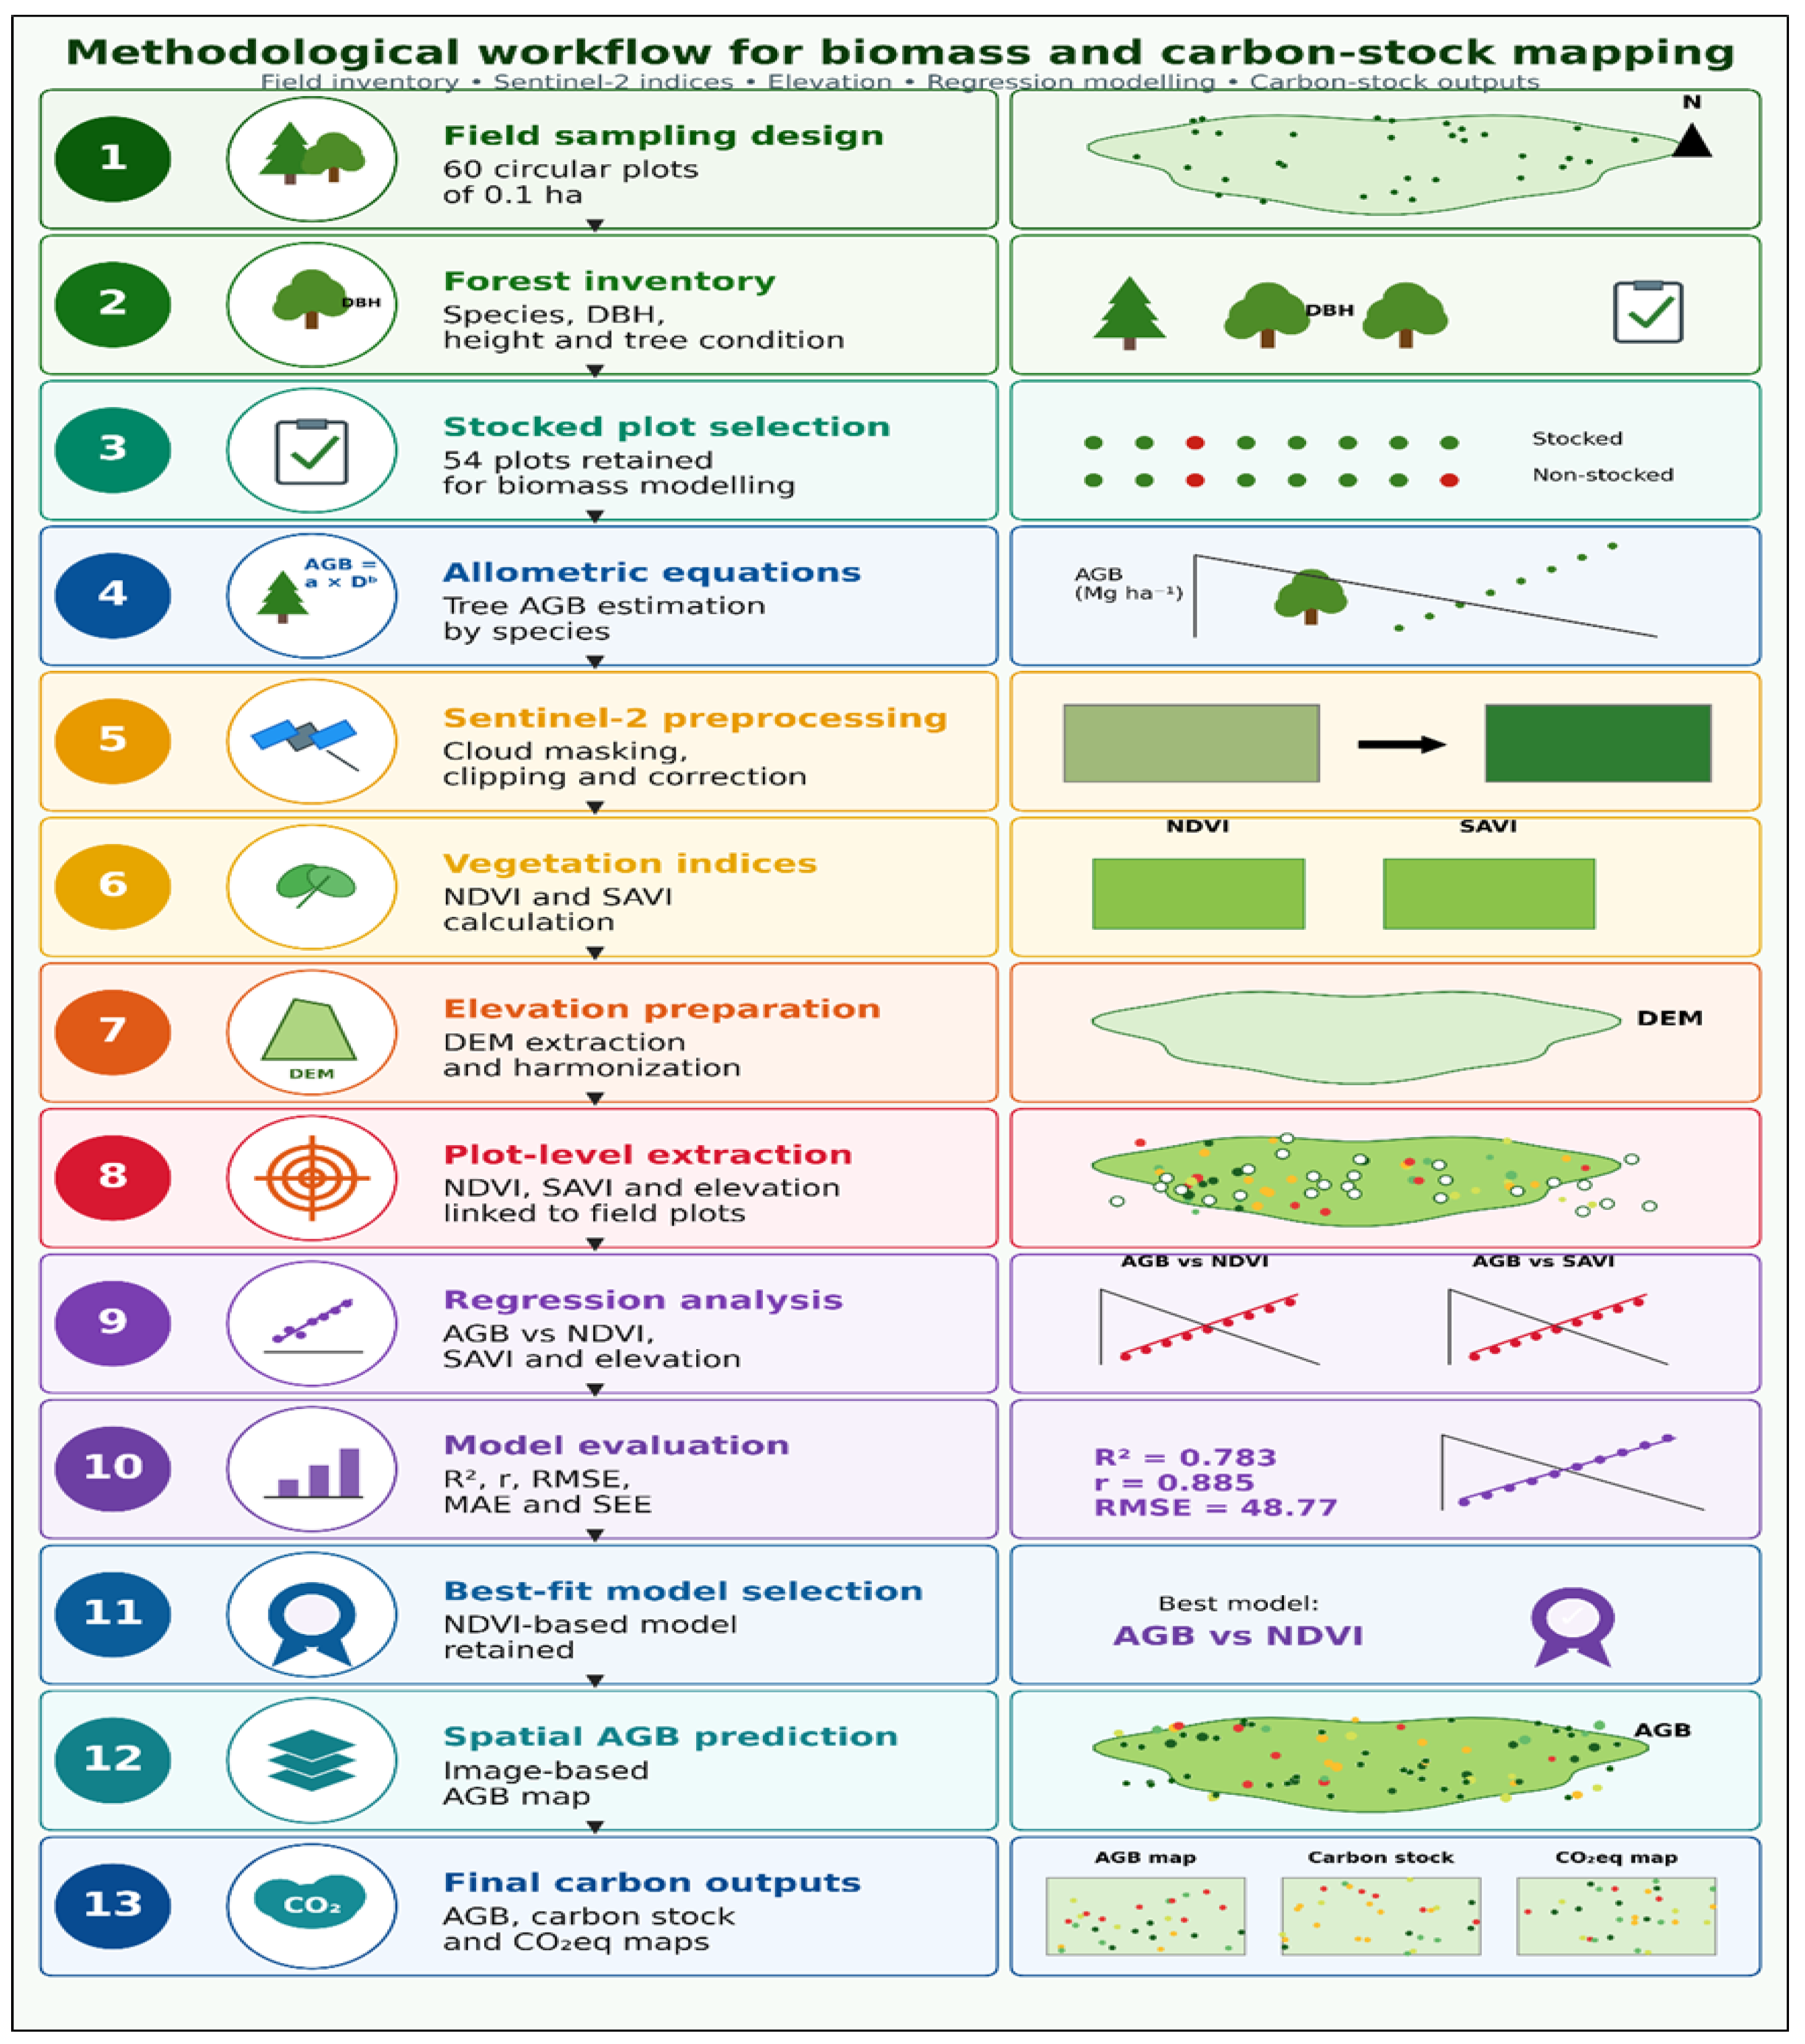
Cross-validation confirmed the stability of the NDVI-based AGB model. The calibration performance was high, with R2 = 0.783, RMSE = 48.77 Mg ha−1, MAE = 39.14 Mg ha−1 and Pearson’s r = 0.885. The LOOCV results remained close to the calibration statistics, with R2 = 0.755 and RMSE = 51.86 Mg ha−1, while 5-fold cross-validation produced R2 = 0.762 and RMSE = 51.07 Mg ha−1. The SAVI-based model produced identical results to the NDVI-based model, confirming redundancy between the two vegetation indices. The NDVI + Elevation model showed only a marginal improvement during calibration but did not improve cross-validated performance. Therefore, the NDVI-only model was retained as the most parsimonious model for spatial AGB prediction.
The NDVI–SAVI correlation was 1.000, confirming perfect collinearity in the plot dataset. This occurred because NDVI and SAVI provided identical information across the 54 stocked plots. Therefore, SAVI did not provide additional independent information compared with NDVI in this dataset.
Figure 8 confirms the strong relationship between field-estimated AGB and predicted AGB for both NDVI- and SAVI-based models. The two models produced identical statistical performance, indicating that SAVI was highly collinear with NDVI in the present dataset. Therefore, the combined use of NDVI and SAVI was not retained in the final regression model. The NDVI-based model was selected as the most parsimonious model for spatial AGB estimation, while SAVI was considered a complementary soil-adjusted vegetation indicator.
The identical performance of NDVI and SAVI indicates that SAVI did not provide additional independent information compared with NDVI in the present dataset. Although SAVI is theoretically useful in open-canopy and semi-arid environments because it reduces soil-background effects, its added value becomes limited when it is highly collinear with NDVI [
12]. Therefore, the combined use of NDVI and SAVI in the same regression model should be avoided or interpreted cautiously, because collinearity may produce unstable regression coefficients without improving predictive performance [
11].
The elevation-only model showed a weaker relationship with AGB, explaining 17.6% of biomass variability, with RMSE = 95.04 Mg ha
−1. When elevation was added to NDVI or SAVI, model performance improved only slightly, with R
2 increasing from 0.783 to 0.784 and RMSE decreasing from 48.77 to 48.65 Mg ha
−1. This very small improvement indicates that elevation contributed limited additional predictive information once vegetation greenness was already included in the model. Nevertheless, elevation remains ecologically meaningful in the Ouled Yagoub Forest because
Cedrus atlantica is more frequent in higher and relatively humid sectors, whereas
Pinus halepensis is more common at lower elevations and degraded slopes. El Mderssa et al., [
17] also reported that Atlas cedar is mainly associated with mountainous zones, confirming the ecological importance of altitude for cedar distribution.
The combined NDVI + SAVI + elevation model also reached R
2 = 0.784 and RMSE = 48.65 Mg ha
−1. However, this model was not retained as the final model because NDVI and SAVI were highly collinear and did not improve predictive performance [
23]. Therefore, the NDVI-based model was considered the most parsimonious model for spatial AGB estimation, while elevation was retained mainly as an ecological variable supporting the interpretation of biomass distribution along the altitudinal gradient. This approach follows the principle that empirical biomass models should balance predictive performance, ecological interpretability, and model simplicity [
31].
These results indicate that canopy greenness is a strong indicator of above-ground biomass variability in the Ouled Yagoub Forest. Higher NDVI values were generally associated with denser and structurally developed forest patches, whereas lower values corresponded to sparse vegetation, degraded stands, open-canopy areas, or zones affected by disturbance. However, biomass and carbon storage should not be interpreted only as spectral responses. Forest carbon dynamics are also influenced by climatic variability, drought, fire, disturbance history, and ecosystem physiological responses. Niu et al. [
4] emphasized that interannual variability in terrestrial carbon exchange is driven by climate anomalies and their effects on photosynthesis and respiration, with semi-arid ecosystems playing an important role in land carbon variability (
Figure 8).
The limited contribution of elevation suggests that altitude alone cannot fully explain biomass patterns, although it remains ecologically relevant because
Cedrus atlantica is more frequent in higher and relatively humid sectors of the massif [
23]. In the present field inventory, healthy
Cedrus atlantica trees showed much higher mean AGB per tree than declining cedar and
Pinus halepensis, confirming the strong contribution of cedar-dominated stands to biomass storage. This supports the interpretation that biomass distribution is controlled not only by canopy greenness, but also by species composition, tree size, stand structure, and tree health status. The use of species-specific allometric equations is therefore important for improving biomass estimation in mixed forest stands [
17].
Overall, the results show that Sentinel-2 vegetation indices can support biomass estimation when calibrated with field inventory data. Nevertheless, the collinearity between NDVI and SAVI indicates that both indices should not be used together in the same final regression model. Future modelling should integrate independent predictors such as Sentinel-2 red-edge indices, EVI, canopy height, forest type, slope, aspect, texture variables, fire history, and cedar health status to improve model robustness and reduce uncertainty in biomass and carbon-stock mapping. This recommendation is consistent with [
4], who emphasized the need to combine observations, modelling frameworks, and statistical approaches to improve carbon-cycle prediction (
Table 8 and
Figure 8).
Carbon-stock estimation also depends on the reliability of biomass-to-carbon conversion parameters. For
Cedrus atlantica, a measured carbon fraction of 0.5643 tC tMS
−1 was reported, which is higher than the generic IPCC value of 0.51 tC tMS
−1. This confirms the importance of using species-specific carbon parameters for Atlas cedar carbon accounting, especially in Mediterranean mountain forests where generic conversion factors may introduce uncertainty into carbon-stock estimates [
17].
The NDVI model was retained as the most parsimonious model because it provided strong predictive performance while avoiding collinearity problems associated with the simultaneous use of NDVI and SAVI [
11].
Although NDVI explained a high proportion of AGB variability, the model remains empirical and field-calibrated. Therefore, its transferability to other forests or acquisition dates should be tested carefully, especially because semi-arid ecosystems are sensitive to interannual climate variability, drought, fire, and disturbance effects on carbon exchange [
4].
Relationship Between AGB and Environmental Predictors
Linear regression analysis was performed to evaluate the relationship between field-estimated above-ground biomass (AGB) and the explanatory variables derived from Sentinel-2 imagery and topography. The integration of remote sensing data with geospatial techniques has proven effective for assessing land resources and vegetation patterns in semi-arid regions [
32]. The results showed a strong and highly significant positive relationship between AGB and both vegetation indices. NDVI explained 78.3% of the spatial variation in AGB, with a Pearson correlation coefficient of r = 0.885. SAVI showed a similar performance, with R
2 = 0.783 and r = 0.885, confirming the relevance of Sentinel-2 vegetation indices for biomass estimation in the Ouled Yagoub Forest (
Table 9). Similar results have been reported in other semi-arid forest ecosystems; for instance, Torabzadeh et al. [
33] found that Sentinel-2 data explained 87% of AGB variability in the Zagros Forest, Iran (R
2 = 0.87, RMSE = 10.75 t ha
−1).
In contrast, altitude showed a weaker but statistically significant relationship with AGB, explaining only 17.6% of the variation. This indicates that vegetation greenness and canopy density are stronger predictors of above-ground biomass than elevation alone (
Figure 5). This result agrees with the outcomes of Chakroun et al. [
34], who showed that NDVI and related vegetation indices are better than SAVI for biomass-related assessments in Mediterranean forest ecosystems.
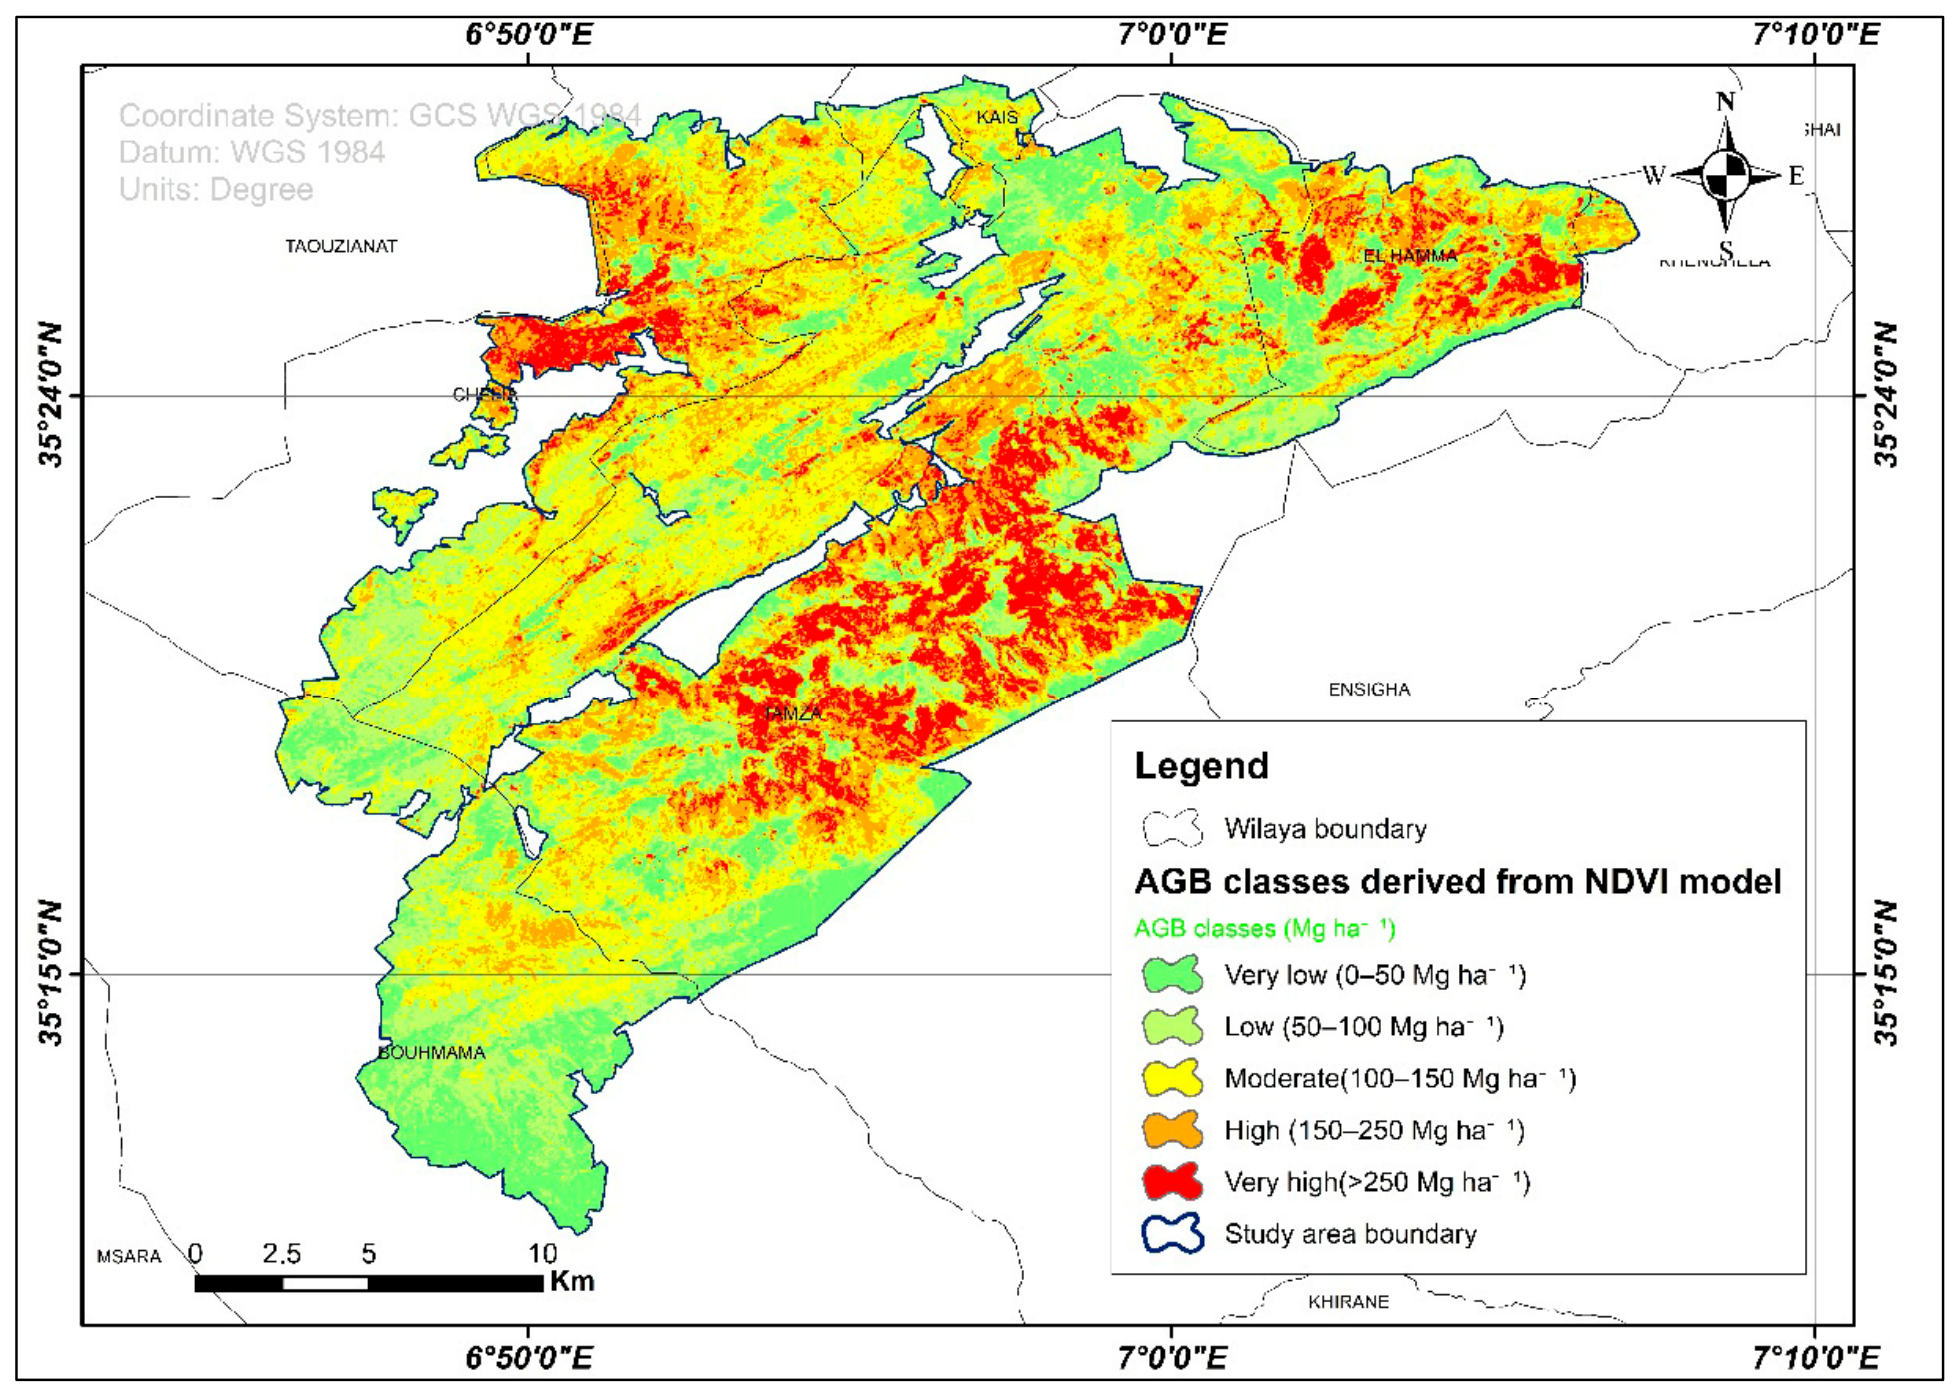
The strong relationships observed for NDVI and SAVI suggest that forest biomass in the study area is closely related to vegetation vigour and canopy cover. Similar findings have also been reported in Mediterranean forests of southern Spain, where NDVI and tree density positively affected forest biomass and productivity strongly for several species such as
Pinus halepensis and
Quercus ilex [
35] (
Figure 9).
Higher AGB values were generally associated with higher vegetation index values, corresponding to denser and more productive forest stands. The weaker relationship with altitude suggests that elevation may influence biomass indirectly through species distribution, stand structure, soil conditions, and microclimatic gradients, but it is not sufficient as a single predictor for biomass modelling. This is consistent with recent results from Mediterranean semi-arid forests, where the effect of canopy cover on aboveground biomass was the strongest direct effect (β = 0.36), while the effect of elevation on biomass was indirect through its effect on canopy cover, structural diversity and species composition [
36]. Similarly, Di Biase et al. [
37] showed that in Mediterranean mountain ecosystems species composition and vegetation structure varied systematically along elevational gradients, with a decrease in Mediterranean species and an increase in species adapted to high altitude with elevation, which in turn influences patterns of biomass accumulation.
3.5. Carbon Stock and CO2-Equivalent Estimation
Applying the carbon conversion chain described in
Section 2.6 to the field-estimated AGB values and to the NDVI-based spatial AGB model, the carbon accounting results summarized in
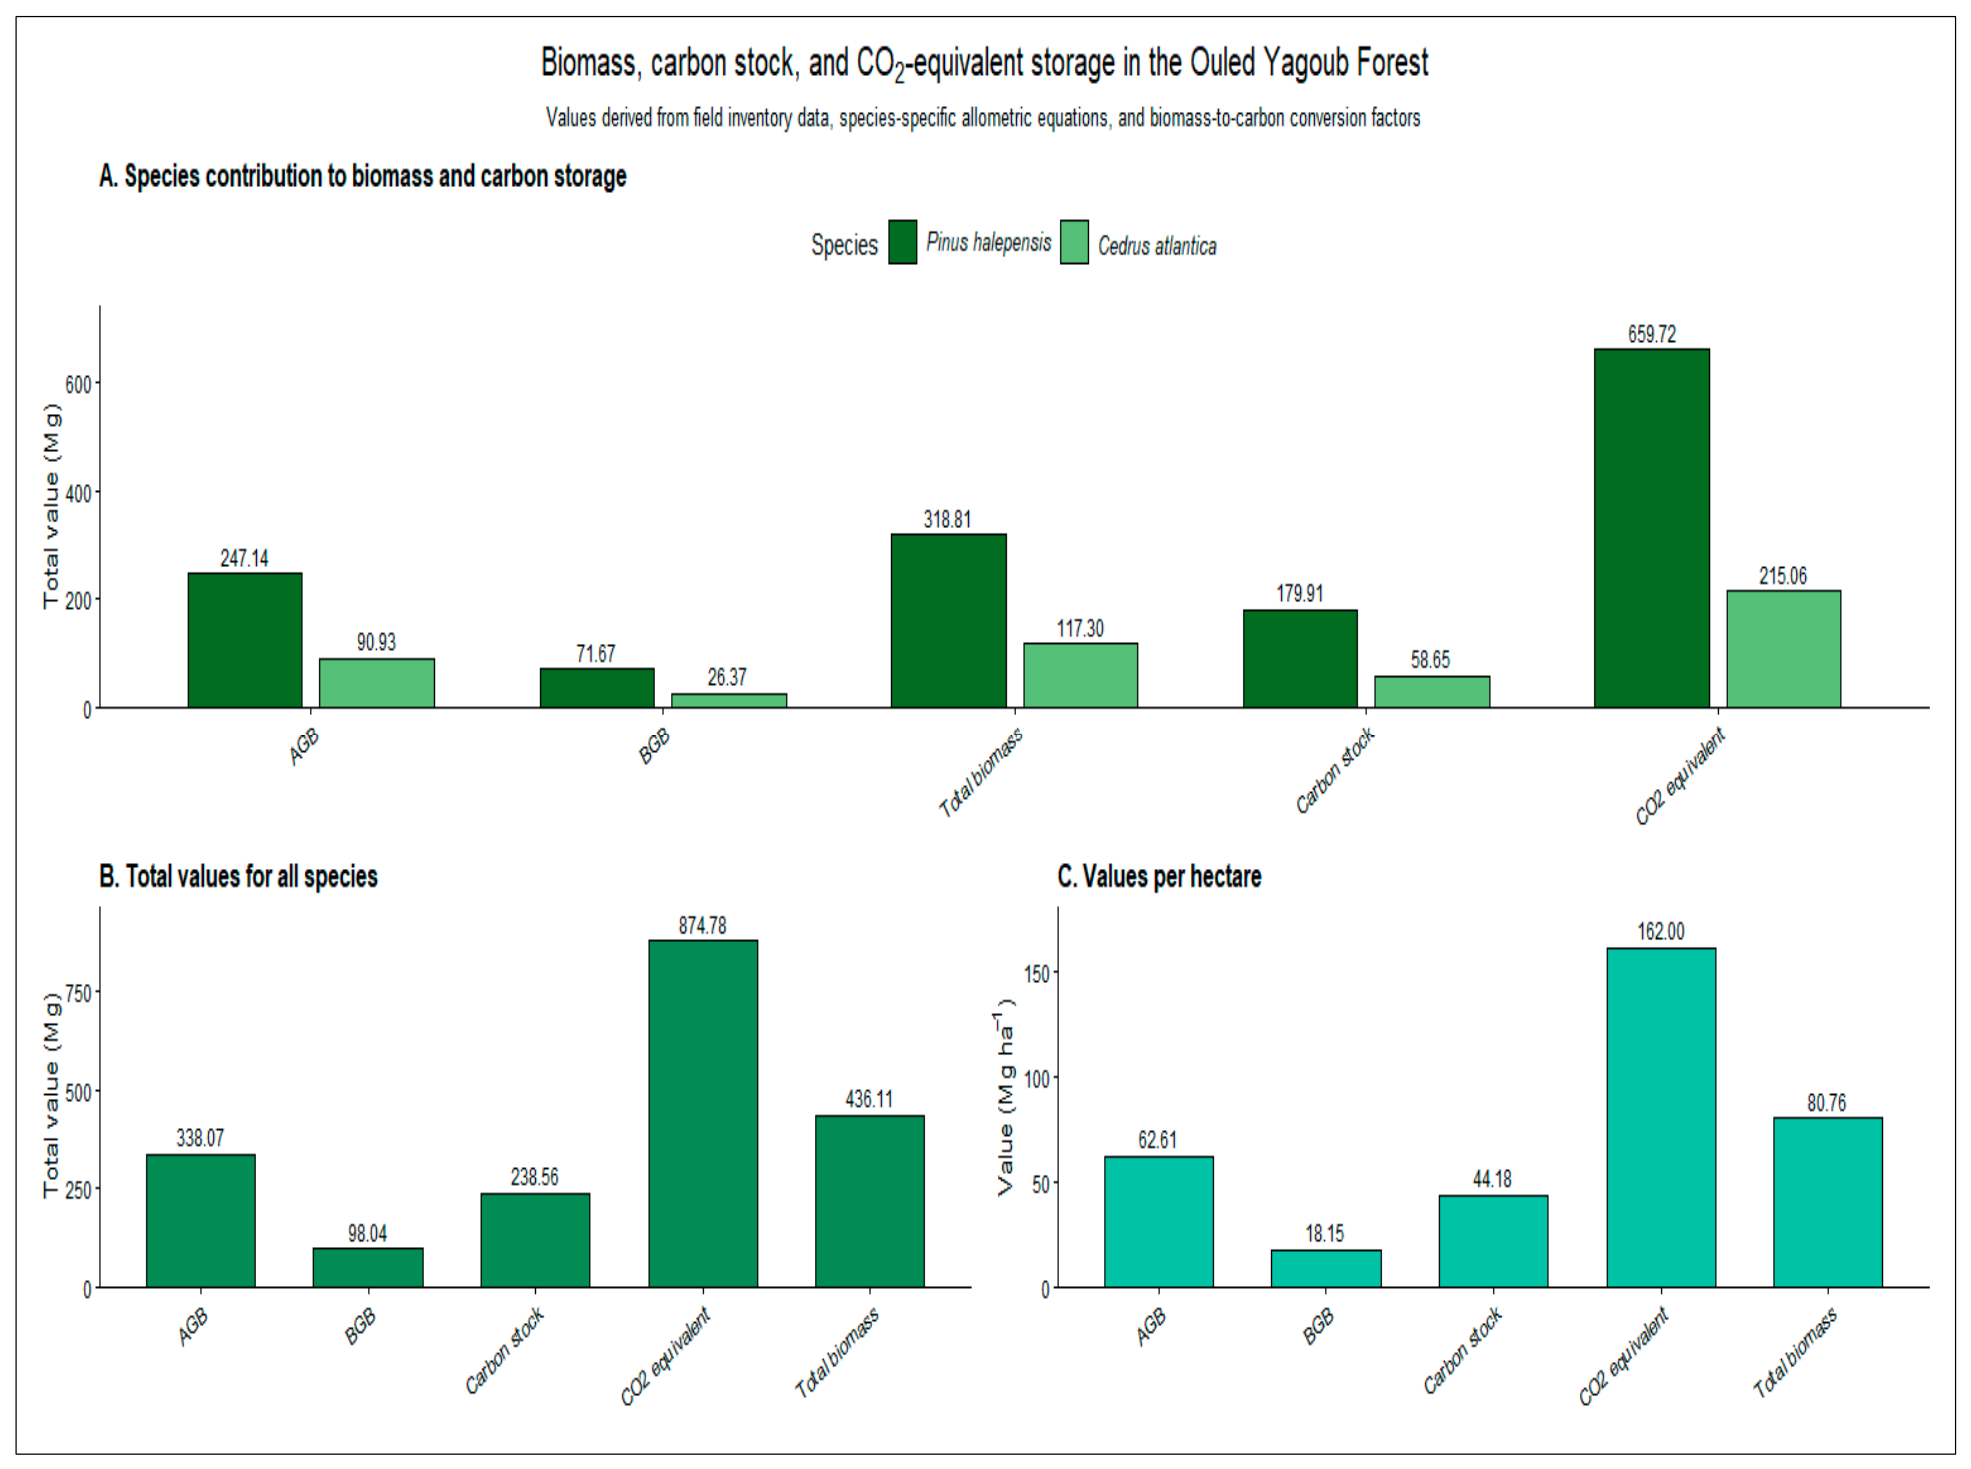
Figure 11 were obtained.
Figure 11 summarizes the biomass, carbon stock, and CO
2-equivalent storage estimated from the field inventory in the Ouled Yagoub Forest. The total above-ground biomass reached 338.07 Mg, while total biomass, including below-ground biomass, reached 436.11 Mg. The corresponding carbon stock was 238.56 Mg C, equivalent to 874.78 Mg CO
2eq. At the hectare scale, these values corresponded to 62.61 Mg ha
−1 for AGB, 80.76 Mg ha
−1 for total biomass, 44.18 Mg C ha
−1 for carbon stock, and 162.00 Mg CO
2eq ha
−1 for CO
2-equivalent storage. These values are consistent with the carbon accounting results presented in
Table 8.
Figure 11 clearly shows the dominant contribution of
Cedrus atlantica to biomass and carbon storage. Although
Pinus halepensis was numerically more abundant in the field inventory,
Cedrus atlantica contributed 247.14 Mg of AGB, compared with 90.93 Mg for
P. halepensis. This represents approximately 73.1% of total AGB. The same dominance is observed for total biomass, carbon stock, and CO
2-equivalent storage. This pattern reflects the larger stem diameter and higher individual biomass of cedar trees, especially healthy cedar individuals. Comparative studies in Mediterranean forest ecosystems have shown that different ecological behaviours were observed for
Cedrus atlantica and
Pinus halepensis, with
Pinus halepensis tending to produce higher metabolic quotients in soil microbial biomass, while
Cedrus atlantica is related to different organic matter dynamics and carbon cycling patterns [
41].
The field inventory estimated a total AGB of 338.07 Mg, corresponding to 62.61 Mg ha−1. After below-ground biomass expansion, total biomass reached 436.11 Mg, equivalent to 80.76 Mg ha−1. The total carbon stock was estimated at 238.56 Mg C, corresponding to 44.18 Mg C ha−1, while CO2-equivalent storage reached 874.78 Mg CO2eq, or 162.00 Mg CO2eq ha−1.
The mean AGB value obtained in this study, 62.61 Mg ha
−1, is comparable to values reported for some Mediterranean forest stands. For example, Boulmane et al. [
42] reported AGB values of approximately 58–64 Mg ha
−1 for
Quercus ilex stands in the Moroccan Middle Atlas [
42]. In terms of carbon stock, the value obtained in the present study, 44.18 Mg C ha
−1, remains lower than the 78.75 Mg C ha
−1 reported by El Mderssa et al., [
17] for mature Atlas cedar stands, but it falls within the range of 40–77 Mg C ha
−1 reported by [
43] for degraded cork oak forests in Morocco. This intermediate value reflects the mixed and heterogeneous structure of the Ouled Yagoub Forest, which includes young pine formations, open-canopy stands, degraded patches, and mature cedar-dominated areas (
Figure 11).
The contribution of Cedrus atlantica to carbon storage was dominant. Although cedar trees were less abundant than Pinus halepensis, they contributed 247.14 Mg of AGB, representing 73.1% of the total AGB. This confirms the key role of large cedar individuals in maintaining the biomass and carbon-storage capacity of the forest.
Declining
Cedrus atlantica individuals showed lower estimated biomass and carbon storage than healthy cedar individuals. However, this result should be interpreted as an observed difference in estimated biomass and carbon storage, not as a direct causal quantification of carbon loss due to dieback. Tree size, age, stand density, site quality and disturbance history may also influence biomass differences between healthy and declining trees. In addition, the same allometric equation was applied to healthy and declining cedar trees because no specific equation is currently available for declining
Cedrus atlantica. This may overestimate biomass in declining individuals affected by crown dieback, branch loss or reduced foliage density. Therefore, the carbon-loss estimate should be considered indicative and should be refined in future studies using crown-condition measurements and health-specific allometric models (
Figure 11).
The spatial carbon-stock and CO
2-equivalent maps were derived from the NDVI-based AGB map using the biomass-to-carbon conversion chain described in
Section 2.6. Therefore, their spatial patterns closely follow the distribution of predicted AGB. Higher carbon-stock and CO
2-equivalent values are mainly associated with dense and structurally developed forest patches, whereas lower values occur in sparse, degraded, or open-canopy areas.
High carbon-stock classes indicate areas with higher predicted biomass and denser vegetation cover, but they should not be interpreted as direct indicators of severe mortality or cedar dieback. Conversely, low carbon-stock classes may correspond to open canopy, degraded vegetation, burned areas, sparse stands or naturally low-density forest conditions.
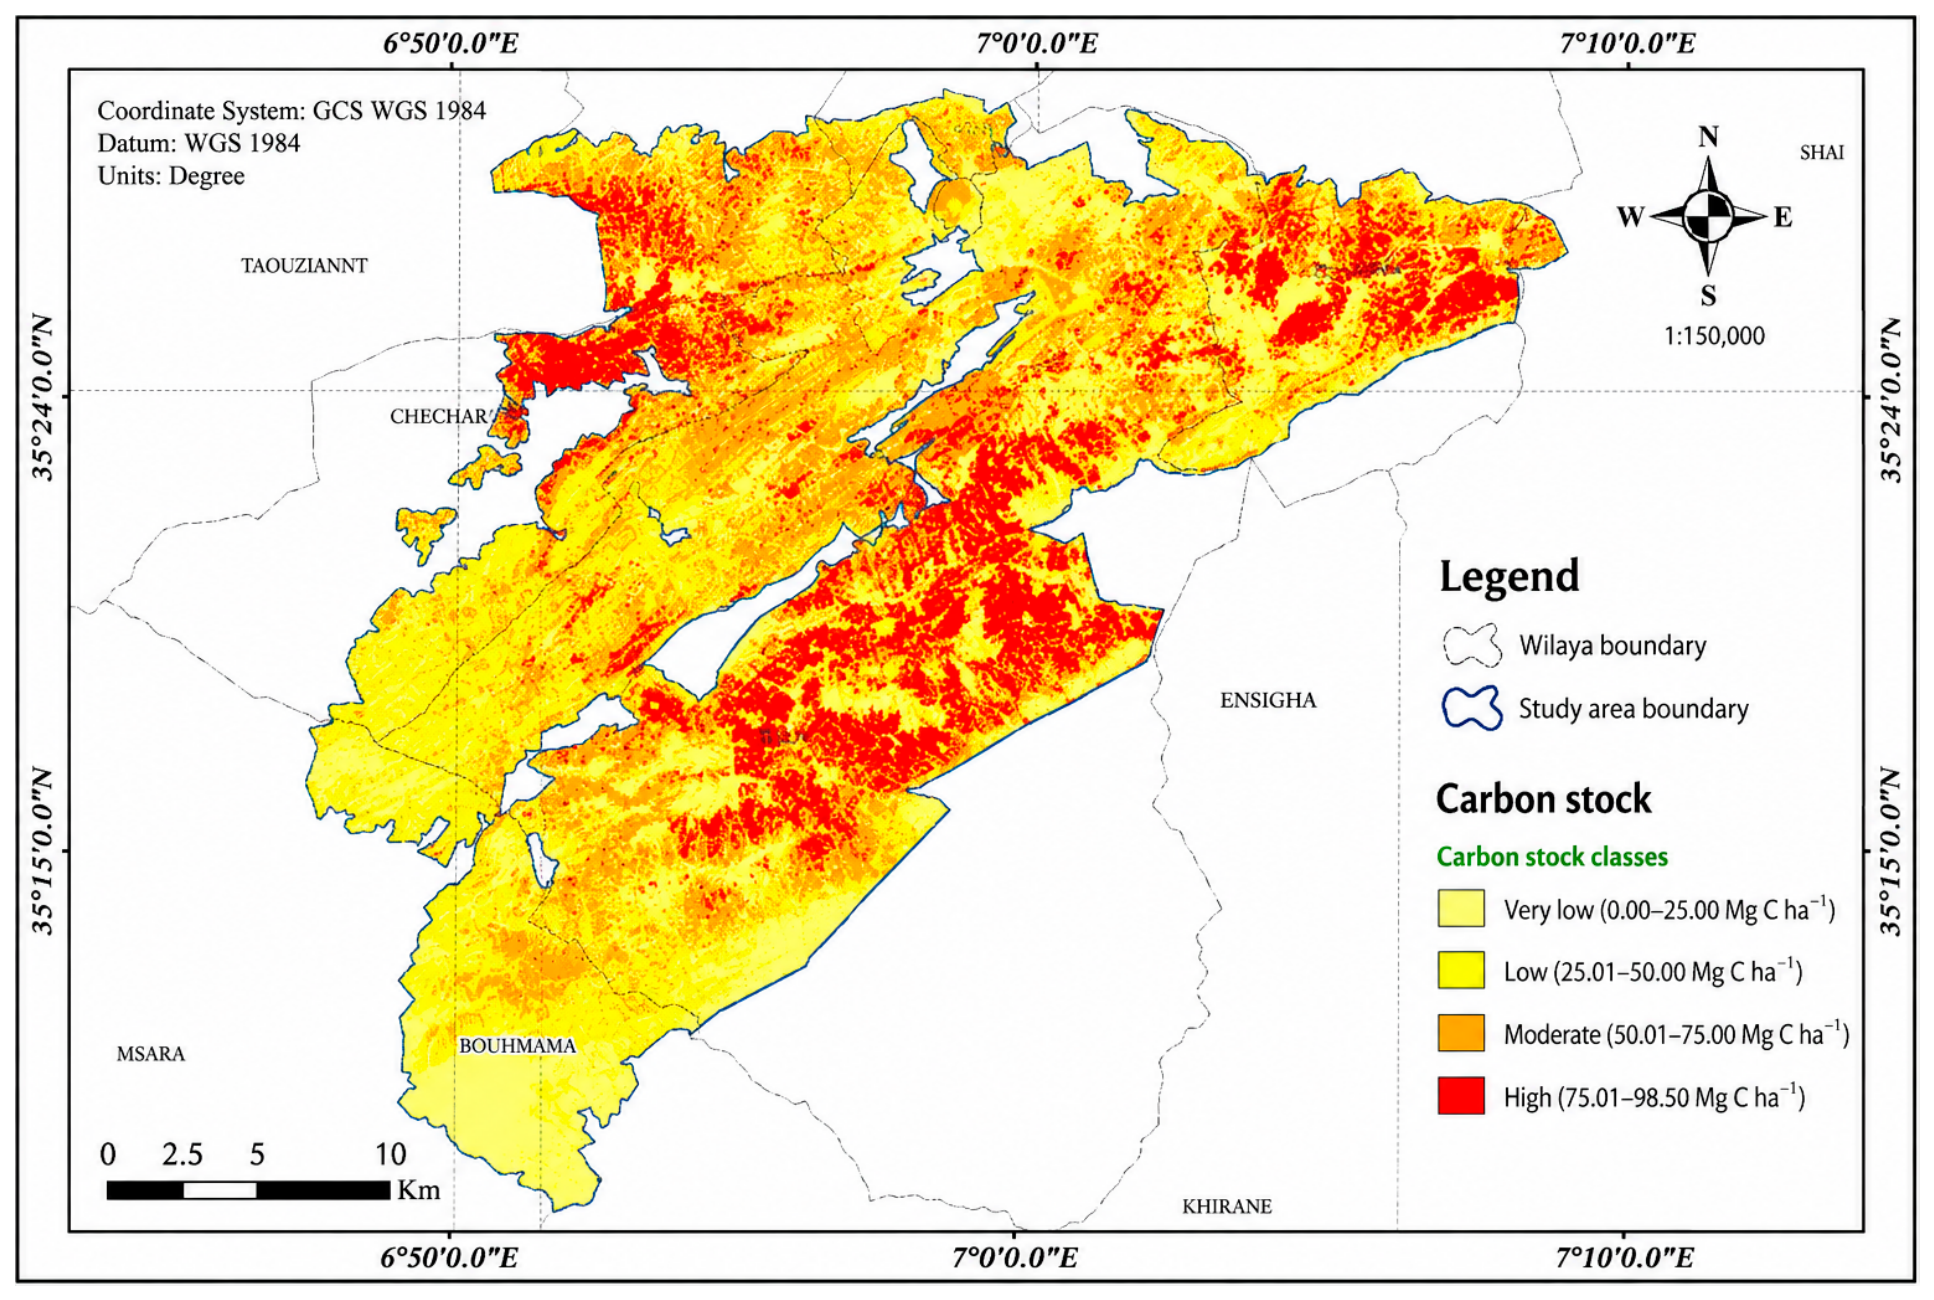
The carbon-stock map shows a heterogeneous spatial distribution across the Ouled Yagoub Forest. High carbon-stock values, ranging from 75 to 98.5 Mg C ha−1, are mainly concentrated in the central, northern, and northeastern parts of the study area. These zones correspond to dense and structurally developed forest patches, where high above-ground biomass is expected. In contrast, very low and low carbon-stock classes are mainly distributed in open-canopy, sparse, or degraded areas, particularly in peripheral sectors and lower-density forest formations.
This spatial pattern reflects the strong dependence of carbon storage on forest structure and biomass density. Since the carbon-stock map was derived from the NDVI-based AGB model, areas with high NDVI and high predicted AGB also show higher carbon-stock values. Therefore, the map should be interpreted as a spatial estimate of living biomass carbon rather than a direct measurement of carbon content (
Figure 12).
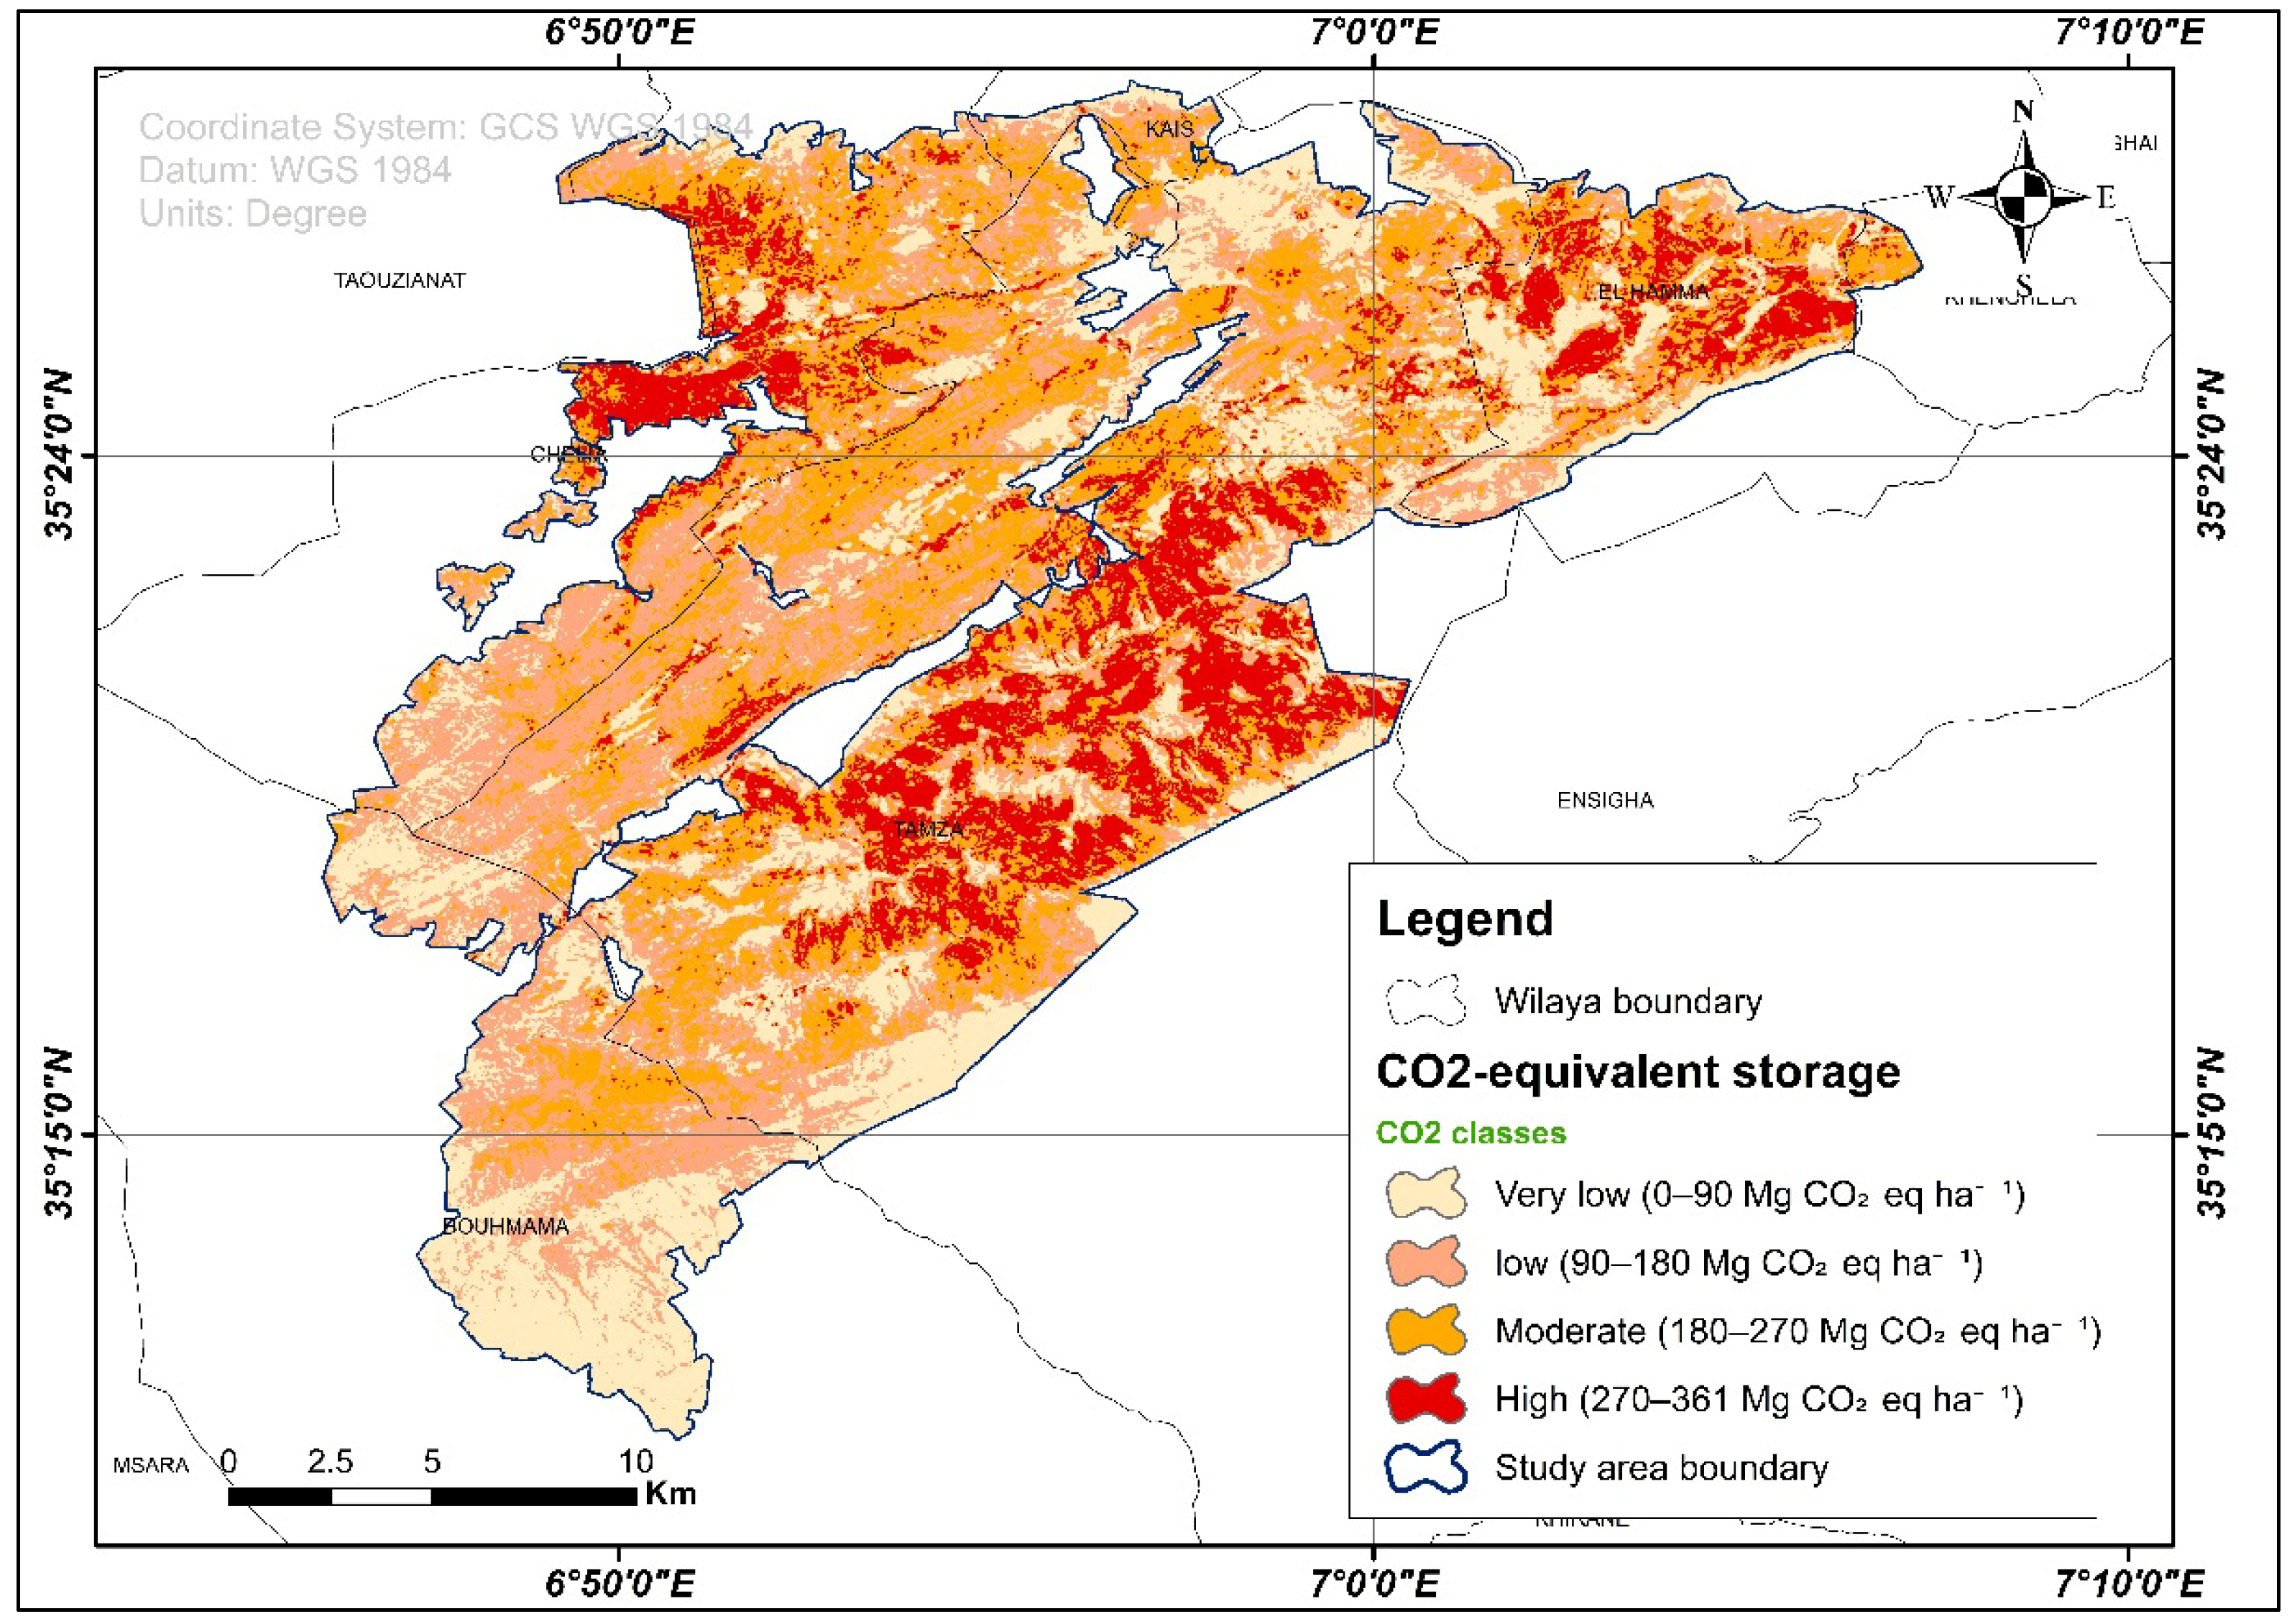
The CO
2-equivalent storage map follows the same spatial pattern as the carbon-stock map because it was directly derived from carbon stock using the molecular conversion factor of 3.667. High CO
2-equivalent values, ranging from 270 to 361 Mg CO
2eq ha
−1, are concentrated in the same dense forest sectors that showed high carbon-stock values. These areas represent the most important zones for climate-regulation services within the Ouled Yagoub Forest (
Figure 13).
Lower CO
2-equivalent storage values occur in sparse, degraded, or open-canopy areas, where predicted AGB and carbon stock are reduced. This confirms that the climate-mitigation potential of the forest is spatially uneven and strongly linked to the conservation of dense and structurally developed stands. The highest carbon-stock and CO
2-equivalent classes are likely associated with dense and structurally developed forest patches, particularly cedar-dominated or mixed cedar stands, because
Cedrus atlantica individuals stored much higher biomass per tree than
Pinus halepensis. In the field inventory, healthy cedar trees showed substantially higher above-ground biomass than declining cedar trees, indicating that cedar health status directly influences carbon-storage capacity. The inventory included 661 measured trees, with 467
Pinus halepensis and 194
Cedrus atlantica individuals, including 122 healthy and 72 declining cedar trees [
5].
These high carbon-stock zones should therefore be considered priority areas for cedar conservation. If dense cedar-dominated sectors are progressively affected by dieback, they may experience future carbon losses through reduced radial growth, branch mortality, tree mortality, and subsequent biomass decomposition [
7]. This interpretation is consistent with studies reporting that Atlas cedar decline is associated with drought stress, aridification, growth reduction, and biotic damage, including bark beetle and woodborer outbreaks in the Aurès region [
6].
The red/high classes on the carbon-stock and CO
2-equivalent maps should not be interpreted as direct indicators of severe dieback. They represent areas with high estimated biomass and carbon storage derived from the NDVI-based AGB model. To identify where cedar dieback represents the greatest threat to forest carbon stocks, future analyses should overlay the carbon-stock map with a cedar health-status or dieback-severity map [
44]. The most critical zones would correspond to areas where high carbon-stock values coincide with declining cedar stands. This integrated approach is recommended because recent biomass-mapping studies emphasize the value of combining spectral information with structural, ecological and disturbance-related variables to reduce uncertainty in forest carbon-stock assessment [
9].
3.6. Model Uncertainty and Limitations
The performance of the NDVI- and SAVI-based AGB models was evaluated using SEE, RMSE, MAE, Pearson’s correlation coefficient, and the coefficient of determination. In addition, SEE-based relative accuracy was calculated following the approach of [
45] (Equation (13)).
where SEE is the standard error of the estimate and mean field-estimated AGB corresponds to the average plot-level AGB used for model calibration. The results are summarized in
Table 10.
This comparison will determine the most accurate vegetation index for AGB estimation in the Ouled Yagoub Forest, and will directly confirm whether SAVI’s soil-adjustment advantage is significant in the semi-arid pine zone as it was in the mangrove context [
45].
Although the NDVI-based model explained a high proportion of AGB variability, the SEE and RMSE values indicate that substantial prediction uncertainty remains. This uncertainty is likely related to the structural heterogeneity of the Ouled Yagoub Forest, including variation in species composition, tree size, stand density, canopy closure, cedar health status, topographic position, and disturbance history. Similar limitations have been reported in Sentinel-2-based AGB studies, where simple optical vegetation indices may be affected by canopy saturation, topographic complexity, and the limited ability of spectral variables to represent forest vertical structure [
8,
9].
Future biomass modelling should therefore integrate additional and more independent predictors. Sentinel-2 red-edge bands, enhanced vegetation indices, and texture metrics have shown strong sensitivity to forest AGB and can reduce overestimation and underestimation errors [
46]. In addition, combining Sentinel-2 optical data with Sentinel-1 SAR can improve biomass estimation because radar backscatter provides complementary structural information that is not fully captured by optical indices [
47]. For higher-biomass and structurally complex stands, LiDAR-derived canopy height and vertical-structure metrics are particularly valuable because they help reduce saturation effects and improve biomass prediction accuracy [
48].
Therefore, the spatial AGB, carbon-stock, and CO2-equivalent maps produced in this study should be interpreted as field-calibrated spatial estimates rather than direct measurements of forest carbon stock. Future work should include independent validation plots or cross-validation procedures, together with Sentinel-2 red-edge indices, EVI, NDMI, NBR, texture variables, Sentinel-1 SAR features, LiDAR-derived canopy height, slope, aspect, forest type, fire history, and cedar health-status indicators. Such an integrated approach would improve model robustness and reduce uncertainty in biomass and carbon-stock mapping in semi-arid Mediterranean mountain forests.



 ,
,