Article

Environmental Information Disclosure Quality and Green Technology Innovation: Evidence from Chinese Listed Enterprises


1
Digital Silk Road Economic and Trade Cooperation Research Innovation Team, Fujian University of Technology, Fuzhou 350014, China
2
Department of Management Science and Technology, University of Patras, 26504 Rio Patras, Greece
3
School of Department of City and Regional Planning, University of North Carolina at Chapel Hill, Chapel Hill, NC 27599, USA
*
Authors to whom correspondence should be addressed.
Sustainability 2026, 18(17), 8738; https://doi.org/10.3390/su18178738
Submission received: 24 July 2026 / Revised: 23 August 2026 / Accepted: 24 August 2026 / Published: 26 August 2026
(This article belongs to the Section Economic and Business Aspects of Sustainability)

Abstract

This paper investigates the relationship between environmental information disclosure (EID) quality and green technology innovation (GTI) using panel data from Chinese A-share listed companies over 2008–2024. EID quality is measured by a 27-indicator index, and GTI by the number of granted green patents. Based on 39,075 firm-year observations with firm and year fixed effects and firm-level clustered standard errors, the results show that EID quality is significantly and positively associated with GTI, and this association remains robust to a series of checks, including the exclusion of municipalities, a one-period lagged explanatory variable, propensity score matching, and entropy balancing, among other approaches. The mechanism analysis provides evidence consistent with two channels: EID quality is positively associated with Environmental, Social and Governance (ESG) performance and analyst coverage, each of which is positively associated with GTI. The EID–GTI association is also stronger under stronger board environmental expertise, audit quality, government subsidies, and market competition, and in firms with higher managerial myopia. Heterogeneity analysis shows that the positive association is stronger in state-owned enterprises and weaker in heavy-polluting industries and in regions with higher marketization. The study offers updated micro-level evidence on the role of EID quality in corporate green transformation, with implications for regulators and practitioners.

1. Introduction

The transition toward more sustainable patterns of production has made green technological innovation (GTI) increasingly important for both firms and policymakers. Unlike conventional technological innovation, GTI generates economic value while simultaneously contributing to resource efficiency and environmental improvement. It can help firms reduce resource use and pollution, enhance production efficiency, and develop new sources of competitive advantage [1,2]. Nevertheless, investment in green innovation is often associated with substantial initial expenditures, uncertain returns, long development cycles, and considerable knowledge spillovers [3]. Because part of the environmental benefits generated by innovation may accrue to society rather than to the innovating firm alone, firms may have insufficient incentives to commit resources to such activities [4]. Understanding how corporate governance and information environments can strengthen firms’ incentives to pursue GTI is therefore of considerable academic and practical importance.
Environmental information disclosure (EID) represents one potential mechanism through which these incentives can be strengthened. By providing external stakeholders with information about environmental performance, pollution emissions, environmental risks, and environmental management practices, EID improves the visibility of firms’ environmental behavior and facilitates external evaluation [5,6]. The informational value of disclosure is particularly relevant in the Chinese context, where corporate environmental governance has become increasingly important alongside the pursuit of high-quality economic development and the national “dual-carbon” objectives [7]. At the same time, the usefulness of disclosed information depends not only on whether firms disclose environmental information, but also on the quality, completeness, and credibility of that information. Recent developments in carbon measurement and market-based environmental governance have further strengthened the informational basis for corporate environmental assessment, including advances in carbon allowance trading by energy-intensive firms [8], coordinated bidding in carbon and electricity markets [9], multi-source carbon-emission monitoring and certification [10], and facility-level identification of greenhouse-gas emissions using hyperspectral imagery [11]. These developments highlight the growing importance of reliable environmental information for corporate decision-making and external monitoring. Against this background, an important question arises: can higher-quality EID encourage firms to undertake more GTI, and if so, through which channels and under what conditions?
The relationship between environmental disclosure and green innovation has received increasing attention, although the evidence is not entirely consistent. Earlier studies on EID primarily examined its implications for information asymmetry, financing conditions, market valuation, stakeholder relationships, and corporate legitimacy [12,13,14]. More recent research has increasingly connected environmental disclosure with firms’ innovation decisions, particularly as GTI has become an important means of integrating environmental objectives with long-term economic performance. A substantial body of evidence points to a positive association between EID and GTI. For example, Hu et al. [15] report that environmental disclosure can stimulate green innovation among Chinese firms, while Bai and Lyu [16] show that the magnitude of this relationship depends on institutional conditions. Other evidence, however, suggests that the effect may be nonlinear or conditional. Zhang et al. [17] for instance, identify a U-shaped relationship between EID and green technological innovation and further show that financing constraints may influence the strength of this relationship. Feng et al. [18] in contrast, find that environmental disclosure promotes green innovation primarily by easing financing constraints. These differences indicate that the EID–GTI relationship cannot necessarily be understood as a uniform effect across firms and institutional settings. Variations in disclosure measurement, sample periods, and empirical strategies may partly account for the divergent findings [19,20].
Beyond the overall effect, the mechanisms linking EID to GTI deserve further investigation. Financing constraints have already been identified as an important transmission channel in the existing literature [21,22]. However, comparatively less attention has been given to whether the quality of environmental disclosure can influence innovation through firms’ broader sustainability performance and capital-market information environment. Recent studies have established links between Environmental, Social and Governance (ESG) performance, ESG disclosure, and green innovation, suggesting that stronger ESG performance can affect innovation through financing conditions, agency costs, and external monitoring [23,24,25]. Analyst coverage represents another potentially relevant channel because analysts collect and interpret corporate information and transmit it to market participants, thereby increasing external scrutiny and reducing information asymmetry [26]. Nevertheless, existing studies have largely considered ESG performance, ESG disclosure, and analyst coverage as direct determinants of GTI rather than examining whether they constitute intermediate links between EID quality and GTI. Consequently, whether improvements in environmental disclosure quality can stimulate green innovation by strengthening ESG performance or attracting greater analyst attention remains insufficiently understood.
The conditions under which EID is more effective also warrant greater attention. Existing studies have examined various determinants of green innovation from the perspectives of corporate governance, managerial characteristics, institutional investors, auditing, government support, and market competition [27,28]. However, these factors have generally been investigated separately, making it difficult to determine whether the effectiveness of environmental disclosure depends jointly on firms’ internal governance arrangements and their external institutional and market environments. In particular, board members’ environmental expertise may affect how effectively environmental information is incorporated into strategic decisions, while managerial myopia may influence whether disclosure is translated into long-term innovation investment. At the external level, audit quality can affect the credibility of disclosed information, government subsidies can provide additional resources for innovation, and the degree of market competition can shape firms’ incentives to use environmental performance as a source of competitive differentiation. Examining these factors within a common analytical setting can therefore provide a more nuanced understanding of when EID quality is more likely to generate innovation outcomes.
Overall, although existing studies have laid a crucial foundation for understanding the relationship between EID and GTI, three key research gaps remain. First, the exploration of underlying mechanisms is insufficient. Beyond financing constraints, theoretical and empirical evidence regarding ESG performance and analyst coverage as mediating channels is still limited. Second, the investigation of boundary conditions lacks systematicity. Few studies incorporate firms’ internal governance characteristics and external market environments into a unified moderating framework. Third, comprehensive empirical examinations based on the latest data of Chinese listed firms remain scarce. Against this backdrop, this study adopts the latest firm-level data of Chinese listed enterprises as its research sample. On the basis of verifying the positive impact of EID on GTI, this paper expands two mediating paths, namely ESG performance and analyst coverage. Furthermore, it systematically examines the boundary conditions from the perspective of both internal and external factors, including two internal governance characteristics (board environmental background and managerial investment myopia) and three external market factors (audit quality, market competition, and government subsidies). This study aims to provide new empirical evidence for the theoretical improvement and practical implications of research in this field.
This paper is organized as follows: Section 2 elaborates on the research theory and hypotheses. Section 3 introduces the models, variables, and data used in the study. Section 4 presents the results of the baseline regression, robustness tests, mechanism tests, moderating effect analyses, and heterogeneity analyses. Section 5 discusses the conclusions and implications of this paper.

2. Theory Analysis and Research Hypothesis

2.1. Mediating Mechanisms

The positive association between EID quality and GTI may operate through several organizational and information-related channels. This study focuses on ESG performance and analyst coverage as two potential mediating mechanisms.
The first channel is grounded primarily in stakeholder and signaling theories. High-quality EID provides stakeholders with more detailed and credible information about firms’ environmental practices and sustainability commitments. Greater transparency may strengthen stakeholder expectations and encourage firms to align their broader corporate practices with their disclosed environmental commitments. Such alignment can be reflected in stronger ESG performance. In turn, firms with stronger ESG performance may have greater access to external resources, reputational benefits, and stakeholder support that are relevant to long-term green innovation. Thus, ESG performance may represent one channel through which the positive association between EID quality and GTI is manifested.
The second channel concerns the information environment surrounding the firm. From the perspective of information asymmetry theory and corporate governance theory, high-quality EID provides analysts with more comprehensive information for evaluating firms’ environmental risks, strategies, and performance. A more informative disclosure environment may therefore be associated with greater analyst attention. Analyst coverage, in turn, can strengthen external information production and monitoring, making managerial decisions more visible to capital-market participants. Because green innovation generally involves substantial investment and uncertain returns, stronger external scrutiny may be associated with firms’ willingness to maintain green innovation activities. Analyst coverage may therefore constitute another channel linking EID quality to GTI.
Based on these arguments, the following hypotheses are proposed:
Hypothesis 1. 
EID quality is positively associated with GTI.
Hypothesis 1a. 
ESG performance serves as a channel through which EID quality is positively associated with GTI.
Hypothesis 1b. 
Analyst coverage serves as a channel through which EID quality is positively associated with GTI.

2.2. Moderating Effects

In addition to the mediating mechanisms, the positive association between EID quality and GTI is likely to be conditioned by firm-level governance factors and the external institutional environment. These moderating factors are organized into two categories: internal governance mechanisms and the external institutional environment.

2.2.1. Internal Governance Mechanisms

The environmental protection background of board members represents an important internal governance characteristic. Directors with environmental expertise may be better positioned to evaluate the strategic relevance of environmental information and recognize the potential value of green innovation [29]. Such directors are also more likely to attach importance to environmental investment and corporate environmental governance [30]. while their expertise may contribute to the formation of an organizational orientation toward environmental sustainability [31]. Therefore, firms with a stronger environmental background at the board level may be more likely to translate high-quality environmental disclosure into green innovation activities. Accordingly, the following hypothesis is proposed:
Hypothesis 2. 
The environmental protection background of board members positively moderates the relationship between EID and GTI.
Managerial myopia reflects the extent to which managers emphasize short-term returns at the expense of long-term value creation [32]. Because GTI generally involves considerable uncertainty, substantial investment, and relatively long innovation cycles, short-term-oriented managerial decision-making may be particularly relevant to firms’ green innovation decisions. High-quality EID provides greater external visibility of firms’ environmental behavior and may increase managerial accountability for environmental performance. This external pressure may be particularly relevant in firms characterized by stronger managerial myopia, where disclosure can provide an additional constraint on short-term-oriented decisions [28]. Thus, the association between EID quality and GTI may become stronger when managerial myopia is higher. On this basis, this paper puts forward the following hypothesis:
Hypothesis 3. 
Managerial myopia positively moderates the relationship between EID quality and GTI.

2.2.2. External Institutional Environment

High-quality external auditing is an important component of corporate external governance because it can improve the credibility of disclosed information and strengthen oversight of managerial behavior. Yao et al. [33] suggest that high-quality auditing is associated with more reliable environmental information and a lower likelihood of misreporting. Zhao et al. [34] further show that external auditing can constrain opportunistic behavior related to the concealment of pollution information. Since information asymmetry may increase the uncertainty and costs associated with corporate innovation [35], more credible environmental disclosure may be particularly relevant for green innovation when supported by effective external auditing. Gong et al. [36] similarly find that high-quality auditing is associated with greater credibility of environmental reports and a weaker information barrier to green innovation. Building on this reasoning, this paper proposes:
Hypothesis 4. 
High-quality auditing positively moderates the relationship between EID and GTI.
Government subsidies constitute an important external resource channel for green innovation [37]. Firms receiving greater government support may face fewer resource constraints when undertaking environmental investment and green innovation activities [38]. Government subsidies may also signal policy recognition of firms’ environmental strategies, potentially strengthening the credibility of their environmental disclosure. Consequently, the availability of government support may condition the extent to which EID quality is associated with GTI. Therefore, this paper proposes:
Hypothesis 5. 
Government subsidies positively moderate the relationship between EID quality and GTI.
Market competition may also shape the relationship between EID quality and GTI. In more competitive markets, firms face stronger pressure to distinguish themselves from competitors and to communicate their strategic advantages to stakeholders [39]. Environmental performance can provide one potential source of differentiation, while high-quality EID enables firms to communicate their environmental commitments more effectively. Under stronger competitive pressure, firms may therefore have greater incentives to translate environmental disclosure into substantive green innovation in order to maintain or enhance their competitive position [40]. On this basis, this paper puts forward the following hypothesis:
Hypothesis 6. 
Market competition (lower HHI) positively moderates the relationship between EID quality and GTI.
Figure 1 presents the analytical framework of this paper, which summarizes the baseline relationship (H1), the two mediating channels (H1a and H1b), and the five moderating conditions (H2–H6).

3. Research Design

3.1. Model

To empirically validate Hypothesis 1, this study formulates Equation (1) as the analytical framework. If the coefficient β1 is significantly positive, it indicates that EID quality is positively associated with GTI in enterprises. To test Hypothesis 1a, ESG performance is specified as the mediating variable. To establish temporal ordering and mitigate reverse causality concerns, the lagged mediator specification is employed: EID quality in period t is linked to ESG performance in period t + 1, which in turn is linked to GTI in period t + 1. Equations (2) and (3) are formulated accordingly. If the coefficient α1 is significantly positive, and the coefficient γ2 is significantly positive, then Hypothesis 1a is supported. To test Hypothesis 1b, analyst coverage is specified as the mediating variable, reflecting the extent to which EID quality is positively associated with analyst coverage. Equations (4) and (5) are formulated with the lagged mediator design. If the coefficient α1 is significantly positive, and the coefficient γ2 is significantly positive, then Hypothesis 1b is supported.
G T I i t = β 0 + β 1 E I D i t + β k k C o n t r o l i t k + λ i d + η y e a r + ε i t
E S G i , t + 1 = α 0 + α 1 E I D i t + α k k C o n t r o l i t k + λ i d + η y e a r + ε i t
G T I i , t + 1 = γ 0 + γ 1 E I D i t + γ 2 E S G i , t + 1 + γ k k C o n t r o l i t k + λ i d + η y e a r + ε i t
A N A L Y S T i , t + 1 = α 0 + α 1 E I D i t + α k k C o n t r o l i t k + λ i d + η y e a r + ε i t
G T I i , t + 1 = γ 0 + γ 1 E I D i t + γ 2 A N A L Y S T i , t + 1 + γ k k C o n t r o l i t k + λ i d + η y e a r + ε i t
To test Hypotheses 2 through 6, this paper incorporates five moderating variables into Equation (1), introducing interaction terms between EID quality and each moderator. Equation (6) is formulated. If the interaction coefficients β3 are statistically significant, the corresponding moderation hypotheses are supported.
G T I i t = β 0 + β 1 E I D i t + β 2 M i t + β 3 E I D i t × M i t + β k k C o n t r o l i t k + λ i d + η y e a r + ε i t
w h e r e   M E P B O D , M M , A Q , G O V S U B , H H I
In the above Equations (1)–(6), the subscripts i and t denote firm and year indicators, respectively. The dependent variable, GTI, is measured by the natural logarithm of one plus the number of granted green patents. The independent variable, EID, quantifies the quality of corporate environmental disclosure, measured by a comprehensive index constructed from 27 disclosure indicators. To address potential omitted variable concerns, the models incorporate a set of control variables, denoted as Control, including firm size (Size), ownership concentration (First), revenue growth (Growth), institutional ownership (INI), leverage (LEV), return on assets (ROA), CEO duality (Twoduty), and firm age (Age). Firm size is included in particular to account for its influence on disclosure, patenting, and access to external financing. λid signifies individual fixed effects, ηyear denotes year fixed effects, and ε represents the stochastic error term. Given the panel structure of the data, standard errors are clustered at the firm level to account for within-firm correlation over time. The findings are interpreted as conditional associations rather than causal effects, given the observational nature of the data.

3.2. Variable

3.2.1. The Dependent Variable and the Independent Variable

GTI is the dependent variable, measured by the number of green technology patents applied for by enterprises. Building on prior research [24,41,42,43,44], this paper identifies green patents based on the International Patent Classification Green Inventory list published by the World Intellectual Property Organization (WIPO) in 2010. The patent data for enterprises are sourced from the China National Intellectual Property Administration (CNIPA). Industry classification adheres to the Classification of National Economic Industries (GB/T 4754-2017) [45] announced by the National Bureau of Statistics in 2017. The benchmark measure of GTI is the total number of granted green patents, defined as the sum of green invention patent grants and green utility model patent grants. Granted patents, rather than patent applications, are employed as the primary measure because grants reflect actual innovation output that has passed examination and approval, thereby capturing higher-quality innovation with less noise [19]. The variable is transformed as ln(1 + patent count) to address skewness, with zero counts retained in the sample.
EID is the explanatory variable in this paper. Following prior studies [41,42,43], this paper draws on the environmental database of the China Stock Market & Accounting Research (CSMAR) to construct an EID quality index based on 27 items grouped into four categories. Fifteen non-monetary items cover environmental management (8 items) and environmental supervision and certification (7 items); for each of these items, disclosure is coded as 2 and non-disclosure as 0. The remaining twelve monetary items cover environmental pollutants (6 items) and environmental performance and governance (6 items); they are coded 2 when both quantitative and qualitative information is provided, 1 when only qualitative information is provided, and 0 when no information is provided. The index is the arithmetic mean of the 27 item scores, that is, the sum of the scores divided by 27, and items that are not disclosed or unavailable are assigned 0. The arithmetic mean is used instead of a logarithmic transformation to preserve the full cross-firm variation in disclosure quality. The detailed classification and scoring framework are presented in Table 1.

3.2.2. Mediating Variables

ESG performance reflects a firm’s comprehensive performance in environmental protection, social responsibility, and corporate governance, and serves as a channel through which EID quality may be associated with GTI. Following the approach of Xu et al. [48], ESG performance is measured using the Sino-Securities Index (Huazheng) ESG rating system, which assigns scores from 1 to 9 based on the overall ESG rating (C = 1 to AAA = 9). The variable ESG is calculated as ln(1 + ESG score).
Analyst coverage reflects the degree of attention that securities analysts pay to a firm. According to information asymmetry theory, analysts serve as information intermediaries who collect, process, and disseminate corporate information to market participants. Higher-quality environmental disclosure provides analysts with more comprehensive and credible information, thereby attracting greater analyst coverage. Increased analyst coverage reduces information asymmetry between firms and investors, strengthens external monitoring of managerial behavior, and pressures management to translate environmental commitments into substantive green innovation outcomes. Analyst coverage is measured as the natural logarithm of one plus the number of analysts who issued research reports on the firm during the year.
In the mediation analysis, both mediators are lagged by one period relative to the explanatory variable (EID quality at period t, mediators at period t + 1, and GTI at period t + 1) to establish temporal ordering and mitigate reverse causality concerns. The two mediation channels are estimated using a consistent sample to ensure comparability of results.

3.2.3. Moderating Variables

EPBOD: The data on the environmental protection background of board members are obtained from their resumes published on the Sina Finance website. A board member is considered to have an environmental protection background if his or her resume contains keywords such as “environment,” “environmental protection,” “renewable energy,” “clean energy,” “ecology,” “low-carbon,” “sustainability,” “energy conservation,” and “green.” Based on this criterion, EPBOD is measured as the proportion of board members with an environmental protection background, calculated as the number of such directors divided by the total number of board members.
MM: Managerial myopia captures the extent to which managers favor short-term gains over long-term value creation, a tendency that environmental disclosure can help restrain. From a principal-agent perspective, the divergence of interests between owners and managers encourages short-sighted decisions that impede green transformation, and more transparent environmental reporting reduces such agency frictions and information gaps. To quantify this construct, this study follows Cao et al. [32], and applies textual analysis to corporate annual reports. A list of 30 short-horizon expressions (for example, “at the latest,” “within days,” and “as soon as possible”) is used, and MM is measured as the share of these expressions in the total word frequency of the annual report, expressed as a percentage. Larger values of MM indicate stronger short-term orientation.
AQ: To capture audit quality, this study follows the estimation strategy of Gul et al. [49], and predicts the probability that a firm receives a standard unqualified audit opinion using the following model. Audit quality is then constructed from the gap between the fitted probability and the realized indicator of a standard unqualified opinion; the negative absolute value of this gap is used as the audit quality measure. The estimation setup is described below:
M a o i t = α 0 + α 1 Q u i c k R i t + α 2 A R i t + α 3 O t h e r i t + α 4 I n v i t + α 5 R O A i t + α 6 L o s s i t + α 7 L e v i t                                                     + α 8 S i z e i t + α 9 A g e i t + α 10 I n d u s t r y + α 11 Y e a r + ε i t
A Q i t = | O p i n i o n i t M a o i t |
In this model, QuickR, AR, Other, Inv, ROA, Loss, Lev, Size and Age represent the conservative quick ratio, accounts receivable to total assets ratio, other receivables to total assets ratio, inventory to total assets ratio, return on total assets, whether the company incurred a loss in the current year, debt-to-asset ratio, company size, and the firm age, respectively. Opinion represents the probability that an auditor actually issues a standard unqualified audit opinion. The greater the discrepancy between the actual probability of issuing a standard unqualified audit opinion and the predicted probability, the poorer the audit quality indicates. This is because a positive deviation signifies the auditor’s level of aggressiveness; the higher the aggressiveness, the greater the likelihood of misleading investors. Conversely, a negative deviation indicates the auditor’s level of conservatism; the higher the conservatism, the more likely it is to impair the informational value of the financial statements. This paper uses the negative absolute value of the deviation degree between the actual and predicted probabilities of issuing an unqualified opinion, denoted as AQ, to measure audit quality. A larger AQ value indicates higher audit quality, while a smaller AQ value suggests lower audit quality.
GOVSUB: Government subsidies captures the financial support that firms receive from the government. Government subsidies provide firms with additional resources that can be allocated toward green innovation activities. GOVSUB is measured as the natural logarithm of one plus the total amount of government subsidies received by the firm during the year.
HHI: Market competition (HHI) measures the level of market competition based on the Herfindahl–Hirschman Index, calculated using firms’ total assets within each industry-year. Higher HHI values indicate greater market concentration and thus lower competition. A lower HHI reflects a more competitive market environment.

3.2.4. Heterogeneity Variables

To investigate the boundary conditions of the EID–GTI association, this study introduces three heterogeneity variables. State ownership (SOE) is a dummy equal to 1 for state-owned enterprises and 0 otherwise, based on ownership information from CSMAR. Heavy-polluting industry (INU) is a dummy equal to 1 if the firm belongs to one of the 17 heavy-polluting industries identified in the CSRC 2012 [50] industry classification, and 0 otherwise. Regional marketization (MKT) is a dummy equal to 1 if the firm’s province-year marketization index exceeds the annual sample median, and 0 otherwise. These three dimensions capture the firm’s internal resource endowment, external regulatory pressure, and regional institutional environment, respectively, and are used in the interaction-term heterogeneity analyses in Section 4.6.

3.2.5. Control Variables

Considering that other factors may also influence green innovation, this paper includes two types of control variables in the model. The first type comprises the basic characteristics of listed companies [25,41]: firm size (Size), measured as the natural logarithm of total assets; leverage (LEV), measured as the ratio of total liabilities to total assets; return on assets (ROA), measured as the ratio of net profit to total assets; revenue growth rate (Growth), measured as the year-over-year growth rate of operating income; and firm age (Age), measured as the number of years since the firm’s establishment. Firm size is included because it affects firms’ disclosure behavior, patenting activity, and access to external financing, and its omission could bias the estimated relationship between EID quality and GTI.
The second type represents corporate governance levels: ownership concentration (First), measured as the shareholding proportion of the largest shareholder; institutional ownership (INI), measured as the shareholding proportion of institutional investors; and CEO duality (Twoduty), which equals 1 if the chairman and the general manager are the same person, 2 otherwise, and 0 for firm-years with missing duality information.
Additionally, the models control for individual fixed effects (λid) and year fixed effects (ηyear) to account for time-invariant firm characteristics and common macroeconomic shocks. Standard errors are clustered at the firm level. Definitions of each variable are provided in Table 2.

3.3. Data

This paper focuses on the population of A-share listed companies over 2008–2024. Chinese listed firms are selected because China is the world’s largest carbon emitter and therefore faces exceptionally strong pressure to reduce emissions; as the micro-units that ultimately implement carbon reduction, these firms’ experience in identifying the factors associated with GTI can offer useful lessons for other countries pursuing green development. The sample was screened in two stages. At the data-collection stage, financial-sector firms (per the CSRC 2012 [50] industry classification) and firms with ST/*ST status, including those ever marked as ST or *ST, were removed from the China Stock Market & Accounting Research database (CSMAR) download using the database’s sample-selection function. This left 40,012 firm-years covering 4454 firms. At the analysis stage, observations with missing values for any key variable (EID quality, granted green patents, or controls) were dropped, leaving 39,176 firm-years for 4215 firms, and firms appearing in only one year were then removed to ensure panel validity, producing a final benchmark sample of 39,075 firm-years for 4114 firms. Among the key variables, EID quality and granted green patents account for most of the missing observations (780 and 771 firm-years, respectively), while missingness in the control variables is below 0.3% of the matched sample. Unless noted otherwise, each specification is estimated on the largest sample for which all variables are non-missing.
The data for granted green patents are collected by the authors from the China National Intellectual Property Administration (CNIPA). The data for EID are obtained from CSMAR. The ESG ratings are obtained from the Sino-Securities Index (Huazheng) ESG rating system. Analyst coverage data are obtained from CSMAR. Government subsidy data are obtained from CSMAR. The Herfindahl–Hirschman Index is constructed from CSMAR financial data. All control variables are derived from CSMAR. To avoid the influence of abnormal values, all continuous variables are winsorized at the 1st and 99th percentiles. Following a specification-wise complete-case rule, each regression is estimated on the maximum sample for which all variables in that specification are non-missing.
As shown in the descriptive statistics table (Table 3), the dependent variable, GTI, has a mean value of 0.749, a standard deviation of 1.061, a minimum value of 0, a median of 0.000, and a maximum value of 4.431. The median of zero indicates that more than half of the firm-year observations have no granted green patents, reflecting the general scarcity of green innovation output in the sample. The explanatory variable, EID, has a mean value of 0.453, a standard deviation of 0.379, a minimum value of 0.074, a median of 0.333, and a maximum value of 1.519, indicating considerable variation in EID quality across firms. The descriptive statistics for all variables are reported in Table 3. It should be noted that the number of observations varies across variables due to data availability for individual measures. Following standard practice, all regression analyses employ a complete-case approach: each regression uses the maximum sample for which all variables in that specification are available. Consequently, the baseline regression uses 39,075 firm-year observations, while the mechanism regressions involving certain mediating variables use somewhat smaller samples due to data availability. The descriptive statistics in Table 3 report the non-missing observation count for each variable.

4. Results

4.1. Variables Correlation Analysis

As presented in Table 4, the correlation coefficients between all variables are below 0.7, suggesting a relatively low likelihood of multicollinearity among these variables. The explanatory variable, EID, exhibits a positive and statistically significant correlation with the dependent variable, GTI (r = 0.292, p < 0.01), indicating a potential positive relationship between the two. However, it is important to note that correlation analysis is limited to assessing pairwise relationships between variables and does not account for the potential influence of other variables. Therefore, these results can only serve as a preliminary assessment of variable associations. To further analyze the factors influencing GTI, additional investigation is required in conjunction with the subsequent regression analysis.

4.2. Baseline Regression Results

Table 5 presents the regression results. Column (1) reports the model without control variables but with firm and year fixed effects. The coefficient on EID quality is 0.223 (t = 8.768), statistically significant at the 1% level. Column (2) adds the full set of control variables, including firm size, leverage, return on assets, revenue growth, ownership concentration, institutional ownership, CEO duality, and firm age. The coefficient on EID quality is 0.146 (t = 6.132), remaining statistically significant at the 1% level. The R-squared increases from 0.731 in Column (1) to 0.742 in Column (2), indicating that the control variables explain additional variation in GTI.
These results support Hypothesis 1, indicating that higher EID quality is significantly and positively associated with greater GTI, as measured by granted green patents. In economic terms, a one-unit increase in the EID quality index is associated with a 0.146 increase in the natural logarithm of granted green patents, holding other factors constant.

4.3. Robustness Test

4.3.1. Alternative Measures of GTI

To ensure the robustness of the baseline results, this paper employs alternative measures of GTI. Specifically, green invention patent grants and green utility model patent grants are used as alternative dependent variables. The regression results, presented in Columns (1)–(2) of Table 6, demonstrate that EID quality has a significant positive impact on both green invention patent grants (β = 0.115, p < 0.01) and green utility model patent grants (β = 0.136, p < 0.01). These findings further corroborate the robustness of the benchmark regression results.

4.3.2. Regression Analysis Excluding Municipalities Directly Under the Central Government

Given the differences in administrative status and government support between the four municipalities directly under the central government (Beijing, Shanghai, Tianjin, and Chongqing) and other regions, this paper excludes data from these municipalities for robustness testing. The regression results, presented in Column (3) of Table 6, demonstrate that the impact of EID quality on corporate GTI remains statistically significant and positive (β = 0.129, p < 0.01). This finding further corroborates the robustness of the benchmark regression results.

4.3.3. Regression Analysis with One-Period Lagged Explanatory Variable

To address the time lag effect of EID quality on GTI, this paper applies a one-period lag to the explanatory variable. The regression results, presented in Column (4) of Table 6, demonstrate that EID quality continues to exert a statistically significant positive impact on GTI (β = 0.127, p < 0.01), consistent with the findings reported earlier.

4.3.4. Propensity Score Matching

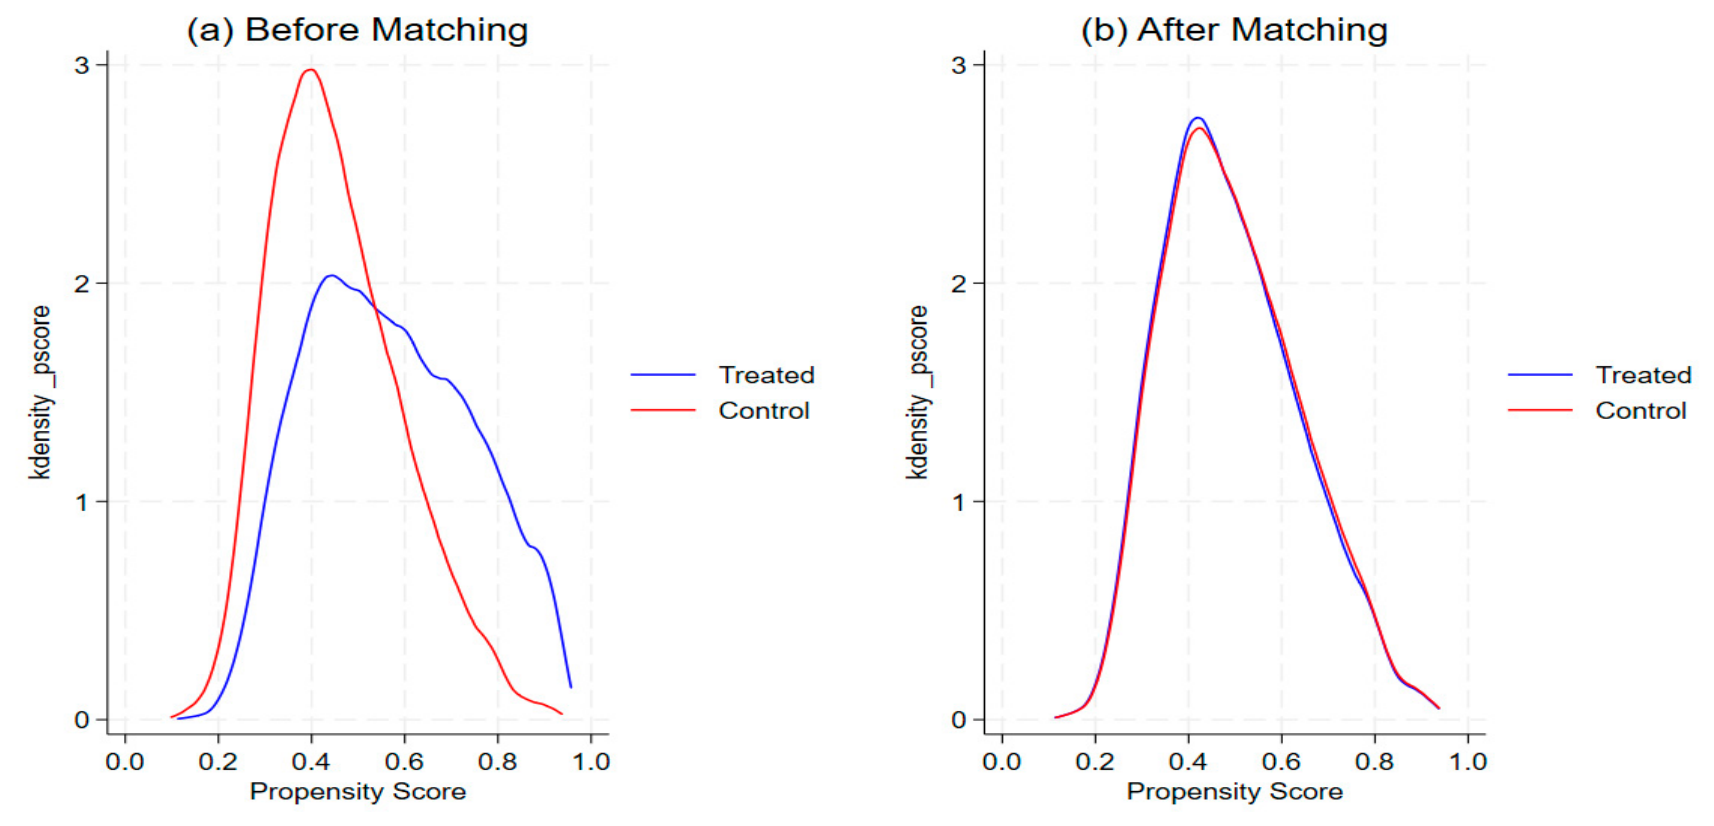
To reduce the risk that treated and control firms differ systematically, this paper applies propensity score matching (PSM). Firms are classified into treatment and control groups according to whether their EID quality exceeds the annual sample median. Propensity scores are estimated from a logit model that includes the full set of control variables, and each treated firm is matched to the nearest control firm (1:1) on the propensity score. Figure 2 shows that, after matching, the propensity-score distributions of the two groups overlap closely and the standardized mean differences of all covariates fall below 10%, indicating satisfactory balance. In the matched sample, EID quality remains significantly positively associated with GTI (β = 0.098, p < 0.01; Column (5) of Table 6), consistent with the baseline results.

4.3.5. Entropy Balancing

Furthermore, to further test the robustness of the results, this paper employs the entropy balance method, which reweights the control observations to achieve a precise balance of covariate moments while preserving the complete sample. The regression result, presented in Column (6) of Table 6, shows that EID quality remains significantly positively associated with GTI (β = 0.112, p < 0.01), further confirming the robustness of the baseline findings.

4.3.6. Additional Robustness Checks

To further assess the sensitivity of the baseline results, this study conducts four additional checks, with the results reported in Table 7. First, the benchmark regression is re-estimated with two-way clustering by firm and year to account for potential cross-firm correlation within each year. The coefficient on EID quality remains significantly positive (β = 0.146, t = 4.50). Second, a balanced panel comprising firms present in every sample year is used, and EID quality remains significantly positively associated with GTI (β = 0.188, p < 0.01). Third, the COVID-19 pandemic years are excluded to ensure that the results are not driven by pandemic-period shocks. The coefficient on EID quality remains significantly positive both when the years 2020–2022 are excluded (β = 0.167, p < 0.01) and when only 2020 is excluded (β = 0.168, p < 0.01). Fourth, observations with absolute standardized residuals greater than three are excluded to assess sensitivity to influential observations; the coefficient remains significantly positive (β = 0.152, p < 0.01). Overall, these additional checks corroborate the robustness of the benchmark findings.

4.4. Mechanism Analysis

To identify the channels through which EID quality is associated with GTI, this paper estimates the mediation models specified in Section 3.1, in which the mediating variables and the dependent variable are measured one period ahead. Table 8 reports the estimation results.

4.4.1. The Mediating Role of ESG Performance

Column (1) of Table 8 shows that EID quality is significantly positively associated with one-period-ahead ESG performance (α1 = 0.056, p < 0.01). Column (2) shows that ESG performance is significantly positively associated with GTI (γ2 = 0.489, p < 0.01), while EID quality remains statistically significant. The indirect effect is 0.027, with a Sobel Z statistic of 4.77 (p < 0.01). As descriptive evidence on the relationship between the two constructs, the correlation between the 27-item EID quality index and ESG performance is 0.384, indicating that the two measures are related but far from identical. As a further check, an alternative mediator using only the social and governance components (ESG-SG) is constructed; its correlation with EID quality is 0.238, and the mediation channel remains significant (Sobel Z = 4.99). These results are consistent with Hypothesis 1a.

4.4.2. The Mediating Role of Analyst Coverage

Column (3) of Table 8 shows that EID quality is significantly positively associated with analyst coverage (α1 = 0.155, p < 0.01). Column (4) shows that analyst coverage is significantly positively associated with GTI (γ2 = 0.027, p < 0.01), while EID quality remains statistically significant. The indirect effect is 0.155 × 0.027 = 0.004, with a Sobel Z statistic of 2.98 (p < 0.01). These results confirm that analyst coverage is a positive mediating channel through which EID quality is positively associated with GTI, supporting Hypothesis 1b.
To further assess the statistical significance of the indirect effects, this study supplements the Sobel tests with bootstrap inference based on 200 replications and clustering at the firm level. The bootstrap 95% confidence intervals are [0.016, 0.040] for the ESG channel and [0.002, 0.007] for the analyst coverage channel, neither of which contains zero. Taken together, the two channels are consistent with EID quality being positively associated with GTI through ESG performance and analyst coverage.

4.5. Moderating Effect

To examine H2–H6, this paper augments Equation (1) with interaction terms between EID quality and five moderating variables. Following the analytical framework in Section 2.2, these moderators are classified into internal governance mechanisms, including the environmental protection background of board members (EPBOD) and managerial myopia (MM), and the external institutional environment, including audit quality (AQ), government subsidies (GOVSUB), and market competition (HHI). Table 9 reports the estimation results.
Column (1) of Table 9 shows that the coefficient on the interaction term EID × EPBOD is significantly positive (β3 = 0.556, p < 0.01). Board members with environmental protection backgrounds can better evaluate the strategic value of environmental disclosure and are more willing to translate disclosed environmental commitments into green innovation outcomes. As the number of such board members increases, the positive association between EID quality and GTI becomes stronger, supporting Hypothesis 2.
Column (2) of Table 9 shows that the coefficient on EID × MM is significantly positive (β3 = 1.594, p < 0.01). Managerial myopia reflects the tendency of managers to prioritize short-term gains over long-term value creation. In firms with higher managerial myopia, the corrective role of EID is more valuable, because disclosure compels short-sighted managers to pay attention to environmental responsibility and reduces the agency conflicts that hinder green transformation. Consequently, the positive relationship between EID quality and GTI is amplified in firms with higher managerial myopia, supporting Hypothesis 3.
Column (3) of Table 9 shows that the coefficient on EID × AQ is significantly positive (β3 = 0.362, p < 0.05). High-quality external audit enhances the credibility and reliability of disclosed environmental information, reduces information asymmetry between firms and stakeholders, and constrains managerial opportunism. High-quality auditing thereby strengthens the translation of EID quality into green innovation, supporting Hypothesis 4.
Column (4) of Table 9 shows that the coefficient on EID × GOVSUB is significantly positive (β3 = 0.021, p < 0.01). Government subsidies provide firms with additional financial resources that can be allocated to green innovation and may also signal government endorsement, enhancing the credibility of corporate environmental disclosure. The positive association between EID quality and GTI becomes stronger as government subsidies increase, supporting Hypothesis 5.
Column (5) of Table 9 shows that the coefficient on EID × HHI is significantly negative (β3 = −1.406, p < 0.01). Since higher HHI values indicate greater market concentration and thus lower competition, this result implies that EID quality has a stronger positive association with GTI in more competitive markets. Competitive pressure motivates firms to convert environmental disclosure into green innovation as a means of differentiation, supporting Hypothesis 6.
Taken together, the five moderating effects are all statistically significant. The positive effects of EID quality on GTI are strengthened by internal governance factors (EPBOD and MM) and external institutional factors (AQ, GOVSUB, and market competition), indicating that both firm-level governance and the external environment shape the boundary conditions of the EID–GTI relationship.

4.6. Heterogeneity Analysis

To examine whether the relationship between EID quality and GTI varies across firm and regional characteristics, this study estimates interaction models with ownership type, industry pollution level, and regional marketization. Table 10 reports the results.
Column (1) of Table 10 shows that the coefficient on EID × SOE is significantly positive (β3 = 0.263, p < 0.01), indicating that the positive association between EID quality and GTI is stronger in state-owned enterprises (SOEs). SOEs generally have closer government ties, more abundant financial resources, and clearer institutional pressure to fulfill environmental responsibilities, which facilitates the transformation of improved disclosure into green innovation outcomes. In contrast, non-state-owned enterprises are more market-oriented but may face resource constraints and short-term performance pressure that dampen this translation process.
Column (2) of Table 10 shows that the coefficient on EID × INU is significantly negative (β3 = −0.150, p < 0.01), indicating that the positive association between EID quality and GTI is weaker in heavy-polluting industries. Heavy-polluting firms face higher environmental compliance costs and stricter regulatory supervision, which may crowd out resources available for green innovation. For these firms, disclosure-induced pressure tends to be absorbed by compliance and remediation activities rather than being converted into innovation, weakening the marginal effect of EID quality.
Column (3) of Table 10 shows that the coefficient on EID × MKT is significantly negative (β3 = −0.078, p < 0.05), indicating that the positive association between EID quality and GTI is weaker in regions with higher marketization. In regions with well-developed market institutions, information environments and alternative governance channels are already efficient, so the marginal contribution of environmental disclosure is relatively limited. In regions with lower marketization, EID quality serves as a stronger signaling and commitment device that substitutes for weak external institutions, and therefore exerts a more pronounced effect on GTI.
Overall, the heterogeneity analysis indicates that the EID–GTI relationship is conditional on ownership structure, industry pollution intensity, and regional institutional development, providing a more complete picture of the boundary conditions of the main finding.

5. Conclusions, Implications, and Limitations

5.1. Conclusions

Using panel data on Chinese A-share listed companies from 2008 to 2024, this study examines the relationship between EID quality and GTI. The results show that EID quality is significantly and positively associated with GTI, and this association remains stable across a series of robustness checks.
The mechanism analysis identifies two channels through which the positive association between EID quality and GTI operates: ESG performance and analyst coverage. This finding is consistent with stakeholder, signaling, and information asymmetry perspectives.
The boundary conditions are also examined. The positive association is more pronounced when board members have stronger environmental expertise and in firms with higher managerial myopia, reflecting the corrective role of disclosure; it is further reinforced by high-quality audit, government subsidies, and competitive markets. Moreover, the association is stronger in state-owned enterprises, weaker in heavy-polluting industries, and weaker in regions with higher marketization, implying that firm ownership, industry pollution intensity, and regional institutional development jointly shape the effect of EID quality on GTI.
Overall, this study provides updated micro-level evidence from Chinese listed companies, a unified framework of multiple mechanisms, and a systematic analysis of boundary conditions, thereby extending the literature on EID and green innovation. The findings also inform differentiated policy design that accounts for firm and regional heterogeneity.

5.2. Policy Implications

At the corporate level, firms should view environmental disclosure as part of their broader strategic and governance practices rather than merely as a compliance requirement. Improving the quality and completeness of EID may be accompanied by stronger ESG performance and greater analyst attention, both of which are positively associated with GTI in our analysis. Firms may therefore benefit from integrating environmental disclosure more closely with long-term innovation planning. In addition, greater attention should be given to environmental expertise at the board level and to the potential constraints imposed by managerial short-termism on long-term green innovation.
At the government planning level, policy responses should take account of the heterogeneity identified in this study. For state-owned enterprises, policymakers could further strengthen accountability mechanisms that encourage firms to align environmental disclosure with substantive innovation activities. For heavy-polluting industries, targeted support, including technical assistance and green financing, may help firms cope with the resource pressures associated with environmental compliance and technological transition. In regions with lower levels of marketization, policymakers could place greater emphasis on improving environmental enforcement and information infrastructure to create a more supportive institutional environment for firms’ green innovation.
At the policy-design level, regulators should continue to refine environmental disclosure standards and consider expanding mandatory disclosure requirements in industries with substantial environmental risks. Complementary policy instruments, including subsidies, tax incentives, and green finance, can also be used to alleviate resource constraints associated with green technological transformation. At the same time, strengthening external audit quality and verification mechanisms is important for maintaining the reliability and credibility of disclosed environmental information.
At the regulatory and social levels, greater attention should be paid to the quality of environmental information and the effectiveness of external auditing. Regulators can strengthen oversight of disclosure practices, while media organizations and the public can play a complementary monitoring role by increasing attention to firms’ environmental performance. Together, these measures may strengthen the informational and governance functions of EID and create conditions that are more conducive to firms’ long-term green innovation.

5.3. Limitations

This study has several limitations. First, because the analysis is based on observational panel data rather than a randomized research design, the findings should be interpreted as conditional associations; establishing causal effects would require stronger identification strategies, which represent an important avenue for future research. Second, the EID quality index is constructed from disclosure content scoring and may not capture all dimensions of information quality, such as accuracy and timeliness. Third, GTI is measured by granted green patents, which reflects formal innovation output but may understate informal or non-patentable green practices. Fourth, the sample is limited to Chinese listed companies, so the applicability of the findings to other institutional contexts should be examined in future work. Finally, although this study identifies two mediating channels and five moderating conditions, other mechanisms, such as R&D investment and supply-chain green collaboration, may also play important roles and deserve further investigation. Future research could also compare voluntary and mandatory disclosure regimes and examine how positive and negative environmental information differentially shape green innovation.

Author Contributions

Conceptualization, W.W. and J.X.; methodology, J.X.; wrote the manuscript, W.W.; data curation, Y.S.; review and editing, H.W.; supervision, D.P. and J.Z. All authors have read and agreed to the published version of the manuscript.

Funding

This research was funded by the Basic Research Special Project of Provincial Public Research Institutions of the Fujian Provincial Science and Technology Department (2025R1008009), Innovation Strategy Project of the Fujian Province Science and Technology Department (2024R01030201), and Digital Silk Road Economic and Trade Cooperation Research Innovation Team of Fujian University of Technology (E4300095).

Institutional Review Board Statement

Not applicable.

Informed Consent Statement

Not applicable.

Data Availability Statement

The raw data supporting the conclusions of this article will be made available by the authors on request.

Conflicts of Interest

The authors declare no conflicts of interest.

References

  1. Yang, W.; Chen, Q.; Guo, Q.; Huang, X. Towards Sustainable Development: How Digitalization, Technological Innovation, and Green Economic Development Interact with Each Other. Int. J. Environ. Res. Public Health 2022, 19, 12273. [Google Scholar] [CrossRef] [Scilit]
  2. Palčič, I.; Prester, J. Impact of Advanced Manufacturing Technologies on Green Innovation. Sustainability 2020, 12, 3499. [Google Scholar] [CrossRef] [Scilit]
  3. Ahmed, Z.; Ahmad, M.; Murshed, M.; Ibrahim Shah, M.; Mahmood, H.; Abbas, S. How Do Green Energy Technology Investments, Technological Innovation, and Trade Globalization Enhance Green Energy Supply and Stimulate Environmental Sustainability in the G7 Countries? Gondwana Res. 2022, 112, 105–115. [Google Scholar] [CrossRef] [Scilit]
  4. Alshammari, K.H.; Alshammari, A.F. Green Innovation and Its Effects on Innovation Climate and Environmental Sustainability: The Moderating Influence of Green Abilities and Strategies. Sustainability 2023, 15, 15898. [Google Scholar] [CrossRef] [Scilit]
  5. Yang, S.; Wang, W.; Ding, T. Intelligent Transformation and Sustainable Innovation Capability: Evidence from China. Financ. Res. Lett. 2023, 55, 103963. [Google Scholar] [CrossRef] [Scilit]
  6. Lv, C.; Shao, C.; Lee, C.-C. Green Technology Innovation and Financial Development: Do Environmental Regulation and Innovation Output Matter? Energy Econ. 2021, 98, 105237. [Google Scholar] [CrossRef] [Scilit]
  7. Li, X.; Zhu, J.; Zheng, Z.; Zhao, Z. Special Economic Zones Upgrading and Carbon Emission Reduction: Firm-Level Evidence from China. Appl. Econ. 2026, 58, 4731–4746. [Google Scholar] [CrossRef] [Scilit]
  8. Liu, Y.; Sun, H.; Meng, B.; Jin, S.; Chen, B. How to Purchase Carbon Emission Right Optimally for Energy-Consuming Enterprises? Analysis Based on Optimal Stopping Model. Energy Econ. 2023, 124, 106758. [Google Scholar] [CrossRef] [Scilit]
  9. Sun, X.; Ding, Y.; Bao, M.; Ouyang, X.; Song, Y.; Zheng, C.; Gao, X. Strategic Bidding Model for Multi-Energy Industrial Parks Considering Spatio-Temporal Carbon Emission Factors in Carbon and Electricity Markets. Renew. Sustain. Energy Rev. 2025, 219, 115764. [Google Scholar] [CrossRef] [Scilit]
  10. Liu, Y.; Tian, L.; Zou, B.; Zhao, P.; Gan, C. Multi-Source Carbon Emission Monitoring and Certification for Carbon-Neutral Industrial Parks. J. Clean. Prod. 2026, 570, 148612. [Google Scholar] [CrossRef] [Scilit]
  11. Zhang, Y.; Han, G.; Huang, Y.; Wang, H.; Zhang, H.; Pei, Z.; Pu, Y.; Luo, H.; Yi, J.; Shi, T.; et al. Attributing GHG Emissions to Individual Facilities Using Multi-Temporal Hyperspectral Images: Methodology and Applications. ISPRS J. Photogramm. Remote Sens. 2026, 232, 937–956. [Google Scholar] [CrossRef] [Scilit]
  12. Clarkson, P.M.; Li, Y.; Richardson, G.D.; Vasvari, F.P. Revisiting the Relation between Environmental Performance and Environmental Disclosure: An Empirical Analysis. Account. Organ. Soc. 2008, 33, 303–327. [Google Scholar] [CrossRef] [Scilit]
  13. Li, Y.; Richardson, G.D.; Thornton, D.B. Corporate Disclosure of Environmental Liability Information: Theory and Evidence. Contemp. Account. Res. 1997, 14, 435–474. [Google Scholar] [CrossRef] [Scilit]
  14. Clarkson, P.M.; Fang, X.; Li, Y.; Richardson, G. The Relevance of Environmental Disclosures: Are Such Disclosures Incrementally Informative? J. Account. Public Policy 2013, 32, 410–431. [Google Scholar] [CrossRef] [Scilit]
  15. Hu, D.; Huang, Y.; Zhong, C. Does Environmental Information Disclosure Affect the Sustainable Development of Enterprises: The Role of Green Innovation. Sustainability 2021, 13, 11064. [Google Scholar] [CrossRef] [Scilit]
  16. Bai, X.; Lyu, C. Environmental Information Disclosure and Corporate Green Innovation: The Moderating Effect of Formal and Informal Institutions. Sustainability 2023, 15, 6169. [Google Scholar] [CrossRef] [Scilit]
  17. Zhang, Y.; Li, L.; Huang, X.; Chai, Y.; Ji, Y. Environmental Information Disclosure and Corporate Green Technological Innovation in China—Considering the Moderating Effect of Financing Constraints and Public Attention. Int. Rev. Econ. Financ. 2025, 103, 104487. [Google Scholar] [CrossRef] [Scilit]
  18. Feng, E.; Siu, Y.L.; Wong, C.W.Y.; Li, S.; Miao, X. Can Environmental Information Disclosure Spur Corporate Green Innovation? Sci. Total Environ. 2024, 912, 169076. [Google Scholar] [CrossRef] [Scilit]
  19. Zhang, K.; Li, J.; Ma, W.; Wang, X. Does Environmental Information Disclosure Promote Enterprise Green Technology Innovation? PLoS ONE 2024, 19, e0312901. [Google Scholar] [CrossRef] [Scilit]
  20. Ding, J.; Lu, Z.; Yu, C.-H. Environmental Information Disclosure and Firms’ Green Innovation: Evidence from China. Int. Rev. Econ. Financ. 2022, 81, 147–159. [Google Scholar] [CrossRef] [Scilit]
  21. Zheng, S.; Wang, C.; Nawaz, A.; Ali, S. The Nexus of Carbon Disclosure and Green Technology Innovation: An Empirical Analysis Based on Chinese Listed Companies. J. Environ. Manag. 2025, 383, 125218. [Google Scholar] [CrossRef] [Scilit]
  22. Ding, X.; Ye, L.; Yang, Y.; Efimova, O.; Steblyanskaya, A.; Zhang, J. The Impact Mechanism of Environmental Information Disclosure on Corporate Sustainability Performance—Micro-Evidence from China. Sustainability 2022, 14, 12366. [Google Scholar] [CrossRef] [Scilit]
  23. Ma, Y.; Liu, P.; Chen, H. Corporate ESG Performance, Green Innovation, and Green New Quality Productivity: Evidence from China. Sustainability 2024, 16, 9804. [Google Scholar] [CrossRef] [Scilit]
  24. Chang, Y.; Wang, S. A Study on the Impact of ESG Rating on Green Technology Innovation in Enterprises: An Empirical Study Based on Informal Environmental Governance. J. Environ. Manag. 2024, 358, 120878. [Google Scholar] [CrossRef] [Scilit]
  25. Eliwa, Y.; Aboud, A.; Saleh, A. ESG Practices and the Cost of Debt: Evidence from EU Countries. Crit. Perspect. Account. 2021, 79, 102097. [Google Scholar] [CrossRef] [Scilit]
  26. Hu, S.; Dong, W.; Huang, Y. Analysts’ Green Coverage and Corporate Green Innovation in China: The Moderating Effect of Corporate Environmental Information Disclosure. Sustainability 2023, 15, 5637. [Google Scholar] [CrossRef] [Scilit]
  27. Ali, F.; Ali, A.; Haotian, D.; Ali, I. From Boardrooms to Greenrooms: Directors’ Environmental Background and Green Innovation. J. Innov. Knowl. 2026, 13, 100928. [Google Scholar] [CrossRef] [Scilit]
  28. An, K.; Lin, Z.; Yang, Y. Does Managerial Myopia Affect Corporate Carbon Information Disclosure? Evidence from China. Sustainability 2025, 17, 9042. [Google Scholar] [CrossRef] [Scilit]
  29. Berrone, P.; Fosfuri, A.; Gelabert, L.; Gomez-Mejia, L.R. Necessity as the Mother of ‘Green’ Inventions: Institutional Pressures and Environmental Innovations. Strateg. Manag. J. 2013, 34, 891–909. [Google Scholar] [CrossRef] [Scilit]
  30. Xi, L.S.; Zhao, H. Senior Executive Dual Environmental Cognition, Green Innovation and Enterprise Sustainable Development Performance. Bus. Manag. J. 2022, 44, 139–158. [Google Scholar]
  31. Khan, S.J.; Dhir, A.; Parida, V.; Papa, A. Past, Present, and Future of Green Product Innovation. Bus. Strategy Environ. 2021, 30, 4081–4106. [Google Scholar] [CrossRef] [Scilit]
  32. Cao, Q.; Ju, M.; Li, J.; Zhong, C. Managerial Myopia and Long-Term Investment: Evidence from China. Sustainability 2023, 15, 708. [Google Scholar] [CrossRef] [Scilit]
  33. Yao, S.; Pan, L.; Zhang, Z. Does Environmental Disclosure Have an Auditing Effect? Manag. Audit. J. 2019, 35, 43–66. [Google Scholar] [CrossRef] [Scilit]
  34. Zhao, X.; Yi, C.; Zhan, Y.; Guo, M. Business Environment Distance and Innovation Performance of EMNEs: The Mediating Effect of R&D Internationalization. J. Innov. Knowl. 2022, 7, 100241. [Google Scholar] [CrossRef] [Scilit]
  35. McMullen, J.S.; Brownell, K.M.; Adams, J. What Makes an Entrepreneurship Study Entrepreneurial? Toward A Unified Theory of Entrepreneurial Agency. Entrep. Theory Pract. 2021, 45, 1197–1238. [Google Scholar] [CrossRef] [Scilit]
  36. Gong, Q.; Han, X.; Shen, H.; Xing, Q. Do Professional Risk Funds Affect Audit Quality? Account. Bus. Res. 2021, 51, 777–799. [Google Scholar] [CrossRef] [Scilit]
  37. Liu, S.; Ba, N.; Hao, Y. Empowering Green Innovation: The Impact of Green Subsidies on Chinese Firms. Sustain. Futur. 2025, 10, 100889. [Google Scholar] [CrossRef] [Scilit]
  38. An, J.; He, G.; Ge, S.; Wu, S. The Impact of Government Green Subsidies on Corporate Green Innovation. Financ. Res. Lett. 2025, 71, 106378. [Google Scholar] [CrossRef] [Scilit]
  39. Callery, P.J. The Influence of Strategic Disclosure on Corporate Climate Performance Ratings. Bus. Soc. 2023, 62, 950–988. [Google Scholar] [CrossRef] [Scilit]
  40. Guo, Y.; Wang, L. Environmental Entrepreneurial Orientation and Firm Performance: The Role of Environmental Innovation and Stakeholder Pressure. Sage Open 2022, 12, 21582440211061354. [Google Scholar] [CrossRef] [Scilit]
  41. Zhao, X.; Zhu, R.; Li, Q.; Hu, J. Unleashing the Impact of Environmental Information Disclosure on Corporate Green Innovation: The Role of Audit Quality and Media Attention. Environ. Dev. 2024, 52, 101078. [Google Scholar] [CrossRef] [Scilit]
  42. Liu, J.-Y.; Zhang, Y.-J.; Cho, C.H. Corporate Environmental Information Disclosure and Green Innovation: The Moderating Effect of CEO Visibility. Corp. Soc. Responsib. Environ. Manag. 2023, 30, 3020–3042. [Google Scholar] [CrossRef] [Scilit]
  43. Lu, Z.; Li, H. Does Environmental Information Disclosure Affect Green Innovation? Econ. Anal. Policy 2023, 80, 47–59. [Google Scholar] [CrossRef] [Scilit]
  44. Zhang, Y.; Li, X.; Xing, C. How Does China’s Green Credit Policy Affect the Green Innovation of High Polluting Enterprises? The Perspective of Radical and Incremental Innovations. J. Clean. Prod. 2022, 336, 130387. [Google Scholar] [CrossRef] [Scilit]
  45. GB/T 4754-2017; Industrial Classification for National Economic Activities. Standards Press of China: Beijing, China, 2017.
  46. ISO 14001; Environmental Management Systems—Requirements with Guidance for Use. International Organization for Standardization: Geneva, Switzerland, 2015.
  47. ISO 9001; Quality Management Systems—Requirements. International Organization for Standardization: Geneva, Switzerland, 2015.
  48. Xu, H.; Fu, Y.; Li, Y.; Zhang, G.; Bi, S. Environmental Information Disclosure and Green Transformation: Evidence from Chinese Manufacturing Enterprises. Heliyon 2024, 10, e38402. [Google Scholar] [CrossRef] [Scilit]
  49. Gul, F.A.; Wu, D.; Yang, Z. Do Individual Auditors Affect Audit Quality? Evidence from Archival Data. Account. Rev. 2013, 88, 1993–2023. [Google Scholar] [CrossRef] [Scilit]
  50. CSRC. The CSRC Released the Industry Classifications of Listed Companies. Available online: https://www.csrc.gov.cn/csrc_en/c102030/c1370756/content.shtml (accessed on 23 August 2026).
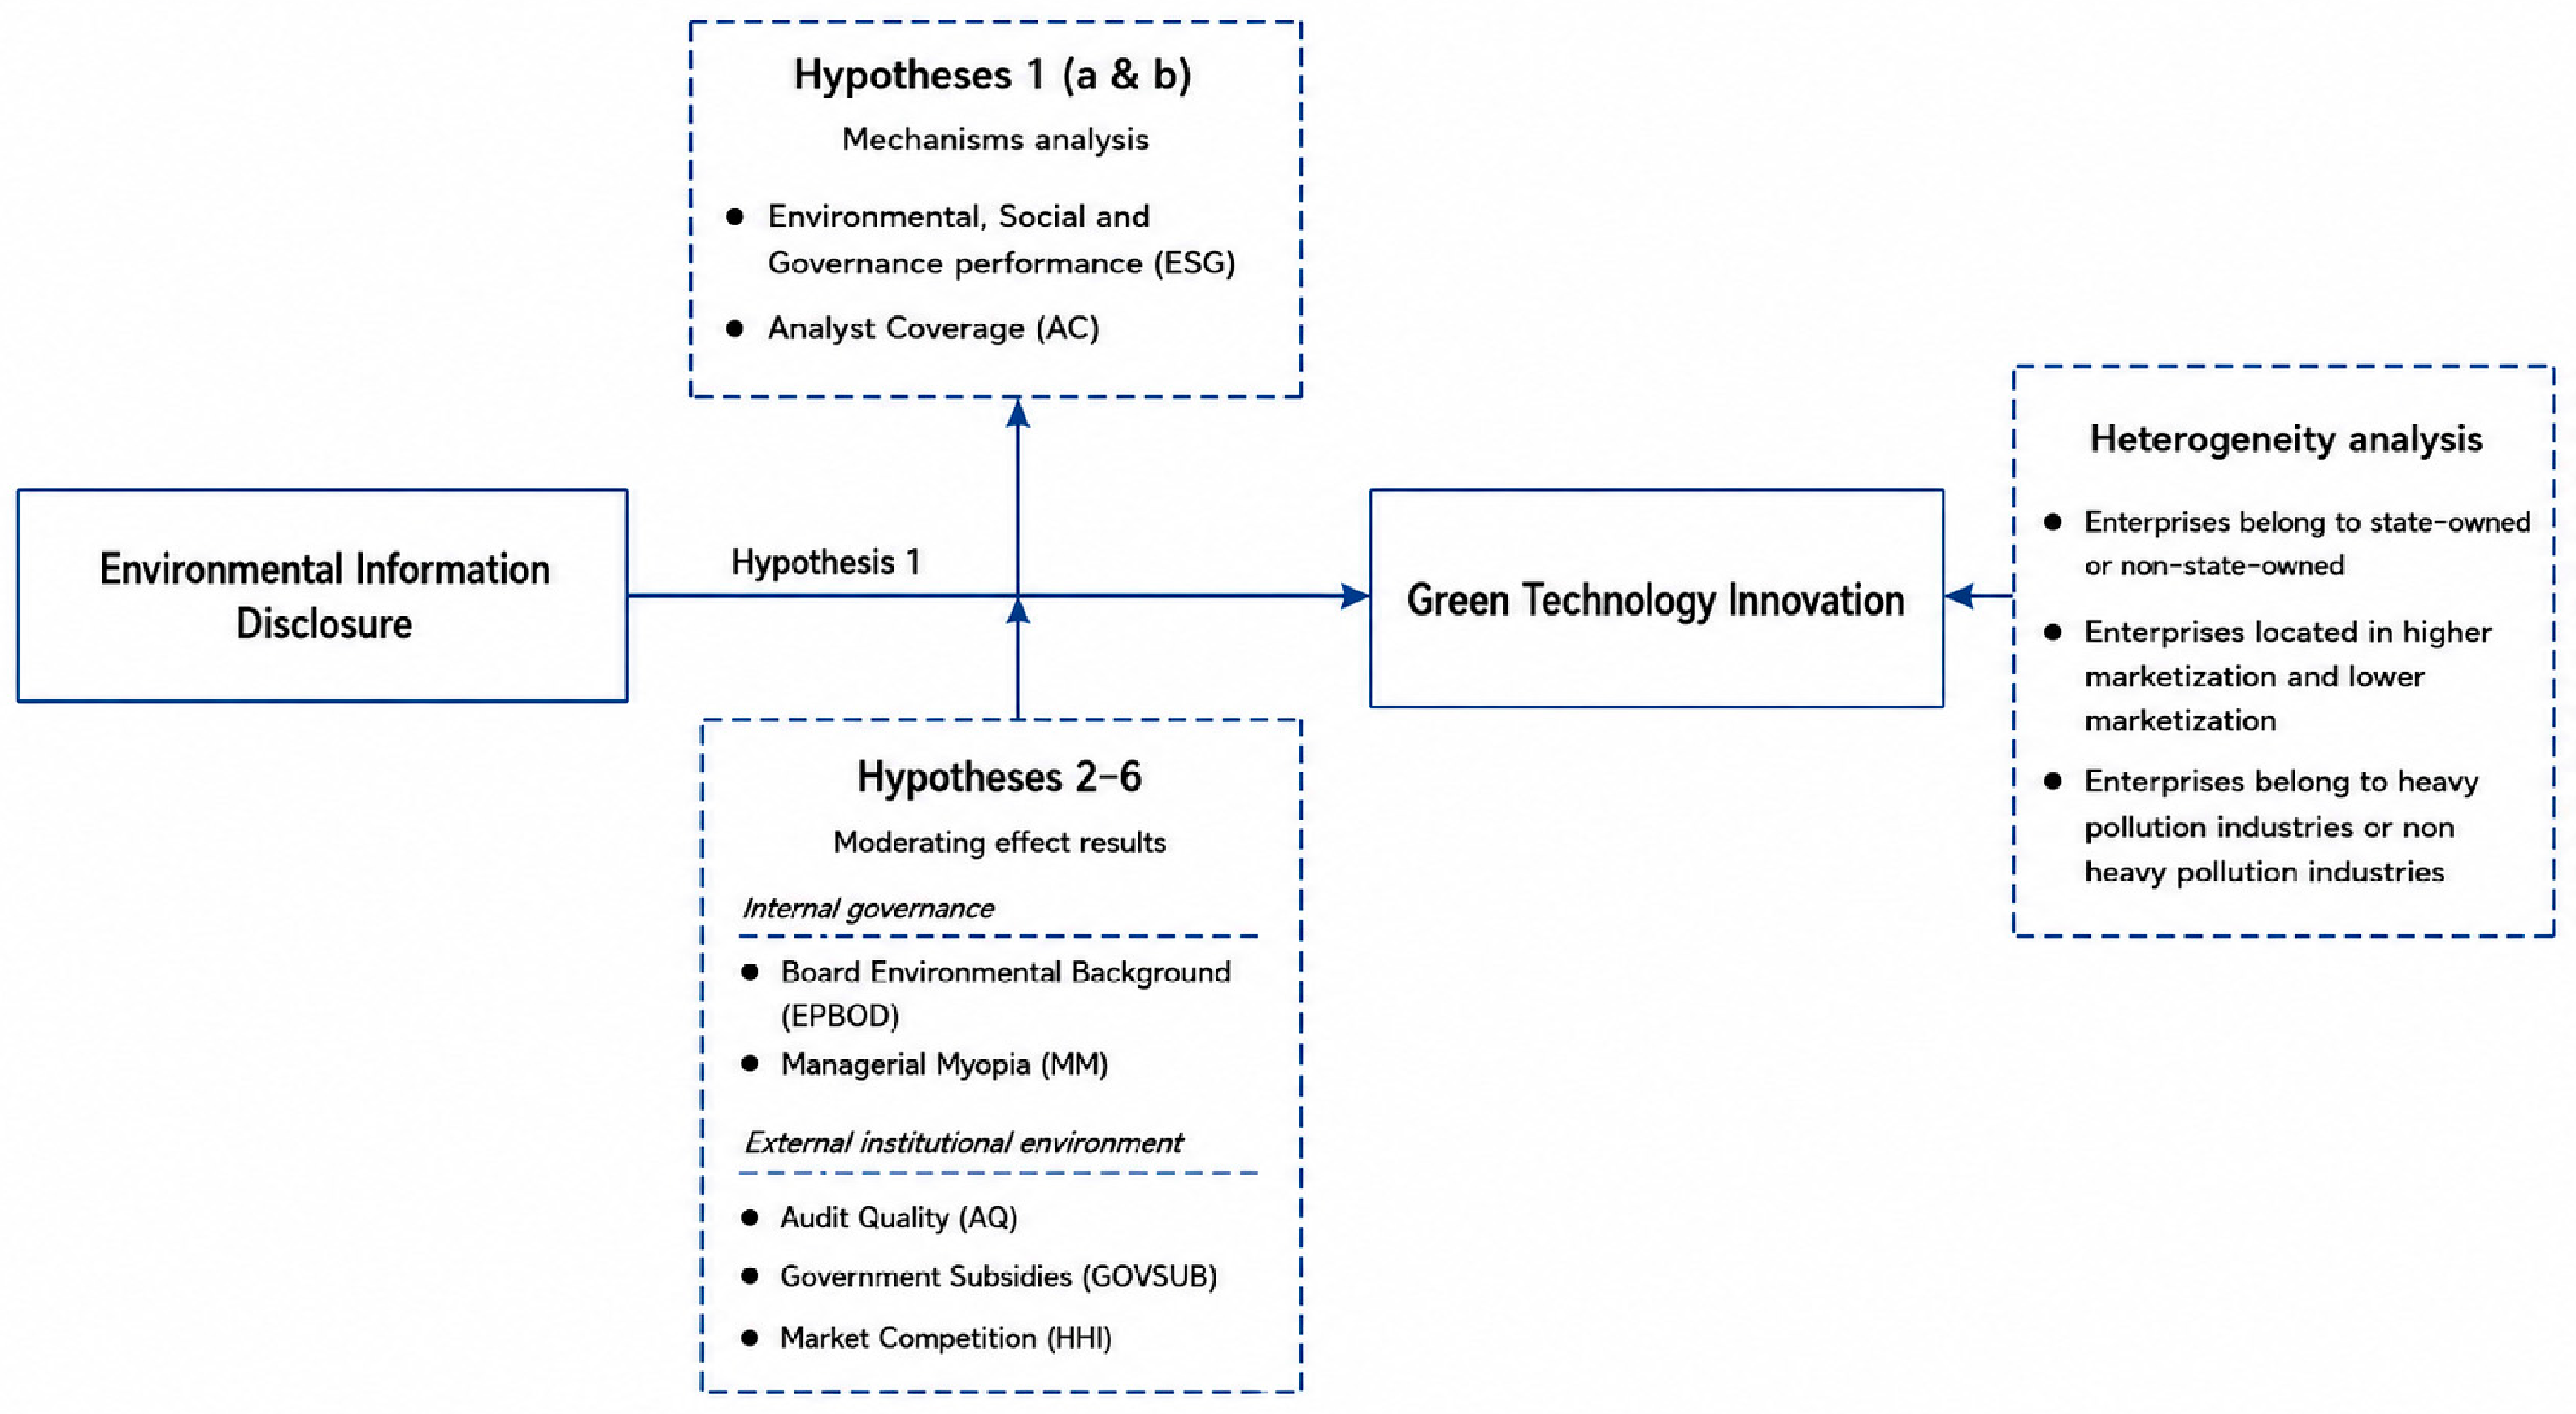
Figure 1. Analytical Framework for Hypothesis.
Sustainability 18 08738 g001
Figure 2. PSM Covariate Balance Results: (a) Standardized mean differences before and after matching; (b) propensity-score kernel densities before and after matching.
Sustainability 18 08738 g002
Table 1. Scoring Criteria for the EID Index.
Categories of DisclosureItemsScoring Description
Environmental Management DisclosureEnvironmental Protection PhilosophyDisclosure: 2 points
Not disclosed: 0 points
Environmental Protection Goals
Environmental Management System
Environmental Education and Training
Special Environmental Protection Actions
Environmental Emergency Response Mechanism
Environmental Protection Awards/Honors
The “Three Simultaneities” System
Environmental Supervision and Certification DisclosureKey Pollution Monitoring Units
Pollutant Emission Compliance
Environmental Accidents
Environmental Violations
Environmental Petition Cases
ISO14001 Certification [46]
ISO9001 Certification [47]
Environmental Pollutant DisclosureWastewater Discharge VolumeQuantitative and Qualitative Description: 2 points
Qualitative Description Only: 1 point
No Quantitative or Qualitative Description: 0 points
Chemical Oxygen Demand (COD) Discharge Volume
Sulfur Dioxide (SO2) Discharge Volume
Carbon Dioxide (CO2) Discharge Volume
Smoke and Dust Discharge Volume
Industrial Solid Waste Discharge Volume
Environmental Performance and Governance DisclosureStatus of Exhaust Gas Emission Reduction and Control
Status of Wastewater Emission Reduction and Treatment
Status of Dust and Fume Control
Status of Solid Waste Utilization and Disposal
Control Status of Noise, Light Pollution, and Radiation
Implementation Status of Cleaner Production
Table 2. Main Variables and Their Definitions.
CategoryVariable NameVariable SymbolDefinition
Dependent VariableGreen Technology InnovationGTIThe natural logarithm of one plus the total number of granted green patents.
Independent VariableEnvironmental Information Disclosure QualityEIDThe arithmetic mean of the 27 indicator scores across four dimensions (total score divided by 27); item scores range from 0 to 2.
Mediating VariablesEnvironmental, Social and Governance performanceESGThe natural logarithm of one plus the ESG rating score
Analyst CoverageANALYSTThe natural logarithm of one plus the number of analysts who issued research reports on the firm during the year
Moderating VariableBoard Environmental BackgroundEPBODThe proportion of board members whose resumes contain environmental protection keywords.
Managerial MyopiaMMThe frequency of short-term-oriented words in the annual report divided by total word frequency.
Audit QualityAQThe negative absolute value of the deviation between the actual and predicted probability of issuing a standard unqualified audit opinion
Government SubsidiesGOVSUBThe natural logarithm of one plus the total amount of government subsidies received by the firm during the year
Market CompetitionHHIThe Herfindahl–Hirschman Index calculated using firms’ total assets within each industry-year
Heterogeneity VariablesState OwnershipSOEDummy equal to 1 for state-owned enterprises and 0 otherwise.
Heavy-Polluting IndustryINUDummy equal to 1 for the 17 heavy-polluting industries identified in the CSRC 2012 [50] industry classification, and 0 otherwise.
Regional MarketizationMKTDummy equal to 1 if the firm’s province-year marketization index exceeds the annual sample median, and 0 otherwise.
Control VariableOwnership ConcentrationFirstThe shareholding proportion of the company’s largest shareholder.
Revenue Growth RateGrowthThe year-over-year growth rate of operational income
Firm SizeSizeThe natural logarithm of total assets
Institutional investor shareholding ratioINIThe shareholding proportion of institutional investors.
Debt-to-Asset RatioLEVThe rate of total liabilities to total assets.
Return on Assets (ROA)ROAThe rate of net profit to total assets.
Combination of CEO and Chairman RolesTwodutyEquals 1 if the chairman and the general manager are the same person, 2 otherwise, and 0 for firm-years with missing duality information.
Firm AgeAgeThe year of the current period minus the year of establishment of the enterprise
Table 3. Descriptive statistics.
VarNameObsMeanSDMinMedianMax
EID39,2320.4530.3790.0740.3331.519
GTI39,2410.7491.0610.0000.0004.431
First39,9210.3440.1500.0850.3240.747
Growth39,9440.1410.302−0.4810.1001.569
Size39,9638.3761.3036.1648.14512.553
INI39,9050.4250.2570.0030.4400.912
LEV39,9630.3910.1950.0490.3820.830
ROA39,9630.0430.054−0.1700.0420.195
Twoduty40,0121.6410.5250.0002.0002.000
Age40,01218.5766.2526.00018.00036.000
SA39,963−3.8250.271−4.518−3.825−3.107
ESG37,5475.3860.0645.1965.3885.536
ANALYST40,0091.4361.1900.0001.3863.784
EPBOD39,2350.1270.1630.0000.1110.857
MM39,1850.0120.0240.0000.0010.121
AQ38,802−0.0390.074−0.584−0.018−0.001
GOVSUB40,01215.0484.8780.00016.31420.291
HHI39,9620.0720.0770.0100.0441.000
Table 4. Correlation Analysis Results.
VarNameGTIEIDFirstGrowthSizeINILEVROATwodutyAge
GTI1
EID0.292 ***1
First0.022 ***0.062 ***1
Growth−0.009 *−0.060 ***0.0061
Size0.461 ***0.406 ***0.168 ***0.019 ***1
INI0.123 ***0.175 ***0.486 ***0.042 ***0.432 ***1
LEV0.257 ***0.137 ***0.038 ***0.047 ***0.529 ***0.197 ***1
ROA−0.066 ***0.009 *0.145 ***0.273 ***−0.039 ***0.117 ***−0.345 ***1
Twoduty0.028 ***0.037 ***0.039 ***−0.012 **0.140 ***0.153 ***0.119 ***0.0011
Age0.130 ***0.260 ***−0.098 ***−0.133 ***0.228 ***−0.020 ***0.136 ***−0.106 ***0.031 ***1
***, **, and * indicate two-tailed significance at the 1%, 5%, and 10% levels, respectively.
Table 5. Benchmark Regression Results.
Variables(1)
GTI
(2)
GTI
EID0.223 ***0.146 ***
(8.768)(6.132)
First 0.026
(0.196)
Growth −0.054 ***
(−4.287)
Size 0.309 ***
(13.945)
INI 0.103
(1.393)
LEV −0.071
(−1.046)
ROA −0.188
(−1.637)
Twoduty −0.003
(−0.228)
Age −0.018
(−0.996)
Constant0.649 ***−1.583 ***
(56.282)(−4.032)
Observations39,13339,075
R-squared0.7310.742
IDYESYES
YEARYESYES
ClusterYESYES
Firm and year fixed effects are included in all columns. t-statistics are reported in parentheses based on standard errors clustered at the firm level. *** p < 0.01.
Table 6. Robustness Test Results.
Variables(1)
GTI
(Invention Grants)
(2)
GTI
(Utility Grants)
(3)
GTI
(Excl. Municipalities)
(4)
GTI
(Lagged EID)
(5)
GTI
(PSM)
(6)
GTI
(Entropy Balancing)
EID0.115 ***0.136 ***0.129 *** 0.098 ***0.112 ***
(6.072)(6.112)(4.951) (3.255)(4.169)
L.EID 0.127 ***
(4.916)
First0.081−0.0220.1440.023−0.053−0.140
(0.802)(−0.185)(1.002)(0.171)(−0.347)(−0.809)
Growth−0.044 ***−0.041 ***−0.059 ***−0.046 ***−0.055 ***−0.040 ***
(−4.801)(−3.355)(−4.122)(−3.436)(−3.147)(−2.591)
Size0.170 ***0.251 ***0.354 ***0.320 ***0.295 ***0.290 ***
(9.826)(12.174)(14.177)(13.789)(11.834)(11.140)
INI0.0280.145 **0.0760.1090.1350.187 **
(0.525)(2.176)(0.959)(1.417)(1.571)(2.112)
LEV−0.129 ***−0.003−0.080−0.086−0.073−0.128
(−2.700)(−0.053)(−1.048)(−1.222)(−0.913)(−1.571)
ROA−0.112−0.063−0.214−0.229 *−0.204−0.231
(−1.321)(−0.584)(−1.641)(−1.919)(−1.376)(−1.565)
Twoduty−0.012−0.0020.000−0.0050.011−0.003
(−1.317)(−0.194)(0.007)(−0.397)(0.748)(−0.206)
Age−0.031 *−0.004−0.008−0.005−0.027−0.013
(−1.882)(−0.240)(−0.409)(−0.273)(−1.233)(−0.697)
Constant−0.532−1.552 ***−2.166 ***−1.885 ***−1.330 ***−1.492 ***
(−1.543)(−4.572)(−5.179)(−4.727)(−2.850)(−3.490)
Observations39,07539,07530,97834,74118,68539,075
R-squared0.6550.7010.7180.7550.7270.757
IDYESYESYESYESYESYES
YEARYESYESYESYES YES
ClusterYESYESYESYESYESYES
Firm and year fixed effects are included in all columns. Column (4) uses the one-period lagged explanatory variable, denoted L.EID. t-statistics are reported in parentheses based on standard errors clustered at the firm level. *** p < 0.01, ** p < 0.05, * p < 0.1.
Table 7. Additional Robustness Test Results.
Variables(1)
Two-Way Clustering
(2)
Balanced Panel
(3)
Excl. COVID 2020–2022
(4)
Excl. 2020
(5)
Influential Obs
EID0.146 ***0.188 ***0.167 ***0.168 ***0.152 ***
(4.502)(4.601)(6.339)(6.772)(6.922)
First0.026−0.393 *0.0750.0580.033
(0.194)(−1.896)(0.573)(0.440)(0.294)
Growth−0.054 ***−0.047 **−0.075 ***−0.060 ***−0.053 ***
(−4.066)(−2.217)(−5.257)(−4.637)(−4.495)
Size0.309 ***0.312 ***0.294 ***0.311 ***0.306 ***
(11.097)(8.138)(13.376)(13.994)(15.103)
INI0.1030.2260.0780.0960.057
(1.341)(1.640)(1.038)(1.277)(0.856)
LEV−0.071−0.113−0.040−0.067−0.036
(−0.965)(−0.876)(−0.572)(−0.973)(−0.587)
ROA−0.188 *−0.315−0.141−0.157−0.153
(−1.784)(−1.297)(−1.044)(−1.284)(−1.469)
Twoduty−0.003−0.0050.001−0.004−0.000
(−0.225)(−0.256)(0.111)(−0.335)(−0.014)
Age−0.0180.001−0.024−0.020−0.012
(−0.991)(0.034)(−1.388)(−1.132)(−0.761)
Observations39,07514,28428,65736,02938,712
R-squared0.7420.7200.7380.7410.768
Firm and year fixed effects are included in all columns. t-statistics are reported in parentheses based on standard errors clustered at the firm level (two-way firm-year clustering in Column 1). *** p < 0.01, ** p < 0.05, * p < 0.1.
Table 8. Mechanism Tests Results.
Variables(1)
ESG
(2)
GTI
(3)
Analyst
(4)
GTI
EID0.056 ***0.103 ***0.155 ***0.126 ***
(26.699)(3.938)(5.456)(4.887)
First0.004−0.037−0.774 ***−0.011
(0.487)(−0.275)(−5.132)(−0.085)
Growth0.007 ***−0.0030.213 ***−0.002
(6.976)(−0.227)(13.178)(−0.190)
Size0.012 ***0.295 ***0.257 ***0.295 ***
(9.421)(13.225)(11.513)(13.333)
INI−0.0020.160 **1.562 ***0.115
(−0.317)(2.075)(15.626)(1.460)
LEV−0.031 ***−0.116 *−0.029−0.135 *
(−6.808)(−1.655)(−0.360)(−1.928)
ROA0.125 ***−0.1094.240 ***−0.149
(12.829)(−0.913)(26.186)(−1.245)
Twoduty0.0000.002−0.0050.002
(0.031)(0.165)(−0.394)(0.208)
Age−0.001−0.0100.033 *−0.011
(−1.108)(−0.540)(1.845)(−0.617)
F.ESG 0.489 ***
(4.843)
F. ANALYST 0.027 ***
(3.550)
Constant5.286 ***−4.191 ***−1.982 ***−1.562 ***
(228.655)(−6.555)(−5.125)(−4.160)
Observations34,52234,51934,75834,727
R-squared0.5670.7540.7350.755
IDYESYESYESYES
YEARYESYESYESYES
ClusterYESYESYESYES
Firm and year fixed effects are included in all columns. The mediating variables and the dependent variable are measured one period ahead, denoted by the prefix F. t-statistics are reported in parentheses based on standard errors clustered at the firm level. *** p < 0.01, ** p < 0.05, * p < 0.1.
Table 9. Moderating Effects Tests Results.
Variables(1)
GTI
(2)
GTI
(3)
GTI
(4)
GTI
(5)
GTI
EID0.067 **0.113 ***0.152 ***−0.193 ***0.236 ***
(2.422)(4.506)(6.155)(−3.497)(6.959)
EID × EPBOD0.556 ***
(5.312)
EPBOD0.094
(1.128)
EID × MM 1.594 ***
(4.173)
MM −0.552
(−1.643)
EID × AQ 0.362 **
(2.426)
AQ −0.144 *
(−1.716)
EID × GOVSUB 0.021 ***
(6.649)
GOVSUB −0.012 ***
(−6.061)
EID × HHI −1.406 ***
(−3.708)
HHI 0.019
(0.131)
First0.0330.0140.0110.0290.025
(0.256)(0.107)(0.085)(0.222)(0.195)
Growth−0.053 ***−0.052 ***−0.054 ***−0.051 ***−0.051 ***
(−4.261)(−4.171)(−4.337)(−4.096)(−4.095)
Size0.306 ***0.310 ***0.313 ***0.310 ***0.306 ***
(13.903)(13.995)(13.915)(14.175)(13.771)
INI0.0940.1010.1090.1060.108
(1.280)(1.365)(1.476)(1.446)(1.473)
LEV−0.075−0.064−0.077−0.069−0.066
(−1.111)(−0.940)(−1.099)(−1.019)(−0.980)
ROA−0.204 *−0.200 *−0.187−0.182−0.201 *
(−1.788)(−1.747)(−1.539)(−1.591)(−1.750)
Twoduty−0.002−0.002−0.001−0.003−0.003
(−0.226)(−0.163)(−0.128)(−0.291)(−0.242)
Age−0.019−0.019−0.017−0.019−0.018
(−1.010)(−1.016)(−0.951)(−1.054)(−1.004)
Constant−1.560 ***−1.572 ***−1.625 ***−1.390 ***−1.564 ***
(−3.957)(−3.998)(−4.129)(−3.580)(−4.021)
Observations39,07539,04138,65039,07539,075
R-squared0.7430.7420.7430.7430.742
IDYESYESYESYESYES
YEARYESYESYESYESYES
ClusterYESYESYESYESYES
Firm and year fixed effects are included in all columns. t-statistics are reported in parentheses based on standard errors clustered at the firm level. *** p < 0.01, ** p < 0.05, * p < 0.1.
Table 10. Heterogeneity Analysis Results.
Variables(1)
GTI
(2)
GTI
(3)
GTI
EID0.0360.210 ***0.179 ***
(1.233)(6.914)(6.209)
EID × SOE0.263 ***
(6.042)
SOE−0.099 **
(−2.139)
EID × INU −0.150 ***
(−3.444)
INU 0.141 ***
(2.705)
EID × MKT −0.078 **
(−2.216)
MKT 0.025
(1.204)
First−0.0250.0330.019
(−0.190)(0.255)(0.142)
Growth−0.057 ***−0.053 ***−0.054 ***
(−4.526)(−4.200)(−4.284)
Size0.319 ***0.308 ***0.310 ***
(14.346)(13.924)(13.997)
INI0.0870.1030.104
(1.159)(1.389)(1.408)
LEV−0.043−0.073−0.068
(−0.638)(−1.085)(−1.001)
ROA−0.203 *−0.187−0.193 *
(−1.766)(−1.636)(−1.683)
Twoduty0.000−0.002−0.002
(0.001)(−0.187)(−0.217)
Age−0.015−0.016−0.019
(−0.835)(−0.892)(−1.026)
Constant−1.673 ***−1.658 ***−1.590 ***
(−4.261)(−4.229)(−4.050)
Observations38,80039,07539,075
R-squared0.7430.7420.742
IDYESYESYES
YEARYESYESYES
ClusterYESYESYES
Firm and year fixed effects are included in all columns. t-statistics are reported in parentheses based on standard errors clustered at the firm level. *** p < 0.01, ** p < 0.05, * p < 0.1.
Disclaimer/Publisher’s Note: The statements, opinions and data contained in all publications are solely those of the individual author(s) and contributor(s) and not of MDPI and/or the editor(s). MDPI and/or the editor(s) disclaim responsibility for any injury to people or property resulting from any ideas, methods, instructions or products referred to in the content.