1. Introduction
Form-fitting joints have been used in furniture construction for centuries because they transfer loads mainly through geometry. Unlike joints based only on adhesives or mechanical fasteners, their performance depends strongly on the shape of the mating parts. The dovetail principle is one of the most recognizable examples of this approach. Its self-locking geometry provides good positioning of the connected elements and enables efficient load transfer. With the development of fused deposition modelling (FDM), this traditional joining principle can be transferred into customized polymer connectors for wooden furniture joints.
For furniture design, this approach has practical relevance because reducing polymer consumption while maintaining mechanical performance can improve material efficiency. Printed connectors can support detachable and repairable joints, which may extend product service life and simplify the replacement of damaged parts. In addition, the geometry and internal structure of the connector can be adapted to a specific application without dedicated tooling. However, FDM-printed connectors should not simply be produced with the highest possible amount of material. Higher infill density or thicker walls increase printing time and material consumption, but they do not always lead to a proportional improvement in joint performance. Therefore, it is necessary to understand how perimeter count and infill density affect the mechanical response of the joint.
Several studies have already shown that 3D-printed connecting elements can be used in furniture structures. Petrova and Jivkov investigated polylactic acid (PLA) based 3D-printed connectors for detachable end-corner joints made of plywood and MDF panels and showed that connector geometry, internal cavity filling and wall thickness affected joint behaviour [
1]. Uysal studied the screw withdrawal strength of 3D-printed PLA+ specimens with different infill patterns and infill densities [
2]. The results showed that increasing the infill ratio did not produce a proportional increase in performance, which is important for material-efficient design of printed furniture components.
Printed connectors have also been studied in chair construction. Nicolau, Pop and Coșereanu developed an FFF-printed connector for joining a chair leg with two stretchers and demonstrated its potential to replace a conventional glued mortise-and-tenon joint [
3]. In a later study, Nicolau et al. tested an improved PLA connector in L-type joints and complete chair prototypes [
4]. The chair with printed connectors showed larger displacements than the traditional reference chair, but it passed the required static load tests without structural failure. These studies confirm the practical potential of printed connectors, while also showing that their stiffness and reliability require further optimization.
The finite element method (FEM) has been used to support the design of furniture joints and demountable fasteners. Podskarbi and Smardzewski used FEM to analyse innovative furniture fasteners, while Krzyżaniak et al. compared numerical predictions with experimental results for demountable joints [
5,
6]. FEM is also relevant for FDM-printed parts with internal infill, where explicit modelling of the internal structure can be computationally demanding. For this reason, the internal geometry can be replaced by equivalent homogenized material properties. Bhandari and Lopez-Anido developed a homogenized FEM model for a 3D-printed part with a cellular internal structure [
7], while Gonabadi et al. investigated the effects of raster angle, build orientation, and infill density using microstructural modelling and homogenization techniques [
8]. Bean et al. numerically and experimentally evaluated the effective elastic properties of 3D-printed gyroid infill [
9], and Galvez et al. used a shell–infill FEM approach for a 3D-printed structure [
10]. These studies support the use of simplified or homogenized FEM models when the aim is to compare configurations, evaluate global stiffness and identify critical regions rather than to reproduce filament-level damage.
Other studies have examined printed furniture connectors, dowels, and related load-bearing components from the perspective of geometry and printing parameters. Chen et al. showed that nozzle temperature, layer thickness, filling degree, and extrusion speed affect the dimensional accuracy of FDM-printed furniture connectors [
11]. Demirel et al. found that 3D-printed PLA dowels can achieve shear resistance comparable to or higher than conventional wooden and plastic dowels in L-type furniture joints [
12]. Wang et al. used PETG reinforcement connectors for mortise-and-tenon joints in solid wood chairs and reported improved ultimate load compared with unreinforced joints [
13]. These studies support the use of printed polymer elements in selected furniture joints, but they also show that performance depends on material, geometry, printing parameters, and loading mode. The influence of FDM parameters has also been reported for furniture-related and load-bearing polymer parts. Wang et al. showed that layer thickness, infill density and bed temperature affect the compressive properties of polyamide 6 (PA6) furniture risers [
14]. Antunović et al. demonstrated that layer height, infill density and perimeter count influence not only the mechanical performance of PLA parts, but also material consumption and printing time [
15]. Parameter effects were also reported for PETG by Manavis et al. [
16] and for carbon-fibre-reinforced PLA by Dawood and AlAmeen [
17]. Silva et al. further showed the potential of hybrid FFF for polymer–metal parts, where material distribution and local reinforcement are important for functional performance [
18]. These findings are relevant to furniture connectors because they show that FDM parameters should be optimized together rather than selected independently.
Previous studies have also shown that FEM can be used to guide FDM infill design and to describe the mechanical response of printed parts with different infill configurations. Gopsill et al. used finite element analysis (FEA) results to influence the infill design of FDM parts and emphasized that such models can support internal structural design without necessarily representing the exact stresses in the final printed structure [
19]. Mazlan et al. showed that infill density, wall perimeter and layer height strongly affect the mechanical response of 3D-printed products [
20]. Aydin et al. treated infill density and infill pattern as microstructural features and used homogenization to determine the corresponding macroscopic response [
21]. Karkalos et al. further showed that FEM models can be used to predict the mechanical behaviour of FFF parts with different infill densities when validated against experimental results [
22]. These findings support the use of simplified numerical models when the aim is to compare connector configurations, identify contact-pressure regions and locate critical stress concentrations.
FEM modelling is also commonly used in studies of wooden furniture joints as a complement to experimental testing, because it helps to better understand load transfer and locate critical stress regions. Hu et al. used FEM in the analysis of mortise-and-tenon joints considering tenon fit effects [
23], while Hu and Guan developed a FEM model of a semi-rigid mortise-and-tenon joint considering glue-line effects and friction coefficient [
24]. Chen, Xia and Hu combined experimental and numerical evaluation in the design of detachable corner joints for wooden furniture frames [
25]. In the present study, FEM was used in a similar way: not as an independent failure criterion, but as a tool for interpreting contact behaviour, stress distribution and critical regions in FDM-printed dovetail connectors.
Despite this progress, the material-efficient design of FDM-printed furniture connectors is still not sufficiently described. Most studies focus on a particular connector geometry, a specific joint type, dimensional accuracy or selected printing parameters. Less attention has been paid to the combined effect of perimeter count and infill density on rotational stiffness, maximum bending moment, material consumption and printing time. This is a practical gap: in furniture applications, the best connector is not necessarily the strongest one, but the one that provides adequate mechanical performance with reasonable material use and production time.
Therefore, this study investigates FDM-printed dovetail connectors for wooden furniture corner joints. One recycled PLA-based filament material, three perimeter configurations, and three cubic infill densities were analysed. The experimental part evaluates the moment–rotation response, maximum bending moment and rotational stiffness of the joints, while the numerical part uses a homogenized shell–core FEM model to examine stress distribution, connector–wood contact pressure and critical load-transfer regions. The study specifically examines whether increasing infill density or increasing the number of perimeters is more effective for improving joint behaviour, and whether mechanically sufficient connector configurations can be achieved with lower material consumption and shorter printing time.
2. Materials and Methods
2.1. Materials
Beech wood (
Fagus sylvatica L.) was used as the base material for the wooden members of the corner joints because of its common use in furniture structures and its favourable mechanical properties. In the FEM model, beech wood was defined as an orthotropic material. The local material coordinate system was assigned according to the anatomical directions of beech wood, allowing the stress components in the wooden members to be evaluated with respect to the grain direction. The material properties used for the numerical model are listed in
Table 1.
The dovetail connectors were manufactured from commercially available 1.75 mm Filament PM RePLA+ supplied by Plasty Mladeč, Haňovice 18, 78321, Czech Republic. RePLA+ was selected as a recycled PLA-based material suitable for FDM processing and functional polymer connectors.
In the FEM model, the fully printed regions of the connector, including perimeter walls, top and bottom solid layers, bridges, and full infill regions, were represented using a simplified isotropic linear-elastic material model. A density of 1240 kg·m
−3 was adopted, consistent with published technical data for rPLA materials [
27]. A Young’s modulus of 3520 MPa and Poisson’s ratio of 0.33 were adopted as reference isotropic input parameters based on values reported for printed PLA in the literature [
28]. These elastic parameters were not experimentally calibrated for the specific Filament PM RePLA+ used in the mechanical tests. The isotropic representation therefore constitutes a modelling simplification and does not explicitly account for process-dependent anisotropy associated with raster orientation, interlayer bonding, void structure, cooling conditions, humidity, temperature, or strain rate. Accordingly, the FEM model was used to compare relative differences in load transfer, contact behaviour, and stress localization among connector configurations rather than to provide an exact prediction of the constitutive response of FDM-printed RePLA+. The sparse cubic infill was not modelled explicitly but was represented by a homogenized material domain with effective properties derived from the reference fully dense material and the nominal infill density.
2.2. Connector Design and Slot Preparation
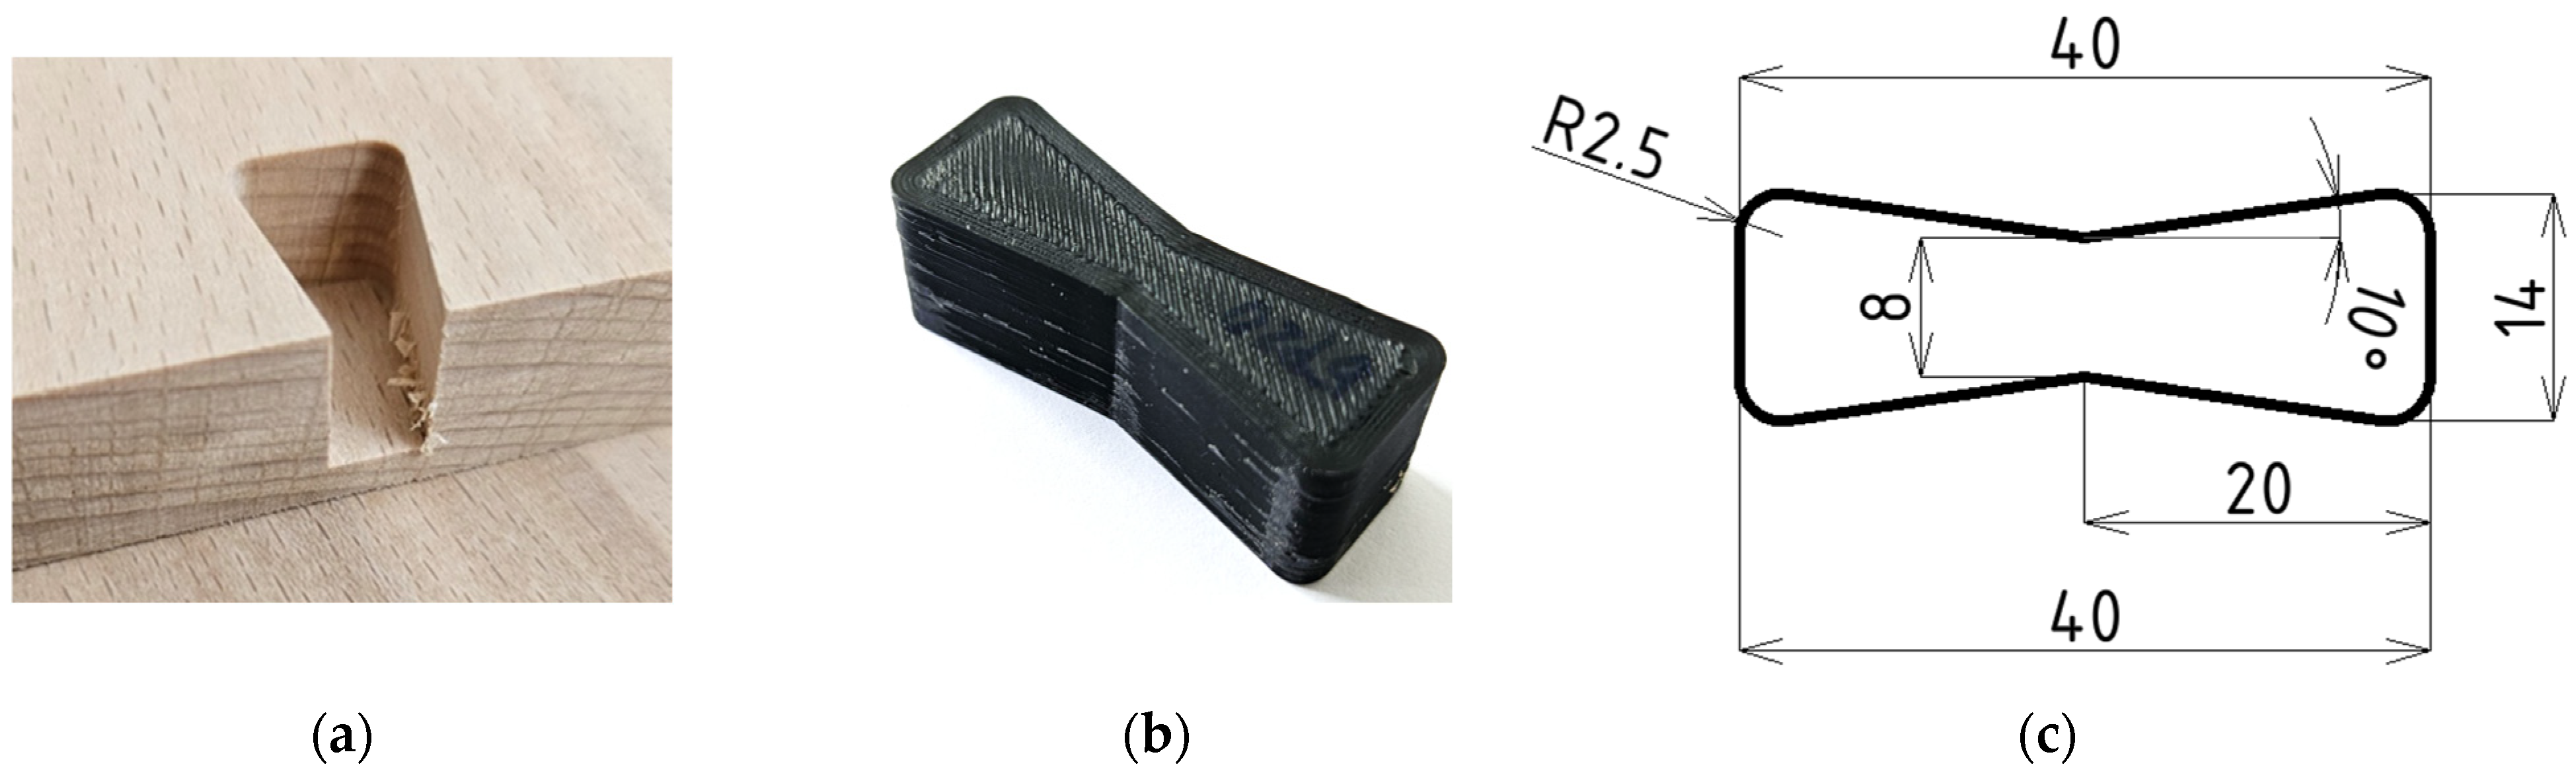
The dovetail connector was designed as a 3D-printed polymer insert intended for mechanical load transfer between two wooden members. The connector slots were designed according to the geometry of the modified dovetail connector and the technological limitations of CNC machining. The slots were machined on an SCM TECH Z5 CNC machining centre using a 5 mm diameter spiral end mill. The connector and the wooden slot were designed with identical nominal mating dimensions, corresponding to a nominal zero-clearance fit (0.00 mm). The machined slot and the geometry of the dovetail connector, with a thickness of 14 mm, are shown in
Figure 1.
2.3. FDM Printing Parameters and Connector Configurations
All connectors were manufactured using fused deposition modelling (FDM) on a Bambu Lab X1C 3D printer equipped with a 0.4 mm nozzle. Prior to printing, the filament was dried for 8 h at 55 °C. The nozzle temperature was set to 220 °C, the textured PEI build plate temperature to 55 °C, and the layer height to 0.2 mm. Printing preparation and slicing were carried out in Bambu Studio software (v2.7.1.62, Bambu Lab, Shenzhen, China).
The connector orientation on the build plate was selected to align the primary material deposition direction as closely as possible with the expected loading direction of the connector. Three top and three bottom solid layers were used and printed with a monotonic pattern. The deposition paths in the outer solid layers were oriented at 45° to the longitudinal axis of the connector, while the middle solid layer was rotated by 90° relative to the adjacent layers. The internal structure of the connector was printed using a cubic infill pattern.
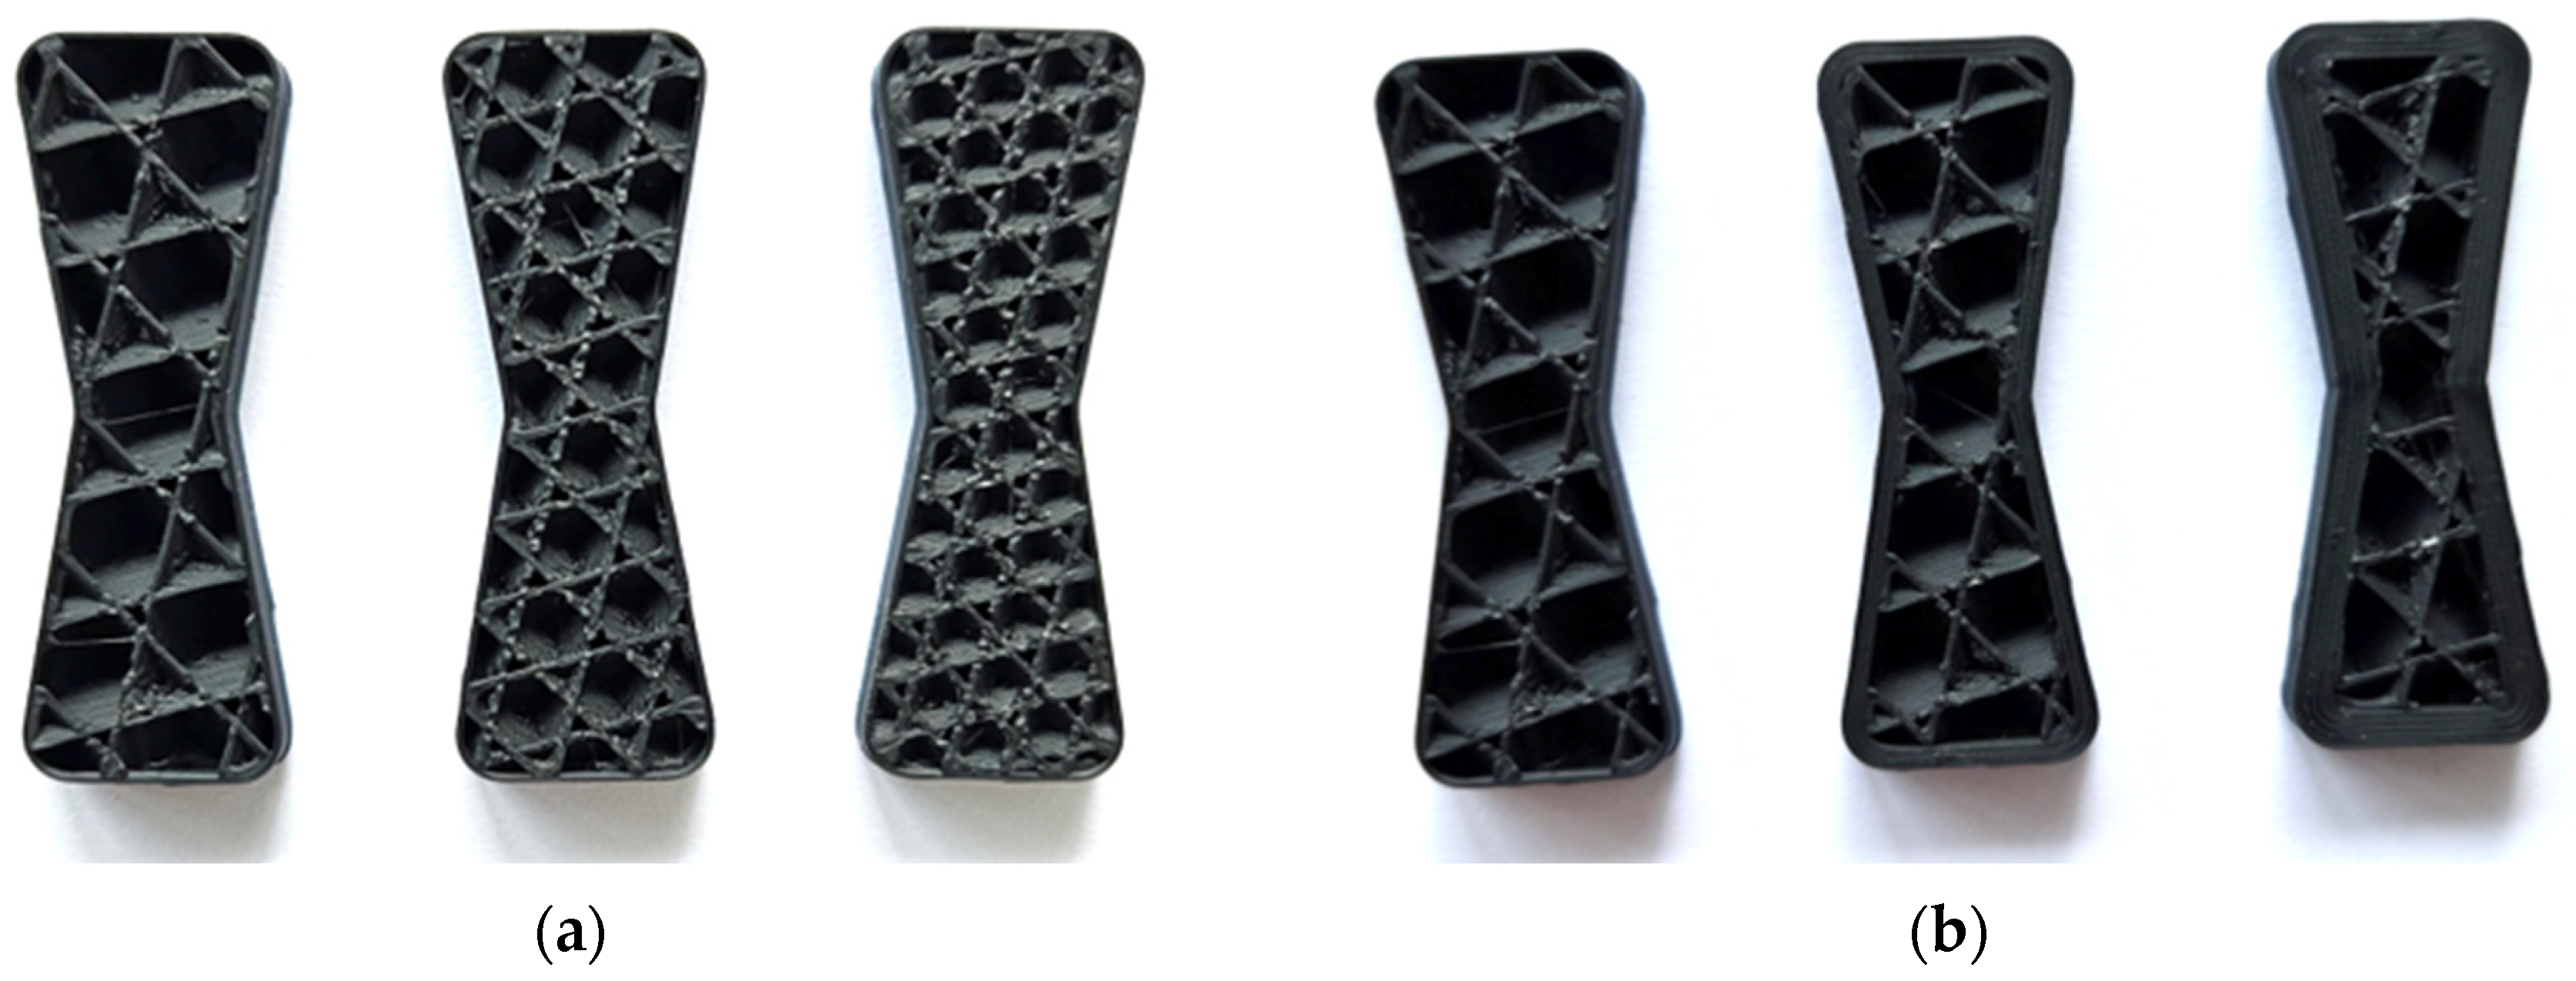
The investigated printing parameters were infill density and perimeter count. Three infill densities were considered (20%, 30%, and 40%;
Figure 2), together with three perimeter configurations designated as 1P, 3P, and 5P, corresponding to one, three, and five outer walls, respectively. Using a 0.4 mm nozzle, these configurations resulted in approximate shell thicknesses of 0.4 mm, 1.2 mm, and 2.0 mm. The first layer was printed at 50 mm·s
−1 for perimeter walls and 105 mm·s
−1 for infill. For the remaining layers, printing speeds of 60 mm·s
−1 for perimeter walls, 300 mm·s
−1 for infill, and 270 mm·s
−1 for sparse cubic infill were applied.
The printing configuration, defined by the perimeter count and infill density, also determined the amount of filament consumed during connector production. Increasing the perimeter count and infill density led to a gradual increase in connector mass from 2.57 g for 1P20 to 5.09 g for 5P40. The filament mass was estimated by the slicing software for each connector configuration based on the sliced model and the specified filament properties. All printing parameters, except for infill density and perimeter count, were kept constant throughout the experiment.
The assembled specimens prepared for mechanical testing were conditioned for 6 days at t = 20 °C and 60% relative humidity until constant mass was achieved, resulting in a final wood moisture content of approximately 10.5%.
2.4. Determination of Mechanical Properties of Wooden Frame Corner Joints
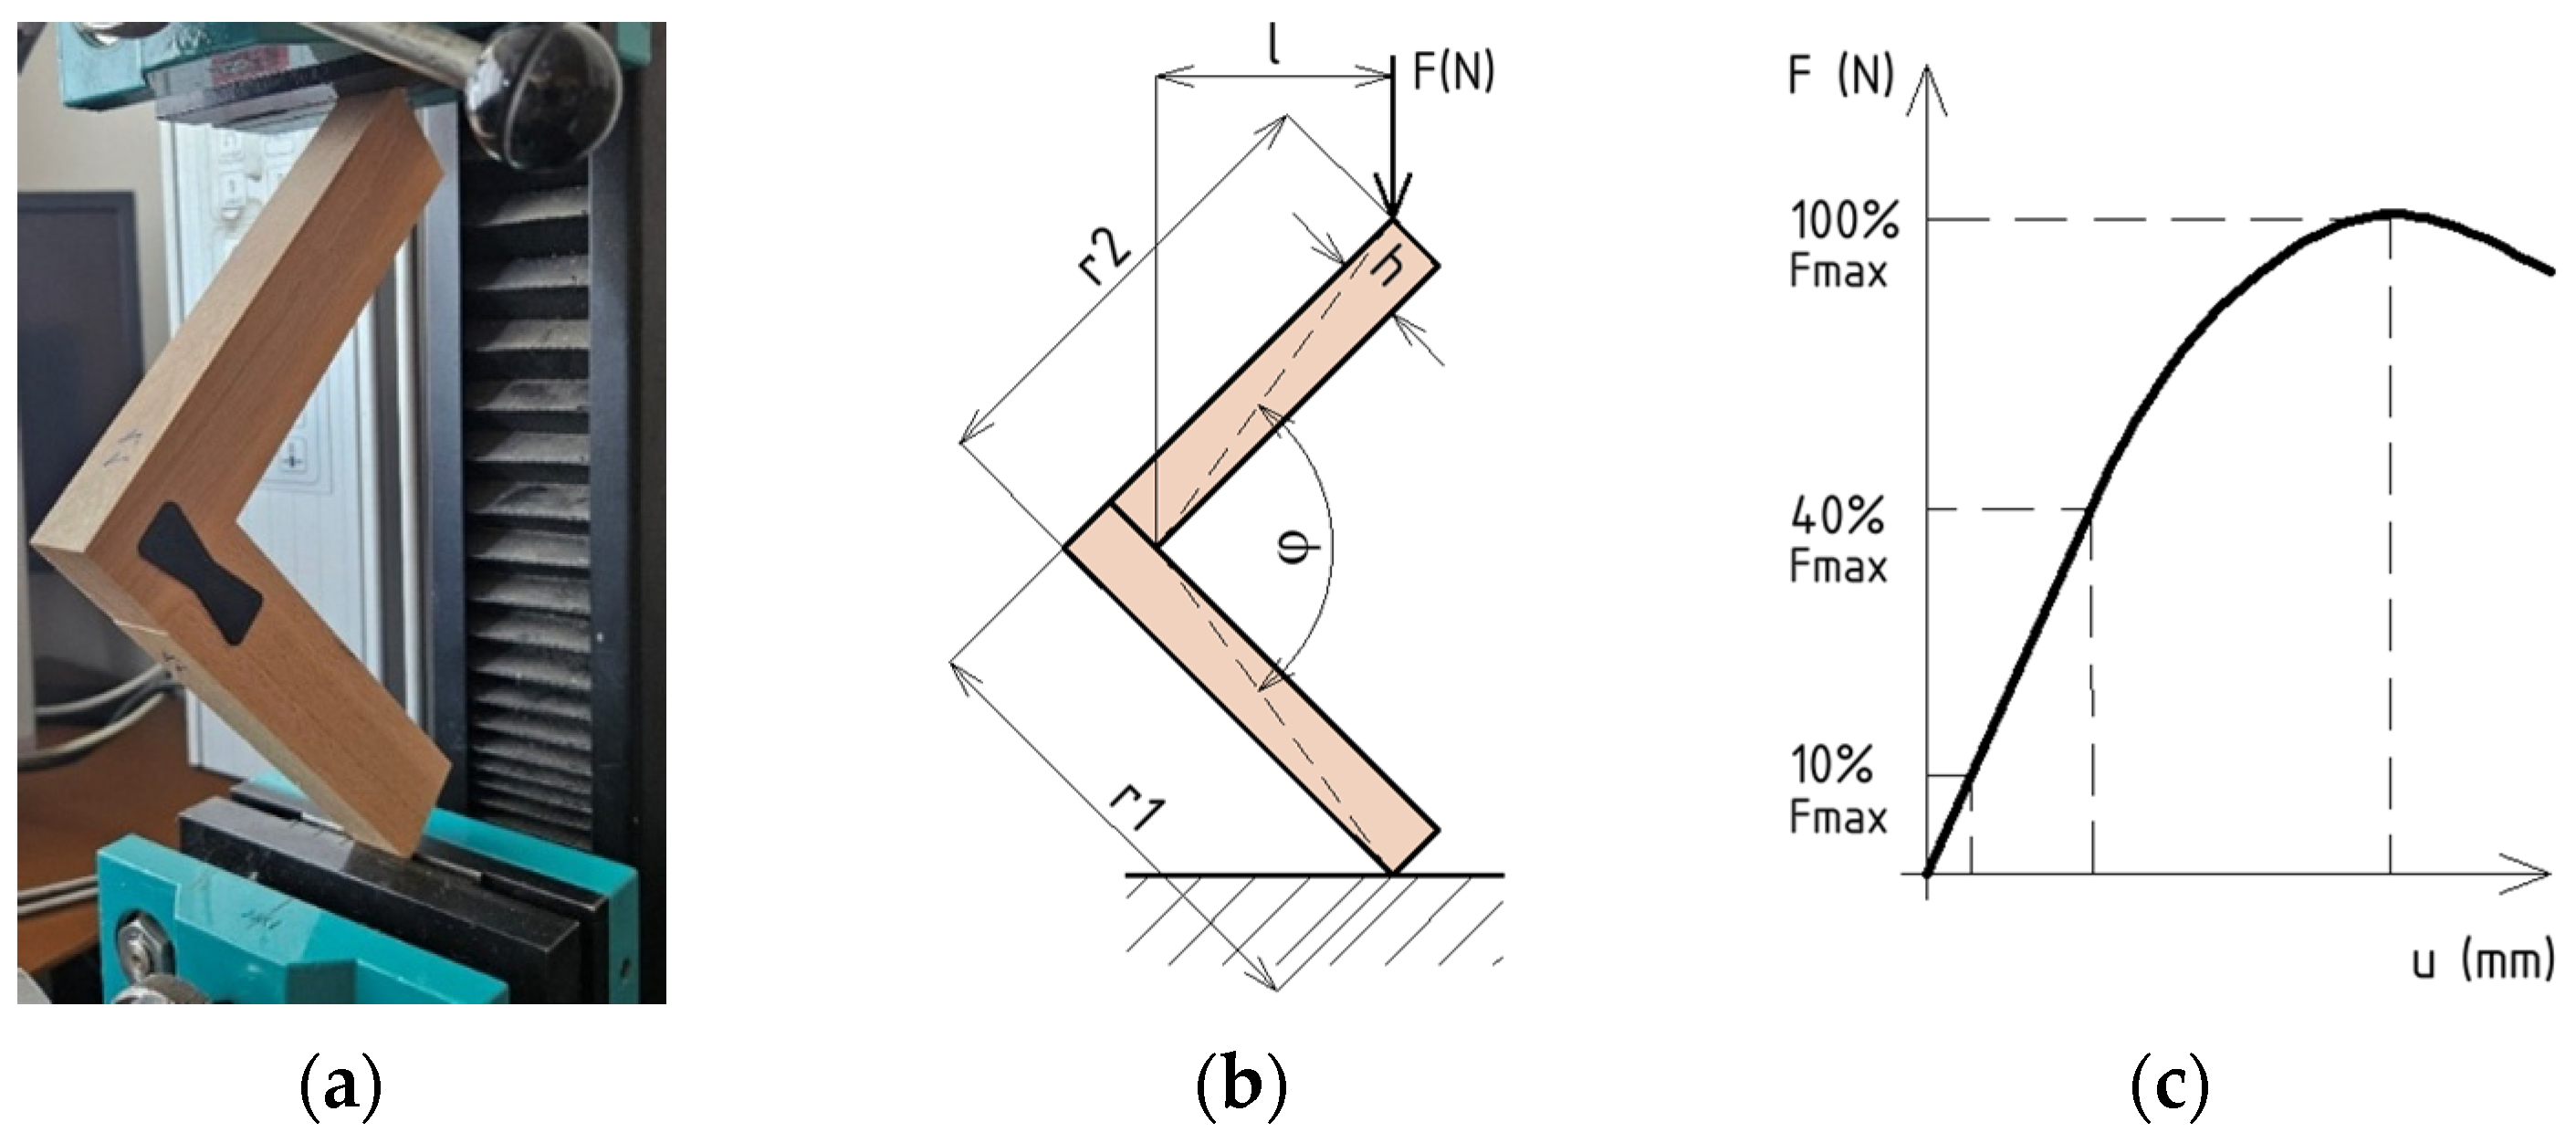
Mechanical tests were performed using a LabTest 4.050 (LaborTech, Opava, Czech Republic) universal testing machine. The specimens were loaded in compression within the plane of the frame corner joint, as shown in
Figure 3. Each specimen consisted of two beech wood members with a thickness of 18 mm connected by an FDM-printed dovetail connector. The longitudinal grain direction of the beech members was oriented parallel to the longitudinal axis of each joint arm. Six replicates were tested for each connector configuration. The mechanical response of the joints was recorded as a load–displacement curve. The measured maximum load Fmax was then used to calculate the maximum bending moment of the joint. The load levels corresponding to 10% and 40% of
Fmax were used to define the approximately linear region of the response. The interval between these two load levels was subsequently used to calculate the rotational stiffness of the joint (
Figure 3).
The maximum bending moment of the corner joint was expressed as the maximum bending moment at failure:
where
Mu is the maximum bending moment of the joint (N·mm),
Fmax is the maximum force recorded at joint failure (N), and
l is the joint arm length (mm).
The stiffness of the corner joint was calculated from the linear part of the load–deformation curve as
where
T is the joint stiffness (N·mm/deg), Δ
M is the change in bending moment (N·mm), and Δ
φ =
φ10 −
φ40 is the change in joint rotation angle (deg), where
φ10 and
φ40 are the joint rotation angles corresponding to 10% and 40% of
Fmax, respectively. In this study, Δ
M was calculated in the range between 10% and 40% of the maximum bending moment.
To evaluate the material efficiency of the FDM-printed connector, the specific maximum bending moment was calculated:
where
Msp is the specific maximum bending moment of the connector (N·mm/g),
Mmax is the maximum bending moment of the joint (N·mm), and
m is the nominal filament mass estimated by the slicing software for each connector configuration (g). This value was used to assess whether increasing the number of perimeters or infill density provided a proportional improvement in mechanical performance in relation to the higher material consumption.
The specimens were loaded at a constant crosshead displacement rate of 10 mm/min. The supported arm was restrained against translation while remaining free to rotate in the plane of the joint. No preload was applied before testing. The maximum load Fmax was defined as the highest force recorded during the test, and the post-peak failure criterion was defined as a decrease in force to 50% of Fmax.
2.5. Statistical Analysis
The experimental results were statistically analysed using a two-way analysis of variance (ANOVA) to evaluate the influence of infill density, perimeter count, and their interaction on the maximum bending moment, rotational stiffness, and specific bending moment of the joints. Statistical significance was assessed at α = 0.05.
2.6. Finite Element Analysis
The numerical model was developed in ANSYS Mechanical 2023 R1 (ANSYS, Inc., Canonsburg, PA, USA) to complement the experimental results and to explain the load-transfer mechanism between the FDM-printed connector and the wooden members. The FEM analysis was not intended to provide a precise prediction of failure initiation, layer delamination, or local damage within the printed material. Instead, it was used as a comparative and interpretative tool for evaluating contact behaviour, reaction forces, and the distribution of stresses in critical regions of the joint.
2.6.1. Homogenized Model of the FDM Connector
In the FEM model, the FDM-printed connector was represented by a two-domain shell–core model. The fully printed regions, including the perimeter walls, top and bottom solid layers, bridges, and slicer-generated solid infill regions, were assigned the material properties of fully dense RePLA+. The sparse cubic infill was not modelled explicitly, but was replaced by a homogenized continuum with effective properties dependent on the nominal infill density.
This modelling approach was adopted because the aim of the FEM analysis was not to reproduce the local behaviour of individual toolpaths, infill rib collapse, layer delamination, or filament-level damage. Instead, the model was intended for comparison of the global mechanical response, contact behaviour, and critical stress regions of the connector configurations. Replacing the sparse infill with a homogenized core reduced the computational cost and enabled comparison of variants with different infill densities without explicitly modelling the internal infill geometry.
RePLA+ was modelled as an isotropic linear-elastic material. This assumption was considered appropriate for the comparative purpose of the analysis, because the model was used mainly to compare connector configurations and identify critical regions rather than to predict micromechanical damage in the FDM-printed material. The effective density of the homogenized sparse infill was calculated as
where
is the effective density of the homogenized core (kg∙m
−3),
is the density of fully dense RePLA+ (kg∙m
−3), and ø is the nominal infill density expressed as a relative value (0.2, 0.3, and 0.4), corresponding to infill densities of 20%, 30%, and 40%, respectively.
The effective Young’s modulus of the homogenized sparse infill was determined by simple scaling with relative density. This approach follows the homogenization concept used for FDM/FFF parts with internal infill, where the explicit infill geometry is replaced by an equivalent continuum with effective properties dependent on infill density. A similar homogenization principle has been used to evaluate the macroscopic response of infill structures [
21] and in FEM analysis of FFF parts with different infill densities [
22]. The effective Young’s modulus of the core was calculated as
where
Ecore is the effective Young’s modulus of the homogenized sparse infill (MPa),
Eshell is the Young’s modulus of fully dense RePLA+ (MPa),
ϕ is the nominal infill density expressed as a relative value (0.2, 0.3, and 0.4), corresponding to infill densities of 20%, 30%, and 40%, respectively, and
CE is the stiffness scaling coefficient. In this study,
CE = 1 was adopted, corresponding to linear stiffness scaling with infill density. The homogenized shell–core representation and linear density-based scaling of the core stiffness were adopted as computationally efficient modelling assumptions for comparative analysis of the investigated connector configurations and were not calibrated against the experimental joint response.
The interfaces between the fully printed regions of the FDM connector and the homogenized core were defined as bonded contact, assuming perfect interaction between the connector domains without modelling delamination, toolpath separation, or local infill damage. This representation was treated as a modelling assumption rather than an experimentally calibrated interface law.
2.6.2. Contacts, Mesh, and Boundary Conditions
The contact between the FDM-printed connector and the walls of the wooden slot was defined as frictional contact with a coefficient of friction of
μ = 0.6. The selected value is comparable in magnitude to the experimentally determined coefficient of
μ = 0.54 reported by Hu and Guan [
24] for frictional contact in beech mortise-and-tenon joints. The contact pairs were solved using the Augmented Lagrange formulation. To eliminate small numerical gaps between the connector and the slot, the
Adjust to Touch option was applied, and the pinball radius was set to 0.5 mm. This contact definition allowed load transfer through contact pressure and friction while permitting local sliding between the connector and the wood.
The finite element mesh was generated in ANSYS Mechanical. A global element size of 2 mm was applied, and adaptive mesh refinement was used in regions of curvature and contact. Mesh convergence was assessed for the representative 3P30 configuration using global element sizes of 3.0, 2.0, and 1.5 mm. The corresponding reaction forces were 80.40, 80.03, and 82.57 N, respectively. Relative to the finest mesh, the deviations were 2.63% and 3.08% for the 3.0 and 2.0 mm meshes, respectively; both were below the adopted 5% convergence criterion. The 2.0 mm mesh was therefore retained as sufficiently converged with respect to the global reaction force. The boundary conditions were defined according to the experimental test configuration. The supported arm was represented by a Remote Displacement boundary condition, with translations in the X, Y, and Z directions constrained and rotation about the Z-axis left free. This arrangement simulated a support condition rather than a fully fixed constraint.
The load was applied at the end of the second arm as a prescribed displacement in the direction of the global Y-axis. Displacement-controlled loading was selected to improve the convergence stability of the contact model. The reaction force at the loading point was extracted and used for comparison of the numerical and experimental responses of the joint.
2.6.3. Loading Conditions and Evaluated FEM Outputs
The FEM model was evaluated under two loading conditions. In the first loading condition, the model was loaded by the experimentally determined displacement u40 (mm), corresponding to 40% of the maximum experimental load. This displacement-controlled state was used to evaluate the pre-failure contact response of the joint and to identify the load-transfer mechanism at the connector–wood interface before dominant damage occurred.
At this loading state, three contact parameters were evaluated: contact pressure, frictional stress, and sliding distance. Contact pressure was used to identify the bearing regions where the connector pressed against the wooden slot walls. Frictional stress described the tangential component of contact interaction and the transfer of load through friction. Sliding distance described the relative movement between the connector and the slot walls. These parameters were not interpreted as direct indicators of maximum bending moment or stiffness, but as contact conditions affecting the global mechanical response of the joint.
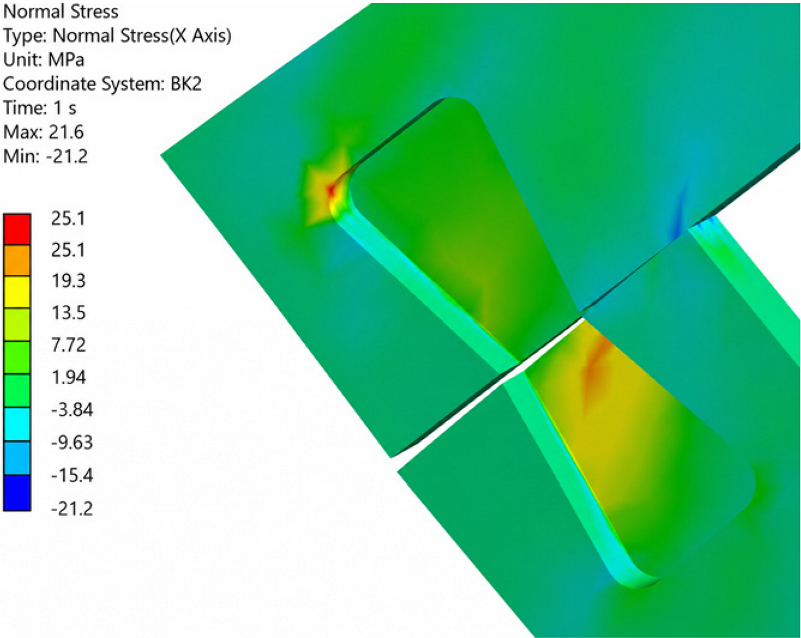
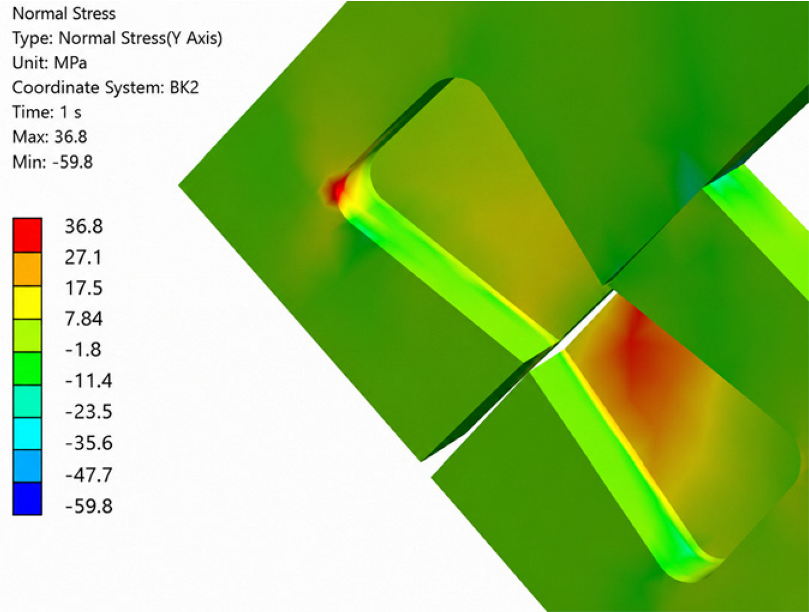
In the second loading condition, the model was loaded by the mean maximum experimental force, Fmax (N), of the corresponding connector configuration. This loading state was used to evaluate stress fields and compare them with the experimentally observed damage. In the FDM-printed connector, equivalent von Mises stress was evaluated because RePLA+ was modelled as an isotropic polymer material. In the wooden members, normal and shear stresses were evaluated in the local material coordinate system because of the orthotropic nature of beech wood. The Y-direction corresponded to the direction parallel to the grain, the X-direction to the tangential direction, and the Z-direction to the radial direction. Positive normal stresses parallel to the grain were compared with tensile strength parallel to the grain, negative normal stresses with compressive strength parallel to the grain, and shear stresses with shear strength parallel to the grain. This comparison was used only as an indicative assessment of critical regions, not as a deterministic failure criterion for wood. Therefore, the FEM results were interpreted mainly in relation to the experimentally observed damage.
3. Results and Discussion
3.1. Experimental Mechanical Behaviour and Material Efficiency
The mean values of the mechanical properties and material efficiency of the individual connector configurations are presented in
Table 2.
The mass of the printed connectors ranged from 2.57 g (1P20) to 5.09 g (5P40), with increasing perimeter count and infill density resulting in a gradual increase in material consumption. The maximum bending moment of the joints ranged from 9109 N·mm to 14,998 N·mm. The highest mean rotational stiffness was recorded for configuration 3P30 (6172 N·mm/deg), whereas the lowest value was observed for configuration 5P40 (4476 N·mm/deg). The specific bending moment ranged from 2608 N·mm/g to 3903 N·mm/g, with the highest mean value achieved by configuration 3P20.
Effect of Printing Parameters on Maximum Bending Moment and Stiffness of the Tested Joints
The two-way ANOVA revealed statistically significant effects of both perimeter count and infill density on the specific bending moment (
p < 0.001 for both factors). The results indicate that, among the tested configurations, specific combinations of perimeter count and infill density provided a more favourable balance between mechanical performance and material consumption. Configuration 3P20 exhibited the highest mean specific bending moment, followed by configuration 3P30, whereas further increases in perimeter count or infill density did not improve material efficiency. This observation is consistent with the findings of Mazlan et al. [
20], who reported that FDM printing parameters influence both mechanical performance and material utilization. Model residuals were assessed for normality using the Shapiro–Wilk test, and homogeneity of variances was evaluated using Levene’s test. For rotational stiffness, neither residual normality nor homogeneity of variances was rejected (W = 0.982,
p = 0.570; Levene’s F(8,45) = 0.981,
p = 0.463). For maximum bending moment and specific bending moment, the diagnostic tests indicated deviations from normality and homogeneity of variances (maximum bending moment: W = 0.935,
p = 0.006; Levene’s F(8,45) = 8.317,
p < 0.001; specific bending moment: W = 0.953,
p = 0.035; Levene’s F(8,45) = 6.670,
p < 0.001). Therefore, ANOVA results for these responses were interpreted cautiously, particularly with respect to comparisons among individual configurations.
The results of the two-way analysis of variance (ANOVA) for maximum bending moment and rotational stiffness are presented in
Table 3 and
Table 4, respectively. The analysis showed a significant effect of perimeter count on joint maximum bending moment (F = 31.397,
p < 0.001). In contrast, infill density did not significantly affect maximum bending moment (F = 0.930,
p = 0.402), and no significant interaction between perimeter count and infill density was detected (F = 1.762,
p = 0.153).
These results indicate that joint maximum bending moment is governed primarily by the thickness of the outer shell formed by the perimeter walls, whereas increasing infill density within the investigated range (20–40%) does not provide a significant improvement in strength. Load transfer is therefore carried mainly by the outer material layers, which resist the normal and shear stresses developed in the most highly loaded regions of the connector.
For rotational stiffness, neither of the investigated factors showed a statistically significant effect. Perimeter count did not significantly affect joint stiffness (F = 2.547, p = 0.090), nor did infill density (F = 2.014, p = 0.145). The interaction between both factors was also not significant (F = 1.934, p = 0.121). Although some differences were observed among the tested configurations, the overall stiffness remained at a comparable level. These findings indicate that variations in perimeter count and infill density within the investigated range did not substantially influence the rotational stiffness of the joints.
This conclusion is consistent with the study of Mazlan et al. [
20], who reported that perimeter and infill parameters influence the mechanical response of FDM-printed parts, while their effect depends on the specific performance criterion considered.
The results of the two-way ANOVA for specific bending moment
Msp are presented in
Table 5. The analysis revealed statistically significant effects of both perimeter count (F = 16.565,
p < 0.001) and infill density (F = 10.205,
p < 0.001). In contrast, the interaction between the two factors was not statistically significant (F = 0.374,
p = 0.826). These results indicate that the material efficiency of the joints was influenced by both the thickness of the outer shell and the amount of material used in the infill. Although increasing infill density resulted in higher filament consumption, it was not accompanied by a proportional increase in maximum bending moment, leading to a reduction in specific bending moment.
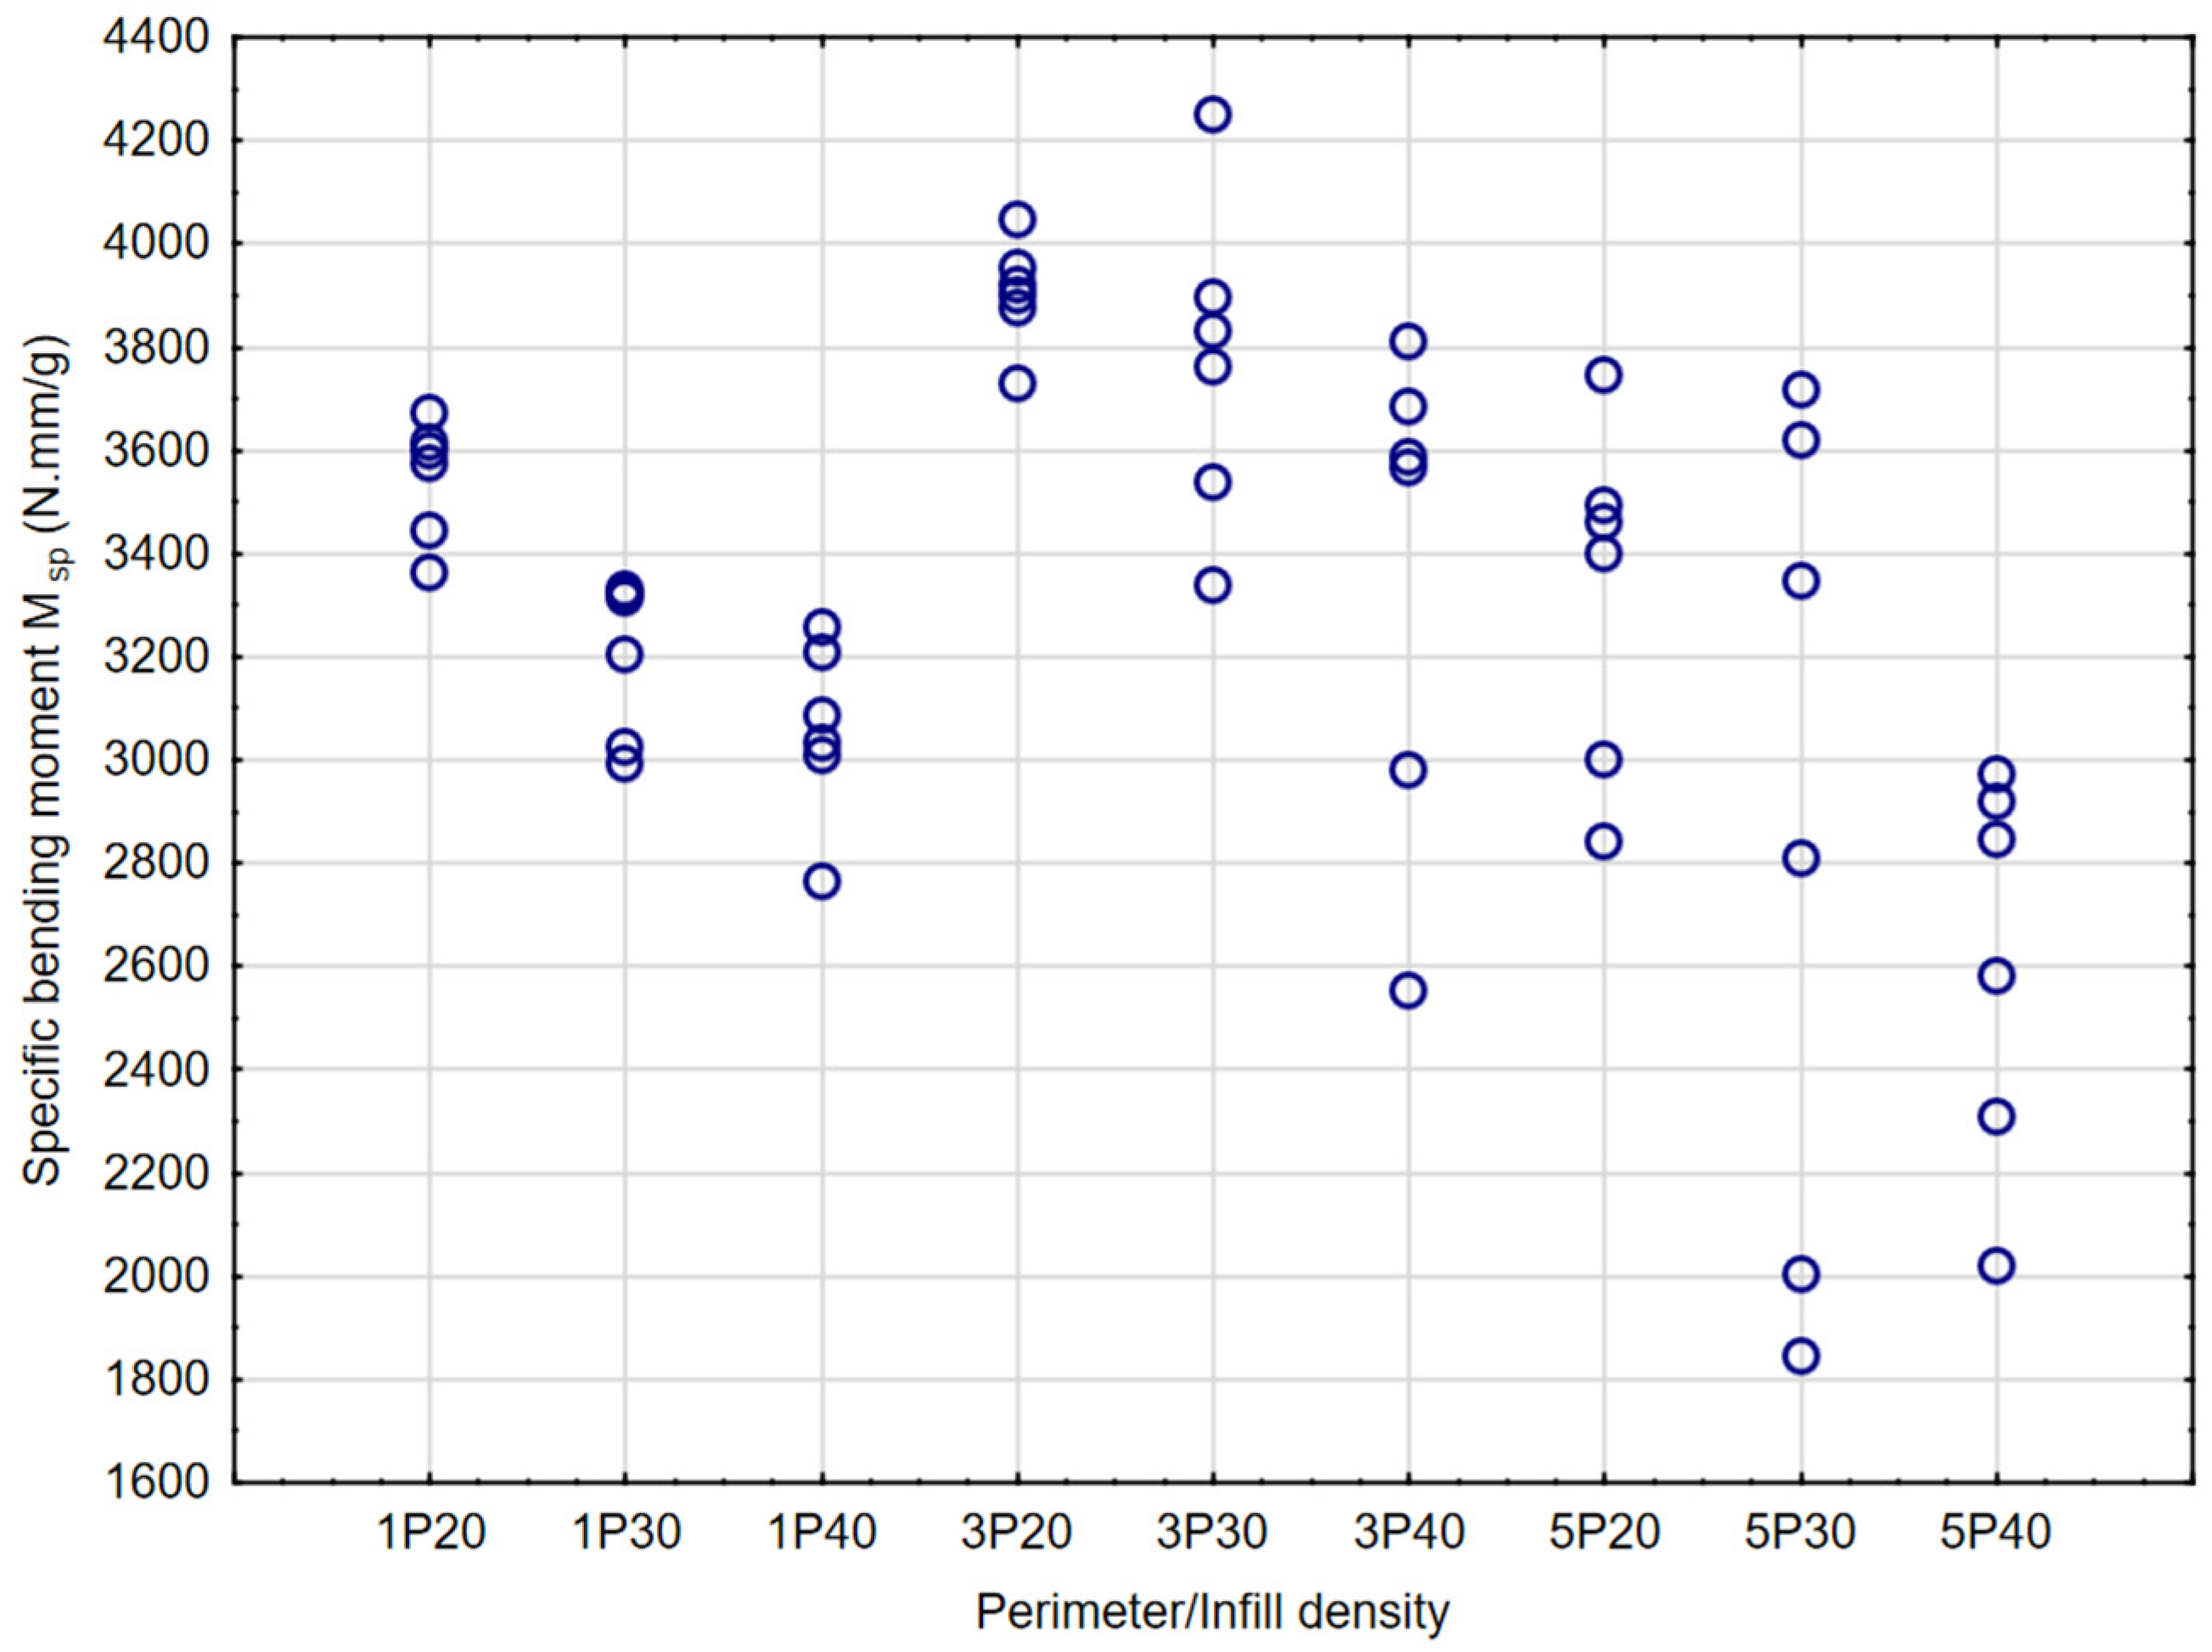
The specific bending moment values of the individual connector configurations are shown in
Figure 4. The highest mean value was obtained for configuration 3P20 (3903 ± 104 N·mm/g), whereas the lowest value was recorded for configuration 5P40 (2608 ± 380 N·mm/g).
3.2. FEM Analysis of Joint Behaviour
FEM analysis was used to support the experimental results and to explain the load-transfer mechanism between the FDM-printed connector and the wooden slot. The contact outputs were evaluated for connector configurations with three perimeter walls (3P). This group was selected because the experimental and statistical results indicated that the 3P configurations provided a favourable balance between mechanical performance and material consumption among the evaluated configurations. Compared with 1P configurations, 3P connectors provided a higher mechanical response, whereas increasing the perimeter count to 5P did not lead to a proportional improvement in material efficiency. Therefore, the 3P group was used as a representative configuration for analysing the effect of infill density on the contact behaviour between the FDM-printed connector and the wooden slot.
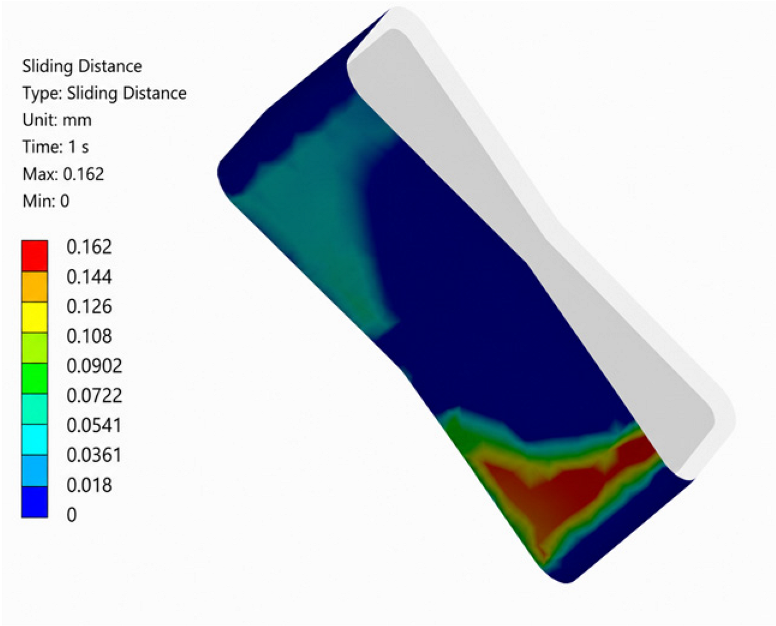
Contact behaviour was evaluated for the three 3P connector configurations at the loading state corresponding to 40% of the maximum experimental load. This pre-failure loading state was used to identify the main load-transfer mechanisms at the connector–wood interface before dominant damage occurred. The FEM model was loaded by the experimentally determined displacement corresponding to this load level. Three contact parameters were analysed at the connector–wood interface: maximum contact pressure, maximum frictional stress, and maximum sliding distance (
Table 6). Contact pressure was used to identify the bearing regions where the connector pressed against the wooden slot walls. Frictional stress described the tangential component of contact interaction and the transfer of load through friction. Sliding distance described the relative movement between the connector and the slot walls. These parameters were not interpreted as direct indicators of maximum bending moment or stiffness, but as contact conditions influencing the global mechanical response of the joint.
The reaction forces obtained from the FEM analysis were lower than the experimental values for all analysed 3P configurations, with differences ranging from 14.6% to 23.6% (
Table 7). The best agreement was achieved for configuration 3P30. Although the model underestimated the absolute values of the reaction force, it successfully captured the main experimental trend. Increasing the infill density from 20% to 30% improved the joint response, whereas a further increase to 40% did not result in an additional improvement in the global reaction force.
For configuration 3P20, the maximum contact pressure reached 12.58 MPa, the maximum frictional stress was 3.22 MPa, and the maximum sliding distance reached 0.162 mm. These values indicate relatively weak bearing of the connector against the slot walls and the highest relative movement among the analysed 3P configurations. Increasing the infill density to 30% increased the maximum contact pressure to 17.94 MPa and the maximum frictional stress to 4.74 MPa, while the maximum sliding distance decreased to 0.138 mm. This suggests that configuration 3P30 provided better seating of the connector in the wooden slot and more effective load transfer through both contact pressure and friction.
Configuration 3P40 reached a maximum contact pressure of 16.05 MPa and a maximum frictional stress of 4.11 MPa, which were slightly lower than those obtained for 3P30. The maximum sliding distance further decreased to 0.123 mm, indicating reduced relative movement between the connector and the slot walls. However, this lower sliding did not lead to a higher global reaction force. The FEM reaction force for 3P40 was 73.70 N, compared with 80.03 N for 3P30. This indicates that increasing the infill density from 30% to 40% improved positional stability, but did not improve the overall load-transfer capacity of the joint.
The FEM model systematically underestimated the experimental reaction force by 14.6–23.6% and was therefore not interpreted as an exact quantitative predictor of reaction force. Nevertheless, it reproduced the experimental trend observed among the analysed configurations (3P30 > 3P40 > 3P20) and was used for its intended comparative purpose, namely to support the interpretation of relative contact behaviour and stress localization.
Overall, the FEM results suggest that configuration 3P30 provided the most balanced contact response among the analysed 3P variants. It combined the highest contact pressure and frictional stress with relatively low sliding and the highest FEM reaction force. These findings are consistent with the experimental and statistical results, which showed that increasing infill density beyond 30% did not provide a proportional improvement in joint performance.
The FEM results complement the experimental and statistical evaluation. For the analysed 3P configurations, increasing infill density from 20% to 30% improved contact behaviour and reaction force, whereas a further increase to 40% reduced sliding but did not improve the global response of the joint. From the perspective of experimental performance, contact behaviour, and material consumption, configurations 3P20 and 3P30 can be considered the most balanced solutions, with 3P30 providing the most favourable contact response and the smallest difference between numerical and experimental reaction forces.
3.3. Evaluation of Experimentally Observed Damage and FEM Stress Fields
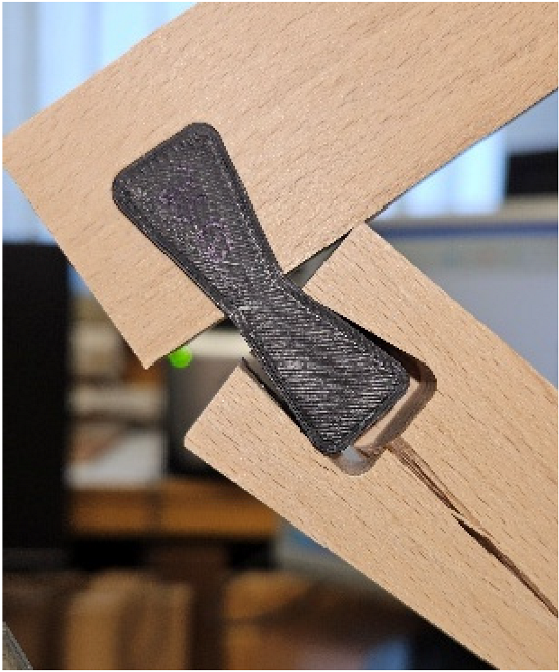
The observed failure modes depended on the perimeter configuration. For connectors with one perimeter (1P), complete fracture of the connector shank was observed. Connectors with three perimeters (3P) exhibited visible localized deformation of the connector shank, accompanied in some specimens by partial splitting of the wood along the grain. For connectors with five perimeters (5P), no visible connector damage was observed; damage was mainly concentrated in the wooden members and was characterized by splitting along the grain.
For the stress-based damage evaluation, the 30% infill configurations (1P30, 3P30, and 5P30) were selected in order to isolate the effect of perimeter count on stress distribution and damage localization. The 30% infill level was used as a representative reference level because the experimental results and FEM contact results indicated that it provided a favourable balance between mechanical response and material consumption. Experimentally observed damage was compared with the stress fields obtained from FEM analysis at the loading state corresponding to the mean maximum experimental force of each configuration (157.90 N for 1P30, 234.35 N for 3P30, and 226.74 N for 5P30). The objective of this comparison was not to determine the exact onset of failure, but to verify whether regions of elevated stress identified in the FEM model corresponded to the damage locations observed after mechanical testing.
In the FDM-printed connector, equivalent von Mises stress was evaluated because RePLA+ was modelled as an isotropic polymer material. In the wooden members, normal and shear stresses were evaluated in the local material coordinate system to account for the orthotropic nature of beech wood. For an indicative assessment of critical regions in the wood, the calculated stresses were compared with reference strength values of beech wood reported by Požgaj et al. [
26]. The reference values used in this comparison were tensile strength parallel to the grain
ft,0 = 56.7 MPa, compressive strength parallel to the grain
fc,0 = 113.5 MPa, and shear strength parallel to the grain
fv = 15.1 MPa.
Positive normal stresses parallel to the grain were compared with tensile strength parallel to the grain, negative normal stresses parallel to the grain were compared with compressive strength parallel to the grain, and shear stresses were compared with shear strength parallel to the grain. For the individual stress components, indicative strength utilization indices were calculated as
where
It,
Ic and
Iτ are the tensile, compressive, and shear strength utilization indices, respectively;
σt,0 is the tensile stress parallel to the grain,
σc,0 is the compressive stress parallel to the grain,
τ is the shear stress, and
ft,0,
fc,0, and
fv are the corresponding reference strength values of beech wood. Values below 1 indicate that the calculated local stress remained below the corresponding reference strength, whereas values above 1 indicate that the local stress exceeded the relevant strength value. Such regions were therefore considered potentially critical locations with respect to the experimentally observed damage (
Table 8).
Experimental damage patterns and examples of stress distributions in the wooden joint members are shown in
Table 9. Normal stresses in the wood did not exceed the reference tensile or compressive strengths parallel to the grain. The tensile utilization index
It ranged from 0.44 to 0.67, whereas the compressive utilization index
Ic ranged from 0.19 to 0.53. These results suggest that, for the evaluated configurations, the observed wood damage was not primarily caused by normal stresses acting parallel to the grain. In contrast, shear stresses in the wood exceeded the reference shear strength parallel to the grain for all evaluated configurations. The shear utilization index
Iτ ranged from 1.32 to 2.09. Therefore, the observed damage in the vicinity of the slot was associated mainly with localized shear loading, accompanied by indentation of the wood at the connector bearing regions.
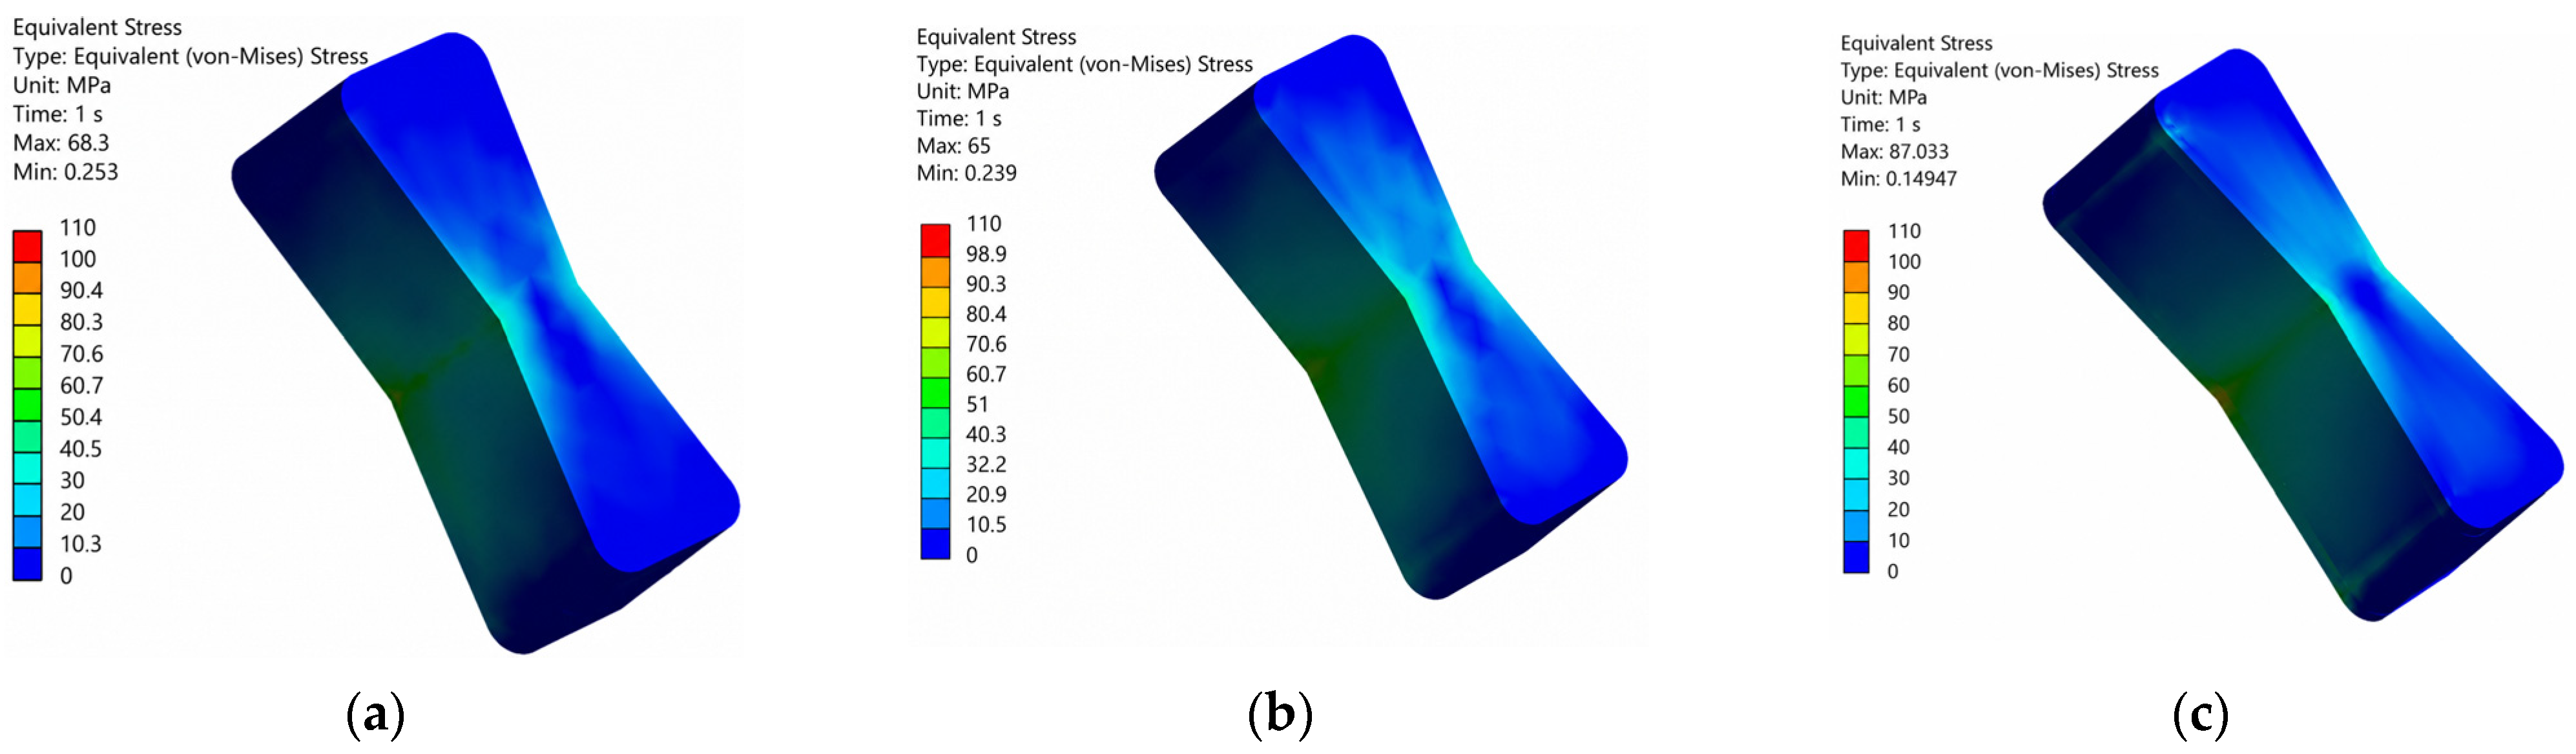
Equivalent von Mises stress was evaluated in the FDM-printed connector to identify critical regions of the polymer component (
Figure 5). The highest stress concentrations occurred primarily in the connector neck region, where an abrupt change in cross-section and dovetail geometry is present. The maximum von Mises stress reached 68.32 MPa for configuration 1P30, 65.00 MPa for 3P30, and 87.03 MPa for 5P30.
These local stress maxima were within the range of typical strength values reported for PLA-based materials, which are generally between 50 and 60 MPa in tension and 80–100 MPa in bending for printed components [
27]. Therefore, these regions were interpreted as potentially critical locations within the connector rather than as a precise prediction of failure initiation. The lowest stress level was observed for configuration 3P30, indicating a slightly more favourable load distribution within the polymer connector, particularly compared with configuration 5P30.
The net printing time of one connector is summarized in
Table 10. The printing time of a single connector increased with both increasing infill density and perimeter count. The shortest printing time was recorded for configuration 1P20 (406 s), whereas the longest printing time was observed for configuration 5P40 (561 s). However, this increase was not accompanied by a proportional improvement in mechanical performance. The 5P configurations and the variants with 40% infill required longer printing times and higher material consumption, but did not achieve a corresponding increase in maximum bending moment or rotational stiffness.
In contrast, configuration 3P30 achieved the highest rotational stiffness and the highest maximum bending moment with a printing time of 469 s, which was substantially shorter than those of configurations 5P30 and 5P40. Configuration 3P20 achieved the highest specific maximum bending moment with a printing time of 444 s. Considering the combination of mechanical performance, material consumption, and production time, configurations 3P20 and 3P30 can be considered the most favourable solutions.
4. Conclusions
The results showed that a material-efficient design of FDM-printed dovetail connectors cannot be achieved simply by increasing the amount of printed material. In the investigated wooden corner joints, maximum bending moment was mainly affected by perimeter count, whereas increasing the cubic infill density from 20% to 40% did not result in a statistically significant improvement in either maximum bending moment or rotational stiffness. This indicates that the fully printed perimeter regions of the connector played a more important role in load transfer than the sparse internal infill.
The results indicate that neither higher infill density nor greater material consumption necessarily resulted in proportional improvements in maximum bending moment or rotational stiffness. Configuration 3P20 achieved the highest mean specific bending moment (3903 N·mm/g), whereas configuration 3P30 provided a favourable combination of high maximum bending moment (14,998 N·mm), the highest rotational stiffness (6172 N·mm/deg), stable contact behaviour, and moderate material consumption among the evaluated configurations. Further increasing the infill density to 40% or the perimeter count to 5P mainly increased material use and printing time without a proportional mechanical benefit.
The FEM analysis supported the experimental results and helped explain the differences between connector configurations. Configuration 3P30 showed a slightly lower von Mises stress than 1P30 and a clearly lower value than 5P30, together with the most balanced contact behaviour at the connector–wood interface. Compared with 3P20, it provided higher contact pressure and frictional stress with reduced sliding, indicating improved load transfer and seating of the connector in the wooden slot. Increasing the infill density to 40% further reduced sliding, but did not increase the global reaction force or improve the overall mechanical response. The damage evaluation also showed that critical regions in the wooden members were mainly associated with shear loading and local indentation in the active bearing zones of the slot. In the FDM-printed connector, the critical region was concentrated in the connector neck, where an abrupt change in the dovetail geometry occurs.
From a practical perspective, the results indicate that the design of FDM-printed furniture connectors should focus on appropriate selection of perimeter count, outer shell thickness, and critical geometric regions rather than uniformly increasing infill density. Within the investigated range, higher infill density increased material consumption and printing time without a statistically significant improvement in maximum bending moment or rotational stiffness. Appropriate selection of the printing configuration can therefore reduce polymer material consumption while maintaining the mechanical function of wooden furniture joints, thereby contributing to more resource-efficient and sustainable furniture manufacturing. The present study was conducted under controlled laboratory conditions. Therefore, future research should investigate the influence of environmental factors, such as variations in wood moisture content and elevated service temperatures, on the long-term performance of FDM-printed furniture joints.