Abstract
In the context of rapid urbanization, the connection between humans and nature has progressively diminished. As an essential approach to fostering public ecological awareness and well-being, nature education requires greater integration into urban green space planning and management. This study examines 14 country parks, urban parks, and forest parks in Beijing, conducting questionnaire surveys in six representative parks and collecting 820 valid responses. Combining image semantic segmentation techniques, the research employs the PSPNet model trained on the ADE20K dataset to automatically extract landscape features of nature education spaces. These features are then integrated with visitor perception evaluations through univariate linear regression models to analyze the impact of spatial variables on visitor perceptions. Results indicate that building coverage, plant species density, interpretation sign density, number of artificial interpretations, and number of nature education activities offerings show significant positive correlations (p < 0.05) with visitor perceptions. In contrast, excessive artificial structures exert a negative influence. The R2 values of each model ranged from 0.12 to 0.34, indicating that natural education space features possess explanatory power for visitor perceptions but remain influenced by multiple interacting factors. This study establishes a quantitative evaluation framework linking natural education space landscape features to visitor perceptions, providing a scientific basis for natural education planning and spatial optimization in parks within megacity contexts.
1. Introduction
With the acceleration of global urbanization, cities are increasingly shifting from growth-oriented development to models that prioritize ecological restoration and public well-being. However, while modern urban lifestyles bring convenience, rapid spatial expansion has intensified environmental pollution, traffic congestion, and public service inequality, weakening everyday human interaction with natural environments. This trend has contributed to an increasingly widespread “nature deficit” phenomenon [1,2], marked by declining opportunities for nature contact and diminished ecological cognition. The reduction in accessible urban ecological spaces has further negatively affected residents’ mental health and community cohesion [3]. Therefore, restoring the human–nature relationship has become a central challenge for sustainable urban transformation and high-quality human settlements worldwide.
Urban green spaces, as essential components of urban ecosystems [4], not only deliver regulating and supporting ecosystem services but also provide cultural and educational value [5]. They act as key carriers for rebuilding human–nature interactions within urban environments. Nature education, as an important extension of these cultural services, employs direct nature experiences and experiential learning to cultivate ecological awareness and responsible environmental behavior [6]. It enhances public understanding of ecological processes, strengthens emotional attachment to natural environments, and encourages pro-environmental actions [7,8]. From an educational perspective, nature education helps participants observe, interpret, and internalize natural phenomena, fostering environmental responsibility and promoting harmonious human–nature relationships. Moreover, beyond its instructional function, nature education embodies a humanistic philosophy—advocating a return to authenticity and meaningful engagement with the natural world [9]. Although closely related to environmental education, nature education emphasizes active, embodied learning, focusing not only on knowledge acquisition but also on inner growth and value formation [10]. Starting from human initiative [8], it features a dynamic “perception–cognition–action” process grounded in experiential interaction with natural settings [11]. Therefore, nature education is not only a sustainable educational form but also an educational philosophy, objective, and core value that can be deeply embedded into all types of teaching models [12]. Based on existing literature, this study defines nature education as a participatory educational approach that guides individuals to recognize, appreciate, understand, and care for nature while fostering self-growth and promoting harmonious coexistence between humans and the natural environment [13].
With the growing emphasis on ecological awareness and sustainability, academic interest in nature education has shifted from conceptual discussion to empirical evaluation. In international research, visitor perception has become a key lens for assessing the effectiveness of environmental education [14] and science education [15]. Visitor perception reflects an individual’s comprehensive cognitive, emotional, and behavioral responses shaped through interaction with educational environments [16]. Li et al. [17], for example, define environmental education perception as an integrated evaluation formed after participants experience educational interventions within a given setting. Similar conceptual frameworks have been proposed by Mo et al. [18] and others. In recent years, the visitor perception approach has been extended to the study of nature education, providing a new framework for understanding participant experiences. Li et al. [19] explored nature education from a visitor perception perspective, while Wang et al. [20] identified key factors influencing public perception of nature education in parks. Hutcheson et al. [21] further demonstrated that educational programs in urban parks can deepen public understanding of ecological systems and support long-term ecological stewardship. These studies highlight the importance of perception-based evaluation in understanding the educational, psychological, and behavioral impacts of nature-based learning. Building on these advances, quantitative perception evaluation systems have been developed to assess the outcomes of nature and environmental education. Sun et al. [22] compared residents’ and tourists’ perceptions of natural forest reserves in China and revealed a mismatch between tourism development and ecological protection, highlighting the need for educational interventions. Ridayani et al. [23] found that environmental knowledge and education significantly promote pro-environmental behavior among university students, further supporting the role of education in shaping environmental responsibility.
Since 2016, with the advancement of ecological civilization in China, nature education has received increasing attention at both policy and societal levels [24]. Government agencies have begun promoting the standardized development of nature education within urban green spaces [25]. However, academic research and practical implementation remain in the early stages of exploration. In many cases, urban green spaces lack explicit nature education functions, supporting facilities, and long-term operational mechanisms. Common problems include fragmented curricula, limited educational resources, and the absence of industry standards [26]. In addition, research on visitor perception of nature education is still emerging. For instance, Liu [27] developed a five-dimensional visitor perception evaluation system—comprising natural resources, signage systems, tourism organization, staff quality, and guided interpretation—based on theoretical analysis, field interviews, and questionnaires. He et al. [15] classified science education visitor perception into three dimensions—park landscape perception, science activity perception, and interpretation service perception, and further refined these into 29 indicators. Their findings revealed that elements such as historical relics, water features, interpretive materials, and interpreters significantly influence visitor perceptions. However, most existing studies emphasize subjective perception evaluation [20] and lack systematic investigation of visitors’ cognitive, emotional, and behavioral responses. In particular, few studies integrate objective landscape characteristics into perception assessment, and no evaluation framework has yet been developed that links spatial landscape characteristics with visitor perceptions in the context of nature education.
Within China’s urban planning framework, country parks serve as key ecological buffers and transitional zones between urban construction areas and ecological conservation spaces, performing multiple functions including ecological restoration, recreation, and public education [28]. Beijing offers a representative case, having established a ring of country park system surrounding the central city as part of the Beijing Master Plan (2016–2035) [29]. These parks not only support urban ecological security and large-scale green space connectivity but also provide residents with essential opportunities for outdoor recreation and informal environmental learning [30]. Due to their peri-urban locations, diverse natural resources, and educational potential, country parks possess unique advantages for implementing nature education within megacities. However, the current development of nature education functions in China’s country parks remains insufficient. Many parks lack systematic educational planning, interpretation facilities, and long-term program management, resulting in weak public engagement and low educational effectiveness. How to scientifically integrate nature education into the spatial planning and governance of country parks remains a practical challenge requiring urgent exploration.
Therefore, this study focuses on Beijing as an empirical case to bridge the current research gaps and address the practical challenges of integrating nature education into large-scale green space systems. The study seeks to answer the following research questions: (1) How can a scientific and operable evaluation framework be developed to measure visitor perceptions of nature education in urban parks? (2) What spatial landscape characteristics distinguish nature education spaces in country parks from those in other park types? (3) How do visitor perceptions of nature education vary across different park typologies? (4) How do spatial landscape characteristics influence visitor evaluations of nature education in country parks? By addressing these questions, this study constructs a framework linking spatial landscape characteristics with visitor perception and empirically reveals how spatial configuration affects the educational experience in nature education environments. The findings not only deepen the theoretical understanding of nature education from a spatial perspective but also provide practical implications for the planning and governance of urban green spaces in megacities. This research contributes to restoring human–nature relationships and supports a more resilient, ecologically oriented model of urban development.
2. Materials and Methods
2.1. Study Area
Beijing is located between 39°26′–41°03′ N latitude and 115°25′–117°30′ E longitude. The central terrain is relatively flat and is surrounded by mountains on three sides, with an average elevation of 43.5 m. The city experiences a warm temperate, semi-humid continental monsoon climate, characterized by rainy summers. As China’s political, cultural, and international exchange center, Beijing holds significant strategic importance in the country’s coordinated regional development. The evolution of its urban green spaces is closely associated with natural resources and socio-economic factors [31], while the development of its nature education system has served as a model for other regions [32].
Before the rapid urban expansion, Beijing’s country parks primarily existed as forested areas, with land use dominated by woodlands. Their main ecological functions focused on water conservation, windbreak protection, and sand fixation. With the implementation of the Beijing Master Plan (2016–2035) and the Green Belt Development Plan during the 14th Five-Year Plan, country parks have been required to transition from purely ecological conservation areas to multifunctional urban parks that integrate ecological restoration, recreational leisure, and public service functions. Guided by the principles of “reduced-scale development” and stock renewal, and constrained by construction budgets and development boundaries, the renewal of country parks increasingly relies on functional operations rather than large-scale construction, exhibiting a development pattern characterized by low construction intensity but high operational focus [33]. In recent years, Beijing has extensively implemented nature education programs across more than 200 urban, forest, and country parks [34], creating opportunities to translate ecological value into social and educational benefits [35].
Therefore, this study selected three types of parks—urban parks, country parks, and forest parks—for comparative analysis to examine differences in natural education functions and visitor perceptions across park categories. Survey sites were determined using a typical sampling method, guided by clearly defined screening criteria based on publicly available and verifiable information. First, candidate parks were required to be listed in the Beijing Park Directory published by the Beijing Municipal Bureau of Landscape and Forestry, ensuring standardization and representativeness of the sample. Second, to establish a solid foundation in natural, science, and environmental education, selected parks needed verifiable records of hosting science outreach activities or receiving science education awards, as documented on the China Science and Technology Network (http://www.kepu.gov.cn/, accessed on 13 March 2024) or on the parks’ official websites. Third, parks were required to hold honorary titles or enjoy high public recognition in science education, environmental education, nature education, or nature experience, ensuring that they could serve as exemplary sites for nature education practices. Detailed qualifications for each park are presented in Table 1. Additionally, to enhance spatial coverage and typological diversity, parks were chosen to achieve a balanced distribution across Beijing and represent a range of park typologies.

Table 1.
Basic information on Beijing research parks.
Based on these criteria, 14 representative parks were ultimately selected for field research, including 4 urban parks and 4 forest parks as control groups, and 6 country parks as the experimental group. The study focused particularly on the distinct characteristics and differences in country parks compared to other park types. Basic information for each park is provided in Table 1, while the distribution of sample points and transects is illustrated in Figure 1.
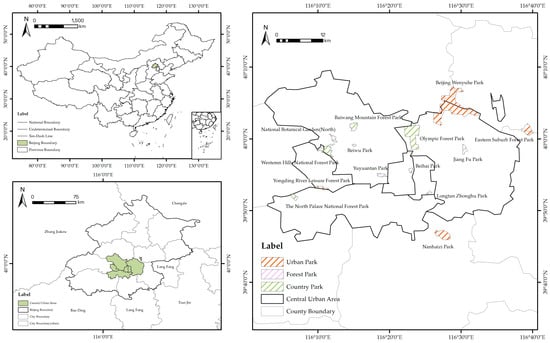
Figure 1.
The basic location distribution of selected typical country parks in Beijing. This figure is produced based on a map downloaded from the TianDiTu website [Map Approval Number: GS(2024)0650)]. It uses the standard basemap with official national boundaries, and no edits or adjustments have been made to national borders, administrative boundaries, or extents, or other important geographic information data.
2.2. Research Design
2.2.1. Selection of Line Transect
Visitors’ perceptions of nature education are influenced not by isolated spatial points, but by multiple interconnected pathways. Therefore, this study selected representative sample routes within each park’s nature education programs and activity trails to examine the spatial and landscape characteristics of nature education.
The selection process employed a multi-step approach. First, existing nature-education routes in each park—such as officially designated nature trails, flower-viewing paths, and ecological experience routes—were reviewed to preliminarily identify representative visitor pathways. Second, information regarding nature-education activities, major landscape nodes, core recreational spaces, and the distribution of interpretive facilities was collected from official park websites, WeChat accounts, and media reports, ensuring that elements relevant to natural education were fully incorporated into the subsequent transect design. Third, transect lengths were determined based on each park’s size, landscape structure, and spatial configuration, with the aim of covering key nature-education elements while avoiding excessively long routes that could introduce perceptual bias.
For survey instruments, the pilot survey employed the TwoSteps GPS-tracking application to record route trajectories and the GPS coordinates of individual sampling points along each transect. High-resolution photographs were taken at nodes along the routes to support subsequent image-based semantic segmentation analysis (see Section 2.2.3). During data collection, at least two team members conducted surveys together, enabling cross-recording to minimize subjective omissions and observational bias. Following fieldwork, Excel spreadsheets were used to document, for each node, landscape characteristics, facility types, crowding levels, and accessibility, thereby producing a standardized and comparable dataset.
To ensure data quality, a double-check mechanism was applied to all transect records: each transect was independently recorded by different researchers and then cross-validated and consolidated. Discrepancies in node records were resolved through on-site re-verification or by consulting photographic evidence. Prior to finalizing the transects, the research team reviewed their completeness, representativeness, and operational feasibility through expert discussions and preliminary survey results, ensuring that each transect systematically and objectively captured the key landscape structures and functional elements of the parks’ nature-education spaces.
Ultimately, fourteen sample routes were selected across the fourteen parks. Details of route length and characteristics are presented in Table 2, while the specific distribution of routes and sampling points is provided in Appendix A.
Table 2.
Selection of sample sites and sample lines for the survey park.
2.2.2. Establishing an Indicator System for Landscape Characteristics in Nature Education Spaces
Based on a synthesis and analysis of the existing literature, this study defines visitor perceptions of nature education as the comprehensive cognitions and impressions formed by individuals through hands-on experiences, observations, and active participation in natural environments, specifically in relation to the nature-education functions of parks.
Empirical evidence indicates that objective landscape characteristics influence visitors’ perceptual cues and behavioral patterns, thereby shaping their nature-education experiences and environmental cognition. Using large datasets combined with geotagged social media data, I-Ting Chuang et al. demonstrated that spatial diversity, attraction distribution, and accessibility within parks significantly affect visitor density and recreational behaviors, highlighting spatial configuration as a critical variable for understanding behavioral and perceptual heterogeneity among park users [36]. Other studies, adopting a “perception–restoration” framework, have shown that naturalness and safety/readability constitute key perceptual dimensions that drive restorative experiences and psychological well-being. These perceptions are directly associated with measurable landscape attributes, including vegetation stratification, skyline visibility, and site accessibility [37]. Furthermore, research based on text mining and user-generated content has revealed that visitors’ verbal evaluations of signage systems, interpretive content, facility quality, and landscape uniqueness are strongly correlated with overall satisfaction and educational assessments, underscoring the synergistic effects between objective landscape elements and interpretive or communication components [38]. Collectively, contemporary research has progressed from single-dimensional approaches to multi-source and multi-scale analyses, emphasizing the coupled “space–landscape–interpretation–experience” mechanism as essential for explaining nature-education outcomes and variations in visitor perception.
To more directly link visitor perceptions with tangible landscape characteristics and provide practical guidance for Beijing’s ecological civilization development, this study examines four key dimensions: resource foundation, interpretation systems, nature education activities, and nature education media. Specifically: (1) Resource foundation represents the ecological and material basis for nature education, determining a park’s environmental capacity and potential experiential scenarios. (2) Interpretation systems facilitate visitor comprehension and processing of natural resources through structured information presentation and knowledge translation mechanisms. (3) Nature education activities, as the experiential core, promote emotional engagement and knowledge internalization via interaction, hands-on experience, and learning. (4) Nature education media extend educational reach through online and offline dissemination, enhancing visitor cognition and participatory memory. These four dimensions are interrelated and collectively shape visitors’ cognitive, emotional, and attitudinal perceptions of nature education, as illustrated in Figure 2.
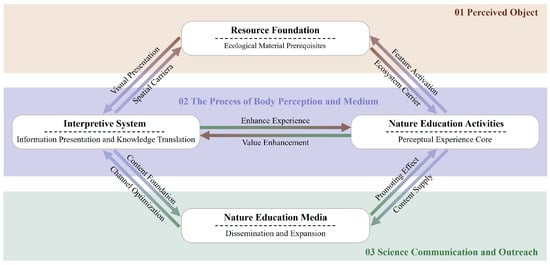
Figure 2.
Theoretical framework diagram for nature education perception research.
Methodologically, spatial landscape characteristic factors relevant to nature education were first identified through a literature review, forming the basis of an indicator framework. In the empirical phase, field surveys combined with Street View image analysis were employed to collect and quantitatively assess landscape features along the line transects. Park nature education spatial characteristics were categorized into four dimensions, with corresponding research indicators established under each. The Resource Foundation dimension comprises construction elements, natural elements, and facility elements, with specific indicators detailed in Table 3. To ensure scientific rigor and comparability, all landscape element indicators were calculated using standardized measurement methods and normalized for transect length to minimize data bias. The specific assignment and quantification methods are as follows:
Table 3.
Indicators for landscape characterization of nature education spaces in parks.
(1) Resource Foundation Indicators [39,40]: Values for building coverage, structure/furniture coverage, paving coverage, sky visibility, green visibility rate, and blue visibility rate were determined using image semantic segmentation to calculate area proportions. Paving material types were assigned values as follows: brick/stone = 0, slate = 1, timber = 2, pebbles = 3, gravel = 4, wood chips = 5, soil = 6, asphalt = 7, rubber surface = 8. Plant species density was calculated as (number of tree species + shrub species + flower species)/line transect length. Seating density = total seats/line transect length; children’s facility density = total children’s facilities/line transect length; other facilities density (e.g., commercial amenities like boats, amusement rides) = total facilities/line transect length.
(2) Interpretation System Indicators [41,42]. Interpretation facility types were assigned through categorical statistics: interpretive signs = 1, interactive experience devices = 2, landscape features with integrated interpretation = 3, audio interpretation facilities = 4, video interpretation facilities = 5. Interpretation sign density was calculated as the total number of interpretation facilities/line transect length; number of artificial interpretations = number of artificial interpretations along the transect.
(3) Nature Education Activities Indicators [43]. Activity types were assigned based on categorized statistics: nature observation = 1, nature study = 2, nature interpretation = 3, nature experience = 4, nature play = 5, nature creation = 6, nature exploration = 7. The number of activities was calculated as the sum of events published on official websites and WeChat accounts, plus events recorded from other social organizations during field surveys(between October and November 2023). Average participant level was assigned as: <10 participants = 1, 10–15 = 2, 15–20 = 3, >20 = 4.
(4) Nature Education Media Indicator [19]. The number of media promotions was measured as the number of promotional materials (e.g., QR codes, videos) along the transect. Number of venue promotions = number of promotional displays (e.g., visitor centers, exhibition halls, galleries). Types of product promotions were based on the types of materials (e.g., printed materials, brochures, maps, posters, tickets, books).
2.2.3. Field Research on Landscape Characteristic Elements
A preliminary survey of the 14 selected parks was conducted from July to August 2023 to obtain an overview of their general characteristics. Due to Beijing’s high summer temperatures, visitor numbers were low in most country parks, and nature education activities were rarely observed, making it difficult to collect relevant data.
The formal survey combined on-site inspections with Street View image analysis to gather comprehensive park information. Fieldwork was carried out between October and November 2023, with Street View photography conducted on clear, windy days with no haze. Based on preliminary observations, data collection and documentation were scheduled between 9:00 AM and 3:00 PM. Images were captured using a Canon camera (manufactured by Canon Taiwan Corporation, Taichung City, Taiwan, China) equipped with a 24 mm focal length lens, at a horizontal line-of-sight height of 1.60 m, both forward and backward along the transect. Photographic perspectives included the sky interface, paved surfaces, vertical surfaces, and overall site conditions.
Following the preliminary summer surveys, point photography was conducted at 50 m intervals along each transect line. Subsequently, continuous point-by-point photography was performed along the nature education transects. Throughout the process, camera settings were standardized: 24 mm focal length, automatic aperture mode, 1/250 s shutter speed, and 6000 × 4000 pixel image resolution.
2.2.4. Questionnaire Design
Building on field research of park landscape characteristics, this study employed a questionnaire [44,45] to collect respondents’ demographic information and perceptions of nature education. The questionnaire consisted of two sections:
(1) Demographic survey. This section captured respondents’ gender, age, education level, occupation, mode of transportation to the park, travel time to the park, motivation for visiting, and frequency of participation in nature education activities.
(2) Nature Education Visitor Perception Scale. Based on existing scales [19,46,47], a park-specific nature education visitor perception scale was developed to suit the objectives of this study (Table 4). The scale covers four dimensions—resource foundation, interpretation systems, nature education activities, and nature education media—with a total of 16 detailed items. Specific measurement items are presented in Table 3. Responses were assessed using a five-point Likert scale, where respondents rated their perceptions based on actual experiences. Scores were interpreted as follows: 1 = “Strongly Disagree”, 2 = “Disagree”, 3 = “Neither Agree nor Disagree”, 4 = “Agree”, and 5 = “Strongly Agree”.
Table 4.
Nature education tourists’ perception scale.
After finalizing the questionnaire design, internal consistency was assessed for the 16 measurement factors using Cronbach’s alpha in SPSS 26.0. The overall Cronbach’s alpha coefficient was 0.907, indicating high reliability of the questionnaire for subsequent analyses. When individual factors were removed, the corresponding alpha values remained between 0.905 and 0.915, demonstrating that each measurement factor maintained good reliability. Given that the scales employed were already dimensionally structured, confirmatory factor analysis (CFA) was conducted, as summarized in Table 5.
Table 5.
Validation analysis fit index criteria.
Data fit tests for each park category relative to the hypothesized model structure indicated that urban parks required no model modifications. For the other two park types, initial model fit indices did not meet acceptable thresholds, necessitating adjustments detailed in Table 6. Specifically, forest parks exhibited notably high modification indices between variables c7 and c8; therefore, an association correction was applied to reduce the chi-square statistic and increase the significance p-value. Similarly, for country parks, high modification indices were observed between variables c1 and c2, as well as c7 and c8, prompting corresponding association corrections. The final CFA models are presented in Figure 3a–c.
Table 6.
Fitted indicator values for different types of parks.
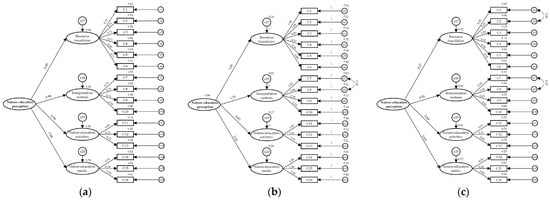
Figure 3.
Parameter estimation of a structural relationship model for nature education tourists’ perception of the country park. (a) Urban Park; (b) Forest Park; (c) Country Park.
It is important to note that in this study, both c1 and c2 represent visitors’ direct perceptions of park natural environment quality. These variables are highly interrelated in cognitive judgment, as visitors tend to form an overall impression of a park’s natural landscape based on both its uniqueness and species richness. Consequently, their measurement errors may share a common source [48], rendering it theoretically reasonable to allow error-term correlations in the CFA. Likewise, c7 and c8 both capture aspects of the accessibility and comprehensibility of the park’s interpretive system, reflecting closely coupled characteristics within the natural education interpretive service experience. Prior research indicates that the spatial arrangement of interpretive signage, information legibility, and content clarity typically act in concert to shape visitors’ overall perception of the interpretive system [49]. Accordingly, these two factors often display high covariation in practical assessments, and permitting error-term correlations between c7 and c8 enhances the model’s ability to accurately reflect the shared cognitive mechanisms of visitors during interpretive experiences, thereby improving overall model fit [50].
2.3. Data Collection and Analysis
2.3.1. Questionnaire Data Collection
Considering the level of nature education development, the feasibility of questionnaire implementation, and survey costs, this study selected six representative parks from the initial pool of 14 based on criteria of representativeness, scale, and usage intensity, functional diversity, and spatial layout. Specifically, the selected parks encompassed three typical types—urban parks, forest parks, and country parks—to ensure diversity in nature-education contexts. These parks were characterized by moderate size, high visitor traffic, and a rich array of nature-education activities, ensuring both data representativeness and stability. Moreover, each park had an established foundation in nature-education and science outreach activities, with corresponding records in either the Beijing Municipal Bureau of Landscape and Forestry directory or the China Science and Technology Network. The selection also ensured spatial distribution across Beijing’s eastern, southern, western, northern, and central districts to achieve broad regional coverage.
Following park selection, survey participants were systematically matched based on demographic characteristics, including age, gender, occupation, monthly income, and whether they were part of a group tour or traveling independently. This approach enhanced the rationality of the sample structure and its external validity. Given that nature-education activities primarily occur on weekends and holidays, questionnaire distribution was uniformly scheduled during these periods to ensure participants were engaged in authentic nature-education experiences. Prior to the full-scale survey, a pilot study was conducted to assess the target group and refine the questionnaire. A total of 70 questionnaires were distributed and returned, and the data were analyzed in SPSS 26.0. The results indicated high reliability and validity, confirming the questionnaire’s suitability for subsequent quantitative analysis.
During data cleaning, rigorous procedures were applied to ensure questionnaire validity, data quality, and research reproducibility. First, a minimum response time threshold of 90 s was set, and responses below this threshold were excluded as insufficiently completed. Second, to prevent bias from duplicate responses, only the first completed questionnaire submitted from the same device within a short timeframe was retained. Logical consistency checks were also performed; questionnaires exhibiting clear contradictions within the same response group (e.g., indicating “I generally do not participate in nature-education activities” but subsequently reporting “I participate in nature-education activities more than three times per week”) were deemed invalid. Finally, questionnaires with extensive missing responses or over 80% consecutive selections of the same option—indicating potential “mechanical responses”—were excluded. Based on these criteria, a total of 820 valid questionnaires were retained for subsequent analysis. The overall valid response rate was 89.8%, with the following distribution: National Botanical Garden (126), Yuyuantan Park (153), Olympic Forest Park (134), Baiwangshan Forest Park (136), Beijing Wenyuhe Park (142), and Nanhaizi Park (129). Data processing was conducted using SPSS 26.0 statistical software, with in-depth analysis performed using AMOS 26.0 structural equation modeling software.
2.3.2. Image Data Analysis
This study employs a deep learning–based image semantic segmentation approach to perform pixel-level identification and quantify the area proportions of landscape elements in park transect images. Specifically, the ADE20K dataset, comprising 150 urban scene categories, was used as the semantic ground truth and pre-trained baseline [51], while the Pyramid Scene Parsing Network (PSPNet) was implemented as the backbone model. The model was subsequently fine-tuned [52] on 1091 high-resolution images collected from 14 park transects in Beijing.
The workflow begins with the collection of image samples within the study area. Raw images are then mapped to target categories according to the ADE20K semantic labeling system. PSPNet is adapted through transfer learning to mitigate recognition bias caused by class imbalance in the study area, thereby improving segmentation accuracy for key landscape elements such as vegetation, paved surfaces, water bodies, and sky [53]. During model training, the dataset was split into training (70%), validation (15%), and test (15%) subsets. Training parameters were configured as follows: 80 epochs, batch size of 8, learning rate of 0.001, and momentum-based stochastic gradient descent (SGD) as the optimizer. The model achieved a mean Intersection over Union (mIoU) of 0.412 and pixel accuracy of 0.873 on the validation set, consistent with performance benchmarks for urban green space scenarios in the ADE20K dataset. These results provide a robust foundation for integrating subjective questionnaire data with objective landscape features. During inference, the model produces pixel-wise semantic segmentation masks for each image. Quantitative metrics, including building coverage, paved surface coverage, green view ratio, and blue view ratio, are then derived by statistically analyzing the proportion of each pixel category. This approach substantially reduces subjectivity in manual interpretation, enabling large-scale, repeatable extraction of landscape features [54,55].
To further ensure the reliability of segmentation results, a manual verification procedure was conducted alongside model evaluation metrics, enhancing the credibility of analyses in natural education scenarios. First, representative images were selected from all transects via stratified random sampling at a 15% proportion, ensuring coverage across park types and diverse landscape elements. Second, two researchers with expertise in landscape planning and feature recognition manually annotated the sampled images according to the ADE20K semantic categories. The manual annotations were then compared pixel-by-pixel with the model-generated segmentation masks. Agreement rates for primary categories were calculated to assess the model’s accuracy in identifying core elements relevant to nature education. Results indicate that the model achieves high recognition accuracy for large-scale spatial features, with consistency exceeding 85% for vegetation, buildings, and paved areas, aligning with the mIoU performance metrics. Minor discrepancies were observed in areas with blurred boundaries or high category granularity, such as forest canopy edges or partially occluded regions. To mitigate the impact of these errors on subsequent landscape variable calculations, shadow removal and smoothing were applied during image preprocessing, and pixel blocks in connected regions below a specified threshold were corrected.
Through this manual validation, the study confirms that PSPNet demonstrates high stability and reliability for large-scale landscape category identification tasks, supporting subsequent quantitative analyses of structural landscape indicators, including green coverage and impervious surface proportion.
2.3.3. Analysis of Variance
A one-way analysis of variance (ANOVA) was performed using SPSS 26.0 to examine differences in landscape characteristics of nature education spaces among different park types. Statistical significance was set at p < 0.05. In addition, differences in visitors’ perceived evaluations of nature education spaces across park types were assessed using the same significance threshold.
2.3.4. Correlation Analysis
Bivariate correlation analysis was conducted in SPSS 26.0, with Pearson’s correlation coefficient used to assess relationships between various spatial landscape characteristics and visitors’ perceived evaluation scores. A significance level of p < 0.05 was applied to identify statistically significant correlations.
2.3.5. Simple Linear Regression Analysis
A simple linear regression model was constructed for nature education spatial landscape features and visitor perception evaluation scores that exhibited significant correlations. Variables with p < 0.05 were selected as predictive variables for inclusion in the model. Based on the overall analysis, resource foundation characteristics and corresponding visitor perception evaluations showing significant correlations with nature education visitor perception scores were selected for regression analysis. The regression model is expressed as follows:
where Y is the dependent variable; X is the independent variable; β0 represents the intercept; β1 is the regression coefficient; and ε denotes the random error term, representing the portion of variance unexplained by the model. Parameters were estimated using the least squares method, minimizing the sum of squared residuals to obtain the best-fit regression line [56].
During analysis, the overall significance of the regression model was first tested using the F-test to determine whether the model effectively explains variability in the dependent variable. Subsequently, the significance of the regression coefficient β1 was tested using the t-test to assess whether the independent variable significantly influences the dependent variable. Additionally, the coefficient of determination (2) was used to evaluate the goodness of fit of the model, indicating the proportion of variance in the dependent variable explained by the independent variable.
3. Results
3.1. Analysis of Landscape Characteristics in Nature Education Spaces Across Different Parks
Overall, Beijing’s parks exhibit well-developed infrastructure, yet notable disparities exist in nature education facilities. Country parks and forest parks excel in natural elements, whereas urban parks demonstrate advantages in facilities and guided interpretation, as summarized in Table 7.
Table 7.
Landscape Characteristics of Nature Education Spaces in Various Parks.
3.1.1. Resource Foundation
In terms of construction elements, indicators for building coverage, structure/furniture coverage, and paving coverage are generally comparable between country parks and forest parks. Building coverage in both country parks and forest parks mostly hovers around 1%, whereas urban parks—except for the National Botanical Garden (North)—all exceed 1%. Among them, Beihai Park has the highest building coverage at 6.24%, reflecting its status as a historic garden with numerous preserved cultural relics, differing from other parks primarily focused on recreation or ecological functions. Structure/furniture coverage is generally higher in forest parks, maintaining levels around 2–5%. The other two park types show more pronounced variation among individual parks; for example, Beihai Park exhibits the highest value at 12.65%, whereas Jiangfu Country Park has the lowest at 0.86%, consistent with its ecological park character. Paving coverage is generally higher in urban parks, averaging around 10%, compared to lower levels in the other two park types. Yuyuantan Park records the highest value at 21.15%, while Xishan National Forest Park has the lowest at 4.72%. Most parks employ four or more paving material types, with Olympic Forest Park using as many as seven.
In terms of natural elements, different park types show minor differences in green visibility rate and blue visibility rate, whereas sky visibility and plant species density exhibit significant variation. Sky visibility is generally higher in country parks, with Beijing Wenyuhe Park achieving the highest rate at 24.50%. For green visibility rate, country parks and forest parks mostly surpass urban parks, maintaining rates between 60% and 70%, with Eastern Suburb Forest Park reaching 73.70%. Blue visibility rate varies considerably among park types, reflecting park characteristics and construction features: country parks remain low at 0.02–0.04%, urban parks range moderately from 0.33% to 0.55%, and forest parks show wider fluctuations, spanning 0.20–1.91%. North Palace National Forest Park records the highest blue visibility at 1.91%, corroborated by field transect surveys indicating a higher concentration of water bodies. Regarding plant species density, the National Botanical Garden, due to its specialized botanical nature, exhibits a significantly higher density than other parks, with 27.52 species per 1000 m. The remaining parks range between 9 and 20 species per 1000 m.
A comprehensive analysis of facility elements reveals considerable variation in seating density, closely tied to parks’ functional positioning, while children’s facility density and other facility densities remain relatively low. Seating density is notably higher in Olympic Forest Park, China National Botanical Garden (North), and Beihai Park, with densities of 23.66, 22.94, and 14.21 seats per 1000 m, respectively. Other parks maintain densities below 10 seats per 1000 m. Children’s facilities are sparse; only a few parks, such as Nanhaizi Park and Longtan Zhonghu Park, feature 1–2 facilities, while most parks lack such amenities. Regarding other facility density (e.g., commercial amenities such as amusement rides or boat rentals), most country parks do not provide these services. Olympic Forest Park exhibits the highest density among this category, with two facilities per 1000 m.
3.1.2. Interpretation Systems
A comprehensive analysis of interpretation system elements across parks indicates that most parks have established some form of interpretation system; however, these systems primarily consist of interpretive signs, with limited artificial interpretation available. Regarding interpretation facility types, Nanhaizi Park exhibits the greatest diversity, including interpretive signs, interactive experience installations, landscape features with integrated interpretive functions, and audio guide systems—comprising four distinct categories. Most other parks provide only interpretive signs, typically ranging from one to two per park. Consequently, field surveys emphasized interpretive sign density. The National Botanical Garden (North) demonstrates the highest density, with signs covering nearly every plant category, whereas other parks, such as Beijing Wenyuhe Park and Yuyuantan Park, exhibit relatively low sign density. In terms of artificial interpretation, only the National Botanical Garden (North) offers four fixed tour guides. Other parks provide virtually no guided interpretation, falling short of visitor expectations for comprehensive nature education experiences.
3.1.3. Nature Education Activities
Field investigations of nature education activities across parks indicate that, during autumn, these activities primarily consist of nature observation and nature interpretation. Among the surveyed parks, Nanhaizi Park, Beijing Wenyuhe Park, National Botanical Garden (North), Longtan Zhonghu Park, Olympic Forest Park, and Baiwangshan Forest Park all regularly host these two types of activities, with an average attendance of 15–20 participants per session. However, such activities are largely confined to a limited number of representative parks. Other parks, including Eastern Suburb Forest Park and Jiangfu Park, exhibit no evidence of organized nature education events. Nonetheless, some parks maintain stable activity mechanisms; for example, the wetland area of Yuyuantan Park regularly conducts wetland science outreach events, demonstrating differentiated educational characteristics across park types.
3.1.4. Nature Education Media
With respect to nature education media, most parks primarily rely on media channels for promotion, while venue-based and product-based publicity remain relatively underdeveloped. In terms of the number of media promotions, Nanhaizi Park leads with six instances of corresponding outreach, primarily utilizing QR codes linking visitors to the park’s official accounts. For example, QR code scanning connects access to the Milu Deer Park attraction, enhancing overall visitor engagement. Other parks, including Beijing Wenyuhe Park, Eastern Suburb Forest Park, National Botanical Garden (North), and Yuyuantan Park, also employ QR codes, mainly for official park accounts and plant knowledge dissemination. Regarding the number of venue promotions, the National Botanical Garden (North) offers the most diverse options, featuring multiple venues such as science education halls and greenhouses that provide educational content at varying knowledge levels. Other parks generally offer fewer facilities; for instance, Nanhaizi Park and Wenyuhe Park each feature only one science exhibition hall. Concerning the types of product promotions, most parks limit offerings to admission tickets, with few derivative products related to nature education. Overall, current nature education media in major parks suffer from homogeneity and limited integration, indicating the absence of a multi-channel coordinated promotional system.
3.2. Analysis of Perception Differences in Nature Education Among Visitors to Different Park Types
3.2.1. Characteristics of Nature Education Visitors Across Park Types
Analysis of sample characteristics indicates no significant gender disparity among respondents across park types, suggesting a relatively balanced and representative gender distribution (Appendix B).
The age distribution of visitors varies by park type, although the majority are young and middle-aged adults. Country parks and forest parks have the highest proportion of visitors aged 36–45, whereas urban parks are predominantly visited by young adults aged 19–25. While respondents under 18 constitute a small fraction of questionnaire participants, this does not fully capture the actual presence of children and adolescents in the parks. Field observations confirm that young and middle-aged visitors aged 26–40 frequently accompany children and adolescents during park visits.
Regarding educational level, approximately half of all visitors hold a bachelor’s degree, a proportion that remains consistent across park types. Visitors with other educational backgrounds display a more diverse distribution. In terms of occupation, visitor demographics are relatively balanced across professions; however, full-time homemakers are more prevalent in country parks, whereas students dominate in urban and forest parks.
Transportation methods to reach parks also differ by park type. Private vehicles are the dominant mode for country parks (65.44%), while public transportation is primarily used for urban parks (34.29%) and forest parks (47.41%). Travel time is predominantly 15–30 min or 30–60 min for all park types. Regarding frequency of participation in nature education or nature experiences, visitors to country parks, urban parks, and forest parks who visit 1–2 times per month or more than twice per month collectively account for 41.17%, 42.50%, and 40.37%, respectively. These figures indicate a high rate of repeat visits among park users. Notably, visit frequency to country parks remains high despite their relatively remote locations, highlighting strong visitor preference for and reliance on these parks.
3.2.2. Evaluation of Perceived Differences in Nature Education Across Dimensions in Different Parks
Data presented in Table 8 indicate that mean rankings across the four perception dimensions vary among park types. For country parks, the order is: Resource Foundation (3.906) > Nature Education Activities (3.566) > Nature Education Media (3.246) > Interpretation Systems (3.188). In urban parks, the ranking is: Resource Foundation (4.008) > Nature Education Activities (3.737) > Interpretation Systems (3.617) > Nature Education Media (3.613). For forest parks, the order is: Resource Foundation (3.789) > Nature Education Activities (3.505) > Interpretation Systems (2.890) > Nature Education Media (2.725).
Table 8.
Mean statistics of the dimensions of nature education tourists’ perception in different types of parks.
The mean scores for visitor perceptions across all measurement factors exceed 3, indicating that these dimensions are generally of substantial concern to visitors. Among these, evaluations of the resource foundation scored highest across all park types, consistently approaching 4 points. This reflects visitors’ strong recognition of resource foundation conditions, perceiving spatial layouts and landscape elements as favorable—fundamental prerequisites for parks to function effectively as nature education venues.
Conversely, interpretation systems and nature education media exhibit lower performance. Urban parks scored highest, followed by country parks, with forest parks ranking lowest. Specifically, for interpretation systems, mean scores were 3.617 for urban parks, 3.188 for country parks, and 2.890 for forest parks. For nature education activities, scores were 3.737 for urban parks, 3.566 for country parks, and 3.505 for forest parks. Regarding nature education media, scores were 3.613 for urban parks, 3.246 for country parks, and 2.725 for forest parks. Furthermore, the variance of all data points deviated less than 1 from their respective means, indicating a relatively stable dataset and reliable measurement across park types.
Beyond the mean scores of visitor perception evaluations, respondents also provided interval-based ratings across different dimensions of nature education in various park types, as illustrated in Figure 4. At the resource foundation level, 74.26% of visitors to country parks, 76.76% of visitors to urban parks, and 68.95% of visitors to forest parks strongly agreed or agreed with the corresponding statements. For interpretation systems, the proportions were 26.65% for country parks, 37.75% for urban parks, and 20.19% for forest parks. Regarding nature education activities, 28.31% of visitors to country parks, 31.00% to urban parks, and 26.36% to forest parks expressed strong agreement or agreement. For nature education media, the corresponding values were 19.91%, 26.88%, and 10.56% for country parks, urban parks, and forest parks, respectively. These results indicate that the resource foundation of all three park types is widely recognized by visitors. In contrast, interpretation systems, nature education activities, and nature education media have not achieved broad approval, with country parks generally ranking intermediate across these three dimensions.
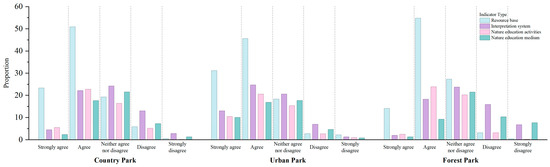
Figure 4.
Descriptive statistics of the dimensions of nature education tourists’ perception in different types of parks.
3.2.3. Evaluation of Perceived Differences in Nature Education Across Factors
Based on descriptive statistics from the questionnaire covering four dimensions and sixteen secondary indicators, this section analyzes positive trends in visitors’ “strongly agree” and “agree” responses across different park types (Appendix C).
At the resource foundation level (Figure A2), 94.71%, 89.71%, and 80.51% of visitors expressed “strongly agree” or “agree” attitudes toward the landscape uniqueness, biodiversity, and landscape diversity of country parks, respectively—values higher than those for urban and forest parks. However, only 53.31% of visitors expressed positive attitudes toward landscape cultural character in country parks, compared to 77.78% for urban parks and 59.63% for forest parks. Regarding facility rationality, 64.33% of visitors to country parks held positive attitudes, versus 67.39% in urban parks and 59.63% in forest parks. For node rationality, country parks recorded 63.60%, whereas urban and forest parks scored 67.74% and 39.26%, respectively.
For interpretation systems (Figure A3), 69.49% of visitors strongly agreed and 59.93% agreed with statements concerning installation layout rationality and interpretive accessibility. Country parks occupied an intermediate position among the three park types, with differences not statistically significant. However, country parks lagged considerably in interpretive format diversity (16.54%) and guided tour engagement (13.97%), compared with urban parks at 43.73% and 40.50%, respectively. This indicates that urban parks have a clear advantage in interpretive diversity and guided tour participation, while country parks urgently need to enhance their overall interpretation systems.
For nature education activities (Figure A4), 43.01% of visitors to country parks strongly agreed or agreed that diverse activity types were offered, a lower proportion than in urban and forest parks. Nevertheless, country parks scored higher than the other park types for participation experience and activity safety, at 63.97% and 62.87%, respectively, indicating that while activity diversity remains limited, visitors generally hold a positive attitude toward participating in nature education activities in country parks.
Regarding nature education media (Figure A5), visitors strongly agreeing or agreeing with media promotion in country parks accounted for 38.60%, compared with 58.78% for urban parks. Positive attitudes toward physical signage and product promotion in country parks were 40.81% and 40.07%, respectively—both lower than urban parks (55.20% and 47.31%) but substantially higher than forest parks. This suggests that country parks have begun implementing media-based promotional efforts, though further development is needed.
Overall, the top five indicators in terms of average perceived satisfaction for country parks were: landscape uniqueness (4.382) > biodiversity (4.254) > landscape diversity (3.956) > facility rationality (3.706) = node rationality (3.706) (Table 9). For urban parks, the top five indicators were: landscape uniqueness (4.211) > biodiversity (4.165) > landscape diversity (4.036) > landscape cultural character (3.978) > installation layout rationality (3.932). For forest parks, the top five indicators were: landscape uniqueness (4.222) > biodiversity (4.048) > landscape diversity (3.867) > landscape cultural character (3.644) = facility rationality (3.644). Across all park types, the top three factors in perceived satisfaction were consistently landscape uniqueness, biodiversity, and landscape diversity.
Table 9.
Mean statistics of factors of nature education tourists’ perception in different types of parks.
3.3. Variations in the Landscape Characteristics of Nature Education Spaces Across Different Types of Parks
Different types of parks exhibit distinct spatial characteristics of nature education due to variations in their functional orientation, development goals, and management models. These differences are reflected not only in the resource foundation, interpretation systems, nature education activities, and nature education media, but also shape visitors’ experiences and perceptions of nature education. In general, urban parks demonstrate advantages in terms of facility completeness and the organization of educational activities, whereas forest parks are characterized by their rich ecological resources and immersive natural environments. Positioned between these two types, country parks possess both ecological conservation value and strong potential for public education, thereby serving as important spaces for integrating environmental protection with nature-based learning.
3.3.1. Resource Foundation
In terms of constructed elements, there were no significant differences among the three park types in building coverage, structure/furniture coverage, paving coverage, or paving material types (p > 0.05), as shown in Figure 5. However, urban parks exhibited the highest proportion of building coverage, whereas country parks and forest parks had higher proportions of structure/furniture coverage. This reflects differences in spatial organization and functional orientation among the park types. Additionally, the standard deviation of paving coverage was relatively high, suggesting substantial variation in surface paving patterns between parks. By contrast, the number of paving material types showed minimal variation across the three categories.
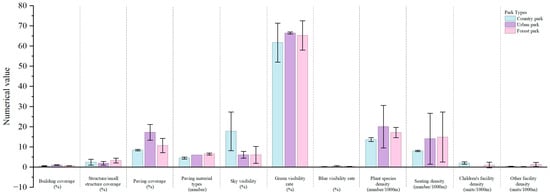
Figure 5.
Differences in the resource base of different types of parks.
Regarding natural features, no significant differences were found among the three park types in sky visibility, green visibility rate, blue visibility rate, or plant species density (p > 0.05). Although the differences were not statistically significant, notable trends were observed. Country parks recorded the highest sky visibility (17.74%), considerably exceeding that of urban parks and forest parks (both approximately 6%), reflecting their relatively open spatial structure. However, country parks had the lowest green visibility rate (61.72%) compared with urban parks (66.52%) and forest parks (65.30%), though the differences were minor. All three park types showed low blue visibility rates (<0.5%), indicating that water features were rarely perceived within visitors’ field of view. Urban parks had the highest plant species density (20.08 species per 1000 m2), largely due to the inclusion of the National Botanic Garden (North), while country parks recorded the lowest value (13.64 species per 1000 m2).
In terms of resource foundation facilities, no significant differences were observed among the three park types in seating density, children’s facility density, or other facility densities (p > 0.05). However, the standard deviation for seating density was relatively large, indicating uneven distribution across park types. Notably, country parks exhibited the highest density of children’s facilities (1.99 facilities per 1000 m2), suggesting a stronger emphasis on family-oriented recreation and educational services.
3.3.2. Interpretation Systems
No significant differences were found among the three park types in interpretation facility types, information sign density, or number of artificial interpretation services (p > 0.05), as shown in Figure 6. However, their spatial distribution patterns varied. Country parks featured the most diverse range of interpretation facility types (three types), while urban parks and forest parks each had two. Interpretation facilities mainly consisted of information boards and landscape elements with interpretive functions, with the former being the most widely used across all parks.
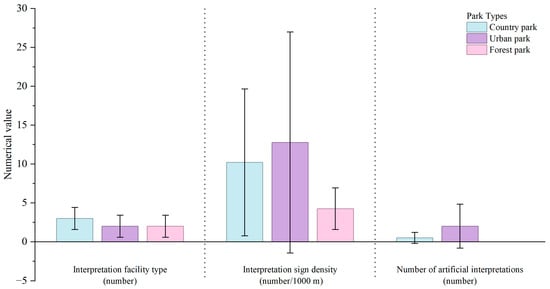
Figure 6.
Differences in the nature education facilities of different types of parks.
Despite having the greatest diversity in interpretation facility types, country parks exhibited a lower density of information signs compared with urban parks. Moreover, the standard deviation in information sign density among the three park types was relatively large, indicating uneven spatial distribution. In terms of artificial interpretation services, all three park types showed generally low provision, with urban parks offering the highest number, followed by country parks, and forest parks the fewest. These results suggest that although country parks possess a relatively comprehensive interpretation system framework, the actual deployment density of interpretive facilities is still insufficient and requires further enhancement to support nature education more effectively.
3.3.3. Nature Education Activities
No significant differences were observed among the three park types in activity variety, number of activities, or average participation level (p > 0.05), as shown in Figure 7. Country parks occupied an intermediate position in both activity diversity and frequency, although the differences compared with urban parks and forest parks were not substantial. Specifically, country parks offered four types of nature education activities with an average of 8.5 activities recorded during the survey period. The average number of participants per activity ranged from 10 to 15 individuals, indicating a moderate level of social engagement. However, despite this level of participation, the overall richness, thematic depth, and level of innovation in activity design remain relatively limited, suggesting that nature education programming in country parks is still at an early stage of development and requires further improvement.
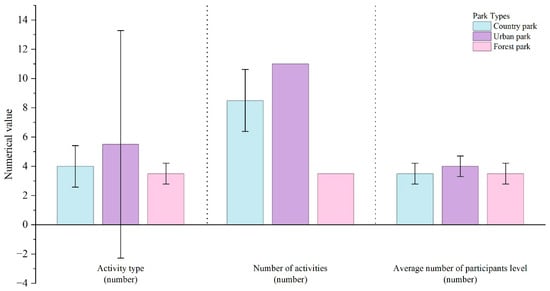
Figure 7.
Differences in the nature education activities of different types of parks.
3.3.4. Nature Education Media
Significant differences emerged among the three park types in terms of nature education media promotion (p < 0.05), as illustrated in Figure 8. Country parks recorded the highest number of media promotion instances, whereas forest parks demonstrated the lowest. Significant differences also existed between country parks and urban parks in product promotion (p < 0.05), with urban parks exhibiting the highest level of product promotion and forest parks again ranking lowest. In contrast, no significant differences were found across park types in venue promotion (p > 0.05), indicating that on-site physical promotion is relatively consistent among different park categories. These findings suggest that while country parks actively utilize media channels to promote nature education, they still lack diversified promotional strategies that integrate both digital and on-site outreach.
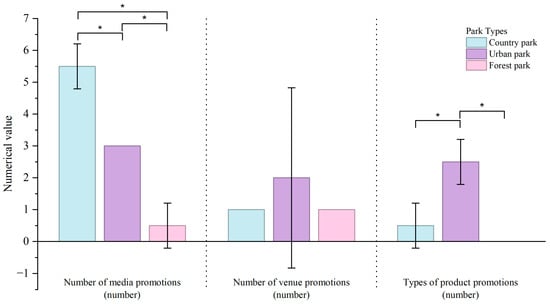
Figure 8.
Differences in the nature education media of different types of parks. Note: *—p < 0.05.
The correlation analysis results indicate that the factor variables display varying degrees of dispersion in the scatterplots. While some variables exhibit clear linear trends with relatively small residuals, others show substantial dispersion. This variation can be attributed to three interrelated factors. First, spatial heterogeneity leads to uneven effects across different sites. Differences in locational attributes, resource foundations, and service capacities among suburban parks result in relatively stable influences of natural landscape elements (e.g., green visibility rate and vegetation coverage), which produce lower levels of error. In contrast, service-oriented variables (e.g., number of educational activities and quality of interpretation services), which are more sensitive to management practices, demonstrate greater variation. Second, heterogeneity in visitor motivations contributes to response variability. The sample consists of visitors engaged in parent–child education and scientific learning, as well as those primarily motivated by recreation and leisure. These groups exhibit different levels of sensitivity to nature education features, resulting in significant correlations yet higher dispersion for education-related variables. Third, contextual and procedural error was introduced during data collection. Variations in visitor flow during observation periods, repeated exposure to certain sampling nodes, and subjective bias inherent in manual assessments may have produced statistical noise. Nonetheless, this degree of dispersion reflects the inherent heterogeneity of the mechanisms through which nature education exerts its effects. Importantly, it does not undermine the reliability of the overall correlation trends or the validity of subsequent model development.
3.4. Influence of Natural Education Space Landscape Characteristics on Visitor Perception Evaluation
3.4.1. Differences in Perceived Evaluation of Nature Education Among Different Demographic Groups
To explore differences in perceived nature education across visitors with varying demographic characteristics, a one-way ANOVA was conducted (Appendix D). Results indicate significant differences in overall perceived evaluation across age groups, transportation modes, and visit motivations (p < 0.05), whereas no significant differences were observed between genders (p > 0.05). By age, the 19–25 cohort scored highest overall (3.677), while the 36–45 cohort scored lowest (3.484), suggesting that younger visitors exhibit higher receptivity and more positive perceptions of nature education. Regarding transportation methods, visitors traveling by electric vehicles reported the highest perception scores (3.863), whereas those using private cars scored lowest (3.451), indicating that convenience and mode of transport may influence perceptions of park nature education functions. Concerning visit motivations, visitors seeking to learn about nature or for professional purposes scored highest (3.890), whereas those motivated by family entertainment (e.g., themed activities, wildlife/plant recognition games) scored lowest (3.444). This demonstrates a strong association between visitors’ objectives and their perceived level of nature education.
3.4.2. Correlation Analysis Between Landscape Characteristics of Nature Education Spaces and Visitors’ Perception Evaluations
To assess the influence of natural education space landscape characteristics on visitor perception, Pearson correlation analysis was performed. Results show that different landscape variables exert varying effects on both overall visitor perception and perceptions across individual dimensions (Table 10). The overall perception evaluation was positively correlated with building coverage, paving material types, plant species density, seating density, interpretation sign density, number of artificial interpretations, number and types of nature education activities, average number of participants level, and diversified promotions. Conversely, overall perception exhibited negative correlations with: structure/furniture coverage and other facilities density.
Table 10.
Correlation analysis between landscape characteristic indicators of nature education space in parks and the mean value of tourists’ perception evaluation.
(1) Resource Foundation evaluation showed positive correlations with plant species density, seating density, interpretation facility type, interpretation sign density, number of artificial interpretations, number of activities, activity types, media promotion, venue promotion, and product promotion. Negative correlations were observed with structure/furniture coverage, blue visibility rate, and other facilities density.
(2) Interpretation Systems evaluation was positively correlated with building coverage, plant species density, seating density, interpretation sign density, number of artificial interpretations, number of activities, activity types, average number of participants, media promotion, venue promotion, and product promotion, and negatively correlated with structure/furniture coverage and other facilities density.
(3) Nature Education Activities evaluation showed positive correlations with building coverage, plant species density, seating density, interpretation sign density, number of artificial interpretations, number of activities, activity types, venue promotion, and product promotion, and negative correlations with structure/furniture coverage.
(4) Nature Education Media evaluation demonstrated positive correlations with building coverage, paving coverage, plant species density, seating density, interpretation sign density, number of artificial interpretations, number of activities, activity types, average number of participants, media promotion, venue promotion, and product promotion, and negative correlations with paving material types, structure/furniture coverage, and other facilities density.
In summary, building coverage, plant species density, seating density, interpretation sign density, number of artificial interpretations, number of activities, activity types, venue promotion, and product promotion consistently exhibit significant positive correlations with average perceived evaluation scores across all visitor categories. In contrast, structure/furniture coverage shows a negative correlation with average perceived evaluation scores across all visitor categories.
3.4.3. Correlation Analysis of Natural Education Space Landscape Characteristics and Visitor Perception Evaluation
Based on the aforementioned analysis results, univariate linear regression analysis was performed on the resource foundation characteristics that showed significant correlation with visitor perception evaluation of nature education, along with their corresponding perception scores, as presented in Table 11.
Table 11.
Linear regression analysis of construct/vignette share on the evaluation of perceived resource base.
- 1.
- Impact of Resource Base on Perceived Evaluation of Nature Education
Univariate linear regression was conducted using five significantly correlated indicators of the resource foundation as independent variables and the visitor perception evaluation of the interpretive system as the dependent variable. The results indicate that, although the five indicators are statistically significant predictors, their overall explanatory power remains relatively low, and the linear model fit is weak. The specific findings are as follows:
(1) Structure/furniture coverage exhibits a significant negative predictive effect on visitor perception of the resource foundation (p = 0.003, R2 = 0.011). Within a certain range, lower structure or furniture coverage within the viewing field contributes to higher perception scores. When the proportion of visible structures/furniture ranges from 0 to 3.91%, the average perception score of the resource foundation reaches 4.0–5.0.
(2) Blue visibility rate (i.e., visible water surfaces or sky features) demonstrates a positive predictive effect on visitor perception scores (p = 0.018, R2 = 0.007). When the blue visibility rate is between 1.08 and 1.33%, the average perception score reaches 4–5, suggesting that moderate blue-space visibility enhances visitors’ perception of the natural education resource base.
(3) Plant species density shows a positive predictive effect on visitor perception of the resource foundation (p = 0.000, R2 = 0.022). Within a certain range, increased plant species richness significantly enhances visitors’ perception of the natural resource foundation. When plant species density ranges from 22.29 to 81.12 species/1000 m2, the average perception score reaches 4–5.
(4) Seating density demonstrates a positive predictive effect on visitor perception of the resource foundation (p = 0.031, R2 = 0.006). Even when the seating density is zero, the mean perception score can still reach ≥4. However, within a reasonable range, increasing the number of seating facilities can further enhance perception by supporting rest, learning, and participation in nature education activities.
(5) Other facilities density (e.g., lighting poles, trash bins, signage unrelated to education) shows a negative predictive effect on visitor perception scores (p = 0.000, R2 = 0.017). Higher densities of such non-essential facilities may introduce visual clutter and diminish the perceived natural quality of the space, thus reducing visitor perception scores. When the density of other facilities is zero, the average perception score can be ≥4.
- 2.
- Impact of Interpretation Systems on Visitors’ Perceived Evaluation of Nature Education
Univariate linear regression analyses were conducted using the two significantly correlated indicators of interpretation systems as independent variables, and visitors’ perceived evaluation of interpretation systems as the dependent variable. The results show that both models demonstrate moderate linear fit, indicating a certain degree of explanatory power for variation in perception scores attributable to changes in interpretation system characteristics.
Interpretive sign density exhibits a significant positive predictive effect on visitors’ perception scores of the interpretive system (p = 0.000, R2 = 0.091). Within an appropriate range, a higher density of interpretive signs contributes to improved visitor comprehension and engagement with natural education themes, thus enhancing perception scores. When interpretive sign density ranges from 34.17 to 97.50 signs per 1000 m, the average visitor perception score reaches 4–5. Similarly, the number of guided tours (artificial interpretations) also shows a positive predictive effect on perception scores (p = 0.000, R2 = 0.109). This suggests that increased opportunities for interactive learning through staff-led interpretation enhance visitors’ understanding of ecological knowledge and strengthen perceived educational value. When the number of guided tours ranges from 5.07 to 10.69 per site, the average perception score of interpretation systems also reaches 4–5.
- 3.
- Impact of Nature Education Activities on Visitors’ Perceived Evaluation
Univariate linear regression analyses were conducted using two significantly correlated indicators of nature education activities as independent variables, and visitors’ perceived evaluation of nature education activities as the dependent variable. The results reveal that the explanatory power of the models is relatively low, indicating that variations in the quantity and diversity of nature education activities only weakly predict changes in visitors’ perception scores. Overall, the linear model fits were limited.
Activity diversity (number of activity types) demonstrates a positive predictive effect on visitor ratings (p = 0.000, R2 = 0.033). Within a certain range, an increase in the variety of activity types contributes to improved visitor evaluations of nature education services. When the number of activity types ranges from 8.42 to 18.83, the mean visitor rating for nature education activities reaches 4–5. Similarly, the number of nature education activities also exhibits a positive predictive effect on visitor perception scores (p = 0.000, R2 = 0.016). Although explanatory strength is weaker compared to activity diversity, a higher frequency of activities still fosters stronger visitor engagement and recognition of educational value. When the number of activities ranges from 26.29 to 73.90, the average visitor perception score for nature education activities also falls between 4 and 5.
- 4.
- Influence of Nature Education Media on Visitors’ Perceived Evaluation
Univariate linear regression analyses were conducted using three significantly correlated indicators of nature education media as predictor variables, with visitors’ perceived evaluation of nature education media as the dependent variable.
(1) The number of media promotions shows a positive predictive effect on visitor perception scores (p = 0.000, R2 = 0.046). Within a specific range, increased media promotion helps strengthen visitors’ recognition of nature education media in parks. When the frequency of media promotion ranges from 11.80 to 22.79, the mean perception score reaches 4–5. However, the model exhibits low explanatory power, suggesting that media promotion alone has a limited effect on perceived media performance.
(2) The number of venue promotions also demonstrates a positive predictive effect on visitor perception scores (p = 0.000, R2 = 0.045). The results indicate that a greater number of venue-based promotional activities enhances visitors’ awareness and evaluation of nature education media. When the frequency of venue promotions ranges from 6.58 to 13.21, the average visitor rating for nature education media reaches 4–5. Similarly to media promotion, the explanatory power of this model is relatively low, indicating a weak linear relationship.
(3) The types of product promotions show a positive and stronger predictive effect on visitor perceived evaluation (p = 0.000, R2 = 0.157). Within a certain range, increasing the variety of educational product promotions (e.g., publications, souvenirs, science kits) significantly enhances visitors’ perception of nature education media. When the number of product promotion types ranges from 3.63 to 6.93, the average visitor rating reaches 4–5. Compared with other landscape characteristic indicators, this model demonstrates a higher degree of fit, indicating that product promotion diversity is a comparatively stronger factor influencing visitors’ perceptions of nature education media.
4. Discussion
4.1. Influence of Country Park Landscape Characteristics on Visitor Perception Evaluation
Based on the questionnaire survey results, this study conducted a comparative analysis of visitors’ perceptions of nature education across different park types, encompassing four dimensions: resource base, interpretation systems, nature education activities, and nature education media. At the overall perception level, visitors to country parks scored between those of the other two park types. At the dimension level, perceptions of the resource base and nature education activities were most prominent, suggesting that these elements are the most intuitive and readily perceived aspects of nature education effectiveness. In contrast, perceptions of interpretation systems and nature education media varied across park types. Specifically, country parks exhibited clear advantages in landscape diversity and biodiversity, whereas their interpretation systems and media promotion were generally moderate, with physical displays and product promotions being relatively more salient. Regarding nature education activities, country parks outperformed other park types in terms of experiential quality and safety, although diversity in activity formats remains an area for improvement.
Correlation analyses examining the influence of natural education spatial landscape features on single-dimensional visitor perceptions revealed significant positive associations for a range of elements, including architectural features, plant species density, seating density, interpretive facility density, number of guided tours, number of activities, activity types, venue promotion, and product promotion. Conversely, the proportion of structural or minor features exhibited a negative correlation. These findings indicate that natural education landscape features exert a composite effect on visitor perceptions, with different elements often influencing multiple dimensions simultaneously rather than through simple one-to-one correspondences. Regression analyses further corroborate this pattern: the density of interpretive signs and the number of guided tours exhibit strong explanatory power for interpretation systems, while the diversity of product promotions demonstrates substantial influence on nature education media. Nevertheless, the overall fit of most regression models remains modest, reflecting the inherent complexity of visitor perceptions, which are shaped by the combined influence of multiple landscape elements. Furthermore, as qualitative data derived from subjective evaluations, visitor perceptions naturally diverge from quantitative landscape metrics, contributing to the observed model fit limitations. Among the four dimensions, regression models for interpretation systems, nature education activities, and nature education media exhibit relatively consistent fit, highlighting these dimensions as the most influential factors shaping visitors’ perceptions. Additionally, correlation analyses between individual perception elements and corresponding evaluation items indicate that elements within the same dimension generally show significant associations with most items within that dimension.
When interpreting the regression results for country parks, particular attention should be paid to the relatively low R2 values observed in some models—a phenomenon commonly encountered in research on nature education and environmental perception. Visitor perception constitutes a highly subjective, multi-faceted psychological process influenced by personal experiences, demographic characteristics, daily activity patterns, and environmental context. Consequently, objective landscape indicators alone are insufficient to fully account for such multidimensional subjective evaluations, consistent with classical environmental psychology theories regarding the complex determinants of perception. Moreover, discrepancies between the objective landscape variables employed in this study—such as vegetation density and interpretive facility density—and subjective perception scores may further attenuate model fit. Despite this, the directionality of variable effects across models is highly consistent, underscoring the theoretical robustness of the relationship between landscape features and visitor perceptions.
4.2. Establishing an Indicator System for Visitors’ Perception of Nature Education in Country Parks
4.2.1. Basis for Constructing the Indicator System
Establishing an indicator system for evaluating visitors’ perceptions of nature education in country parks is essential for clarifying the spatial mechanisms through which nature education functions are realized, improving the quality of educational services, and promoting the transition of country parks from ecological conservation–oriented spaces to ecological education–oriented public venues. To ensure scientific validity and practical operability, the proposed indicator system is grounded in two foundations: empirical evidence and policy guidance.
First, empirical findings from the regression analysis (Section 4.2) identify a set of core spatial and educational factors that significantly influence visitor perceptions. Variables such as vegetation diversity density, spatial accessibility, interpretation system completeness, activity participation intensity, and accessibility of educational communication demonstrated strong explanatory power. These variables constitute key drivers of nature education experience formation and thus provide robust quantitative support for indicator selection. Incorporating these elements ensures that the indicator system is evidence-based and statistically reliable.
Second, policy and regulatory frameworks also provide essential guidance. The Beijing Green Belt Area Park Construction and Management Standards (Trial) stipulate that suburban parks must simultaneously fulfill ecological conservation, recreational, and science education functions. They also provide baseline control indicators such as seating density, structure-to-landscape ratio, signage system coverage, building footprint ratio, and paving coverage. However, these standards focus primarily on physical construction and facility provision, and do not incorporate evaluation criteria related to nature education performance. To address this gap, this study integrates nature education perception indicators—such as educational content delivery, interaction depth, and visitor experience quality—into the framework while maintaining compliance with existing standards. This expands the evaluation scope and achieves a balance between regulatory alignment and methodological innovation. Based on this dual foundation, a comprehensive reference standard for designing nature education spaces in country parks is proposed (Table 12), providing quantitative design guidance for spatial optimization.
Table 12.
Planning and design indicators for nature education tourists’ perception in country parks.
It should be noted that this indicator system is primarily applicable to country parks. Indicators governed by mandatory regulation must strictly comply with existing technical requirements. Other types of parks (e.g., urban parks and forest parks) may adapt and extend the system according to their functional orientation and spatial characteristics when applying it as a reference.
4.2.2. Specific Content of the Indicator System
Based on indicator selection principles and regulatory alignment, the visitor perception evaluation indicator system for nature education in country parks constructed in this study consists of four primary dimensions and twenty secondary indicators. It establishes a progressive structural framework of “environmental infrastructure—interpretation services—educational activities—media dissemination”, reflecting the operational logic of nature education from spatial material support to cognitive experience formation and ultimately to value communication.
In the resource foundation dimension, emphasis is placed on overall landscape configuration and ecological experience quality. Indicators such as building coverage ratio, paving rate, green visibility rate, and blue visibility rate should be optimized through appropriate spatial organization and plant community design. Among these, the building coverage ratio is a mandatory control indicator and must strictly comply with existing planning regulations. Current policy also requires that country parks designate no less than 10% of their area as natural conservation zones to support biodiversity. Accordingly, plant species density may be optimized within a flexible range of 23–82 species per 1000 m2. Seating configuration standards have been refined from percentage-based recommendations to a quantitative benchmark of 8–10 seats per 1000 m2, while other basic service facilities should maintain a density of 0.5 units per 1000 m2.
In the interpretation systems dimension, indicator design emphasizes the integration of functionality and education. Interpretive sign density should be maintained at 35–50 signs per 1000 m2, and educational effectiveness should be enhanced through guided interpretation and interactive engagement. The frequency of guided tours is recommended at 3–6 sessions per month to ensure continuity of educational services while maintaining manageable operational costs.
Within the nature education activities dimension, focus is placed on systematic programming and participatory experience. Both activity diversity and depth of interaction are considered essential. Collaboration with social education organizations is encouraged to co-develop structured nature education curricula. The number of educational activities should range from 10 to 20 per month to provide stable educational opportunities and improve learning continuity.
In the nature education media dimension, dissemination indicators highlight the integration of online and offline communication channels. Digital platforms such as online interpretation modules and mobile guide systems should be used to expand outreach and enhance educational accessibility. Multimedia interpretation, social media promotion, and interactive digital tools are recommended to strengthen public engagement and improve educational communication efficiency.
The results of this study not only reveal significant associations between landscape characteristics of natural education spaces and visitor perceptions but also further validate the applicability and explanatory power of the proposed four-dimensional analytical framework—comprising resource foundation, interpretation systems, nature education activities, and nature education media—in accounting for differences in visitor perception. Consistent with established theories on environmental education and nature experiences, the quantitative regression results indicate that the richness and accessibility of natural elements enhance the direct influence of the resource foundation dimension on visitors’ perceptions of natural education. The completeness and comprehensibility of the interpretation system closely align with environmental cognition pathways, confirming its critical role in facilitating visitors’ information processing and meaning-making. Meanwhile, the number and diversity of nature education activities promote experiential learning by fostering engagement and immersion, and the visibility and dissemination strength of natural education media reinforce contextual cues, thereby influencing perception intensity.
From an ecological psychology perspective, the influence of natural education spaces on visitor perception is not solely derived from landscape characteristics themselves but also operates through deeper cognitive–affective mechanisms. According to the Biophilia Hypothesis, natural elements can evoke emotional resonance, enhance learning motivation, and foster environmental identity. Consequently, natural education spaces characterized by high habitat heterogeneity, landscape readability, and information accessibility are more likely to support immersive experiences and a sense of connection to nature. Importantly, the four spatial dimensions do not function independently; rather, they constitute a multidimensional, synergistic mechanism, forming the key pathways through which perceptions of natural education are established in urban parks.
These findings carry important implications for urban ecological design and environmental education policy. At the spatial planning level, the development of natural education systems should extend beyond optimizing individual elements and instead focus on the integrated synergy of multiple dimensions. By enhancing the guiding function of interpretation systems, improving habitat quality, structuring activity programs, and expanding media reach, planners can create spatial configurations that effectively promote nature cognition and experiential learning. At the policy level, the study demonstrates that the effectiveness of natural education relies heavily on the coupled interactions among landscape foundations, interpretive services, and operational management, providing a scientific basis for municipal authorities to standardize facilities, optimize management mechanisms, and strengthen long-term evaluation. Moreover, the indicator system proposed herein offers a practical framework for mega-cities to achieve coordinated improvements in ecological protection, environmental education, and public well-being within limited spatial contexts.
It should be noted that, although this study did not incorporate socio-demographic variables or urban–rural gradients, the theoretical mechanisms and spatial insights identified provide clear directions for future research. Subsequent studies could validate the model across broader geographic regions, more diverse populations, and additional park types, further elucidating the differential mechanisms through which natural education influences various urban groups.
5. Conclusions
5.1. Research Conclusions
This study investigated 14 country parks, urban parks, and forest parks in Beijing, selecting six representative parks for questionnaire-based analysis. A research framework was established to examine the relationship between the spatial landscape characteristics of nature education spaces and visitor perceptions. By analyzing four dimensions—resource foundation, interpretation systems, nature education activities, and nature education media—this study revealed the mechanisms through which spatial characteristics shape visitor perceptions of nature education.
The findings demonstrate a strong association between multiple landscape elements and visitor perceptions. Building coverage, plant species density, seating density, interpretation sign density, number of artificial interpretations, number and type of activities, venue promotion, and product promotion were all positively correlated with visitor perceptions. In contrast, a high proportion of structures/furniture coverage negatively affected perception. These results highlight that effective nature education space design should emphasize ecological authenticity, structural coherence, and interpretive support, while avoiding excessive artificialization. Moreover, nature education was found not only to enhance educational experiences directly but also to indirectly influence visitor psychology by strengthening environmental attitudes and place attachment. These psychological pathways enhance overall satisfaction and validate the role of nature education spaces in promoting ecological awareness, emotional resonance with nature, and environmental value recognition.
5.2. Optimization Pathways and Policy Implications for Nature Education Spaces in Country Parks
The findings of this study not only deepen the understanding of the relationship between landscape characteristics of nature education spaces and visitor perceptions but also provide practical and feasible guidance for park system development and renewal in the context of megacities. Nature education, by its essence, serves as a crucial medium for coordinating the relationship between humans and nature. It can enhance residents’ environmental perception, psychological well-being, environmental identity, and subjective happiness, making it a key strategic direction for promoting high-quality green space development in urban areas.
Amid the rapid evolution of urban construction, park systems serve not only as vital spaces for ecological regulation and recreational activities, but also as essential platforms for advancing the construction of garden cities and achieving ecological civilization goals. The study suggests that effective integration of nature education should focus on the synergistic optimization of resource foundations, interpretive systems, activity programs, and dissemination media. This approach can establish a nature education provision structure that is targeted at diverse user groups, with thematic completeness and temporal balance. Incorporating nature education into park planning and operation—guided by a core strategy emphasizing “resource priority—theme completeness—user diversity—temporal balance”—can enhance both accessibility and impact. In country parks, for example, introducing themed activities such as ecological scientific surveys, green lifestyle experiences, and forest therapy, supported by robust interpretive systems and communication channels, not only improves visitor satisfaction and engagement but also strengthens the social dissemination of ecological value, raising public awareness of environmental responsibility.
At the policy and management level, Beijing and other megacities should integrate nature education into public service frameworks during urban renewal and park system construction. On one hand, a hierarchical and operationally feasible nature education indicator system can be established to suit different park types—including urban parks, country parks, and forest parks—thereby promoting the widespread and balanced provision of nature education functions. On the other hand, deeper integration of nature education with culture, tourism, wellness, and creative industries should be encouraged, forming a composite development model that combines ecological, educational, and operational value to enhance the comprehensive attractiveness and sustainable management of park systems. Simultaneously, nature education holds important cultural significance in strengthening local identity, fostering community cohesion, and improving overall well-being. It should play a cultural empowerment role in urban renewal, serving as a key bridge connecting ecological services with public cultural services.
Within the broader vision of constructing garden cities, Beijing can leverage nature education to explore pathways for culturally empowering green spaces, promoting a deep integration of ecosystem services and public cultural services, and thereby offering a replicable Chinese model for global megacities.
5.3. Research Innovation and Limitations
This study provides a systematic review of the evolution of urban park functions and nature education research, both domestically and internationally. It establishes a comprehensive analytical framework linking the spatial landscape characteristics of natural education spaces with visitor perceptions. Building on this foundation, the study proposes an indicator system and operational mechanism for assessing visitor perceptions in natural education contexts. Unlike existing studies that often focus on a single park type or primarily examine nature education from pedagogical or ecological perspectives, this research addresses the synergistic interactions among ecological functions, educational objectives, and operational demands in parks within megacity contexts. It emphasizes the role of nature education as a critical bridge connecting ecological conservation and social services during the transition toward multifunctional urban parks.
Theoretically, this study is the first to integrate “natural education spatial landscape characteristics—visitor perceptions—park functional positioning” within a unified analytical framework. It demonstrates how different spatial structures and service provision models shape the realization of natural education functions through visitor perceptions, offering a novel interpretive lens for understanding the institutionalization of nature education within urban green space systems. Methodologically, the study combines questionnaire surveys with image-based semantic segmentation, integrating subjective visitor evaluations with objective quantification of landscape elements. This approach establishes a replicable and scalable methodology for assessing natural education spaces. Practically, the study incorporates suburban parks, urban parks, and forest parks into a unified evaluation framework. By comparing differences in nature education functions across these park types and their effects on visitor perceptions, the research identifies constraints imposed by functional positioning, resource bases, and spatial forms on nature education effectiveness, providing guidance for coordinating ecological services, public education, and operational sustainability within the spatial limitations of future megacity parks.
This study has several limitations. First, although the landscape transects are representative, they cannot fully capture the overall spatial characteristics of the parks. The questionnaire survey was conducted between October and November, potentially introducing seasonal bias due to reduced vegetation and lower activity levels. Second, the study area is primarily located within Beijing’s central urban districts, where unique regional policies and spatial patterns may limit the generalizability of the findings. Third, the image semantic segmentation relied on the PSPNet model and ADE20K dataset; however, the current classification system lacks sufficient granularity to identify fine-scale ecological features within nature education contexts. Future work should incorporate manual verification or employ more specialized datasets to improve accuracy. Fourth, although potential confounding variables—such as gender, age, transportation mode, and visit frequency—were collected, they were not systematically controlled in multivariate analyses, which may reduce the interpretability of the relationships between landscape elements and visitor perceptions. Additionally, the study did not construct hierarchical models for different park types, and greater functional variation in parks from other cities may limit the robustness of cross-type comparisons. Future research could enhance interpretability and generalizability by expanding spatiotemporal samples and employing multilevel models or structural equation modeling.
Future studies should consider larger sample sizes, cross-seasonal sampling, and inclusion of socio-demographic variables in multivariate or hierarchical analyses to improve interpretability and robustness. Furthermore, examining the dynamic relationships between landscape characteristics of natural education spaces and visitors’ long-term behaviors, environmental practices, and mental health could more comprehensively reveal the mechanisms through which nature education contributes to sustainable urban development. As China increasingly emphasizes nature education in parks, research frameworks and design standards informed by visitor perceptions hold substantial theoretical and practical value. Subsequent studies should extend to diverse types of urban green spaces, developing design guidelines applicable across multiple tiers of green infrastructure. Such efforts would advance the scientific, standardized, and systematic development of nature education, ultimately enhancing urban residents’ subjective well-being and overall quality of life.
Author Contributions
Y.D. and L.Z. contributed equally to this work and should be considered first co-authors. Conceptualization, P.H.; methodology, L.Z. and Y.D.; software, Y.D. and L.Z.; validation, L.Z.; investigation, T.F., Y.D., and L.Z.; data curation, T.F., Y.D., and L.Z.; writing—original draft preparation, Y.D.; writing—review and editing, P.H.; visualization, Y.D.; supervision, P.H. All authors have read and agreed to the published version of the manuscript.
Funding
This research was funded by the National Key Research and Development Program of China (2023YFF1304602).
Institutional Review Board Statement
This study is exempt from ethical review by Beijing Forestry University as it only uses low-interference methods such as anonymous questionnaires, non-participatory observation, and interviews, and does not collect sensitive personal information or involve any physiological/psychological interventions.
Informed Consent Statement
Informed consent was obtained from all subjects involved in the study.
Data Availability Statement
The data presented in this study are available on request from the first author and the corresponding author.
Acknowledgments
The authors would like to express their sincere appreciation to the undergraduate field practice team from Beijing Forestry University for their invaluable assistance. Their dedicated support in organizing the field investigations and collecting empirical data was essential to the successful completion of this study. The authors also extend their appreciation to China Urban Construction Design & Research Institute Co. for providing foundational site data and technical support. Finally, we express our gratitude to all survey participants and collaborators who contributed to this work.
Conflicts of Interest
Tiantian Fu is employed by China Urban Construction Design & Research Institute Co., Ltd. The other authors declare no conflicts of interest. The funders had no role in the design of the study; in the collection, analyses, or interpretation of data; in the writing of the manuscript; or in the decision to publish the results.
Appendix A. Distribution of Line and Points Transects
Appendix A presents the distribution of survey transects and sample points used in this study. The selection of transects followed the principles outlined below. First, existing nature education routes in each park—such as “flower-viewing routes” and “nature exploration trails”—were referenced as representative visiting paths. Second, information related to nature education courses and activities published on official park websites and WeChat public accounts was reviewed to identify key landscape nodes, recreational spaces, and interpretation systems. These key locations were incorporated as much as possible into the transect layout. Third, the overall characteristics and spatial scale of each park were taken into account to ensure that the transect lengths captured visitors’ overall perception of nature education resources within the parks. Prior to finalizing the transects, a preliminary field investigation was conducted to gain a comprehensive understanding of each park. Based on these findings, transect layouts were refined to ensure accuracy and representativeness. In total, multiple survey transects and sample points were established across 14 parks. Their spatial distribution is shown in Figure A1.


Figure A1.
Spatial distribution of transects and sampling points across 14 parks. (a) Nanhaizi Park; (b) Beijing Wenyuhe Park; (c) Eastern Suburb Forest Park; (d) Yongding River Leisure Forest Park; (e) Beiwu Park; (f) Jiang Fu Park; (g) China National Botanical Garden (North); (h) Yuyuantan Park; (i) Longtan Zhonghu Park; (j) Beihai Park; (k) Olympic Forest Park; (l) Baiwang Mountain Forest Park; (m) Western Hills National Forest Park; (n) The North Palace National Forest Park.
Appendix B. Raw Questionnaire Sample Data and Sample Characteristics Across Park Types
A total of 931 questionnaires were collected, of which 820 were deemed valid, yielding an effective response rate of 89.8%. Statistical analysis of the sample characteristics revealed no significant differences in gender distribution across park types, indicating a generally balanced pattern. This demonstrates that the sample’s gender composition is reasonable and representative, providing a reliable foundation for subsequent analyses. Detailed distribution information is presented in Table A1.
Examination of sample characteristics indicates no pronounced gender disparities among respondents across park types, further supporting the balanced and representative nature of the sample allocation.
Age distribution varied among park types, with young and middle-aged adults constituting the primary visitor demographic across all categories. Specifically, visitors to country parks and forest parks were predominantly aged 36–45, whereas urban parks were mainly frequented by young adults aged 19–25. Although respondents under 18 represented a relatively small proportion of the survey sample, this does not fully reflect the actual presence of children and adolescents in the parks. Field observations indicated that it is common for young and middle-aged adults (26–40 years) to visit parks accompanied by children or adolescents.
Regarding educational attainment, approximately half of all respondents held a bachelor’s degree, a proportion that remained consistent across different park types. Visitors with other educational backgrounds exhibited a more heterogeneous distribution. Occupationally, respondents were relatively evenly distributed across professions, although full-time homemakers were more prevalent in country parks, while students were the dominant group in urban and forest parks.
Modes of transportation to the parks differed by park type: private vehicles were the primary mode for country parks (65.44%), whereas public transportation was more commonly used for urban parks (34.29%) and forest parks (47.41%). Travel times to reach the parks were predominantly 15–30 min or 30–60 min across all three park types. In terms of visitation frequency for nature education or experiential activities, visitors attending country parks, urban parks, and forest parks 1–2 times per month or more than twice per month accounted for 41.17%, 42.50%, and 40.37%, respectively, indicating a high rate of repeat visits. Notably, the visitation frequency for country parks remained robust despite their location, reflecting visitors’ strong preference for and reliance on these parks.
It should be noted that the natural experience frequency and corresponding scores presented in Appendix B serve solely as descriptive statistics to characterize the sample. Their purpose is to illustrate the basic background of the visitor population rather than to inform model construction or infer research conclusions; therefore, no further significance testing was conducted.
Table A1.
Raw data from questionnaire responses.
Table A1.
Raw data from questionnaire responses.
| Attribute | Characteristic | Frequency Proportion of Each Park Type/% | ||
|---|---|---|---|---|
| Country Park | Urban Park | Forest Park | ||
| Gender | Male | 41.54 | 37.86 | 33.33 |
| Female | 58.46 | 62.14 | 66.67 | |
| Age | ≤18 | 1.47 | 6.07 | 1.85 |
| 19–25 | 13.60 | 25.71 | 24.07 | |
| 26–35 | 26.84 | 17.14 | 21.11 | |
| 36–45 | 30.15 | 17.86 | 28.15 | |
| 46–60 | 14.71 | 16.07 | 14.07 | |
| ≥61 | 13.24 | 16.79 | 10.74 | |
| Education level | Junior high school or below | 2.21 | 10.71 | 1.48 |
| High school/ Secondary vocational school | 10.66 | 18.21 | 7.78 | |
| Junior college | 9.56 | 12.14 | 11.11 | |
| Bachelor | 59.19 | 43.93 | 58.52 | |
| Master’s or above | 18.38 | 14.64 | 21.11 | |
| Occupation | Student | 13.60 | 31.79 | 27.04 |
| Enterprise employee/ Private business owner | 13.60 | 6.79 | 9.63 | |
| Full-time homemaker | 36.40 | 9.64 | 23.70 | |
| Worker/Farmer/Migrant worker | 11.03 | 11.07 | 11.48 | |
| Government or enterprise official/ Civil servant | 2.57 | 10.00 | 1.48 | |
| Teacher/ Professional and technical personnel | 17.65 | 20.71 | 17.78 | |
| Retired personnel | 0.37 | 2.86 | 1.85 | |
| Other | 4.78 | 6.79 | 7.04 | |
| Mode of transportation to the park | Walking | 3.31 | 27.14 | 7.41 |
| Bicycle | 3.31 | 6.07 | 6.30 | |
| Electric bike | 1.47 | 7.86 | 5.19 | |
| Taxi | 6.62 | 11.07 | 11.11 | |
| Public transportation | 19.85 | 34.29 | 47.41 | |
| Private car | 65.44 | 13.21 | 22.59 | |
| Travel time to the park | <15 min | 4.41 | 13.21 | 10.37 |
| 15–30 min | 28.31 | 32.50 | 32.96 | |
| 30–60 min | 42.65 | 34.29 | 35.93 | |
| 1–2 h | 22.79 | 17.86 | 20.00 | |
| >2 h | 1.84 | 1.79 | 0.74 | |
| Visit motivation | Learning about nature or professional skills | 4.04 | 10.36 | 3.70 |
| Bringing children to themed activities or exhibitions Bringing children to the plant/ animal recognition and play | 47.43 | 25.71 | 38.15 | |
| Enjoying scenery and nature/ Fitness and wellness | 41.18 | 56.43 | 56.30 | |
| Company-organized or team-building activities | 7.35 | 7.14 | 1.85 | |
| Frequency of participating in nature education or nature experiences | 1–2 times per year | 28.68 | 21.07 | 31.11 |
| 1–2 times per half-year | 22.79 | 28.57 | 27.04 | |
| 1–2 times per month | 30.51 | 24.64 | 27.78 | |
| 1–2 times per week | 10.66 | 17.86 | 12.59 | |
| Other | 7.35 | 7.50 | 1.48 | |
Appendix C. Descriptive Statistics of Perception Factors
To gain an in-depth understanding of visitors’ perceptions and evaluations of nature education factors in different types of parks, descriptive statistical analysis was conducted based on the four dimensions and sixteen secondary indicators defined in the nature education spatial landscape characteristic indicator system. The analysis focused on visitors’ level of agreement with each perception factor across different park types, with particular attention to the proportion of positive responses reflected in the “strongly agree” and “agree” categories. The relevant results are presented in Figure A2, Figure A3, Figure A4 and Figure A5.

Figure A2.
Descriptive statistics of resource-based dimensions for different types of parks.

Figure A3.
Descriptive statistics of the dimensions of the interpretation system in different types of parks.

Figure A4.
Descriptive statistics of the dimensions of nature education activities in different types of parks.

Figure A5.
Descriptive statistics of the dimensions of nature education media in different types of parks.
Appendix D. Differences in Visitor Perception of Nature Education Across Socio-Demographic Groups
To examine whether visitor perceptions of nature education differ among groups with different socio-demographic characteristics, one-way analysis of variance (ANOVA) was conducted based on the questionnaire data.
The detailed results are shown in Table A2.
Table A2.
One-way ANOVA of evaluation scores of nature education tourists’ perception for different socio-demographic characteristics.
Table A2.
One-way ANOVA of evaluation scores of nature education tourists’ perception for different socio-demographic characteristics.
| Attribute | Characteristic | Overall Evaluation | Resource Foundation | Interpretation Systems | Nature Education Activities | Nature Education Media | |||||
|---|---|---|---|---|---|---|---|---|---|---|---|
| Average | Significance | Average | Significance | Average | Significance | Average | Significance | Average | Significance | ||
| Gender | Male | 3.554 | >0.05 | 3.548 | >0.05 | 3.253 | >0.05 | 3.608 | >0.05 | 3.208 | >0.05 |
| Female | 3.544 | 3.899 | 3.225 | 3.602 | 3.194 | ||||||
| Age | ≤18 | 3.613 | <0.05 | 3.974 | >0.05 | 3.298 | <0.05 | 3.641 | <0.05 | 3.282 | <0.05 |
| 19–25 | 3.677 | 3.876 | 3.484 | 3.751 | 3.460 | ||||||
| 26–35 | 3.502 | 3.893 | 3.192 | 3.521 | 3.116 | ||||||
| 36–45 | 3.484 | 3.878 | 3.123 | 3.598 | 3.063 | ||||||
| 46–60 | 3.537 | 3.904 | 3.191 | 3.585 | 3.217 | ||||||
| ≥61 | 3.536 | 3.982 | 3.163 | 3.533 | 3.143 | ||||||
| Education level | Junior high school or below | 3.759 | >0.05 | 4.096 | <0.05 | 3.444 | >0.05 | 3.850 | >0.05 | 3.417 | >0.05 |
| High school/ Secondary vocational school | 3.571 | 3.979 | 3.233 | 3.581 | 3.198 | ||||||
| Junior college | 3.518 | 3.848 | 3.231 | 3.615 | 3.144 | ||||||
| Bachelor | 3.521 | 3.865 | 3.218 | 3.579 | 3.177 | ||||||
| Master’s or above | 3.574 | 3.941 | 3.236 | 3.622 | 3.241 | ||||||
| Occupation | Student | 3.652 | >0.05 | 3.884 | >0.05 | 3.451 | <0.05 | 3.682 | >0.05 | 3.425 | <0.05 |
| Enterprise employee/ Private business owner | 3.568 | 3.925 | 3.149 | 3.695 | 3.285 | ||||||
| Full-time homemaker | 3.454 | 3.895 | 3.075 | 3.518 | 3.012 | ||||||
| Worker/Farmer/Migrant worker | 3.515 | 3.870 | 3.217 | 3.547 | 3.170 | ||||||
| Government or enterprise official/ Civil servant | 3.498 | 3.765 | 3.269 | 3.547 | 3.222 | ||||||
| Teacher/ Professional and technical personnel | 3.547 | 3.966 | 3.192 | 3.554 | 3.175 | ||||||
| Retired personnel | 3.540 | 3.964 | 3.161 | 3.619 | 3.119 | ||||||
| Other | 3.564 | 3.918 | 3.294 | 3.771 | 3.007 | ||||||
| Mode of transportation to the park | Walking | 3.690 | <0.05 | 4.027 | <0.05 | 3.421 | <0.05 | 3.727 | <0.05 | 3.337 | <0.05 |
| Bicycle | 3.676 | 3.977 | 3.419 | 3.597 | 3.496 | ||||||
| Electric bike | 3.863 | 4.163 | 3.638 | 3.992 | 3.433 | ||||||
| Taxi | 3.483 | 3.833 | 3.142 | 3.565 | 3.152 | ||||||
| Public transportation | 3.544 | 3.877 | 3.254 | 3.612 | 3.197 | ||||||
| Private car | 3.451 | 3.850 | 3.086 | 3.506 | 3.083 | ||||||
| Travel time to the park | <15 min | 3.658 | >0.05 | 4.065 | <0.05 | 3.347 | >0.05 | 3.602 | >0.05 | 3.316 | >0.05 |
| 15–30 min | 3.566 | 3.909 | 3.249 | 3.665 | 3.204 | ||||||
| 30–60 min | 3.505 | 3.871 | 3.182 | 3.551 | 3.161 | ||||||
| 1–2 h | 3.568 | 3.906 | 3.277 | 3.616 | 3.233 | ||||||
| >2 h | 3.260 | 3.472 | 3.042 | 3.500 | 2.889 | ||||||
| Visit motivation | Learning about nature or professional skills | 3.890 | <0.05 | 4.043 | <0.05 | 3.865 | <0.05 | 3.913 | <0.05 | 3.593 | <0.05 |
| Bringing children to themed activities or exhibitions Bringing children to the plant/animal recognition and play | 3.444 | 3.851 | 3.085 | 3.563 | 2.993 | ||||||
| Enjoying scenery and nature/Fitness and wellness | 3.547 | 3.907 | 3.217 | 3.565 | 3.251 | ||||||
| Company-organized or team-building activities | 3.872 | 4.048 | 3.733 | 3.911 | 3.667 | ||||||
| Frequency of participating in nature education or nature experiences | 1–2 times per year | 3.471 | >0.05 | 3.864 | >0.05 | 3.121 | >0.05 | 3.555 | >0.05 | 3.068 | <0.05 |
| 1–2 times per half-year | 3.590 | 3.936 | 3.281 | 3.676 | 3.225 | ||||||
| 1–2 times per month | 3.555 | 3.876 | 3.261 | 3.633 | 3.229 | ||||||
| 1–2 times per week | 3.551 | 3.940 | 3.252 | 3.513 | 3.212 | ||||||
| Other | 3.675 | 3.963 | 3.411 | 3.585 | 3.541 | ||||||
References
- Larson, L.R.; Szczytko, R.; Bowers, E.P.; Stephens, L.E.; Stevenson, K.T.; Floyd, M.F. Outdoor Time, Screen Time, and Connection to Nature: Troubling Trends Among Rural Youth? Environ. Behav. 2018, 51, 966–991. [Google Scholar] [CrossRef]
- Bashan, D.; Colléony, A.; Shwartz, A. Urban versus Rural? The Effects of Residential Status on Species Identification Skills and Connection to Nature. People Nat. 2021, 3, 347–358. [Google Scholar] [CrossRef]
- Li, F.; Liu, H.; Huisingh, D.; Wang, Y.; Wang, R. Shifting to Healthier Cities with Improved Urban Ecological Infrastructure: From the Perspectives of Planning, Implementation, Governance and Engineering. J. Clean. Prod. 2017, 163, S1–S11. [Google Scholar] [CrossRef]
- Liu, Y.; Kwan, M.-P.; Wong, M.S.; Yu, C. Current Methods for Evaluating People’s Exposure to Green Space: A Scoping Review. Soc. Sci. Med. 2023, 338, 116303. [Google Scholar] [CrossRef]
- Luo, Q.; Rong, J.; Zhou, J.; Ma, J. Assessing Social Values of Ecosystem Services and Exploring theInfluencing Factors for Urban Green Spaces from the Perspectiveof Tourist Perceptions. Chin. Landsc. Archit. 2024, 40, 50–56. [Google Scholar] [CrossRef]
- Uzun, F.V.; Keles, O. The Effects of Nature Education Project on the Environmental Awareness and Behavior. Procedia Soc. Behav. Sci. 2012, 46, 2912–2916. [Google Scholar] [CrossRef]
- Schaefer, L.; Plotnikoff, R.C.; Majumdar, S.R.; Mollard, R.; Woo, M.; Sadman, R.; Rinaldi, R.L.; Boulé, N.; Torrance, B.; Ball, G.D.C.; et al. Outdoor Time Is Associated with Physical Activity, Sedentary Time, and Cardiorespiratory Fitness in Youth. J. Pediatr. 2014, 165, 516–521. [Google Scholar] [CrossRef]
- Li, X.; Yu, Y. Practical Research on Natural Education at Home and Abroad. For. Econ. 2017, 39, 12–18+23. [Google Scholar] [CrossRef]
- Zheng, Y.; Xu, X. Clarifying and Comparing the Concept of Nature Education. Educ. Mod. 2019, 6, 65–67. [Google Scholar] [CrossRef]
- Hu, R.; Mou, S. Outdoor Education for Sustainable Development: A Systematic Literature Review. Sustainability 2025, 17, 3338. [Google Scholar] [CrossRef]
- Liu, T. The Main Ideas of Nature Education and Reconstruction of Educational Possibilities. Forum Contemp. Educ. 2012, 1, 1–11. [Google Scholar] [CrossRef]
- Shen, Y.; Tan, Q.; Sun, Z. Theoretical Exploration and Practical Pathways for the Systematic Construction of Children’s Nature Education Spaces: A Case Study of Changsha. Chin. Landsc. Archit. 2025, 41, 15–22. [Google Scholar] [CrossRef]
- Lin, K.; Yong, Y. Natural Education: Origin, Concept and Practice. World For. Res. 2022, 35, 8–14. [Google Scholar] [CrossRef]
- Zhang, H.; Huang, Z.; Fang, Y.; Tu, W.; Wang, K. Tourist environmental education in wetland reserves: A case study of the Red-crowned cranes and David’s deer National Reserves in Yancheng, China. Acta Ecol. Sin. 2015, 35, 7899–7911. [Google Scholar]
- He, X.; Li, C.; Xu, J. The features of tourists perception of popular science education in Mount Longhu global Geopark. J. Arid. Land Resour. Environ. 2018, 32, 202–208. [Google Scholar] [CrossRef]
- Mallette, A.; Heaney, S.; McGlynn, B.; Stuart, S.; Witkowski, S.; Plummer, R. Outdoor Education, Environmental Perceptions, and Sustainability: Exploring Relationships and Opportunities. J. Outdoor Environ. Educ. 2025, 28, 177–192. [Google Scholar] [CrossRef]
- Li, W. A Case Study on the Effect Evaluation of Ecotourism Environmental Education. Tour. Trib. 2012, 27, 80–87. [Google Scholar]
- Mo, J.; Yin, C.; Luo, C.; Wang, X.; Li, W. The Influence of Place Attachment on Eco-Friendly Behavior Among Visitors to Mingyue Mountain Chan Buddhism Cultural Tourism Site: Mediated by Pre-trip Expertise and Perceived Environmental Education. Tour. Overv. 2019, 4, 53–56. [Google Scholar]
- Li, X.; Yu, R.; Luo, C.; Wang, G. Research on the Construction of National Park Natural Education System fromthe Perspective of Tourists’ Perception. For. Econ. 2020, 42, 36–43. [Google Scholar] [CrossRef]
- Wang, B.; Xiu, X.; Lan, S. Natural Education Development in Fuzhou National Forest Park based on Tourists’ Perception. For. Inventory Plan. 2016, 41, 53–57. [Google Scholar]
- Hutcheson, W.; Hoagland, P.; Jin, D. Valuing Environmental Education as a Cultural Ecosystem Service at Hudson River Park. Ecosyst. Serv. 2018, 31, 387–394. [Google Scholar] [CrossRef]
- Sun, J.; Zheng, Y.; Shi, J. Conserving the Landscape Connectivity of Natural Forest Reserves in Tourism Development. Prof. Geogr. 2021, 73, 573–578. [Google Scholar] [CrossRef]
- Ridayani; Saputra, N.; Siagian, N.; Owon, R.A.S.; Rawadhy, I. The Correlation of Environmental Education, Environmental Knowledge, Environmental Involvement, and Waste Management Behavior. IOP Conf. Ser. Earth Environ. Sci. 2022, 1105, 012008. [Google Scholar] [CrossRef]
- Ministry of Education of the People’s Republic of China Opinion of the Ministry of Education and 10 Other Departments on Promoting Study-Travel Programs for Primary and Secondary School Students. 2016. Available online: http://www.moe.gov.cn/srcsite/A06/s3325/201612/t20161219_292354.html (accessed on 27 August 2025).
- National Forestry and Grassland Administration Notice of the National Forestry and Grassland Administration on Fully Leveraging the Social Functions of Various Nature Reserves and Vigorously Promoting Nature Education. 2019. Available online: https://www.csf.org.cn/zhListDetail.html?id=127&contentId=47928 (accessed on 27 August 2025).
- Zhang, Y.; Huang, Y.; Cao, P.; Zhou, C. Current Situation and Development Countermeasures of Nature Education in China. For. Inventory Plan. 2021, 46, 158–162. [Google Scholar]
- Liu, Y. Research on Tourist Perception in Environmental EducationSystem of Tourism SiteTaken Kanus Resort, Xinjiang as Example. Master’s Thesis, Xinjiang Agricultural University, Urumqi, China, 2014. [Google Scholar]
- Shi, S.; Ling, L.; Le, Y. The Experience and Enlightenment of Hong Kong Country Parks Planning and Construction. Shanghai Urban Plan. Rev. 2013, 5, 62–68. [Google Scholar]
- Chen, M. Study on Construction and Development of Country Park in Beijing. Master’s Thesis, Beijing Forestry University, Beijing, China, 2008. [Google Scholar]
- Lambert, D. The History of the Country Park, 1966–2005: Towards a Renaissance? Landsc. Res. 2006, 31, 43–62. [Google Scholar] [CrossRef]
- Cai, C. Research on the Spatial and Evolution Mechanism of Beijing City Park Based on GIS. Master’s Thesis, Beijing Forestry University, Beijing, China, 2021. [Google Scholar]
- Beijing Forestry and Greening Propaganda Center. Beijing Nature Education White Book; Beijing Forestry and Greening Propaganda Center: Beijing, China, 2025; p. 262. [Google Scholar]
- Zhu, M.; Han, H.; Liu, J.; Yu, X. Research on the Management and Operation System of Beijing Country Parks from Park Managers’ Perspectives. Chin. Landsc. Archit. 2019, 35, 123–127. [Google Scholar]
- Chen, J. Experience the Beauty of Nature: Over 200 Locations Hosting Nature Education Activities. 2022. Available online: https://www.bj.chinanews.com.cn/news/2022/0904/87785.html (accessed on 19 September 2025).
- Ma, H. Supply and Demand Analysis and Development Policy of Natural Education in Beijing. J. For. Grassl. Policy 2021, 1, 63–69. [Google Scholar]
- Chuang, I.-T.; Benita, F.; Tunçer, B. Effects of Urban Park Spatial Characteristics on Visitor Density and Diversity: A Geolocated Social Media Approach. Landsc. Urban Plan. 2022, 226, 104514. [Google Scholar] [CrossRef]
- Felappi, J.F.; Sommer, J.H.; Falkenberg, T.; Terlau, W.; Kötter, T. Urban Park Qualities Driving Visitors Mental Well-Being and Wildlife Conservation in a Neotropical Megacity. Sci. Rep. 2024, 14, 4856. [Google Scholar] [CrossRef]
- Ren, W.; Zhan, K.; Chen, Z.; Hong, X.-C. Research on Landscape Perception of Urban Parks Based on User-Generated Data. Buildings 2024, 14, 2776. [Google Scholar] [CrossRef]
- Soga, M.; Gaston, K.J.; Koyanagi, T.F.; Kurisu, K.; Hanaki, K. Urban Residents’ Perceptions of Neighbourhood Nature: Does the Extinction of Experience Matter? Biol. Conserv. 2016, 203, 143–150. [Google Scholar] [CrossRef]
- Meyer-Grandbastien, A.; Burel, F.; Hellier, E.; Bergerot, B. A Step towards Understanding the Relationship between Species Diversity and Psychological Restoration of Visitors in Urban Green Spaces Using Landscape Heterogeneity. Landsc. Urban Plan. 2020, 195, 103728. [Google Scholar] [CrossRef]
- Han, Y.; Zhao, J.; Zhou, Y.; Zhang, Y. Construction of National Park Trail in New Zealand and Its Implications. World For. Res. 2024, 37, 124–130. [Google Scholar] [CrossRef]
- Frick, J.; Kaiser, F.G.; Wilson, M. Environmental Knowledge and Conservation Behavior: Exploring Prevalence and Structure in a Representative Sample. Personal. Individ. Differ. 2004, 37, 1597–1613. [Google Scholar] [CrossRef]
- Tal, G.; Dishon, G.; Vedder-Weiss, D. ‘I Know How to Say It, but I Still Don’t Know It in My Hands’: Examining Practices and Epistemology in Forest Education. Environ. Educ. Res. 2023, 29, 1502–1514. [Google Scholar] [CrossRef]
- Amici, A.A.; Nadkarni, N.M.; Lackey, N.Q.; Bricker, K.S. Conservation, Education, and Adventure Tourism: A Case Study of Adventure Parks as Potential Venues for Communication in Monteverde, Costa Rica. J. Ecotourism 2022, 21, 230–245. [Google Scholar] [CrossRef]
- Telbisz, T.; Imecs, Z.; Máthé, A.; Mari, L. Empirical Investigation of the Motivation and Perception of Tourists Visiting the Apuseni Nature Park (Romania) and the Relationship of Tourism and Natural Resources. Sustainability 2023, 15, 4181. [Google Scholar] [CrossRef]
- Huang, Y.; Shi, R.; Zhou, J.; Chen, Z.; Liang, P. How Urban Residents Perceive Nature Education: A Survey from Eight Metropolises in China. Sustainability 2022, 14, 7820. [Google Scholar] [CrossRef]
- Wu, X.; Jia, W.; Wu, T. Mechanism by Which Environmental Education Influences Pro-Environmental Behavior in Wuyishan National Park, China. Sustainability 2024, 17, 43. [Google Scholar] [CrossRef]
- Podsakoff, P.M.; MacKenzie, S.B.; Lee, J.-Y.; Podsakoff, N.P. Common Method Biases in Behavioral Research: A Critical Review of the Literature and Recommended Remedies. J. Appl. Psychol. 2003, 88, 879–903. [Google Scholar] [CrossRef]
- Ham, S. Interpretation: Making a Difference on Purpose; Fulcrum Publishing: Golden, CO, USA, 2014; ISBN 978-1-55591-742-5. [Google Scholar]
- Kline, R.B. Principles and Practice of Structural Equation Modeling; The Guilford Press: New York, NY, USA, 2015. [Google Scholar]
- Zhou, B.; Zhao, H.; Puig, X.; Xiao, T.; Fidler, S.; Barriuso, A.; Torralba, A. Semantic Understanding of Scenes Through the ADE20K Dataset. Int. J. Comput. Vis. 2019, 127, 302–321. [Google Scholar] [CrossRef]
- Zhao, H.; Shi, J.; Qi, X.; Wang, X.; Jia, J. Pyramid Scene Parsing Network. In Proceedings of the 2017 IEEE Conference on Computer Vision and Pattern Recognition (CVPR), Honolulu, HI, USA, 21–26 July 2017; pp. 6230–6239. [Google Scholar]
- Sun, Y.; Wang, X.; Zhu, J.; Chen, L.; Jia, Y.; Lawrence, J.M.; Jiang, L.; Xie, X.; Wu, J. Using Machine Learning to Examine Street Green Space Types at a High Spatial Resolution: Application in Los Angeles County on Socioeconomic Disparities in Exposure. Sci. Total Environ. 2021, 787, 147653. [Google Scholar] [CrossRef]
- Lu, Y.; Ferranti, E.J.S.; Chapman, L.; Pfrang, C. Assessing Urban Greenery by Harvesting Street View Data: A Review. Urban For. Urban Green. 2023, 83, 127917. [Google Scholar] [CrossRef]
- Verma, D.; Jana, A.; Ramamritham, K. Quantifying Urban Surroundings Using Deep Learning Techniques: A New Proposal. Urban Sci. 2018, 2, 78. [Google Scholar] [CrossRef]
- Draper, N.R.; Smith, H. Applied Regression Analysis; Wiley: Hoboken, NJ, USA, 1998. [Google Scholar]
Disclaimer/Publisher’s Note: The statements, opinions and data contained in all publications are solely those of the individual author(s) and contributor(s) and not of MDPI and/or the editor(s). MDPI and/or the editor(s) disclaim responsibility for any injury to people or property resulting from any ideas, methods, instructions or products referred to in the content. |
© 2025 by the authors. Licensee MDPI, Basel, Switzerland. This article is an open access article distributed under the terms and conditions of the Creative Commons Attribution (CC BY) license.