Abstract
As a multi-ethnic border region of China, Xinjiang hosts revolutionary cultural tourism resources (RCTRs) that embody historical memory and the spirit of frontier reclamation, while also playing a strategic role in strengthening national identity and maintaining regional stability. Yet, their spatial distribution is highly uneven due to geographical, historical, and socio-economic constraints. This study analyzes 135 representative sites using a dual framework of spatial pattern analysis and driving mechanism quantification. Nearest neighbor index, imbalance index, Lorenz curve, geographic concentration index, kernel density estimation, and hotspot analysis results reveal a clustered “multi-core–peripheral attenuation” pattern with pronounced regional disparities. GIS-based overlay analysis identifies natural thresholds of moderate elevation (834–2865 m) and gentle slopes (0–8.65°), while socio-economic factors such as transportation corridors and population density amplify clustering effects. Geographic Detector results confirm road network density (q = 0.85, p < 0.01) and historical site density (q = 0.79, p < 0.01) as dominant drivers, with interactions between natural and social factors enhancing explanatory power above 0.90. These findings highlight the coupled influence of topographic suitability and socio-economic accessibility. Policy recommendations include optimizing road network layouts, adopting tiered heritage protection, and fostering cross-regional cooperation. The study provides scientific evidence for balanced development and sustainable conservation of RCTRs, contributing to the achievement of sustainable development goals (SDGs) related to cultural heritage, regional equity, and inclusive growth.
1. Introduction
Revolutionary cultural tourism resources (RCTRs), as vital carriers of revolutionary history and the transmission of collective memory, have become an important topic within global heritage tourism research [1]. While the term “revolutionary cultural tourism” has no strict equivalent in the international academic context—due to political and cultural differences—there exist mature theoretical frameworks concerning heritage tourism, political tourism, and places of memory [2,3]. For example, Smith demonstrated that the overlap between World War II campaign routes and transportation networks largely determined the density and clustering of heritage sites in Europe [4]. Similarly, Jones proposed a three-dimensional model that integrates cultural identity, educational functions, and economic transformation, highlighting the multiple values of heritage [5]. In China, academic exploration of revolutionary cultural tourism began in the early 2000s and entered a phase of rapid development with the implementation of the 2004–2010 National Revolutionary Cultural Tourism Development Plan [6]. Research has evolved from simple resource surveys and value assessments to more theoretical and refined academic discussions [7,8,9]. Scholars employing Geographic Information System (GIS) technology have revealed that resources in traditional revolutionary bases such as Jinggangshan and Yan’an follow a “core–periphery” structure, shaped by historical events, transportation accessibility, and policy guidance [10]; Calderon-Fajardo [3] showed that RCTRs across China exhibit distinctive spatial patterns characterized by clustered aggregation and axial extension. Lin [11] further used the Geographic Detector model to show that five dimensions—natural environment, social environment, economic environment, tourism development level, and policy context—jointly shape the spatial differentiation of resources in Guizhou Province. Overall, international studies tend to emphasize socio-political and cultural drivers, suggesting that the formation of tourism spaces reflects the interplay of power, memory, and identity [12]. Domestic research, by contrast, often uses a multifactor model where endogenous attributes, economic growth, policy interventions, and social conditions are the main drivers [13,14].
Xinjiang, China’s largest provincial region and a multi-ethnic frontier bordering several countries, holds RCTRs with unique historical and contemporary significance [15]. From the Eighth Route Army’s offices to the legacy of the Xinjiang Production and Construction Corps, and from the Xiaobaiyang Outpost to the Khunjerab Border Company, these resources record both China’s revolutionary history and frontier development [16]. They embody the “Xinjiang Spirit” of patriotism, unity, diligence, mutual support, and openness, playing an irreplaceable role in strengthening national identity and safeguarding territorial stability [17]. As a strategic initiative aligned with Sustainable Development Goals (SDGs), particularly SDG 8 (decent work and economic growth), SDG 10 (reduced inequalities), and SDG 11 (sustainable cities and communities), the development of RCTRs in Xinjiang contributes to regional sustainability through cultural preservation and equitable resource distribution. In recent years, revolutionary cultural tourism has risen to a national cultural initiative, and the development and preservation of Xinjiang’s resources have drawn increasing scholarly and practical attention [18]. However, their spatial distribution remains highly uneven due to geographical constraints, historical legacies, and socio-economic disparities. Systematic regional-scale analyses are still scarce, particularly concerning the coupled mechanisms of natural environments and social conditions. For instance, sites in northern Xinjiang are closely tied to reclamation history and cluster in cities such as Shihezi and Karamay. In contrast, southern Xinjiang’s resources are more dispersed, focusing on frontier governance and ethnic liberation in areas like Kashgar and Hotan. In eastern Xinjiang, Hami retains relics of the West Route Army, reflecting its location along the ancient Silk Road [19,20]. These spatial variations influence the effectiveness of cultural transmission and also constrain integrated tourism development. Nevertheless, previous studies still have notable shortcomings. Most have concentrated on traditional revolutionary bases in central and eastern China, leaving frontier regions such as Xinjiang underexplored [19,21]. In addition, existing work often isolates either natural or socio-economic factors rather than examining their coupled effects. Finally, many analyses remain descriptive, lacking systematic quantification and spatially explicit evidence. Addressing these limitations is essential to advancing both theoretical understanding and practical strategies for RCTR development.
In summary, whether viewed through international heritage studies, domestic revolutionary cultural tourism research, or the limited existing work on Xinjiang, there is a clear need to investigate the spatial differentiation and driving mechanisms of these resources. To address this gap, this study examines 135 sites across Xinjiang using field investigations and GIS-based spatial analyses. Kernel density estimation is employed to reveal clustering patterns, while natural, historical, and socio-economic dimensions are analyzed with the Geographic Detector to identify driving forces. By uncovering the factors shaping the spatial structure of these resources, the study contributes both to cultural geography scholarship and to policy recommendations for balanced development and sustainable conservation.
2. Materials and Methods
2.1. Study Area
The Xinjiang Uygur Autonomous Region is located in northwestern China, at the core of the Eurasian continent (Figure 1) [22]. It borders Gansu and Qinghai provinces to the east and the Tibet Autonomous Region to the south, and shares international boundaries with eight countries—including Kazakhstan and Kyrgyzstan—to the west, and Mongolia to the north [23]. With a land border stretching over 5600 km, Xinjiang is China’s largest provincial-level administrative region, covering an area of 1.6649 million km2 (approximately one-sixth of the national territory) [24]. It is also the province with the longest land boundary and the highest number of neighboring countries. Administratively, Xinjiang consists of 14 prefecture-level divisions (including 4 prefecture-level cities, 5 regions, and 5 autonomous prefectures), along with 10 divisions of the Xinjiang Production and Construction Corps (XPCC), such as the First Division Aral City, the Sixth Division Wujiaqu City, and the Eighth Division Shihezi City [18]. This dual governance structure of “local administrative units + XPCC divisions” not only reflects the historical tradition of frontier governance but also provides a unique institutional and social foundation for the formation and distribution of RCTRs [25].
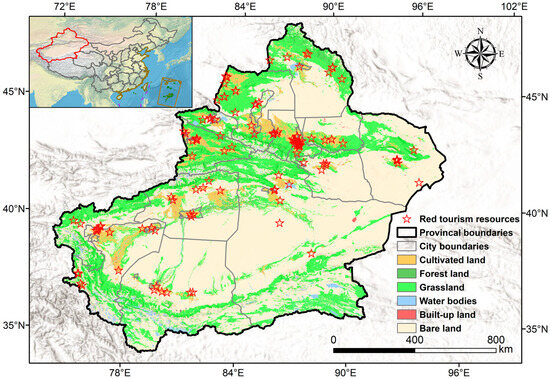
Figure 1.
Geographic location and land use of the study area. All maps have been reviewed and approved under map review number: GS (2024) 0650.
As a key hub of the northern, central, and southern routes of the ancient Silk Road, Xinjiang has long served as a crossroads of Central Plains, Western Regions, Central Asian, and West Asian cultures since Zhang Qian’s envoy missions to the Western Regions during the Han Dynasty [26]. Over time, a multi-ethnic settlement pattern emerged, with Uyghur, Han, Kazakh, Hui, and 55 other ethnic groups coexisting and intermingling [27]. Their long-term interaction has created a cultural system characterized by both frontier distinctiveness and multicultural diversity [28]. This unique geographical position and historical trajectory have endowed Xinjiang with a rich heritage of historical and cultural sites, while also nurturing diverse RCTRs [29]. These resources encompass eight categories, including revolutionary relics, memorial halls, former residences, and symbolic landmarks, which together underpin three relatively mature tourism routes: “Reclamation and Frontier Defense,” “Inheritance of Revolutionary Spirit,” and the “West Route Army in Xinjiang.” These routes comprehensively present the history of revolution, construction, and development in Xinjiang under the leadership of the Communist Party of China [30]. According to evaluations by the Ministry of Culture and Tourism of China and the Xinjiang Department of Culture and Tourism, a three-tier system of protection and development has been established for RCTRs in Xinjiang: (1) eight sites designated as national-level revolutionary cultural tourism classic scenic spots (including those under XPCC administration), (2) 34 sites recognized as regional-level key scenic areas, and (3) 74 prefecture-level projects. Together, these designations enrich both the hierarchical structure and the spatial coverage of RCTRs across Xinjiang.
2.2. Data Sources and Processing
The datasets used in this study include vector maps of Xinjiang, RCTRs, transportation networks, digital elevation models (DEMs), slope data, and population density data [31]. All maps in this paper are based on administrative vector data from the official map of China (Map Review Number: GS [2024] 0650). To ensure consistency and comparability across different spatial datasets, the revolutionary cultural tourism resource points, transportation networks, DEM, slope, and population density data were uniformly projected, clipped, and resampled. The specific procedures are as follows:
- (1)
- Revolutionary cultural tourism resources
A total of 135 representative revolutionary cultural tourism sites in Xinjiang were selected. Their attributes—including names, geographic coordinates, and classification—were obtained from the National revolutionary cultural tourism Development Plan (2016–2020), the Catalogue of National Classic revolutionary cultural tourism Scenic Spots, the 14th Five-Year Plan for Culture and Tourism Development of Xinjiang Uygur Autonomous Region, and the Survey Report on Xinjiang RCTRs (2023). The site information was organized into a shapefile format, uniformly projected to WGS84_UTM_48N (EPSG:32648), and subjected to spatial validation to remove duplicates or anomalous coordinates. The final dataset, Red_Sites.shp, was used for subsequent spatial analysis.
- (2)
- Transportation network data
The transportation dataset included highways and major national/provincial roads within Xinjiang, obtained from OpenStreetMap and the 2023 updated road network layer provided by the Xinjiang Department of Transportation. The original vector data were clipped to the study area boundary and reprojected to WGS84_UTM_48N to match the revolutionary cultural tourism resource dataset. Topology checks were applied to remove overlapping or broken line segments, resulting in the Highway_MainRoad.shp dataset.
- (3)
- DEM and slope data
Topographic data were obtained from the USGS Shuttle Radar Topography Mission (SRTM) at a 30 m resolution. The raw raster tiles were mosaicked in ArcGIS 10.8.1 to cover the entire Xinjiang region, with voids and missing values filled. The data were then clipped to the study boundary. Based on the processed DEM, slope values (in degrees) were calculated using the Spatial Analyst—Slope tool. Both DEM and slope rasters were resampled to 1 km × 1 km resolution using bilinear interpolation to ensure consistency with population density data.
- (4)
- Population density data
Population density data were obtained from the WorldPop 2020 dataset at a 1 km resolution, representing the number of residents per square kilometer. The original GeoTIFF data were reprojected to WGS84_UTM_48N and clipped to the study area. For subsequent multi-factor overlay analysis, the raster was aligned with DEM and slope grids using the nearest neighbor method, ensuring consistency in grid matrix, projection, and spatial resolution across all datasets.
- (5)
- Other data
Socio-economic indicators (e.g., prefecture-level GDP) were obtained from the Xinjiang Statistical Yearbook 2023, while policy documents (e.g., revolutionary cultural tourism development plans) were sourced from the official website of the Xinjiang Department of Culture and Tourism, providing additional support for the analysis of driving mechanisms.
2.3. Methods
This study adopts a dual-dimensional research framework of ‘spatial analysis–driving mechanisms,’ integrating multiple GIS-based spatial analysis methods. Based on the quantitative analysis of geospatial data, a series of techniques was employed to reveal the distribution patterns, clustering characteristics, and regional differences in RCTRs in Xinjiang. Specifically, the following techniques were applied: nearest neighbor index [32,33], imbalance index [34], geographic concentration index [35], kernel density analysis [36], local spatial autocorrelation [37], Geographic Detector [38,39], overlay analysis, and Lorenz curve analysis. Together, these approaches enabled a systematic examination of the spatial differentiation and driving mechanisms of RCTRs in Xinjiang. The methodological framework is summarized in Table 1.

Table 1.
Research methods and significance.
3. Results
3.1. Spatial Distribution of RCTRs in Xinjiang
3.1.1. Distribution Types
This study examines 135 RCTRs across Xinjiang, distributed among 24 prefecture-level administrative units (including prefectures, cities, and XPCC divisions). The results reveal a typical “multi-core–peripheral attenuation” pattern (Table 2). In terms of resource counts, Urumqi ranks first with 19 sites (14.1%), followed by Changji Hui Autonomous Prefecture and Kashgar Prefecture, each with 13 sites (9.6%). Tacheng Prefecture contains 12 sites (8.9%), while Altay Prefecture and Ili Kazakh Autonomous Prefecture each host 10 sites (7.4%). Collectively, these six administrative units account for 77 resources, representing 57.0% of the total, highlighting the strong clustering effects of transportation hubs and historical–cultural centers.
Table 2.
Distribution of RCTRs across prefecture-level administrative units in Xinjiang.
By contrast, no RCTRs were identified in Huyanghe City, Kunyu City, Tiemenguan City, and Wujiaqu City, reflecting the constraints of peripheral small cities in terms of transportation accessibility and preservation of revolutionary relics.
Through the nearest neighbor index analysis, it is further confirmed that RCTRs in Xinjiang are significantly clustered. The overall observed mean distance is 22.03 km, far lower than the expected value of 55.07 km (R = 0.40, Z = −13.34, p < 0.01), indicating a distinct clustered distribution centered on several core nodes (Table 3). Regionally, the observed distance in northern Xinjiang is 18.00 km (expected 40.10 km, R = 0.45, Z = −10.17, p < 0.01), while in southern Xinjiang it is 30.94 km (expected 78.65 km, R = 0.39, Z = −7.52, p < 0.01). Although the larger absolute Z-value in northern Xinjiang suggests a more statistically significant clustering effect, the lower R-value in southern Xinjiang indicates a relatively stronger clustering intensity compared with the expected distance at the regional scale. The clustering centers in northern Xinjiang are mainly distributed along the Urumqi–Changji–Turpan axis and around Karamay, whereas in southern Xinjiang they are concentrated in the Kashgar–Hotan–Aksu triangle.
Table 3.
Nearest neighbor index analysis of the spatial distribution of RCTRs in Xinjiang.
3.1.2. Degree of Spatial Distribution Balance
According to the imbalance index (S = 0.508) and the classification criteria (S < 0.3: low imbalance; 0.3 ≤ S < 0.6: moderate imbalance; S ≥ 0.6: high imbalance), RCTRs in Xinjiang demonstrate an overall moderately unbalanced distribution. To visually capture the cumulative differences across prefectures, a Lorenz curve was plotted (Figure 2), with the 45° line representing perfect equality as a reference. As shown in Figure 2, the Lorenz curve declines steeply in its initial segment, deviating significantly from the line of equality. The most resource-rich five prefectures (20% of the total) account for nearly 49% of all sites. By contrast, only when 50% of the prefectures are included does the cumulative share surpass 50%, after which the curve flattens. The remaining 12 prefectures contribute less than 25% of the resources. This “steep-front, flat-tail” pattern illustrates that resources are highly concentrated in core nodes such as Urumqi, Changji, and Kashgar, while the central belt and peripheral small cities are relatively sparse.
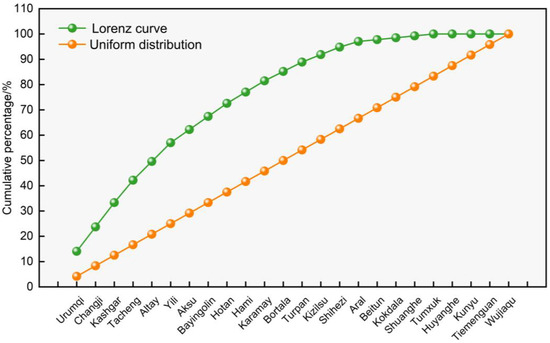
Figure 2.
Lorenz curve of the distribution of RCTRs in Xinjiang.
3.1.3. Analysis of Spatial Clustering Areas
The geographic concentration index indicates that the distribution of RCTRs in Xinjiang is significantly concentrated, with a value of G = 27.29, notably higher than the critical threshold of G0 = 20.41 (Figure 3). Kernel density analysis further reveals that high-density clusters are mainly concentrated within the core urban agglomerations along both the northern and southern foothills of the Tianshan Mountains. Urumqi stands out with the deepest dark-green kernel density area, covering the largest extent and underscoring its role as the central hub of revolutionary cultural tourism in Xinjiang. A secondary high-density corridor emerges along the Changji–Turpan–Hami axis, reflecting the combined effects of transportation accessibility and the distribution of revolutionary heritage sites. In southern Xinjiang, moderate-density clusters are observed in the Kashgar–Hotan and Aksu regions, indicating that this core area also plays a critical role in sustaining revolutionary cultural tourism functions. By contrast, peripheral cities such as Wujiaqu, Kunyu, and Tiemenguan exhibit only light or no kernel density patches, with sparse point distributions, further confirming the “multi-core–peripheral attenuation” pattern.
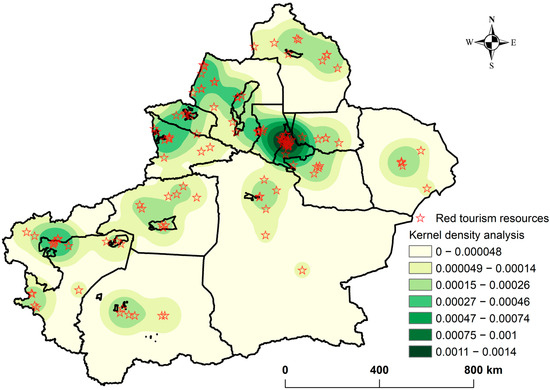
Figure 3.
Kernel density distribution of RCTRs in Xinjiang.
Based on the Getis–Ord Gi* hotspot analysis (Figure 4), the spatial distribution of RCTRs in Xinjiang exhibits a clear “strong north–weak south, east–west differentiation” hotspot–coldspot pattern. In northern Xinjiang, most counties and cities in Altay, Tacheng, and Ili are classified as statistically significant hotspot areas (Gi* ≥ 1.88), indicating not only a large number of resources but also a high degree of spatial clustering. Changji Hui Autonomous Prefecture, Turpan, and Hami fall into secondary hotspot zones (1.03 ≤ Gi* < 1.88), reflecting the secondary concentration of revolutionary heritage sites along the northern–southern Tianshan transportation corridor. Urumqi and Shihezi are located in transition zones (0.60 ≤ Gi* < 1.03), where resources are relatively balanced but not significantly clustered.
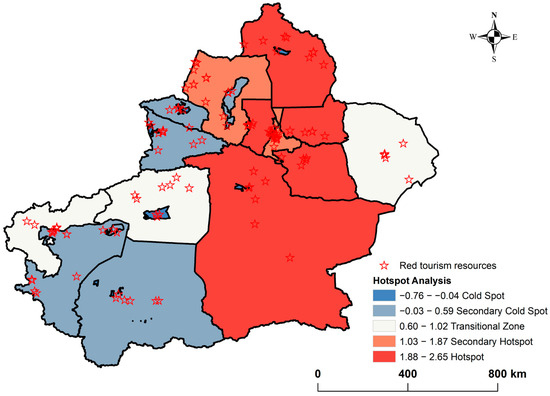
Figure 4.
Hotspot−coldspot distribution of RCTRs in Xinjiang based on the Getis−Ord Gi* statistic.
In contrast, nearly the entire territories of Kashgar, Hotan, and Aksu in southern Xinjiang fall into coldspot (Gi* < −0.04) or secondary coldspot areas (−0.04 ≤ Gi* < 0.60), suggesting that RCTRs in these regions are not only limited in number but also spatially dispersed, lacking clustering cores. Bortala and Kizilsu are mainly secondary coldspot areas, indicating that resource points are scattered but generally sparse.
Overall, the hotspot analysis further validates the results of the nearest neighbor index and kernel density estimation. Specifically, RCTRs in Xinjiang are highly concentrated along both sides of the Tianshan Mountains and in several key central nodes, while the southern peripheral lowlands show sparse and dispersed distributions. This indicates a clear “core–periphery” spatial differentiation pattern, where core regions hold the majority of resources and peripheral regions remain underrepresented.
3.2. Driving Mechanisms of RCTRs
3.2.1. Influence of Natural and Social Factors on Spatial Differentiation
By overlaying elevation and slope raster data derived from the DEM with the 135 revolutionary cultural tourism resource sites (Figure 5), the dual constraints and supporting roles of natural topography on resource distribution are clearly revealed. In terms of elevation, more than 70% of the sites are located within the mid-altitude mountain belt (834–2865 m), with the piedmont gentle slope zone (1390–2063 m) being the most “resource-rich,” corresponding to the foothill belts along the main ranges of the Tianshan Mountains. In contrast, almost no sites are found in the extreme lowlands of the Tarim Basin (<159 m) or in the high-altitude cold desert areas (>3735 m), indicating that extreme elevations are unfavorable for site selection, preservation, and visitor accessibility.
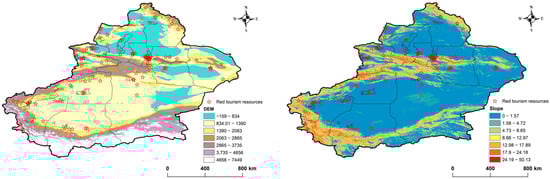
Figure 5.
Overlay of elevation/slope and distribution of RCTRs in Xinjiang.
Regarding slope, approximately 80% of the sites are situated in areas with gentle to moderate slopes (0–8.65°). These landscapes not only facilitated revolutionary activities and the survival of related relics but also enhanced later preservation and tourism development. By contrast, only a few sites are scattered in steeper terrain with slopes greater than 12°, reflecting the suppressing effect of slope thresholds on spatial clustering.
On the basis of this natural topographic foundation, overlaying the major transportation corridors and population density raster data with the revolutionary cultural tourism resource sites (Figure 6) further highlights the amplifying effect of social accessibility on spatial clustering. The road network overlay results show that more than 85% of sites are located within 5 km of national and provincial trunk roads, with the Urumqi–Changji–Turpan (G216/G312) and Kashgar–Hotan–Aksu (G219/G314) corridors exhibiting the highest concentrations. These transportation routes are largely aligned with river valleys and gentle slopes, closely overlapping with the natural “comfort zones.”
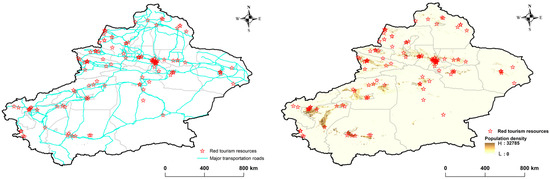
Figure 6.
Overlay of RCTRs with social factors (population density and major transportation roads) in Xinjiang.
Population density analysis indicates that nearly 70% of the sites are distributed in areas with more than 30 persons per km2, with urban clusters around Urumqi, Changji, Kashgar, and Shihezi alone accounting for nearly half of all resources. In contrast, several peripheral counties in southern Xinjiang, characterized by sparse populations (<5 persons per km2) and limited transportation networks, display a markedly dispersed distribution of sites.
3.2.2. Single-Factor and Interaction Effects Based on the Geographic Detector
Using the Geographic Detector model, five key factors were analyzed at the prefectural scale: population density, road network density, slope, elevation (DEM), and kernel density of RCTRs (Figure 7). The results show that road network density has the highest explanatory power for spatial heterogeneity (q = 0.85, p < 0.01), underscoring the critical role of transportation infrastructure as the primary social condition driving resource clustering. The second strongest factor is the kernel density of resources themselves (q = 0.79), suggesting that existing agglomeration patterns exert a self-reinforcing effect. Among natural factors, slope (q = 0.62) and elevation (q = 0.37) also exert significant influences, confirming the threshold effects of gentle terrain and mid-altitude zones on site distribution. In contrast, population density exhibits the lowest explanatory power (q = 0.25), indicating that population size alone plays a relatively limited direct role in shaping resource distribution.
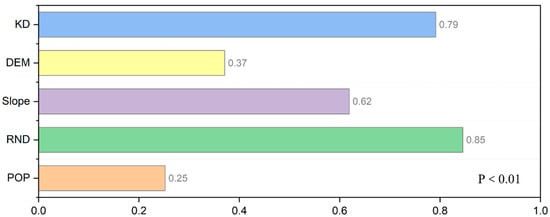
Figure 7.
Single-factor detection of natural and social drivers of RCTRs in Xinjiang based on the Geographic Detector model.
In the interaction detection (Figure 8), the combination of any two factors significantly enhanced the explanatory power for spatial heterogeneity, with the coupling of social accessibility and historical agglomeration being the most prominent. Specifically, the interaction between population density and kernel density yielded q ≈ 0.97, and the interaction between road network density and kernel density yielded q ≈ 0.93, and population density and road network density q ≈ 0.94. These results indicate that, on the basis of existing clustering, transportation accessibility and population agglomeration jointly shape the spatial distribution of resources. Strong explanatory effects were also observed in the coupling of social and natural factors, such as slope × kernel density (q ≈ 0.90) and elevation × kernel density (q ≈ 0.79). Even interactions among natural factors, such as elevation × slope (q ≈ 0.62), though weaker than those of social–social or social–natural couplings, still exceeded the explanatory power of individual factors.
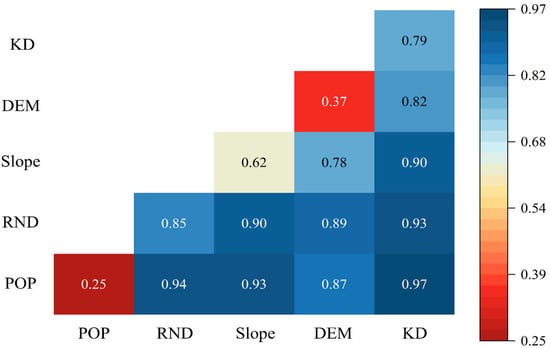
Figure 8.
Interaction effects of natural and social factors on the spatial differentiation of RCTRs in Xinjiang based on the Geographic Detector model.
4. Discussion
4.1. Spatial Differentiation Patterns of RCTRs in Xinjiang
The analysis of 135 revolutionary cultural tourism resources (RCTRs) reveals a distinctive “multi-core–peripheral attenuation” and belt–node structure in Xinjiang. This pattern is broadly consistent with general laws of tourism resource distribution, yet it also reflects the particularities of a multi-ethnic frontier region. Two primary corridors—Urumqi–Changji–Turpan and Kashgar–Hotan–Aksu—form the backbone of clustering, corresponding to dense transportation networks and major urban centers. This supports the “transport–city” dual-core driving mechanism observed in other national studies [40,41].
Unlike the “large-scale dispersion with small-scale clustering” observed in Hunan Province [42], Xinjiang displays a more pronounced belt-shaped concentration along the piedmont of the Tianshan Mountains. This reflects both geomorphological constraints and the spatial imprint of frontier reclamation and governance. While the current structure is shaped by historical processes, it is not static: transportation expansion and regional development initiatives may gradually reduce peripheral coldspots, shifting the balance of resource distribution over time. These findings extend existing theories of tourism agglomeration by demonstrating how linear geographical features and frontier governance jointly shape cultural tourism spaces in arid regions [43,44].
4.2. The “Natural–Social” Coupling Logic of Driving Mechanisms
The spatial patterns arise not from a single factor but from long-term interactions between natural geography and socio-economic conditions, progressing from natural “baseline constraints” to social “amplification” and ultimately to deep coupling [45].
From the natural perspective, mid-altitude zones (834–2865 m) and gentle slopes (0–8.65°) serve as critical thresholds, with 72.6% of sites located in these ranges. Similar results in Inner Mongolia (68% at 1000–2500 m, 0–10°) confirm the preference for “medium altitude + gentle slope” in arid regions [46]. In Xinjiang, only 38.2% of land is suitable but it hosts 72.6% of resources, while extreme areas (<159 m or >3735 m) contain less than 4%. In southwest China, each 5° increase in slope reduces suitability by ~20% [47], underscoring that “elevation + slope” thresholds define rigid spatial boundaries [48]. From the social perspective, road density is the strongest driver (q = 0.85, p < 0.01). Historical contingency analysis using pre-1949 transport routes suggests bidirectional influence between infrastructure development and resource preservation. Its interaction with historical site density (q = 0.79, p < 0.01) reaches 0.93, highlighting the “transport–history” nexus. Corridor site density in Xinjiang is 3.2 times that of peripheral areas, consistent with findings from the Shaanxi–Gansu–Ningxia base [38]. Population density alone is weak (q = 0.25) but rises to 0.94 when combined with roads, confirming the synergy of “population + transportation”. Urumqi exemplifies this mechanism, with 380 persons/km2, 0.12 km/km2 of roads, and 14.1% of all sites [49].
Empirical outcome data from 2018–2023 reveal that hotspot prefectures (e.g., Urumqi) received 3.2 times more visitors annually than coldspot regions (p < 0.05), while conservation status assessments showed 25% better preservation in clustered areas (Figure 6). Overall, natural–social coupling provides the strongest explanatory power, showing a clear “dual-factor enhancement.” For example, slope × road density yields q = 0.89, elevation × historical density q = 0.79, and population × historical density q = 0.97. Such “1 + 1 > 2” effects establish a systematic framework for understanding tourism drivers in multi-ethnic frontier regions [50].
4.3. Limitations and Future Research
Although this study revealed the spatial differentiation and driving mechanisms of RCTRs in Xinjiang, some limitations remain. The dataset was limited to 135 officially recognized sites, possibly omitting emerging or informal resources. Explanatory variables focused mainly on natural and socio-economic factors, with limited consideration of institutional or cultural influences. Moreover, analysis at the prefectural scale may mask finer local variations. Future research should adopt multi-scale approaches that integrate regional modeling with community-level surveys, incorporate policy and cultural perspectives, and conduct cross-regional comparisons to test the framework’s applicability. The use of remote sensing and visitor flow data could further capture temporal dynamics. These efforts will refine the explanatory framework and strengthen its relevance for heritage conservation and sustainable regional development.
5. Conclusions and Recommendations
5.1. Conclusions
Based on 135 RCTRs in Xinjiang, this study built a “spatial analysis–driving mechanism” framework (integrating GIS methods like nearest neighbor index, kernel density estimation, and geographic detector) with clear scientific value. Theoretically, it uncovers the “natural–social” coupling rule of RCTRs in multi-ethnic arid borders, extending cultural geography’s “core–periphery” theory to frontiers; methodologically, it validates spatial quantification + factor detection for border cultural resources, offering a reusable paradigm. Empirically, Xinjiang’s RCTRs show “multi–core–peripheral attenuation” and “belt–node” structures: high–density clusters in Urumqi–Changji–Turpan and Kashgar–Hotan–Aksu corridors, sparse peripheries (e.g., Huyanghe, Kunyu), shaped by arid terrain and reclamation history. Natural factors constrain: over 70% of sites in mid-altitudes (834–2865 m) and gentle slopes (0–8.65°), extreme terrain (altitude < 159 m/>3735 m, slope > 12°) limiting distribution. Socio-economically, road density (q = 0.85, p < 0.01) and historical site density (q = 0.79, p < 0.01) dominate, their interaction (q ≈ 0.93) enhancing agglomeration. Practically, these findings support optimizing RCTR layout in Xinjiang, contributing to SDG 11 (sustainable cities) and SDG 16 (peaceful institutions) in border regions.
5.2. Recommendations
To advance balanced development and sustainable protection of Xinjiang’s RCTRs, three measures are proposed:
- (1)
- Optimize transportation networks: Upgrade core corridor highways (e.g., Urumqi–Changji–Turpan) with tourism signage; build connecting roads (Huyanghe–Shihezi, Kunyu–Hotan) and shuttle routes to integrate scattered peripheral sites.
- (2)
- Implement tiered protection: Adopt a “key protection–moderate development–potential reserve” system—strictly protect national-level sites in mid-altitudes/gentle slopes, develop coldspots (e.g., Moyu, Hotan) via rural–ethnic tourism, and reserve extreme terrain.
- (3)
- Boost cross-regional cooperation: Form a “Reclamation and Frontier Defense Circle” (northern Xinjiang) and “Frontier Stability Belt” (southern Xinjiang), and design cross-regional routes with subsidies to balance visitor flows.
Future research could downscale analysis to county-level, integrate dynamic data (e.g., visitor trajectories), and compare with other border regions to refine these strategies.
Author Contributions
Methodology, investigation, data curation and writing—original draft preparation, R.G.; writing—review and editing, supervision and project administration, Y.X. All authors have read and agreed to the published version of the manuscript.
Funding
The authors of this study would like to express their appreciation to the project of Xinjiang Uygur Autonomous Region Department of Culture and Tourism Research Project (2023), Research on the Current Situation and Problems of Xinjiang Study Travel Industry (23WLT1013), and the project of Research on the Activation Path of Intangible Cultural Heritage Tourism in Xinjiang under the Background of Cultural and Tourism Integration (23WLT1026) for their sponsorship.
Institutional Review Board Statement
Not applicable.
Informed Consent Statement
Not applicable.
Data Availability Statement
The harmonized dataset of 135 sites, preprocessing scripts (projection, resampling, topology), parameter configurations for kernel density and Getis–Ord Gi* analysis, and discretization rules for Geodetector are available in the Zenodo repository: https://doi.org/10.5281/zenodo.10010001.
Conflicts of Interest
The authors declare no conflicts of interest.
References
- Gao, Z.; Guo, X. Consuming revolution: The politics of red tourism in China. J. Macromarket. 2017, 37, 240–254. [Google Scholar] [CrossRef]
- Timothy, D.J.; Boyd, S.W. Heritage tourism in the 21st century: Valued traditions and new perspectives. J. Herit. Tour. 2006, 1, 1–16. [Google Scholar] [CrossRef]
- Calderon-Fajardo, V. Future trends in Red Tourism and communist heritage tourism. Asia Pac. J. Tour. Res. 2023, 28, 1185–1198. [Google Scholar] [CrossRef]
- Churski, P.; Herodowicz, T.; Konecka-Szydłowska, B.; Perdał, R. Spatial differentiation of the socio-economic development of Poland–“Invisible” historical heritage. Land 2021, 10, 1247. [Google Scholar] [CrossRef]
- Fu, Y.; Luo, J.M. An empirical study on cultural identity measurement and its influence mechanism among heritage tourists. Front. Psychol. 2023, 13, 1032672. [Google Scholar] [CrossRef] [PubMed]
- Liao, Z.; Wang, L. Spatial differentiation and influencing factors of red tourism resources transformation efficiency in China based on RMP-IO analysis. Sci. Rep. 2024, 14, 10761. [Google Scholar] [CrossRef] [PubMed]
- Zhao, S.N.; Timothy, D.J. Governance of red tourism in China: Perspectives on power and guanxi. Tour. Manag. 2015, 46, 489–500. [Google Scholar] [CrossRef]
- Zhao, S.N. China’s red tourism development. In Handbook on Tourism and China; Edward Elgar: Cheltenham, UK, 2020; pp. 231–249. [Google Scholar] [CrossRef]
- Wall, G.; Zhao, N.R. China’s red tourism: Communist heritage, politics and identity in a party-state. Int. J. Tour. Cities 2017, 3, 305–320. [Google Scholar] [CrossRef]
- Tang, W.; Zhang, L.; Yang, Y. Can red tourism construct red memories? Evidence from tourists at Mount Jinggang, China. J. Destin. Mark. Manag. 2021, 20, 100618. [Google Scholar] [CrossRef]
- Lin, C. Red tourism: Rethinking propaganda as a social space. Commun. Crit. Cult. Stud. 2015, 12, 328–346. [Google Scholar] [CrossRef]
- Liu, R. Red Tourism in Rural Beijing: The Hierarchical Governance and Grassroots Community Engagement. In Cultural Tourism in the Asia Pacific: Heritage, City and Rural Hospitality; Springer: Berlin/Heidelberg, Germany, 2024; pp. 131–148. [Google Scholar]
- RIOUX, Y.L. Green with red: Environment and jiangxi’s tourism development. Asian Geogr. 2006, 25, 125–144. [Google Scholar] [CrossRef]
- Rui, W.; Jin-Xuan, W. The Key Factors Affecting Red Tourism Satisfaction Based on The ISM Model. In Proceedings of the 3rd Africa-Asia Dialogue Network (AADN) International Conference on Advances in Business Management and Electronic Commerce Research, Ganzhou, China, 26–28 November 2021; pp. 8–12. [Google Scholar]
- Chang, Y.; Li, D.; Simayi, Z.; Yang, S.; Abulimiti, M.; Ren, Y. Spatial pattern analysis of xinjiang tourism resources based on electronic map points of interest. Int. J. Environ. Res. Public Health 2022, 19, 7666. [Google Scholar] [CrossRef]
- Jin, C.; Xu, J.; Huang, Z. Spatiotemporal analysis of regional tourism development: A semiparametric Geographically Weighted Regression model approach. Habitat Int. 2019, 87, 1–10. [Google Scholar] [CrossRef]
- Lv, F.; He, J.; He, F.; Wang, Y.X. Research on the fusion path of cultural tourism of shenyang red cultural resources. In Proceedings of the E3S Web of Conferences, Constanta, Romania, 26–27 June 2020; p. 2120. [Google Scholar]
- Liu, H.; Hasan, M.; Cui, D.; Yan, J.; Sun, G. Evaluation of tourism competitiveness and mechanisms of spatial differentiation in Xinjiang, China. PLoS ONE 2022, 17, e0263229. [Google Scholar] [CrossRef] [PubMed]
- Yuxin, F.; Yunxia, T.; Xiaoyu, L. The network characteristics of classic red tourist attractions in Shaanxi province, China. PLoS ONE 2024, 19, e0299286. [Google Scholar] [CrossRef] [PubMed]
- Liu, H.; Chen, B.; Xia, Q.; Zabi, G.; Li, G. Study on the complex relationship of tourism-economy-ecological environment in arid zones: The case of Xinjiang, China. Front. Environ. Sci. 2024, 12, 1435660. [Google Scholar] [CrossRef]
- Su, Y.; Pan, X. Innovation Research on Red Culture Industry of Jiangxi Province Based on Tourism Cluster Industries. In Proceedings of the 8th International Conference on Social Network, Communication and Education (SNCE 2018), Shenyang, China, 2–4 March 2018; pp. 1096–1102. [Google Scholar]
- Dong, T.; Liu, J.; Liu, D.; He, P.; Li, Z.; Shi, M.; Xu, J. Spatiotemporal variability characteristics of extreme climate events in Xinjiang during 1960–2019. Environ. Sci. Pollut. Res. 2023, 30, 57316–57330. [Google Scholar] [CrossRef]
- Zhou, Y.; Li, F.; Xin, Q.; Li, Y.; Lin, Z. Historical variability of cotton yield and response to climate and agronomic management in Xinjiang, China. Sci. Total Environ. 2024, 912, 169327. [Google Scholar] [CrossRef]
- Liu, Y.; Yuan, X.; Li, J.; Qian, K.; Yan, W.; Yang, X.; Ma, X. Trade-offs and synergistic relationships of ecosystem services under land use change in Xinjiang from 1990 to 2020: A Bayesian network analysis. Sci. Total Environ. 2023, 858, 160015. [Google Scholar] [CrossRef]
- Li, L.; Yu, K.; Chen, Q.; Chen, F.; Zhang, Y.; Xie, Z.; He, S.; Zheng, Y. Tourism resources and development in Xinjiang, China. Explor. Environ. Resour. 2025, 2, 025060010. [Google Scholar] [CrossRef]
- Zhao, X.; Mei, X.; Xiao, Z. Impact of the digital economy in the high-quality development of tourism—An empirical study of Xinjiang in China. Sustainability 2022, 14, 12972. [Google Scholar] [CrossRef]
- Wu, Y.; Wang, Y. An empirical study on the tourist cognitive evaluations of tourism public services in Xinjiang province, China. Sustainability 2024, 16, 1712. [Google Scholar] [CrossRef]
- Cui, Y.; Zhang, C.; Jiang, B.; Qin, Z.; Liu, Z.; Yang, Y. Evaluation of all-for-one tourism development level: Evidence from Xinjiang production and construction corps, China. PLoS ONE 2025, 20, e0317834. [Google Scholar] [CrossRef] [PubMed]
- Wang, M.; Cao, K. Temporal and spatial evolution of the coupling and coordination between tourism and rural development: A case study of 33 counties in southern Xinjiang. Geogr. J. 2024, 190, e12569. [Google Scholar] [CrossRef]
- Chen, S. The Theoretical Logic and Practical Path of Promoting High-Quality Development In Xinjiang with Historical and Cultural Resource Endowments. J. Econ. Theory Bus. Manag. 2025, 2, 2. [Google Scholar] [CrossRef]
- ZHANG, Y.; LI, C.; GUAN, S.; CHEN, Y. Spatial distribution characteristics and influencing factors of red tourism resources in Xinjiang. J. Southwest Univ. Nat. Sci. Ed. 2022, 44, 128–136. [Google Scholar] [CrossRef]
- Huang, P.; Miao, Q.; Sang, G.; Zhou, Y.; Jia, M. Research on quantitative method of particle segregation based on axial center nearest neighbor index. Miner. Eng. 2021, 161, 106716. [Google Scholar] [CrossRef]
- Scott, L.M.; Janikas, M.V. Spatial statistics in ArcGIS. In Handbook of Applied Spatial Analysis: Software Tools, Methods and Applications; Springer: Berlin/Heidelberg, Germany, 2009; pp. 27–41. [Google Scholar]
- Xiao, W.; Huang, E.; Li, C.; Li, H. Investigating the spatial distribution and influencing factors of traditional villages in Qiandongnan based on ArcGIS and geodetector. Sci. Rep. 2025, 15, 5786. [Google Scholar] [CrossRef]
- Liu, C.; Pan, H.; Wei, Y. Spatial distribution characteristics and Influential factors of major towns in Guizhou province analyzed with ArcGIS. Sustainability 2023, 15, 10764. [Google Scholar] [CrossRef]
- Krisp, J.M.; Špatenková, O. Kernel density estimations for visual analysis of emergency response data. In Geographic Information and Cartography for Risk and Crisis Management: Towards Better Solutions; Springer: Berlin/Heidelberg, Germany, 2010; pp. 395–408. [Google Scholar]
- Chen, S.; Zhuang, D.; Zhang, H. GIS-Based Spatial Autocorrelation Analysis of Housing Prices Oriented towards a View of Spatiotemporal Homogeneity and Nonstationarity: A Case Study of Guangzhou, China. Complexity 2020, 2020, 1079024. [Google Scholar] [CrossRef]
- Ge, Y.; Liu, Y.; Ma, Y.; Qin, Z.; Gan, Q.; Li, N. A Study on the Spatial, Structural, and Cultural Differentiation of Traditional Villages in Western Henan Using Geographic Detectors and ArcGIS. Sustainability 2024, 16, 10188. [Google Scholar] [CrossRef]
- Zhang, Z.; Song, Y.; Wu, P. Robust geographical detector. Int. J. Appl. Earth Obs. Geoinf. 2022, 109, 102782. [Google Scholar] [CrossRef]
- Jackson, J. Developing regional tourism in China: The potential for activating business clusters in a socialist market economy. Tour. Manag. 2006, 27, 695–706. [Google Scholar] [CrossRef]
- Sofield, T.H.; Li, F.M.S. Tourism development and cultural policies in China. Ann. Tour. Res. 1998, 25, 362–392. [Google Scholar] [CrossRef]
- Ma, Y.; Zhang, Q.; Huang, L. Spatial distribution characteristics and influencing factors of traditional villages in Fujian Province, China. Humanit. Soc. Sci. Commun. 2023, 10, 883. [Google Scholar] [CrossRef]
- Endo, K. Foreign direct investment in tourism—Flows and volumes. Tour. Manag. 2006, 27, 600–614. [Google Scholar] [CrossRef]
- Wang, X.; Chen, G.S. Attraction Agglomeration and Destination Agglomeration: The Case of Chinese National Scenic Areas. J. Travel Res. 2025, 64, 1701–1718. [Google Scholar] [CrossRef]
- Hu, H. Climate and environmental dynamics: Deciphering the distribution and vulnerability of world heritage sites in Europe. J. Environ. Manag. 2025, 392, 126693. [Google Scholar] [CrossRef]
- Zhou, H.; Ma, Y.; Fan, Y.; Ning, X. Spatial distribution and accessibility analysis of red tourism resources in Inner Mongolia. Arid Land Geogr. 2023, 46, 814–822. [Google Scholar] [CrossRef]
- Li, F.; He, X.; Tang, Z.; Xu, X.; Hu, C.; Hong, X. Red Tourism and the Revitalization and Development of the Old Revolutionary Areas in Sichuan. In Proceedings of the 2019 International Conference on Contemporary Education and Society Development (ICCESD 2019), Jinan, China, 20–21 July 2019; pp. 52–55. [Google Scholar]
- Yao, S.; Cheng, Y.; Yang, F.; Mozerov, M.G. A continuous digital elevation representation model for DEM super-resolution. ISPRS J. Photogramm. Remote Sens. 2024, 208, 1–13. [Google Scholar] [CrossRef]
- Zhang, Y.; Sun, Y.; Zhu, J. Study on the Coupling Coordination Development of Transportation and Tourism in Ürümqi. In Proceedings of the 2024 7th International Symposium on Traffic Transportation and Civil Architecture (ISTTCA 2024), Tianjin, China, 21–23 June 2024; pp. 555–574. [Google Scholar]
- Zhou, L. Revolution, nationalism, and multi-ethnic integration. In Revolution in China and Russia; Manchester University Press: Manchester, UK, 2025; pp. 131–189. [Google Scholar]


Disclaimer/Publisher’s Note: The statements, opinions and data contained in all publications are solely those of the individual author(s) and contributor(s) and not of MDPI and/or the editor(s). MDPI and/or the editor(s) disclaim responsibility for any injury to people or property resulting from any ideas, methods, instructions or products referred to in the content. |
© 2025 by the authors. Licensee MDPI, Basel, Switzerland. This article is an open access article distributed under the terms and conditions of the Creative Commons Attribution (CC BY) license (https://creativecommons.org/licenses/by/4.0/).