Abstract
The goal of this study was to determine how the loss of dates affected food security in Saudi Arabia from 2000 to 2021. The researchers achieved this by using food security indicators, economic equations to quantify agricultural resource losses, and econometric analyses to develop a partial adjustment model. The results show that dates are considered a self-sufficient crop as well as an export crop, as the state resorts to exporting the surplus instead of storing it for local consumption. During the study period, there was an increase in the period of sufficiency in date production for local consumption and the period of coverage of imports for local consumption. In 2000, the volume of dates lost increased by approximately 131.22%. The total loss of land and water resources reached 31,918.4 hectares and 324.759 million cubic meters, respectively. The value of the partial adjustment coefficient (λ) indicates that about 81.1% of the imbalance in the equilibrium between the actual and equilibrium levels is adjusted within one year. Loss is considered one of the most important factors that determine food security for dates, in addition to the total value of loans financed to date factories, the total population, and the level of technological progress in the marketing and storage of dates. It was found that a change of 10% in these variables leads to a change in food security for dates of (−2.37%), 0.07, (−15.33%), and 0.58%, respectively, and the adjusted coefficient of determination was estimated at 0.93. This study recommends the following: (1) expanding the use of modern technologies for date post-harvest transportation and storage, and (2) increasing support and loans allocated to date factories to increase warehouses for cooling and storage to accommodate the increase in production and surplus consumption.
1. Introduction
Dates are considered a good food source compared to other crops, as they have a high nutritional value. The palm tree is characterized by its tolerance of harsh climatic conditions as well as water salinity, which enhances the opportunities to increase production to reduce the global food gap. The percentage of Saudi Arabia’s contribution to global date production increased from about 11.41% in 2000 to around 15.87% in 2021 (Food and Agriculture Organization). This illustrates the growing importance of Saudi dates in enhancing global food security. The palm and date sector in Saudi Arabia occupies a distinguished position, especially as it represents a popular heritage among Saudis. It also holds a prominent position economically, serving as a significant source of income within the agricultural sector. The National Agricultural Strategy 2030 incorporates dates into its plans to stabilize food security in Saudi Arabia. The palm and date sectors in Saudi Arabia have reached about 12% of the total value of agricultural income, with a value of about USD 2 billion, which amounts to about 0.4% of non-oil gross domestic products. The report in [1] also indicates that date production in Saudi Arabia amounts to more than one and a half million tons annually; this production is from about 33 million palm trees and includes many varieties that are desired both locally and internationally. Food loss and waste are undoubtedly a global concern due to their severe economic, social, and environmental impacts, leading to the depletion of scarce resources integral to the food production process, such as water, land, energy, and human resources. This results in a decrease in the economic returns from agricultural and industrial activities. The impact of this phenomenon exacerbates food insecurity in countries with limited resources, which struggle to bear the costs of imported supplies needed to meet basic food requirements. Additionally, this issue contributes to environmental degradation [2]. The study seeks to answer the following questions: What is the estimated quantity and percentage of food loss and waste in the production and consumption of local dates during this period? In addition, what are the economic value and resources used to produce the lost quantity of dates and their impacts on food security of dates in the Kingdom of Saudi Arabia?
The importance of the research lies in the fact that implementing strategies to reduce food loss and waste would positively impact food security for dates in the Kingdom of Saudi Arabia. By studying the economic factors that would affect food security for dates, and providing a practical vision that could lead to effective strategies to reduce food loss and waste, this research could contribute to enhancing overall food sustainability, improving economic returns for producers, and ensuring a reliable supply of dates to local and international markets.
To address these challenges, the study developed the following hypotheses:
- While Saudi Arabia has achieved a high level of self-sufficiency in date production, food security is at risk due to high levels of date loss and waste. This hypothesis will explore the relationship between self-sufficiency and food security, and assess whether high production levels translate into adequate food availability;
- The scarce land and water resources invested in the production of lost dates represent a significant economic burden, reducing their use efficiency as well as decreasing the contribution of the date sector to GDP.
1.1. Research Problem
The causes of food loss and waste in countries are related to financial, administrative, and technical limitations concerning storage and refrigeration technologies and facilities, as well as packaging and marketing systems. Statistics from the Ministry of Environment, Water and Agriculture in the year of 2020 regarding the amount of food loss showed that the amount of food wasted annually in Saudi Arabia was estimated to be about 4.07 million tons, the total value of food loss and waste was estimated to be USD 3.5 million/year, and the per-capita share of food loss and waste annually was 184 kg. Of these, the volumes of food loss and waste were 79 and 105 kg, respectively; the total percentage of date loss and waste represented about 21.5% of the total volume of food loss and waste, of which 16 and about 5.5% were the percentages of loss and waste, respectively. The results of a field survey under the initiative of the National Program to Reduce Loss and Waste 2019, which was conducted by the former General Grain Organization (currently the General Authority for Food Security), indicate that the amount of loss of dates during the production stage was estimated to be about 24.87 thousand tons, or 18% of the total amount of waste and loss of dates, with the latter estimated to be about 136.63 thousand tons. The amount of loss during the post-harvest stage (handling and storage) was estimated to be about 32.23 thousand tons or 24% of the total amount of loss and waste of dates, and the amount of loss during the distribution stage was 42.55 thousand tons, or 31%, while the amount of waste during the consumption stage was about 36.97 thousand tons, or 27%. An individual’s contribution to the food loss and waste of dates was about 5 kg/year, including 4 and 1 kg/year in the amounts of loss and waste, respectively. The total value of the food loss and waste of dates was estimated to be about USD 156.8 million/year. This represents an increase in quantities that are not being utilized, which affects the level of food security of dates, in addition to the economic losses caused by the loss of economic resources used to produce these quantities of dates.
1.2. Research Objectives
This research aims to measure the impact of waste on the level of food security of dates in Saudi Arabia during the period of 2000–2021. The research objectives are as follows:
- Assess the status of self-sufficiency and food security for dates during the study period;
- Estimate the amount and percentage of loss in relation to local date production and consumption;
- Estimate the quantity and value of economic resources used in producing an equivalent quantity of dates that were lost during the study period;
- Measure the impacts of loss and other factors on the food security of dates during the study period.
1.3. Previous Studies
The authors of [3] assessed the loss and waste of date crops after harvest in Saudi Arabia, concluding that the primary reasons for these losses include factors such as Shaees, Bosr, bird consumption, insects, and dust mites. Notably, the level of loss during harvest varies significantly by region and variety; Khalas dates in Al-Ahsa experience a 38% loss, while Alrazeez sees only 7.5%. Similarly, the Sukkari dates show minimal losses, with Al-Qassim at 0.8% and Al-Saqai at 2%. In the marketing stages, losses in Al-Qassim range from 5 to 10%, whereas Al-Ahsa reports less than 5%. This study highlighted that the small size of Sukkari dates contributes to one-third of the loss, and in Riyadh, two-thirds of the loss is due to cuts and scratches. To mitigate these losses, the authors recommended improved irrigation and fertilization practices, protective nets for fruits, and specific nutrient applications to enhance crop maturity.
Transitioning from this focus on loss prevention, the authors of [4] explored the impact of post-harvest technology on reducing marketing losses and improving agricultural economic resources for key vegetables and fruits produced in Alexandria Governorate. This perspective on technology aligns with the findings of [5], where the authors studied the local and external demand for Saudi dates, revealing an average loss of about 15% from 1984 to 1996, with a concerning upward trend. They noted that many importing countries are moving towards self-sufficiency, necessitating the exploration of non-traditional markets for Saudi dates.
Further expanding on the role of technology, the authors of [6] investigated post-harvest technology’s influence on marketing losses and agricultural resources in Saudi Arabia. Their conclusions indicate that marketing efficiency is significantly influenced by market structure and channels, suggesting that technological adoption could enhance incomes for all stakeholders while conserving vital water resources.
Building on the economic implications of date marketing, a study in [7] identified price as the most critical factor determining the competitive advantage of Saudi dates over those from other countries. This finding was echoed in subsequent studies [8,9,10,11,12], which examined the competitive abilities of Saudi dates in both local and international markets, reinforcing the significance of price as a key determinant in marketing strategies.
Moreover, the authors of [13] found that improving marketing efficiency could boost agricultural sector revenues by up to 30%. This relationship was further explored in studies [9,10], which delved into the competitiveness of Saudi dates in European Union markets. In [14], the authors highlighted the connection between Saudi date exports, local production, and export prices, recommending the development of supportive programs for date exporters.
As competition intensifies, the authors of [15] noted that countries like the United Arab Emirates, Iraq, Pakistan, Israel, Tunisia, and Iran maintain a strong competitive presence in the global date market. In a broader context, the authors of [16] examined food conditions in Saudi Arabia, addressing production, consumption, and self-sufficiency rates. Their study emphasized the importance of revising production policies for food-dependent commodities, advocating for the increased cultivation of strategic crops, soft loans for investors, and initiatives to minimize food loss.
Additionally, some studies have focused on consumer demand for traditional dates versus pesticide-free options. Research indicated a willingness among consumers to pay higher prices for pesticide-free dates, comparing these preferences within Saudi Arabia [17,18] and internationally in countries like China [19,20], Russia [21] and Bangladesh [22]. Moreover, studies that specifically addressed pesticide residue characteristics were conducted in India [23] and Pakistan [24]. Other research examined structural, technical, and behavioral issues affecting local date markets, providing a comprehensive understanding of the challenges faced in the industry [19].
2. Materials and Methods
To achieve its objectives, this study used secondary data from several sources, including publications from the statistical book issued by the Ministry of Environment, Water and Agriculture (MEWA); the Food and Agriculture Organization (FAO); and the annual reports issued by the National Center for Palm and Dates. This study also employed econometric analysis such as general time trend equations and economic equations to measure the rate of self-sufficiency and the strategic stock of dates in Saudi Arabia during the period of 2000–2021. This study employed econometric analyses, including general time trend equations and a range of economic models, to assess the self-sufficiency rate and strategic stock of dates in Saudi Arabia between 2000 and 2021. The analysis examined several critical variables, as follows:
- -
- Local production. Analyzing production trends to identify periods of surplus and deficit;
- -
- Domestic consumption. Investigating how consumption patterns relate to production levels and population growth.
- -
- Import and export quantities. Exploring trade dynamics to understand the impact of global markets on local food security;
- -
- Volume of dates lost. Measuring losses to gauge their effect on overall availability and pricing;
- -
- Cultivated area. Assessing how land use practices influence production capabilities;
- -
- Financing for factories. Examining the role of financial resources in enhancing infrastructure and technological development within the date industry;
- -
- Population dynamics. Evaluating how changes in population size and urbanization trends affect the demand for dates;
- -
- Technological progress. Investigating the relationship between technology adoption and reductions in post-harvest losses.
By synthesizing data from these diverse sources, this study seeks to provide a comprehensive analysis of the factors influencing food security in relation to date losses, ultimately offering practical recommendations to enhance the sustainability and resilience of Saudi Arabia’s date industry.
To estimate the strategic stock and food security coefficient, the following steps were followed [25]:
- Self-sufficiency ratio = [local production (LP) ÷ local consumption (LC)] × 100.
This ratio indicates the percentage of local production that meets domestic consumption needs;
- 2.
- Local consumption per day (LCD) = annual consumption (AC) ÷ number of days in a year (N).
The importance of this indicator is due to knowing the percentage of dependence on the interior—or on the local production of the crop;
- 3.
- Production adequacy period for consumption (App) =LC ÷ LCD.
This measures how long local production can meet consumption needs;
- 4.
- Import coverage period for consumption (ICP) = import quantity (IM) ÷ LCD.
The importance of this indicator is due to knowing the percentage of dependence on the outside to provide the crop;
- 5.
- Change in strategic stock (CIS) = {(SAPICP −365) × LCD} − export quantity (EX).
Here, SAPICP is the sum of the length of the periods of production adequacy and import coverage. This evaluates the changes in strategic stock after accounting for exports;
- 6.
- Strategic stock (SS) = total surplus (TS) − total deficit (TD).
It is necessary to increase the strategic stock of dates for local consumption for a period of no less than 6 months at least until the value of the food security coefficient reaches 0.5 according to food security considerations;
- 7.
- Food security coefficient (SCF) = SS ÷ average annual consumption (AAC).
The food security coefficient can also be calculated by summing the ratio of changes in strategic stock to annual domestic consumption. This coefficient ranges from zero to one; a value closer to zero indicates higher food security, while a value closer to one suggests lower food security for the commodity within the country [26]. By integrating these methodologies and considerations, the study aims to provide a comprehensive analysis of date production and consumption dynamics in Saudi Arabia, while also emphasizing the importance of consumer protection and a broader range of scientific perspectives.
Finally, this research aimed to estimate the impact of loss on the food security of dates using food security indicators and economic equations used in estimating the loss of agricultural resources. Previous studies focused on using the long-term demand function, but in this study, the partial adjustment model was used to determine the extent of response from the loss of dates to the adjustment in the optimal situation when the influencing factors change. The model assumes the existence of an equilibrium quantity for the level of food security of dates, which is the long-term quantity or the level that the government wants to reach. Since the actual level does not equal the desired level, the government will try to partially adjust it in each period of time. Stepwise multiple regression analysis was used to estimate the partial adjustment model, which is one of the long-term dynamic models and can be formulated as follows:
where represents the level of food security for dates and represent the variables determining food security. X1, the most important variable, is the volume of dates lost in thousands of tons (this study assumes, according to economic logic, that there is an inverse relationship between the amount of date loss and the level of food security for dates); X2 is the total cultivated area of dates in hectares (this study assumes the existence of a direct relationship between this explanatory variable and the dependent variable, as increasing the cultivated area will lead to increasing production, thus increasing the supply and availability for local consumption); X3 is the total value of loans financed for date factories (in dollars) (this study assumes a direct relationship between this variable and the dependent variable, because it will lead to an increase in the financial capacity of factory owners in establishing or renting more cooling and freezing warehouses, which will reduce the loss of dates; in addition, increasing financing will lead to the establishment of date processing industries, which will ensure the continuity of supply chains throughout the year); X4 is the total population in millions of people (this study assumes the existence of an inverse relationship between this variable and the dependent variable, as it will lead to an increase in demand for dates); and X5 is the level of technological progress in the marketing and storage processes of dates, which takes the numbers 1, 2, … n (this study assumes, according to economic logic, that there is a direct relationship between this variable and the dependent variable). The model was estimated as a preliminary step in the short run as follows [27]:
where λ represents the adjustment factor and its value ranges between zero and the correct one. A value of λ close to zero indicates that a small portion of the imbalance between the actual and equilibrium situations is modified within a given period of time, while a value of λ close to one indicates that a large portion of the gap between the actual situation and its desired counterpart is covered within a given period of time. This model was estimated using the ordinary least squares (OLS) method. According to this theory, the parameters of this regression model can be estimated if the number of observations is greater than the number of features to be estimated; Christopher Gutfield [28] suggests that, in regression analysis, the number of observations (n) should be at least four times the number of independent variables (p), which can be expressed using the following inequality: 4p ≥ n. The authors of [29,30] also suggest that the number of observations should be at least five to ten times the number of variables; that is, 5p ≤ n ≤ 10p. According to these studies, and due to the lack of sufficient data on the amount of loss of dates before the year of 2000, this study achieved the appropriate number of observations. As the measurement methodology depends on the time series of the variables under study, we used the OLS method to estimate this relationship. However, before implementing this method, the stability of the time series must be studied. The time series of economic variables are often characterized by instability because most of these variables change and grow with time, which makes their mean and variance unstable and related to time, causing the problem of spurious regression and, thus, leading to problems in analysis and analogical reasoning.
To avoid this, it is necessary to conduct a stability test for the time series of the variables under study to ensure their stability before performing regression analysis on them. There are many tests that can be used to test the stability of time series, the most famous of which is the Augmented Dickey–Fuller test. However, this test suffers from not considering the absence of the problem of variance and normal distribution when testing a time series. Therefore, we used the Phillip–Perron (PP) test, as it provides more accurate results than the ADF test, particularly with smaller sample sizes.
3. Results and Discussion
3.1. The Self-Sufficiency and Food Security Status of Dates in Saudi Arabia
By studying the current status of self-sufficiency and food security for dates in the Kingdom during the period 2000–2021 AD, the data in Table 1, Table 2 and Table 3 show the following:

Table 1.
Changes in local production, imports, exports, local consumption, and self-sufficiency rate of dates from 2000 to 2021 (thousands of tons).
Table 2.
Development of the two periods of sufficiency in local production and imports for daily local consumption and estimation of the strategic stock of dates during 2000–2021 (thousand tons).
Table 3.
The general time trend equations for the most important economic variables for Saudi dates from 2000 to 2021.
During the period of 2000–2021, local date production increased, with a statistically significant annual growth rate of about 3.08% and an average of about 1081.69 thousand tons. It was relatively stable, as indicated by the low coefficient of variation of 21.93% during the period of 2000–2021. Local date consumption also increased, with a statistically significant annual growth rate of about 2.36% and an average of about 985.94 thousand tons during the study period. It was characterized by relative stability, as indicated by the low coefficient of variation of 17.5% during the study period. Dates could be considered a self-sufficient crop during the study period, as the self-sufficiency rate increased from about 103.94% in 2000 to about 124.97% in 2021, with a small and statistically significant annual growth rate of about 0.68% and an average of about 109.03%. The self-sufficiency rate was also characterized by relative stability, as indicated by the low coefficient of variation of 4.98%.
Saudi Arabia’s exports of dates rose during 2000–2021, with a statistically significant annual growth rate of about 10.32% and an average of about 96.96 thousand tons. It was not characterized by relative stability, as indicated by the high coefficient of variation of 75.72%; the reason for this might be due to the large increase in exports of dates to the global markets during the study period. At the same time, Saudi Arabia’s imports of dates increased, with a statistically insignificant annual growth rate of about 3.44%. The imports of dates were also not characterized by relative stability, as indicated by the high coefficient of variation of 86.4% during the study period.
The period of sufficiency in date production for local consumption increased from 379.37 days in 2000 to 456.13 days in 2021; that is, it increased at a small, statistically significant rate of 0.68% annually. The period of import coverage for local consumption also increased from 0.06 days in 2000 to 1.68 days in 2021, showing an annual growth rate of about 1.58%. The reason for this increase is that Saudi Arabia is considered one of the largest countries exporting dates, not one of the countries importing them.
Calculating the amount of surplus and deficit in local date consumption, it becomes clear that the amount of surplus directed towards the development of the strategic stock of dates increases over the amount of deficit or withdrawal of that stock. Based on the concept of the strategic stock, which considers both surpluses and deficits during the study period from 2000 to 2021, the total strategic stock of dates amounted to approximately 247.45 thousand tons, with an annual average of 11.25 thousand tons. This strategic stock is sufficient to cover local consumption for a period of about 92.6 days only. The reason for this may be due to the significant increase in the annual growth rate with respect to the amount of daily consumption (about 2.73%) compared to the average annual growth rate for the period of production sufficiency for domestic consumption, which was estimated to be approximately 0.68%, resulting in the withdrawal of the strategic reserve during that period. The general time trend equation regarding the trend in the surplus and deficit amounts of dates indicates that the trend increased at a statistically significant annual growth rate of about 3.59%. In light of both the strategic stock and the average local consumption of dates, which amounted to about 975.58 thousand tons, the food security coefficient for dates was estimated to be about 0.254 during the study period. Therefore, it is necessary to increase the strategic stock of dates for local consumption for a period of no less than 6 months at least until the value has reached 0.5, according to the food security considerations.
3.2. The Amount of Loss in Agricultural Resources Associated with the Loss of Dates
It is clear from the data we calculated that the volume of loss of dates increased from 7.4 thousand tons in 2000 to 17.11 thousand tons in 2021, meaning that the volume of loss increased by about 9.71 thousand tons, or 131.22% of the amount of loss in 2000. The percentage of date loss from local production also increased from about 1.01% in 2000 to 1.09% in 2021, an increase of about 8.51% from 2000. The percentage of date loss from local consumption also increased from about 1.05% in 2000 to 1.32% in 2021, an increase of about 30.50% from 2000. Calculating the amount of loss in terms of agricultural economic resources in light of the resource needs and the amount of loss of dates, the amount of loss regarding land resources increased from 1434.5 hectares in 2000 to 1669.3 hectares in 2021, meaning that there was an increase in loss of about 234.8 hectares, or 16.37% of the amount of loss in the year of 2000. The total loss of land resources during the study period amounted to about 31,918.4 hectares. The amount of loss regarding water resources also increased from 14.574 million m3 in 2000 to 17.325 million m3 in 2021, showing an increase in loss of about 2.751 million m3, or 18.9% of the amount of loss in the year of 2000. The total loss of water resources during the study period reached about 324.759 million m3.
3.3. The Impact of Loss and Other Factors on the Strategic Storage or Food Security of Dates
To prevent spurious regression resulting from cointegration among the time series, it is essential to analyze the time series for stability and assess their degree of integration using unit root tests before testing for a long-term equilibrium relationship between the model variables and examining the short-run behavior of that relationship.
Unit root test results
Conducting the unit root test based on the Phillips–Perron (PP) test using these time series, the results presented in Table 4 show that the values of tau (τ) calculated for these time series in the three models (with a fixed term, with fixed and trend terms, and without fixed or trend terms) are greater than the critical tau (τ) values in the MacKinnon tables at the 10% level for all variables under study.
Table 4.
Results of the unit root test for the study variables using the Phillips–Perron test during the period of 2000–2021.
These results are confirmed by the fact that the values of tau (τ) at the critical probability for the time series analyzed in this study are greater than 0.10 in the three models, which means that the null hypothesis—the time series are unstable and contain a unit root—should be accepted. Therefore, we conducted a unit root (PP) test for these time series after taking their first difference.
After conducting the test, it was found that the calculated tau values for these variables are less than the critical values, which means that the alternative hypothesis—the time series are stable and do not contain a unit root—is supported; that is, the time series analyzed in this study are stable at the first difference and, thus, they are integrated to the first degree. This result is considered consistent with the standard economic theory, which assumes that most macroeconomic variables are unstable at that level but become stable after taking the first difference, and accordingly, an estimate can be made. A partial adjustment model was run after taking the first difference for the variables under study.
Cointegration test results
The cointegration test was conducted according to the Johansson methodology, and the results are shown in Table 5. The trace statistic at None amounted to about 147.99, which was greater than the value at the 0.05 level (critical value at 5%), which amounted to about 83.94. The result of the maximum eigenvalue test was also confirmed, as the Max-Eigen statistic at None was about 65.35, which is greater than that at the 0.05 level (critical value at 5%), which was about 36.63. Therefore, we accept the null hypothesis, which states that the number of cointegration vectors is greater than zero (r > 0); this means that there is a long-term balanced relationship between the study variables despite the presence of an imbalance in the short-term.
Table 5.
Results of the cointegration test.
After ensuring that there is a cointegration relationship between the variables—meaning that the estimated relationship between these variables is not spurious even though the original time series are non-stationary—we examined the long-term relationship between these variables according to the traditional equations. We used the ordinary least-squares method for the case of cointegration between variables whose time series include a unit root of one order to examine the long-term balanced relationship between the study variables.
The period of sufficiency in production for local consumption was used, as it is one of the important indicators of food security for dates given that local consumption depends mainly on local production. A stepwise multiple regression analysis was performed in both linear and logarithmic forms. The advantage of the short-run logarithmic model was transformed into the long-run model using the adjustment coefficient. The parameters of the estimated model presented in Table 6 clearly show the following:
Table 6.
Estimated partial adjustment model regarding food security for dates during 2000–2021.
1. The value of (1 − λ) in the short-run econometric model was estimated to be about 0.189, and the value of the adjustment factor (λ) was estimated to be about 0.811. The adjustment factor was used to transform the model from the short to the long run, indicating an imbalance of about 81.1% in the equilibrium situation, with the actual and equilibrium levels being adjusted within one year;
2. The stepwise regression model shows that the amount of loss of dates (X1), the total value of loans financed to date factories (in dollars) (X3), the total population (X4), and the level of technological advancement in the marketing and storage processes of dates (X5) are among the most important factors determining food security. In the long-term, the model shows that a 10% change in the amount of loss leads to a change of 2.37% in food security for dates, although the change in food security is in the opposite direction. This is due to the fact that increasing the amount of wastage of dates leads to a reduction in the quantities available for human consumption, and thus, this loss has a negative impact on the food security of dates. A change of 10% in the total value of loans financed to date factories leads to a change of 0.07% in the same direction for the food security of dates. If the population size changes by 10%, the food security of dates decreases by 15.33%, and if the technological level used in marketing and storage operations changes by 10%, this leads to an increase of 0.58% in the food security of dates;
3. In Figure 1: The estimated model has good predictive ability according to the indicators used to measure model efficiency, as the square root of the mean square of random error reaches 0.01, the average absolute error is 0.007, the average percentage of absolute error is 0.124%, and the Theil inequality coefficient (U-Theil) is 0.001. The closer the value of the Theil inequality coefficient is to zero, the more efficient the estimated model becomes;
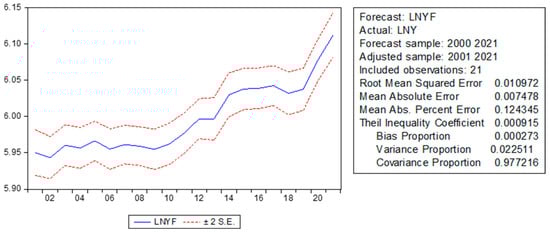
Figure 1.
Quality indicators of the estimated model in Table 6.
4. After performing statistical tests on the estimated model, it becomes clear that the model is free from the problem of autocorrelation of the residuals, as the F-value of the Breusch–Godfrey serial correlation LM test is about 1.73, which is statistically insignificant at the 1% probability level. The F-value for the ARCH test is about 0.03, which is not statistically significant at the 1% probability level; this result also indicates that the estimated model is free from the problem of autocorrelation of the residuals.
4. Conclusions
In 2020, the Ministry of Environment, Water and Agriculture estimated that the amount of food wasted annually in Saudi Arabia was about 4.07 million tons, the total value of food loss and waste was USD 3.5 million per year, and the per-capita share of food loss and waste annually was 148 kg, of which the amounts of food loss and waste were 79 and 105 kg, respectively. The total percentage of date loss and waste represented about 21.5% of the total volume of food loss and waste, of which 16 and about 5.5% were the loss and waste percentages, respectively. The Public Authority for Food Security’s 2019 field survey revealed that the production stage accounted for 18% of the total waste and loss, estimated to be approximately 136.63 thousand tons, while the post-harvest stage (handling and storage) accounted for 24% of the total loss and waste. The amount of loss of dates during the distribution phase was 31%, while the amount of waste during the consumption phase was 27%. The amount of an individual’s contribution to the loss and waste of dates was about 5 kg/year, and the value of the total loss and waste of dates was estimated to be about USD 156.8 million/year. This indicates an increase in unutilized quantities, which affects Saudi Arabia’s food security and economic losses due to the loss of economic resources used to produce these dates. As a result, this study measured the impact of loss on the food security of dates. We used food security indicators and economic equations to estimate the loss of agricultural resources in Saudi Arabia during the period of 2000–2021, in combination with econometric analysis to estimate the partial adjustment model. The most important results of this study demonstrate an increase in the local production, local consumption, self-sufficiency rate, and annual export rate of dates, with increases of 3.08, 2.36, 0.68, and 10.32%, respectively.
The period of sufficiency in date production for local consumption increased at a small but statistically significant rate of 0.68% annually, and the period of coverage of imports for local consumption increased at a rate of 1.58%. We estimated the food security factor for dates to be about 0.254, and the strategic stock to cover local consumption was sufficient for only about 92.6 days. This indicates the need to increase the strategic stock of dates for local consumption for a period of no less than 6 months until the value of the food security factor reaches 0.5, in accordance with food security considerations. Loss is considered one of the most important factors determining the food security of dates, in addition to the total value of loans financed to date factories, the population number, and the level of technological progress in the marketing and storage processes of dates. The coefficient of determination value indicates that these variables account for 93% of the changes in the food security of dates. To reduce waste and its negative effects on agricultural economic resources and food security, this study recommends expanding the use of modern technologies for the post-harvest transportation and storage of dates and increasing support and loans allocated to date factories to increase cooling and storage warehouses to accommodate the increase in production and surplus consumption. This refers to increasing the implementation of advanced technologies to improve the processes involved in moving and storing agricultural products after they have been harvested. This includes improved packaging, temperature control, automation, and monitoring systems. Overall, this expansion aims to reduce waste, maintain product quality, and enhance efficiency in the supply chain.
The study’s limitations include its focus on date production in Saudi Arabia, which, despite its importance, restricts the generalizability of the results to other countries or regions. Local climatic conditions, storage infrastructure, and market differences in other date-producing countries may yield different outcomes. While the study emphasizes the role of modern technology in reducing post-harvest losses, it does not address the cost or feasibility of implementing these technologies on a large scale. The absence of a detailed cost–benefit analysis may hinder the understanding of how achievable the proposed solutions are for all producers. Therefore, the study suggests that future research should expand to include other major date-producing countries, comparing the impact of food loss and waste across various regions and assessing the global effectiveness of the proposed interventions. Additionally, a more comprehensive study is needed on the economic feasibility of implementing advanced storage and refrigeration technologies. Future studies could also focus on developing innovative, low-cost technologies that cater to the needs of farmers and small producers.
Author Contributions
Conceptualization, A.A. and Y.A.; methodology, A.K., Y.A. and S.A.; software, M.E.; validation, F.A., E.A. and Y.A.; formal analysis, A.K. and Y.A.; investigation, A.A.; resources, F.A.; data curation, S.A.; writing—original draft preparation, M.E.; writing—review and editing, E.A.; visualization, Y.A.; supervision, A.A.; project administration, A.A.; funding acquisition, Y.A. All authors have read and agreed to the published version of the manuscript.
Funding
This research was funded by the Saudi Ministry of Education, grant number IFKSUDR_F170.
Institutional Review Board Statement
Not applicable.
Informed Consent Statement
Not applicable.
Data Availability Statement
The original contributions presented in the study are included in the article, further inquiries can be directed to the corresponding author.
Acknowledgments
We thank the Agency for Research and Innovation (ARI), Saudi Ministry of Education, for funding this research project, # IFKSUDR_F170, entitled “Technical and economic aspects in the utilization of dates to be a basic strategic commodity in food security and strategic food storage in Saudi Arabia”.
Conflicts of Interest
The authors declare no conflicts of interest.
References
- National Center for Palms and Dates, Report. 2022. Available online: https://ncpd.gov.sa/en/reports (accessed on 29 December 2023).
- General Authority for Food Security. 2022. Available online: https://www.my.gov.sa/wps/portal/snp/pages/data-and-reports (accessed on 29 December 2023).
- El-Habbab, M.S.; Al-Mulhim, M.S.; Al-Eid, F.; Abo El-Saad, M.; Aljassas, F.; Sallam, A.; Ghazzawy, H. Assessment of Post-Harvest Loss and Waste for Date Palms in the Kingdom of Saudi Arabia. Int. J. Environ. Agric. Res. 2017, 3, 1–11. [Google Scholar] [CrossRef]
- Kamara, S.A. The impact of post-harvest technology on marketing losses and agricultural economic resources for the most important vegetables and fruits produced in Alexandria Governorate. Mansoura Univ. J. Agric. Sci. 2008, 33, 3785–3796. [Google Scholar]
- Al-Husseini, K.A. Domestic and External Demand for Saudi Dates. Master’s Thesis, College of Food and Agricultural Sciences, King Faisal University, Al-Ahsa, Saudi Arabia, 2000. [Google Scholar]
- Alqahtani, S.; Adel, G. Post-Harvest Technology and Its Relationship to Marketing Losses and Agricultural Economic Resources for the Most Important Fruit and Vegetable Crops in the Kingdom of Saudi Arabia; Department of Agricultural Economics, Research Center of the College of Food and Agricultural Sciences, King Saud University: Riyadh, Saudi Arabia, 2008. [Google Scholar]
- Abdel Gawad, G.M.M.A.; Alkhteeb, T.T.; Intezar, M.T. Determinants of competitive advantages of dates exporting: An applied study on Saudi Arabia. Int. J. Econ. Financ. 2014, 6, 79–87. [Google Scholar] [CrossRef][Green Version]
- Al-Shreed, F.; Al-Jamal, M.; Al-Abbad, A.; Al-Elaiw, Z.; Abdallah, A.B.; Belaifa, H. A study on the export of Saudi Arabian dates in the global markets. J. Dev. Agric. Econ. 2012, 4, 268–274. [Google Scholar]
- Al-Shuaibi, A.M.; Al-Sebaei, M.N. The impact of consumer preferences on the quantities consumed of dates, a case study in Al-Asha region, Saudi Arabia. Sci. J. King Faisal Univ. 2019, 20, 13–25. [Google Scholar]
- Alabdulkader, A.M.; Elhendy, A.M.; Al Kahtani, S.H.; Ismail, S.M. Date marketing efficiency estimation in Saudi Arabia: A two-stage data envelopment analysis approach. Pak. J. Agric. Sci. 2017, 54, 475–485. [Google Scholar]
- Bashir, K.A. Determinants of willingness-to-pay a premium for organically produced tomatoes in Riyadh City, Kingdom of Saudi Arabia (KSA). Afr. J. Agric. Res. 2012, 7, 5726–5733. [Google Scholar]
- Alrwis, K.N.; Ahmed, S.B.; Aldawdahi, N.M. The Impact of Competitiveness on Saudi Exports of Dates, The Egyptian Association of Agricultural Economists. Egypt. J. Agric. Econ. 2015, 25, 571–578. [Google Scholar]
- Alagsam, F.; Alhashim, J.; Alamri, Y.; Alnafissa, M. Demand for Dates Free of Pesticide Residue in Saudi Arabia. Appl. Ecol. Environ. Res. 2023, 21, 2441–2456. [Google Scholar] [CrossRef]
- Alrwis, K.N.; Duwais, A.M.; Alaagib, S.B.; Aldawdahi, N. Economic analysis of indicators of the competitiveness of Saudi date exports. Indep. J. Manag. Prod. 2022, 13, 829–840. [Google Scholar] [CrossRef]
- Al-Abdulkader, A.M.; Al-qahtani, S.H.; Ismaiel, S.M.; Elhendi, A.M.; SaadIi, A. Enhancing marketing efficiency of the Saudi dates at the national and international markets. Alamri Yosef, Al-Dakhil AI. Int. J. Econ. Financ. 2016, 8, 53–70. [Google Scholar]
- Alabd, W.; Yosef, A.; Alaa, K. Economic analysis of Saudi food security in light of food dependency indicators. J. Saudi Soc. Agric. Sci. 2014, 13, 155–180. [Google Scholar]
- Yu, X.; Gao, Z.; Zeng, Y. Willingness to pay for the “Green Food” in China. Food Policy 2014, 45, 80–87. [Google Scholar] [CrossRef]
- Liu, R.; Wang, J.; Liang, J.; Ma, H.; Liang, F. perceived value of information attributes: Accounting for consumer heterogeneous preference and valuation for traceable agri-food. Foods 2023, 12, 711. [Google Scholar] [CrossRef] [PubMed]
- Delmond, A.R.; McCluskey, J.J.; Yormirzoev, M.; Rogova, M.A. Russian consumer willingness to pay for genetically modified food. Food Policy 2018, 78, 91–100. [Google Scholar] [CrossRef]
- Kabir, A.F.; Alam, M.J.; Begum, I.A.; McKenzie, A.M. Consumers’ interest and willingness to pay for traceable vegetables. An empirical evidence from Bangladesh. Future Foods 2023, 7, 100214. [Google Scholar] [CrossRef]
- Krishna, V.V.; Qaim, M. Consumer attitudes toward GM food and pesticide residues in India. Appl. Econ. Perspect. Policy 2008, 30, 233–251. [Google Scholar] [CrossRef]
- Al-Sebaei, M.N.; Al-Sulaiman, H.A. An Analytical Study of Marketing Some Date Varieties in the Eastern Province of the Kingdom of Saudi Arabia. Alex. J. Agric. Sci. 2018, 63, 457–475. [Google Scholar]
- Food and Agriculture Organization (FAO) Website. Available online: https://www.fao.org/faostat/en/#data (accessed on 29 December 2023).
- Ministry of Environment, Water and Agriculture, Annual Statistical Book, Various Issues. Available online: https://www.mewa.gov.sa/ar/InformationCenter/Researchs/Reports/Pages/default.aspx (accessed on 29 December 2023).
- Kotb, A.A.; Doaa, I.M. A standard model for food security factors for red meat in Egypt. Egypt. J. Agric. Econ. 2014, 24, 20–35. [Google Scholar]
- Ghanem, A.K.; Sahar, A.K. A study of the economic factors determining food security factors for sugar in Egypt. In Proceedings of the Third Conference of the Department of Economics and Agricultural Business Management (Agricultural Development Strategy and Challenges of Egyptian Food Security), Faculty of Agriculture, Alexandria University, Alexandria, Egypt, 28–29 July 2011; Volume 56, pp. 1–10. [Google Scholar]
- William, H. Greene. In Econometric Analysis, 5th ed.; New York University: New York, NY, USA, 2003. [Google Scholar]
- Chatfield, C. Problem Solving a Statistician Guide; Chapman & Hall: London, UK, 1995. [Google Scholar]
- Kleinbaum, D.G.; Kupper, L.L.; Muller, K.E. Applied Regression Analysis and other Multivariable Methods, 2nd ed.; PWS-Kent Publishing Company: Boston, MA, USA, 1988. [Google Scholar]
- Neter, J.; Wasserman, W.; Kutner, M.H. Applied Linear Statistical Models: Regression, Analysis of Variance, and Experimental Designs, 3rd ed.; Irwin: Homewood, MD, USA; Boston, MA, USA, 1990. [Google Scholar]
- Ghanem, A.M.K.; Ibrahim, O. Al-Nashwan, Food sovereignty of dates and its impact on water consumption in the Kingdom of Saudi Arabia. Egypt. J. Agric. Econ. 2021, 31, 491–504. [Google Scholar]
Disclaimer/Publisher’s Note: The statements, opinions and data contained in all publications are solely those of the individual author(s) and contributor(s) and not of MDPI and/or the editor(s). MDPI and/or the editor(s) disclaim responsibility for any injury to people or property resulting from any ideas, methods, instructions or products referred to in the content. |
© 2024 by the authors. Licensee MDPI, Basel, Switzerland. This article is an open access article distributed under the terms and conditions of the Creative Commons Attribution (CC BY) license (https://creativecommons.org/licenses/by/4.0/).