Abstract
The failure of tailings pond dams represents a complex coupled system involving various risk factors, including human, governance, facilities, and environmental aspects. It is crucial to identify key risk factors at the system level to enhance the safety management of tailings ponds. We analyzed 74 cases of tailings pond dam failure accidents, both domestically and internationally, from the perspectives of human, governance, facility, and environment. We employed the 2–4 Model to identify and extract the causes of dam failures, summarizing these into four primary risk factors and 40 secondary risk factors, while constructing a risk coupling mechanism model. The natural killing (N–K) model was implemented to analyze the risk coupling values of primary risk factors and quantify these couplings. The N–K model facilitated an analysis of the risk coupling values of first-level risk factors, while social network analysis (SNA) was employed to visualize the relationships among second-level risk factors and assess the centrality and accessibility of nodes within the risk factor network. The out-degree of the risk nodes was corrected by integrating the N–K model with the SNA, leading to the identification of key risk factors associated with tailings pond dam failures and the formulation of corresponding safety prevention and control strategies. The findings indicate that managing multi-risk factor coupling is an effective approach to mitigating the occurrence of tailings pond dam failure accidents. Notably, unfavorable environmental risk factors significantly contribute to the coupling of human–governance–facility–environmental risks, necessitating targeted management strategies. Furthermore, inadequate safety supervision, weak safety awareness, inadequate receipt and inspection, and irregular operation represent additional key risk factors requiring focused prevention and control efforts.
1. Introduction
As mining operations expand, tailing ponds, which serve as the primary storage facilities for metal mine waste, are accumulating increasingly large volumes of tailings. This growth has resulted in heightened safety risks and an increasing frequency of accidents within these ponds. Specifically, tailings pond dam failure incidents are characterized by substantial spatial volume, numerous risk points, and strong interdependencies; once an accident occurs, it can result in significant damage to surrounding individuals and infrastructure [1]. Tailings ponds are complex, dynamic systems; the relationship between many internal risk factors is complex and interrelated, making risk assessment and emergency management challenging. Thus, it is essential to investigate the causes of tailings pond dam failure incidents from the perspective of risk factor coupling and analyze these factors to enhance the safety management of tailings ponds.
At present, scholars have conducted extensive research on risk assessment and management of tailings ponds. Their common analysis methods mainly include the hierarchical analysis method (AHP) [2], the fuzzy comprehensive evaluation method [3], the object-element topologizable model [4], the cloud model [5], and the Bayesian model [6]. Chen et al. [7] combined the AHP with the explanatory structural model (ISM) to construct a tailings pond dam failure risk classification method and applied the method to determine the dam failure risk level of a tailings pond. Zhang et al. [8] proposed a hybrid assessment method based on the fuzzy comprehensive evaluation method to assess the safety risk of tailings pond operation and the sensitivity of the risk factors. Xu et al. [9] utilized the theory of cloud modeling and established a fuzzy evaluation model of the dam failure risk that applies to tailings ponds. Frigerio Porta G et al. [10] estimated the probability of dam failure using the tailings pond dam size index and descriptive multivariate analysis and established a Bayesian model to predict the failure time of dam sliding. The above studies mainly investigate the risk factors of tailings pond dam failure accidents as discrete independent events, and the study of the coupling relationship between risk factors is still lacking.
Social network analysis (SNA), a relatively recent development, offers a novel perspective for elucidating the topological characteristics of internal interactions within complex systems [11]. It has found widespread application across various fields, including navigation [12], transportation [13], chemical engineering [14], and coal mining [15]. Because complex networks can better characterize the intrinsic relationship between the risk factors of the nodes of the research object, some scholars apply them to the safety assessment of tailings ponds. Qin et al. [16] characterized the interaction relationship and evolution law of the risk factors of the tailings pond dam failure accidents using a complex network. Zhen et al. [17] constructed a tailing dam failure risk propagation network to identify the key risk factors of tailings dam failure. Dai et al. [18] proposed a key node analysis method based on the network cloud model to analyze the key hazards in the tailings dam failure accidents. Hao et al. [19] combined the decision-making test and evaluation laboratory and the explanatory structural model with the complex network model and put forward the tailings dam failure risk assessment model. However, the SNA perspective prioritizes interrelationships among nodes, potentially overlooking the riskogenic differences of risk factors and their combinations concerning risky events. Moreover, there is a paucity of studies that assess the roles of these risk factors and the risk coupling values associated with tailings dam failure accidents. The N–K model is a generalized model for solving the problems of complex systems [20,21], and it accurately analyzes the correlation of the factors and the degree of coupling within the system. Several studies have also been conducted that combine and successfully apply the N–K model and SNA to the risk analysis of complex accident systems in the fields of construction [22], gas pipeline networks [23], new energy vehicles [24], etc. It proves the feasibility of the SNA/N–K model in the aspects of safety assessment and risk factor analysis and provides the theoretical basis and methodological support for the analysis of the risk coupling evolution of tailings pond dam failure accidents.
The N–K model excels at quantifying the relationships and coupling degrees within complex systems. However, it is limited in its ability to clarify the interaction dynamics among diverse risk factors. Moreover, its focus on primary risk factor couplings restricts its utility in offering detailed and actionable decision-support for risk prevention and control. Conversely, the SNA model prioritizes analyzing the connections between risk factor nodes but fails to assess the varying degrees of impact that individual nodes exert on accident risk severity. To address these shortcomings, this paper integrates the N–K and SNA models, constructing an N–K/SNA model to comprehensively analyze the risk factors associated with tailings dam failure, adopting both qualitative and quantitative approaches. Firstly, we collect domestic and international cases of tailings pond dam failure accidents. By integrating the human–governance–facility–environment perspective with the 2–4 Model theory, we conduct a thorough analysis of the risk factors associated with these accidents and construct a risk coupling mechanism model. We then employ the N–K model to calculate the risk coupling values and quantify the forms of risk coupling. Additionally, we utilize the SNA to develop a correlation network of risk factors, clarifying their roles. Finally, we correct the centrality of safety risk factors using the risk coupling values to identify key risk factors, thereby enhancing the prevention of tailings pond dam failure accidents and improving safety management practices. This study investigates the multifactorial coupling effects in tailings dam failure incidents, analyzing the relationships, patterns, and trends among various risk factors. The findings aim to offer valuable insights and theoretical foundations for improving safety risk management in tailings ponds.
2. Materials and Methods
2.1. Analysis of the Risk Coupling Mechanism of a Tailing Pond Dam Failure Accident
2.1.1. Analysis of the Risk Factors for a Tailing Pond Failure Accident
To quantitatively investigate the risk coupling effects of tailings pond dam failure accidents, we first collect and organize cases of such accidents, following the process outlined below: (1) Utilizing case data from accident investigation reports published by domestic emergency management departments and international sources such as the World Energy Information Service (WISE) [25] as guiding information; (2) Supplementing the specific processes and causes of the accidents through online information, news reports, and literature reviews [26]; (3) Analyzing the causes of each case through accident investigation reports in conjunction with historical expert experience, while excluding cases with incomplete data. Ultimately, we compiled 74 instances of tailings pond dam failures from both domestic and international contexts (Appendix A).
Common accident causation models, such as the Domino Model [27], Swiss Cheese Model [28], Human Factors Analysis and Classification System (HFACS) Model [29], and 2–4 Model [30], each possess distinct attributes tailored to various accident analysis contexts. The 2–4 Model, in particular, integrates multiple dimensions, including external environmental influences, internal organizational dynamics, managerial hierarchies, and human factors. It asserts that deficiencies in safety culture and institutional frameworks diminish individuals’ safety competencies, which, in turn, promote unsafe behaviors and the formation of hazardous conditions, ultimately precipitating accidents. This model facilitates a comprehensive examination of the numerous contributing factors that may be involved in tailings dam failures. Furthermore, the 2–4 Model’s holistic nature, coupled with its flexibility and adaptability, renders it highly effective in analyzing intricate accident causation scenarios, as it adeptly addresses the interconnections between risk factors. Consequently, utilizing this model to investigate the causes of dam failures enhances the understanding of accident mechanisms and provides a robust, scientific basis for the prevention of future incidents.
Based on the collected accident cases, according to the 2–4 Model analysis framework (Figure 1), combined with the Tailings Storage Safety Regulations [31], we analyze the accident causation and infer the implied accident causation from the four first-level risk factors induced by dam failure accidents, such as human unsafe behaviors, governance deficiencies, unsafe state of the facilities, and unfavorable environments, so as to fully explore the risk factors existing in the accident cases, as shown in Table 1. The risk factors in the case are fully explored. According to the above method, 40 secondary risk factors were finally identified (Table 2), with H1–H7 being human factors (H), E1–E3 being environmental factors (E), G1–G10 being governance factors (G), and F1–F20 being facility factors (F).
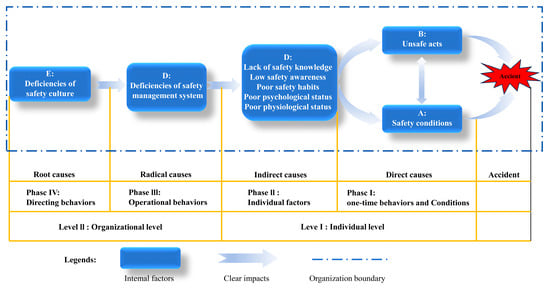
Figure 1.
2–4 Model analysis framework.

Table 1.
Causation analysis of a tailing pond dam failure based on the “2–4” Model.
Table 2.
Risk factors for tailings pond failures.
2.1.2. Coupling Mechanism of the Risk Factor for a Tailing Pond Dam Failure Accident
From the perspective of complex systems theory and utilizing the trigger principle frequently applied in systems theory to analyze the evolution mechanisms of accident risk factor coupling [32,33], this study analyzes the process by which the coupling of risk factors in tailings pond systems triggers the occurrence of accidents. The formation mechanism of risk coupling is illustrated in Figure 2. In the tailings pond safety system, when the human, governance, facility, and environmental subsystems exhibit varying degrees of errors or defects, each subsystem breaching its risk threshold (SRT) can propagate risks through the accident chain. This coupling with other risks disrupts the equilibrium of the system, resulting in the formation of coupled risks. If the system lacks self-repair capabilities and fails to mitigate risks in a timely manner, the risks may surpass the Comprehensive Risk Threshold (CRT), leading to an escalation of existing risks or the emergence of new risks, ultimately culminating in dam failure.
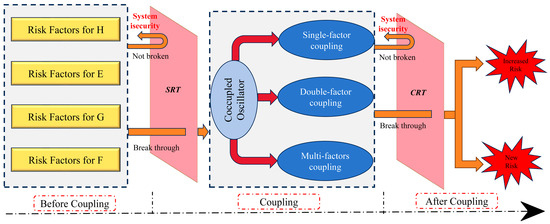
Figure 2.
Coupling mechanism of the risk factors for tailing pond dam failure accidents.
2.2. Construction of a Coupled Model of Tailing Pond Dam Failure Accident Risk Based on the N–K Model and SNA
2.2.1. N–K Risk Coupling Model Construction
In analyzing complex risk coupling problems, the N–K model utilizes existing case data to quantify the correlations and coupling effects of factors within a complex dynamic system, thereby mitigating subjective biases in risk assessment. It is widely employed in the study of the coupled evolution of safety risk factors in complex systems [34,35]. In the N–K model, N represents the number of risk factors, each having n states, resulting in a total of nN possible system states. K denotes the number of interdependencies among risk factors within the system, with values ranging from 0 to N − 1.
In this paper, the basic principle of analyzing the safety coupling risk of a tailings pond using the N–K model is to measure the degree of influence of the coupling effect on the safety of the tailings pond by calculating the coupling value T of the four first-level risk factors, namely, human, governance, facilities, and the environment, with the following calculation equation:
where: a, b, c, d are human, governance, facility, and environmental risk factors, respectively; the status values of h, i, j, and k are represented by 0 and 1, with “1” representing that a risk factor has occurred and “0” representing that a risk factor has not occurred; Phijk is the probability of occurrence of risk factor coupling for human in state h, governance in state i, facility in state j, and environment in state k; Ph…, Pi…, Pj…, and Pk… are the probability of occurrence of risk factor coupling for human in state h, governance in state i, facility in state j, and environment in state k.
Risk factor coupling probability (p) includes single risk factor coupling probability, dual risk factor coupling probability, and multiple risk factor coupling probability and is calculated as follows:
where: mhijk is the number of tailings pond dam failure accidents under different risk factor coupling types; z is the total number of tailings pond dam failure accidents.
Risk factor change risk probability (p) indicates the superposition of all risk factors coupled probability p related to the occurrence of the risk factor when one or more risk factors occur. For example, when the human, governance, and facility factors occur, the change risk probability phij is calculated as follows:
Similarly, the risk probability of changes in other single, two, and three factors in different states can be calculated as p.
In this paper, the risk of a tailings pond dam failure accident is categorized into four types, and the risk coupling exists as single-factor, two-factor, and multi-factor risk coupling (Figure 3). When two particular risk factors are coupled, there are six forms of risk coupling, including a human–governance (H–G) coupling risk, a human–facility (H–F) coupling risk, a human–environment (H–E) coupling risk, a governance–facility (G–F) coupling risk, a governance–environment (G–E) coupling risk, and a facility–environment (F–E) coupling risk. The coupling degree T is denoted as T21 (a, b), T22 (a, c), T23 (a, d), T24 (b, c), T25 (b, d), and T26 (c, d). Taking human–governance (H–G) as an example, the coupled risk calculation formula is shown in (4), and the other two-factor risk coupling values can be calculated in the same way.
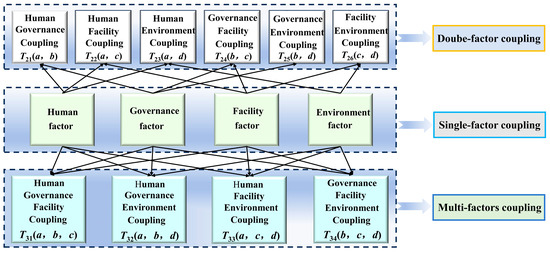
Figure 3.
Types of risk factor coupling for tailings pond failure accidents.
When one of the three risk factors in the system is coupled, four forms of risk coupling exist, including a human–governance–facility (H–G–F) coupling risk, a human–governance–environment (H–G–E) coupling risk, a human–facility–environment (H–F–E) coupling risk, and a governance–facility–environment (G–F–E) coupling risk. The coupling degree T is denoted as T31 (a, b, c), T32 (a, b, d), T33 (a, c, d), and T34 (b, c, d). Taking human–governance–facility (H–G–F) as an example, the coupling risk calculation formula is shown in (5), and the same can be calculated for the other three-factor risk coupling values.
When four-factor coupling occurs in the risk factors of a tailings pond dam failure accident, i.e., human–governance–facility–environment (H–G–F–E) coupling, the risk coupling value T4 (a, b, c, d) can be calculated according to Equation (1). The larger the risk coupling value T4 (a, b, c, d), the more complex the relationship network within the system, and the more difficult it is to control the multi-risk coupled dam failure accident.
2.2.2. SNA Model Construction
Social network analysis (SNA) is an analytical method based on mathematical methods and tools such as graph theory, which uses systems thinking to abstract the system into nodes and their relationships and quantitatively analyze the characteristics of the nodes [36,37,38]. Currently, many scholars have used SNA to study the association between risk factors, which breaks through the previous assumption that risk is regarded as an isolated unit and better reflects the complexity and interdependence of risk factors [39,40]. In this paper, based on a comprehensive analysis of the collected accident cases and employing complex network theory, we constructed the adjacency matrix of risk factors associated with tailings pond accidents (Appendix B). We abstracted 40 secondary risk factors as nodes, established directed edges according to the causal relationships among the risk factors, and assigned weights based on the frequency of these relationships as observed in the accident data. The adjacency matrix was input into Ucinet 6.0, and NetDraw2.1 facilitated the visualization of the risk network, culminating in the establishment of a complex network causal model for tailings pond dam failure accidents (Figure 4), comprising 40 nodes and 105 edges. The risk factor network in this causal model is a directed and complex social network, with arrows indicating the induced relationships among the risk factors.
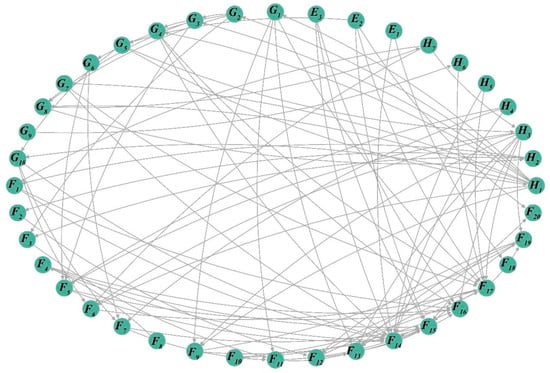
Figure 4.
Complex network causation modeling of tailings dam failure accidents.
In this paper, the complex network model analysis mainly utilizes the proximity centrality of network nodes as well as the mediator centrality to determine the key risk factors. At the same time, the accessibility between system nodes is analyzed through the SNA model to clarify the possibility of risk transfer between different nodes, which corresponds to the first-level risk factors to determine the potential forms of risk coupling. The proximity centrality reflects the connection relationship between a node and the whole network, expressed as the reciprocal of the sum of the shortest path distances from the node to all other nodes, which reveals the critical role of the node in the network of risk factors; the mediator centrality embodies the degree of the node’s influence on the system’s risk transfer, and the larger the mediator centrality, the more important the node. The proximity centrality CC(i)−1 of node i can be calculated as follows:
where: dij denotes the network distance from node i to node j.
The node e-mediated centrality CB(i) is calculated as follows:
where: gjk denotes the number of shortest paths from node j to node k; gjk(i) denotes the number of shortest paths from node j to node k that pass through node i.
2.2.3. SNA/N–K Model Method Construction
The SNA model enables the analysis of key factors based on the relational structure among risk factors; however, the influences leading to risk events and the combinations of risk factors are distinct, indicating that reliance solely on network analysis may introduce biases. The N–K model, which quantifies risk coupling effects using objective data from accident cases, can mitigate subjectivity to some extent, yet it poses challenges in identifying key risk factors. Therefore, this study integrates the N–K and SNA models (see Figure 5). Initially, the N–K model calculates the likelihood of risk events arising from the coupling of four primary risk factors—human, governance, facility, and environmental—across 74 tailings dam failure incidents, yielding risk coupling values. Subsequently, the 40 secondary risk factors are abstracted as nodes to establish a complex causal network model for tailings dam failures. Utilizing Ucinet 6.0, we compute the closeness and betweenness centrality for these 40 nodes. The SNA model is then employed to analyze the accessibility of different factors to one another, thereby identifying potential coupling forms of risk factors. Corresponding risk coupling values are determined based on the results from the N–K model. Additionally, key risk factors are ranked using a centrality analysis of the SNA network. Finally, the risk coupling values are utilized to adjust the network centrality, culminating in the identification of the final key risk factors.
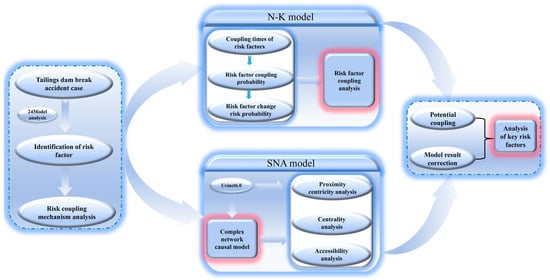
Figure 5.
Fusion SNA/N–K modeling methodology flow.
3. Results
3.1. Analysis of the Results of the N–K Model Calculation
In the N–K model calculations, 0 indicates that a risk factor does not occur and 1 indicates that a risk factor occurs [41]. From the four categories of human, governance, facility, and environmental first-level risk factors, 16 possible risk coupling situations can be constituted. Based on the cause analysis of 74 collected cases of tailings pond dam failure accidents, data on the number of accidental risk coupling occurrences were obtained (Figure 6a), and the probability of different risk coupling occurrences was calculated according to Equation (2) (Figure 6b). The results show that the H–G–F factor combination mode in the three-factor risk coupling has a very high frequency of occurrence, followed by the H–G factor in the two-factor coupling, which shows that the occurrence of tailings pond dam failure accidents is often accompanied by the failure of management factors. According to Equation (3), the risk probability of single-factor (Figure 6c), two-factor (Figure 6d), and three-factor (Figure 6e) changes is calculated, respectively. Finally, the risk coupling value T is further calculated according to Equations (1) and (4) to obtain the risk coupling value under the coupling effect of different risk factors (Figure 6f).
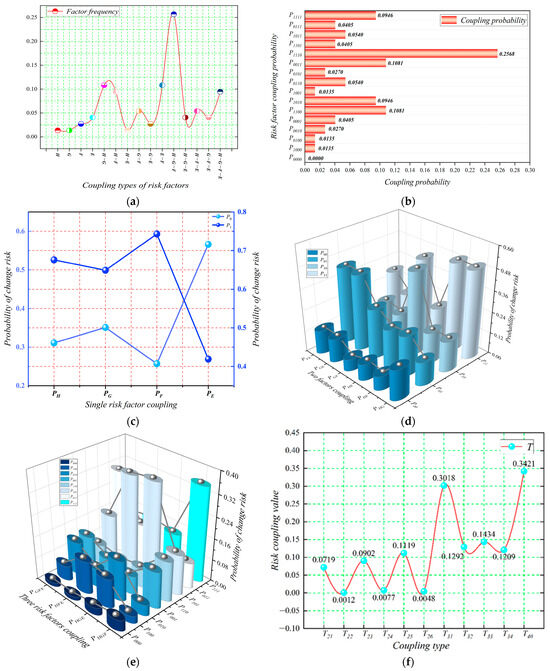
Figure 6.
Calculation of the risk coupling value T. (a) Different coupling type situations; (b) Risk factor coupling probability; (c) Single risk factor coupling probability; (d) Two risk factor coupling probability; (e) Three risk factor coupling probability; (f) Risk coupling value T.
The order of the coupling value T of each risk is as follows: T4 > T31 > T33 > T32 > T34 > T25 > T23 > T21 > T24 > T26 > T22, which can be seen by comparing and analyzing the results of the calculation of the coupling value T.
- The more the risk coupling factors, the greater the risk coupling value T. The H–G–F–E four risk coupling value is the largest (0.3421), significantly higher than the risk coupling value of the overall safety accident of the construction project (0.2582) [42]. It can be seen that the association between factors in the system network of tailings impoundment dam failure accidents is much closer. This shows that the factors in the system network of tailings pond dam failure accidents are more closely related, and the management of tailings ponds should make great efforts to avoid the occurrence of the multi-risk factor coupling state.
- In the three-factor risk coupling, the H–G–F factor coupling value is significantly higher than the other factor coupling forms, indicating that the occurrence of tailings pond dam failure accidents is more closely related to the subsystems composed of H–G–F and less related to the facility factors.
- In the two-factor risk coupling, the G–E coupling risk value is the largest, and from the point of view of practical management, the emergence of unfavorable environmental factors may lead to both the failure of management decisions and the amplification of shortcomings in daily management, which in turn exacerbates the occurrence of accidents. Therefore, for the safety risk management of tailings ponds, when unfavorable environmental factors appear, it is necessary to take corresponding preventive measures to control the coupling between G–E factors.
3.2. Analysis of the SNA Model Calculation Results
3.2.1. Risk Factor Centrality Analysis
The closeness centrality and mediation centrality of each risk node within the risk factor network can be determined using UCINET 6.0 software and the risk factor adjacency matrix (Figure 7). The complex network of tailings pond dam failure incidents is characterized as a directed network, where node proximity centrality is represented by both out-degree and in-degree values. The in-degree of proximity centrality indicates the extent to which a risk is susceptible to induction by other risks within the network. The top five risk factors based on in-degree are F14 (dam structure damage), F15 (dam infiltration pipe surge), F17 (flood discharge facility damage), F16 (dam sliding), and F13 (high infiltration line). Their relatively low out-degree values suggest that these facility-related factors are predominantly influenced by exogenous risks. Conversely, out-degree values reflect a risk’s potential to trigger other risks in the network. Among the top five risk factors in out-degree results, G2 (inadequate safety supervision) possesses the highest degree value, indicating that safety supervision exerts the most substantial direct influence on the network, with most risks being associated with inadequate safety oversight. This is followed by H1 (weak safety awareness), G6 (inadequate receipt and inspection), H3 (irregular operation), and E2 (heavy rainfall). Notably, E2 (heavy rainfall) is categorized as an environmental factor contributing to dam failure, underscoring the significant influence of human, governance, and environmental factors on the risk evolution of tailing dams, which can be regarded as fundamental causes of potential accidents. Mediator centrality reflects a risk factor’s control over surrounding edges and nodes; a high mediator centrality indicates a key role in regulating risk transmission within the system. The top five factors exhibiting high mediator centrality are F17 (flood discharge facility damage), G2 (inadequate safety supervision), G6 (inadequate receipt and inspection), F12 (insufficient flood capacity), and H3 (irregular operation). By addressing these critical risk factors, we can effectively sever the connectivity within the risk network and mitigate the emergence of systemic risks.
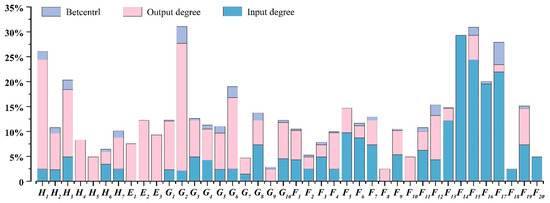
Figure 7.
Proximity centrality and mediated centrality of risk nodes in complex network models of tailings ponds.
In this paper’s risk network-based key factor analysis, the out-degree in the node proximity centrality best represents the node’s ability to induce systematic risk, so the out-degree in the node proximity centrality is chosen as an indicator for determining the key risk factors.
3.2.2. Risk Factor Accessibility Analysis
Accessibility analysis can reflect the possibility of each risk factor inducing the emergence of other factors. Through the risk network accessibility analysis, risk factors in the directed network can be analyzed to spread and thus induce the potential risk of tailings pond dam failure in the form of coupling the risk factor. Node accessibility corresponds to the first level of risk factors, and according to Figure 4, the accessibility of 40 secondary risk factors corresponds to the first level of four risk factors (Table 3). As shown in Table 3, both risk factors and unfavorable environmental factors in the unsafe state of the facility may induce the multifactor coupling form of H–G–F–E, and management factors are highly likely to induce the coupling form of H–G–F. Human unsafe behaviors may lead to the occurrence of two-factor or three-factor risk coupling. Two forms of risk coupling, H–G–F and H–G–F–E, are triggered in a higher percentage of cases.
Table 3.
Risk factor node accessibility analysis.
4. Analysis and Discussion of the Model Result Correction
Given that the SNA model delineates the relationships among risk factors from a subjective perspective, the identified key risk factors may exhibit a low probability of occurrence in actual accidents. In contrast, the N–K model derives its risk coupling values from accident data, rendering it more objective. Therefore, in conjunction with the risk factor accessibility analysis presented in Table 3, the risk coupling value (Figure 6f) serves as a correction coefficient for adjusting the out-degree of risk node proximity centrality, as delineated in Equation (8). The corrected data form the basis for evaluating the key risk factors, with the calculation results illustrated in Figure 8. Figure 8a illustrates the risk node proximity centrality out-degree prior to correction, while Figure 8b depicts the risk coupling value following the adjustment of the risk node proximity centrality out-degree.
where: TR is the out-degree of the corrected risk node proximity centrality; Txy is the value of the y form of risk factor coupling under the x type of risk factor coupling; R is the out-degree of the pre-corrected risk node proximity centrality.
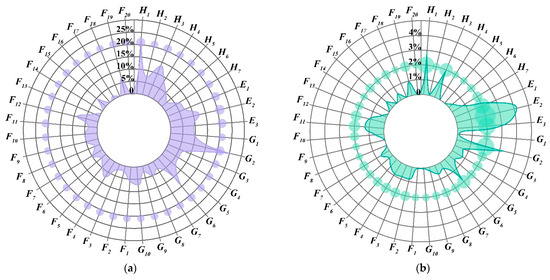
Figure 8.
Risk factor proximity centrality correction result. (a) Risk factor node closeness centrality; (b) Proximity centrality based on risk coupling value correction.
Based on the revised results (Figure 8b), it is evident that the out-degree values of environmental risk factors have experienced significant changes. The SNA model inadequately accounted for environmental factors during the construction of the risk factor association network, which led to biases in centrality calculations and inaccuracies in the assessment of critical factors. Nevertheless, following the revision that incorporated risk coupling values, these factors have been re-evaluated as primary contributors to accidents, thereby confirming the effectiveness of the model adjustments. This finding underscores that the multi-risk coupling capability associated with environmental risk factors is markedly more pronounced than that of other factors, highlighting its considerable significance.
In addition, the factors that still ranked higher include G2 (inadequate safety supervision), H1 (weak safety awareness), G6 (inadequate receipt and inspection), and H3 (irregular operation), which are still prominent. This is consistent with the ranking of risk factors before the correction, indicating that the results obtained after the correction using the actual case data coincide with the key risk factors obtained by applying social network analysis. The larger change after correction is human unsafe behavior, indicating that although human unsafe behavior can lead to dam failure accidents and is an important factor in the causal chain of accidents, it has less influence in the actual cases. The uncertainty of the environment is prone to failures of tailings storage facilities, which puts the tailings storage in an unsafe state and induces multi-risk coupling. Among them, the E2 (heavy rainfall) factor is the most prominent, for which a special plan should be developed during flood season to strengthen the safety management of tailings ponds.
5. Conclusions and Future Research
In this paper, the N–K model and SNA are applied to the field of tailings pond safety risk, the key risk factors of tailing pond dam failure accidents are analyzed, and the following conclusions are obtained:
- The results derived from the N–K model indicate that mitigating the coupling of multiple risk factors is a viable strategy for reducing the risk of tailing pond dam failures. Additionally, findings from the SNA reveal that flood discharge facility damage, inadequate safety supervision, inadequate receipt and inspection, insufficient flood capacity, and irregular operation exhibit high betweenness centrality within the risk network. Addressing these risk factors can effectively disrupt the connectivity of the risk network, thereby preventing the emergence of systemic risks.
- In the modified analysis results of the N–K/SNA model, inadequate safety supervision, heavy rainfall, weak safety awareness, inadequate receipt and inspection, and irregular operation are identified as the key risk factors for tailings dam failure. From a systematic risk coupling perspective, environmental factors exhibit a significant ability to induce multi-factor risk coupling and numerous uncertainties. Therefore, specific management of environmental risk factors is essential, alongside enhanced safety training for employees, improved facility reliability, and strengthened safety supervision to mitigate potential risks and achieve proactive risk management.
- This study employs the N–K/SNA model to explore the coupling mechanisms of multiple risk factors and identify key risk factors in tailings dam failure accidents, providing a novel approach to investigating the multi-factor coupling mechanism. However, certain limitations exist. We propose integrating advanced optimization algorithms into the current research framework to address deficiencies in resource optimization and decision support. Additionally, the causes of tailings dam failures are inherently complex, involving a vast array of risk points and factors. Yet, due to the limitations of available accident data, considering only 40 risk factors is insufficient. Furthermore, the analysis lacks an assessment of the influence of surrounding environmental factors, necessitating further research for improvement.
Author Contributions
Conceptualization, L.Y. and D.C.; methodology, D.C.; software, D.C. and S.L.; validation, L.Y., G.W. and Y.L.; formal analysis, S.L.; investigation, D.C.; resources, G.W.; data curation, B.L. and M.C.; writing—original draft preparation, L.Y. and D.C.; writing—review and editing, L.Y.; visualization, D.C.; supervision, L.Y. and S.L.; project administration, L.Y.; funding acquisition, S.L. All authors have read and agreed to the published version of the manuscript.
Funding
This research was funded by the National Natural Science Foundation of China Research on Slope Instability and Surface Deformation Behavior Patterns in High Altitude and Cold Mining Areas (grant number 53264020).
Institutional Review Board Statement
Not applicable.
Informed Consent Statement
Not applicable.
Data Availability Statement
The original contributions presented in the study are included in the article, further inquiries can be directed to the corresponding author/s.
Acknowledgments
The authors gratefully acknowledge the financial support for this project from the National Natural Science Foundation of China Research on Slope Instability and Surface Deformation Behavior Patterns in High Altitude and Cold Mining Areas (grant number 53264020). At the same time, they also acknowledge the contributions of the authors of the references cited and the valuable feedback received from reviewers and mentors.
Conflicts of Interest
Author Guolong Wang was employed by the company Yunnan Power Transmission and Transformation Engineering Co., Ltd., and authors Yanlin Li and Bin Li were employed by the company Yongshan Jinsha Lead-Zinc Mine Co., Ltd. The remaining authors declare that the research was conducted in the absence of any commercial or financial relationships that could be construed as a potential conflict of interest.
Appendix A
Table A1.
Statistics on 74 cases of tailings dam failure accidents from 1960 to 2022.
Table A1.
Statistics on 74 cases of tailings dam failure accidents from 1960 to 2022.
| No. | Time of Accident | Name of Tailing Dam | Cause of the Accident |
|---|---|---|---|
| 1 | August 1960 | Himeishan Tailings Dam | E2, G4, F17, F12, F20 |
| 2 | July 1962 | Yinshan Lead-Zinc Mine Tailing Dam | E2, F17, F12, F20, H1, G10, F6 |
| 3 | September 1962 | Huogudu Tailing Storage Facility | F1, F4, F14, G4, H1, G5 |
| 4 | March 1965 | EI Cobre Tailing Dam | E1 |
| 5 | March 1980 | Hebei Baimiaozi Tailing Dam | H1, G4 |
| 6 | October 1980 | Phelps Dodge Company Tailing Dam | E3, G7, F14 |
| 7 | July 1985 | Italy Preal Mineraia | F3, F7, F15 |
| 8 | August 1985 | Hunan Niujiaoqang Tailing Storage Facility | E2, F2, F20, F12, H2, G2, G6 |
| 9 | April 1986 | Huangmeishan tailing dam | H1, G2, G6, F7, F15, F14 |
| 10 | April 1988 | Lixigou tailing dam | H1, G1, F17, F15 |
| 11 | June 1993 | Panglao Iron Ore Mine Tailing Dam | H3 |
| 12 | July 1994 | Longjiao Mountain tailing dam | E2, H5, F20, F16, F15 |
| 13 | August 1995 | Cambior Inc Tailing Dam, Guyana | G5, H3, F16 |
| 14 | January 2000 | Romania Aurul S A tailing dam | E2, F2, F20 |
| 15 | September 2000 | Tailing dam at Polliton, Sweden | F17, H3, F13, F15 |
| 16 | October 2000 | Hongtu beneficiation plant tailing dam | G2, G6, G3, F10, F16, H3, G5 |
| 17 | June 2001 | Donggan Tailing Dam in Huanjiang County | E2, F10, F17, F12, F20 |
| 18 | July 2001 | Tailing dam at Dechang titanium mine site | E3, F8, F16 |
| 19 | July 2003 | Ying Beneficiation Plant Tailing Dam | E2, F2, F12, F20 |
| 20 | October 2003 | Cia Minera Cerro Negro | G2, G6, F4, F15 |
| 21 | July 2004 | Xingyuan Lead-Zinc Mining Company Tailing Dam | E1, E2, F18 |
| 22 | November 2004 | Teccominco tailing dams | E3 |
| 23 | December 2004 | Nandan Baojin Tailing Dam | H2, F3, E2, F20, F13, F15 |
| 24 | March 2005 | Niutoushan Copper Mine Tailing Dam | H5, F14 |
| 25 | May 2005 | Luchuan Kangwu Concentrator Tailing Dam | G10, H6 |
| 26 | May 2005 | Lonestar Mining Company Tailing Dam | E2, F20, F12 |
| 27 | November 2005 | Linfen Phoenix South Tailings Dam | G2, G3 |
| 28 | April 2006 | Zhen’an Gold Tailings Dam | G2, G3, G8, H7, F1, G4, F16 |
| 29 | April 2006 | Miaolinggou Iron Ore Mine Tailing Dam | E2, H6, F17, F12, F20 |
| 30 | July 2006 | Hanzhong Gold Mine Tailing Dam | E2, H5, F17, F13, F15 |
| 31 | July 2006 | Dadi Mining Company Tailing Dam | H4, G7 |
| 32 | August 2006 | Silverstone Concentrator Tailing Dam | E2, G7, H1 |
| 33 | December 2006 | Zijin Mining Shuiyindong Gold Mine Tailing Dam | G5, H3, G7, H2 |
| 34 | May 2007 | Shanxi Baoshan Mining Company Tailing Dam | H1, G1, F17, E2, F13, F19, F15, F16, G2, G6 |
| 35 | June 2007 | Luojiadun Gold Mine Tailing Dam | E2, H5 |
| 36 | November 2007 | Dingyang Mining Tailing Dam | H1, G8, H7, H3, F4, F14, G2, G6 |
| 37 | March 2008 | Sangxin Mining Company Tailing Dam | E3, G1, F17 |
| 38 | April 2008 | Hengyuan Mining Company Tailing Dam | H1, G3, F6, F17, F15 |
| 39 | April 2008 | Huao Tailing Dam | H3, G1 |
| 40 | April 2008 | Laibin Power Plant Tailing Dam | F9, F19, F13, F15, F14 |
| 41 | April 2008 | Maguan Zinc-Lead Tailing Dam | E2, G6 |
| 42 | May 2008 | Yanmen Sulfide Iron Ore Tailing Dam | G5, G10, F6, F17, F15 |
| 43 | May 2008 | Mudeng Refuge Tailing Dam in Jiegu | H1, G7, H3, F17, G8, H7 |
| 44 | June 2008 | Shantou Lianhuashan Tailing Dam | G2, G3, H3, F4, F15, F19 |
| 45 | July 2008 | Wulong Gold Mining Company Tailing Dam | H1, G10, F7, F17, F15, F14 |
| 46 | July 2008 | Shuiheng Tailing Dam | E3, F14, G2, G3, G8, G6, H7, F6, F17, F15, H1, G1 |
| 47 | September 2008 | Xiangfen Xinta Mining Company Tailing Depot | H3, G2, G3, G8, H2, F3, F16, F13, E2, G6 |
| 48 | October 2008 | Anhui Changshan Tailing Dam | G1, F17, F15 |
| 49 | May 2009 | Yunnan Luquan Tailing Dam | G2, H4, G3, F4, F16 |
| 50 | July 2009 | Donghang Tailing Dam of Ninglong Company | E2, G7 |
| 51 | July 2009 | Cave Tin Mine Tailing Dam | H3, F9, F19, F15 |
| 52 | August 2009 | Russian Karamken goldmine | G5, H36 |
| 53 | August 2009 | Hanin Huanglong Gold Mine Tailing Dam | H2, F8, F16 |
| 54 | February 2010 | Shanxi Wenxi Tailing Dam | H1, G3, F17 |
| 55 | June 2010 | Unidad Minera Caudalosa Chica | G2, G6, F5, F16 |
| 56 | July 2010 | Yinyu Minerals Company Tailing Dam | E2, E3 |
| 57 | October 2010 | MAL Magyar Aluminium | H1, G10, F7, F17 |
| 58 | October 2010 | Longtang Titanium Mine Tailing Dam | G5, H3 |
| 59 | March 2011 | Li Feng Mining Limited Tailing Dam | H1, G7, G1, F17, F15, G2, G3 |
| 60 | December 2011 | Xinfengyuan Mining Company Tailing Dam | G5, H3, F6, F17, F15 |
| 61 | December 2011 | Liujiagou tailing dam | H1, G10, F6, F17, F13, F15, G2, G6 |
| 62 | December 2012 | Former Gullbrige mine | H2, F1, G10, F20, F16, G2, G6 |
| 63 | December 2012 | Lengkengchong tailing dam | G5, H3 |
| 64 | April 2014 | Dajinzhuang Mining Tailing Dam | H1, G1, F9, F19, F13, F15 |
| 65 | August 2014 | Canadian Mt Polleytailing dam | F1, E3, F14 |
| 66 | November 2015 | Samarco Tailing Dam | E3, G7, F17, F15, H1 |
| 67 | March 2017 | Tailing Depot of Daye Nonferrous Metals Co. | E3, F14, H4, F4, F13, F9, G1, H1, G2, G6 |
| 68 | September 2017 | Liberia Gold Mine Tailing Dam | H6, F17, F15 |
| 69 | March 2018 | Cadia Tailing Dam, Australia | G10, G7, F20, H1 |
| 70 | January 2019 | Brazilian Brumadinho dam | H7, F3, F17, F15 |
| 71 | March 2020 | Yichun Luming Mining Company Tailing Depot | H1, G8, H7, H3, F6, F17, F15, F16, G2, G6 |
| 72 | April 2020 | Dam Creek Iron Ore Mine Tailing Dam | E2, F17, F12, F20 |
| 73 | January 2021 | Yichuan Mining Company Tailing Dam | H3, F16 |
| 74 | March 2022 | Doyle Aluminum Company Limited Tailing Dam | H1, G7, G1, G2, G3 |
Appendix B
Table A2.
Risk factor adjacency matrix.
Table A2.
Risk factor adjacency matrix.
| H1 | H2 | H3 | H4 | H5 | H6 | H7 | E1 | E2 | E3 | G1 | G2 | G3 | G4 | G5 | G6 | G7 | G8 | G9 | G10 | F1 | F2 | F3 | F4 | F5 | F6 | F7 | F8 | F9 | F10 | F11 | F12 | F13 | F14 | F15 | F16 | F17 | F18 | F19 | F20 | |
|---|---|---|---|---|---|---|---|---|---|---|---|---|---|---|---|---|---|---|---|---|---|---|---|---|---|---|---|---|---|---|---|---|---|---|---|---|---|---|---|---|
| H1 | 0 | 0 | 0 | 0 | 0 | 0 | 0 | 0 | 0 | 0 | 7 | 4 | 1 | 1 | 0 | 0 | 3 | 2 | 0 | 4 | 0 | 0 | 0 | 0 | 0 | 1 | 0 | 0 | 1 | 0 | 0 | 0 | 0 | 0 | 0 | 0 | 0 | 0 | 0 | 0 |
| H2 | 0 | 0 | 0 | 0 | 0 | 0 | 0 | 0 | 0 | 0 | 0 | 0 | 0 | 0 | 0 | 0 | 0 | 0 | 0 | 0 | 1 | 2 | 3 | 0 | 1 | 2 | 0 | 0 | 1 | 0 | 0 | 0 | 0 | 0 | 0 | 0 | 0 | 0 | 0 | 0 |
| H3 | 0 | 0 | 0 | 0 | 0 | 0 | 0 | 0 | 0 | 0 | 0 | 0 | 0 | 0 | 0 | 0 | 0 | 0 | 0 | 0 | 0 | 0 | 0 | 0 | 0 | 0 | 0 | 0 | 0 | 0 | 0 | 0 | 1 | 2 | 0 | 3 | 4 | 0 | 1 | 0 |
| H4 | 0 | 0 | 0 | 0 | 0 | 0 | 0 | 0 | 0 | 0 | 0 | 0 | 0 | 0 | 0 | 0 | 0 | 0 | 0 | 0 | 0 | 0 | 0 | 0 | 1 | 0 | 1 | 0 | 0 | 0 | 0 | 0 | 0 | 1 | 0 | 0 | 0 | 0 | 0 | 0 |
| H5 | 0 | 0 | 0 | 0 | 0 | 0 | 0 | 0 | 0 | 0 | 0 | 0 | 0 | 0 | 0 | 0 | 0 | 0 | 0 | 0 | 0 | 0 | 0 | 0 | 0 | 0 | 0 | 0 | 0 | 0 | 0 | 0 | 0 | 1 | 0 | 0 | 2 | 0 | 0 | 0 |
| H6 | 0 | 0 | 0 | 0 | 0 | 0 | 0 | 0 | 0 | 0 | 0 | 0 | 0 | 0 | 0 | 0 | 0 | 0 | 0 | 0 | 0 | 0 | 0 | 0 | 0 | 0 | 0 | 0 | 0 | 0 | 0 | 0 | 0 | 0 | 0 | 0 | 3 | 0 | 0 | 0 |
| H7 | 0 | 0 | 3 | 0 | 0 | 0 | 0 | 0 | 0 | 0 | 0 | 0 | 0 | 0 | 0 | 0 | 0 | 0 | 0 | 0 | 1 | 0 | 0 | 0 | 0 | 2 | 0 | 0 | 0 | 0 | 0 | 0 | 0 | 0 | 0 | 0 | 0 | 0 | 0 | 0 |
| E1 | 0 | 0 | 0 | 0 | 0 | 0 | 0 | 0 | 0 | 0 | 0 | 0 | 0 | 0 | 0 | 0 | 0 | 0 | 0 | 0 | 0 | 0 | 0 | 0 | 0 | 0 | 0 | 0 | 0 | 0 | 0 | 0 | 0 | 1 | 0 | 0 | 0 | 0 | 2 | 0 |
| E2 | 0 | 0 | 0 | 0 | 0 | 0 | 0 | 0 | 0 | 0 | 0 | 0 | 0 | 1 | 0 | 0 | 0 | 0 | 0 | 0 | 0 | 0 | 0 | 0 | 0 | 0 | 0 | 0 | 0 | 0 | 0 | 0 | 0 | 0 | 1 | 0 | 1 | 0 | 0 | 7 |
| E3 | 0 | 0 | 0 | 0 | 0 | 0 | 0 | 0 | 0 | 0 | 0 | 0 | 0 | 0 | 0 | 0 | 0 | 0 | 0 | 0 | 0 | 0 | 0 | 0 | 0 | 0 | 0 | 0 | 0 | 0 | 0 | 0 | 0 | 3 | 2 | 1 | 0 | 0 | 0 | 0 |
| G1 | 0 | 0 | 0 | 0 | 0 | 0 | 0 | 0 | 0 | 0 | 0 | 0 | 0 | 0 | 0 | 0 | 0 | 0 | 0 | 0 | 0 | 0 | 0 | 0 | 0 | 0 | 0 | 0 | 1 | 0 | 1 | 0 | 1 | 0 | 0 | 0 | 4 | 0 | 0 | 0 |
| G2 | 0 | 0 | 0 | 0 | 0 | 0 | 0 | 0 | 0 | 0 | 0 | 0 | 7 | 0 | 0 | 12 | 0 | 2 | 0 | 0 | 0 | 0 | 1 | 0 | 0 | 0 | 0 | 0 | 0 | 0 | 0 | 0 | 0 | 0 | 0 | 0 | 0 | 0 | 0 | 0 |
| G3 | 0 | 0 | 0 | 0 | 0 | 0 | 0 | 0 | 0 | 0 | 0 | 0 | 0 | 1 | 0 | 0 | 0 | 1 | 0 | 0 | 0 | 0 | 0 | 0 | 1 | 0 | 0 | 0 | 0 | 0 | 0 | 0 | 0 | 0 | 0 | 0 | 0 | 0 | 0 | 0 |
| G4 | 0 | 0 | 0 | 0 | 0 | 0 | 0 | 0 | 0 | 0 | 0 | 0 | 0 | 0 | 0 | 0 | 0 | 0 | 0 | 0 | 0 | 0 | 0 | 0 | 0 | 0 | 0 | 0 | 0 | 0 | 0 | 0 | 0 | 1 | 0 | 1 | 1 | 0 | 0 | 0 |
| G5 | 1 | 0 | 7 | 0 | 0 | 0 | 0 | 0 | 0 | 0 | 0 | 0 | 0 | 0 | 0 | 0 | 0 | 0 | 0 | 1 | 0 | 0 | 0 | 0 | 0 | 0 | 0 | 0 | 0 | 0 | 0 | 0 | 0 | 1 | 0 | 1 | 1 | 0 | 0 | 0 |
| G6 | 0 | 0 | 0 | 0 | 0 | 0 | 0 | 0 | 0 | 0 | 0 | 0 | 0 | 0 | 0 | 0 | 0 | 0 | 0 | 0 | 0 | 0 | 0 | 0 | 1 | 0 | 2 | 0 | 0 | 0 | 0 | 0 | 0 | 0 | 0 | 0 | 0 | 0 | 0 | 0 |
| G7 | 0 | 0 | 0 | 0 | 0 | 0 | 0 | 0 | 0 | 0 | 0 | 0 | 0 | 0 | 0 | 0 | 0 | 0 | 0 | 0 | 0 | 0 | 0 | 0 | 0 | 0 | 0 | 0 | 0 | 0 | 0 | 0 | 0 | 1 | 0 | 0 | 2 | 0 | 0 | 0 |
| G8 | 0 | 1 | 0 | 0 | 0 | 0 | 6 | 0 | 0 | 0 | 0 | 0 | 0 | 0 | 0 | 0 | 0 | 0 | 0 | 0 | 0 | 0 | 0 | 0 | 0 | 0 | 0 | 0 | 0 | 0 | 0 | 0 | 0 | 0 | 0 | 0 | 0 | 0 | 0 | 0 |
| G9 | 0 | 0 | 0 | 0 | 0 | 1 | 0 | 0 | 0 | 0 | 0 | 0 | 0 | 0 | 0 | 0 | 0 | 0 | 0 | 0 | 0 | 0 | 0 | 0 | 0 | 0 | 0 | 0 | 0 | 0 | 0 | 0 | 0 | 0 | 0 | 0 | 0 | 0 | 0 | 0 |
| G10 | 0 | 0 | 0 | 0 | 0 | 0 | 0 | 0 | 0 | 0 | 0 | 0 | 0 | 0 | 0 | 0 | 0 | 0 | 0 | 0 | 0 | 0 | 0 | 0 | 0 | 3 | 2 | 0 | 0 | 0 | 0 | 0 | 0 | 1 | 0 | 0 | 0 | 0 | 0 | 0 |
| F1 | 0 | 0 | 0 | 0 | 0 | 0 | 0 | 0 | 0 | 0 | 0 | 0 | 0 | 0 | 0 | 0 | 0 | 0 | 0 | 0 | 0 | 0 | 0 | 0 | 0 | 0 | 0 | 0 | 0 | 0 | 0 | 0 | 0 | 2 | 0 | 2 | 0 | 0 | 0 | 0 |
| F2 | 0 | 0 | 0 | 0 | 0 | 0 | 0 | 0 | 0 | 0 | 0 | 0 | 0 | 0 | 0 | 0 | 0 | 0 | 0 | 0 | 0 | 0 | 0 | 0 | 0 | 0 | 0 | 0 | 0 | 0 | 0 | 2 | 0 | 0 | 0 | 0 | 0 | 0 | 0 | 0 |
| F3 | 0 | 0 | 0 | 0 | 0 | 0 | 0 | 0 | 0 | 0 | 0 | 0 | 0 | 0 | 0 | 0 | 0 | 0 | 0 | 0 | 0 | 0 | 0 | 0 | 0 | 0 | 0 | 0 | 0 | 0 | 2 | 0 | 0 | 0 | 0 | 0 | 0 | 0 | 0 | 0 |
| F4 | 0 | 0 | 0 | 0 | 0 | 0 | 0 | 0 | 0 | 0 | 0 | 0 | 0 | 0 | 0 | 0 | 0 | 0 | 0 | 0 | 0 | 0 | 0 | 0 | 0 | 0 | 0 | 0 | 0 | 0 | 0 | 0 | 0 | 1 | 1 | 1 | 0 | 0 | 0 | 0 |
| F5 | 0 | 0 | 0 | 0 | 0 | 0 | 0 | 0 | 0 | 0 | 0 | 0 | 0 | 0 | 0 | 0 | 0 | 0 | 0 | 0 | 0 | 0 | 0 | 0 | 0 | 0 | 0 | 0 | 0 | 0 | 0 | 0 | 0 | 2 | 0 | 2 | 0 | 0 | 0 | 0 |
| F6 | 0 | 0 | 0 | 0 | 0 | 0 | 0 | 0 | 0 | 0 | 0 | 0 | 0 | 0 | 0 | 0 | 0 | 0 | 0 | 0 | 0 | 0 | 0 | 0 | 0 | 0 | 0 | 0 | 0 | 0 | 0 | 0 | 0 | 0 | 0 | 0 | 8 | 0 | 0 | 0 |
| F7 | 0 | 0 | 0 | 0 | 0 | 0 | 0 | 0 | 0 | 0 | 0 | 0 | 0 | 0 | 0 | 0 | 0 | 0 | 0 | 0 | 0 | 0 | 0 | 0 | 0 | 0 | 0 | 0 | 0 | 0 | 5 | 0 | 0 | 0 | 1 | 0 | 0 | 0 | 0 | 0 |
| F8 | 0 | 0 | 0 | 0 | 0 | 0 | 0 | 0 | 0 | 0 | 0 | 0 | 0 | 0 | 0 | 0 | 0 | 0 | 0 | 0 | 0 | 0 | 0 | 1 | 0 | 0 | 0 | 0 | 0 | 0 | 0 | 0 | 0 | 0 | 0 | 0 | 0 | 0 | 0 | 0 |
| F9 | 0 | 0 | 0 | 0 | 0 | 0 | 0 | 0 | 0 | 0 | 0 | 0 | 0 | 0 | 0 | 0 | 0 | 0 | 0 | 0 | 0 | 0 | 0 | 0 | 0 | 0 | 0 | 0 | 0 | 0 | 0 | 0 | 0 | 0 | 1 | 0 | 0 | 0 | 3 | 0 |
| F10 | 0 | 0 | 0 | 0 | 0 | 0 | 0 | 0 | 0 | 0 | 0 | 0 | 0 | 0 | 0 | 0 | 0 | 0 | 0 | 0 | 0 | 0 | 0 | 0 | 0 | 0 | 0 | 0 | 0 | 0 | 0 | 0 | 0 | 0 | 0 | 1 | 2 | 0 | 0 | 0 |
| F11 | 0 | 0 | 0 | 0 | 0 | 0 | 0 | 0 | 0 | 0 | 0 | 0 | 0 | 0 | 0 | 0 | 0 | 0 | 0 | 0 | 0 | 0 | 0 | 0 | 0 | 0 | 0 | 0 | 0 | 0 | 0 | 0 | 0 | 0 | 5 | 0 | 0 | 0 | 0 | 0 |
| F12 | 0 | 0 | 0 | 0 | 0 | 0 | 0 | 0 | 0 | 0 | 0 | 0 | 0 | 0 | 0 | 0 | 0 | 0 | 0 | 0 | 0 | 0 | 0 | 0 | 0 | 0 | 0 | 0 | 0 | 0 | 0 | 0 | 1 | 0 | 1 | 0 | 0 | 0 | 0 | 8 |
| F13 | 0 | 0 | 0 | 0 | 0 | 0 | 0 | 0 | 0 | 0 | 0 | 0 | 0 | 0 | 0 | 0 | 0 | 0 | 0 | 0 | 0 | 0 | 0 | 0 | 0 | 0 | 0 | 0 | 0 | 0 | 0 | 0 | 0 | 0 | 7 | 0 | 0 | 0 | 0 | 0 |
| F14 | 0 | 0 | 0 | 0 | 0 | 0 | 0 | 0 | 0 | 0 | 0 | 0 | 0 | 0 | 0 | 0 | 0 | 0 | 0 | 0 | 0 | 0 | 0 | 0 | 0 | 0 | 0 | 0 | 0 | 0 | 0 | 0 | 0 | 0 | 0 | 0 | 0 | 0 | 0 | 0 |
| F15 | 0 | 0 | 0 | 0 | 0 | 0 | 0 | 0 | 0 | 0 | 0 | 0 | 0 | 0 | 0 | 0 | 0 | 0 | 0 | 0 | 0 | 0 | 0 | 0 | 0 | 0 | 0 | 0 | 0 | 0 | 0 | 0 | 0 | 6 | 0 | 3 | 0 | 0 | 0 | 0 |
| F16 | 0 | 0 | 0 | 0 | 0 | 0 | 0 | 0 | 0 | 0 | 0 | 0 | 0 | 0 | 0 | 0 | 0 | 0 | 0 | 0 | 0 | 0 | 0 | 0 | 0 | 0 | 0 | 0 | 0 | 0 | 0 | 0 | 0 | 0 | 0 | 0 | 0 | 0 | 0 | 0 |
| F17 | 0 | 0 | 0 | 0 | 0 | 0 | 0 | 0 | 0 | 0 | 0 | 0 | 0 | 0 | 0 | 0 | 0 | 0 | 0 | 0 | 0 | 0 | 0 | 0 | 0 | 0 | 0 | 0 | 0 | 0 | 0 | 5 | 3 | 0 | 7 | 0 | 0 | 0 | 1 | 0 |
| F18 | 0 | 0 | 0 | 0 | 0 | 0 | 0 | 0 | 0 | 0 | 0 | 0 | 0 | 0 | 0 | 0 | 0 | 0 | 0 | 0 | 0 | 0 | 0 | 0 | 0 | 0 | 0 | 0 | 0 | 0 | 0 | 0 | 0 | 0 | 0 | 0 | 0 | 0 | 0 | 0 |
| F19 | 0 | 0 | 0 | 0 | 0 | 0 | 0 | 0 | 0 | 0 | 0 | 0 | 0 | 0 | 0 | 0 | 0 | 0 | 0 | 0 | 0 | 0 | 0 | 0 | 0 | 0 | 0 | 0 | 0 | 0 | 0 | 1 | 2 | 0 | 2 | 0 | 0 | 0 | 0 | 0 |
| F20 | 0 | 0 | 0 | 0 | 0 | 0 | 0 | 0 | 0 | 0 | 0 | 0 | 0 | 0 | 0 | 0 | 0 | 0 | 0 | 0 | 0 | 0 | 0 | 0 | 0 | 0 | 0 | 0 | 0 | 0 | 0 | 0 | 0 | 0 | 0 | 0 | 0 | 0 | 0 | 0 |
References
- Wu, M.; Ye, Y.; Hu, N.; Wang, Q.; Tan, W. Scientometric analysis on the review research evolution of tailings dam failure disasters. Environ. Sci. Pollut. Res. 2023, 30, 13945–13959. [Google Scholar] [CrossRef]
- Ribas, J.R.; Pérez-Díaz, J.I. A multicriteria fuzzy approximate reasoning approach for risk assessment of dam safety. Environ. Earth Sci. 2019, 78, 514. [Google Scholar] [CrossRef]
- Wang, S.; Yong, S.; Wanyin, W. Comprehensive Safety Evaluation of Tailings Reservoir Based on Fuzzy Multivariate Contact Model. Gold Sci. Technol. 2019, 27, 903–911. [Google Scholar]
- Wang, X.H.; Gu, X.W.; Xu, X.C.; Wang, Q. Risk evaluation of break-dam in mine tailings pond based on GA-AHP and cloud-matter element model. J. Northeast. Univ. (Nat. Sci.) 2017, 38, 1464. [Google Scholar]
- Dai, X.; Wu, X.; Hong, Y.; Xie, J.; Lin, D.; Chen, Y.; Liu, Y. Safety and stability evaluation of the uranium tailings impoundment dam: Based on the improved AHP-cloud model. J. Radiat. Res. Appl. Sci. 2022, 15, 21–31. [Google Scholar] [CrossRef]
- Li, Z.; Wang, T.; Ge, W.; Wei, D.; Li, H. Risk analysis of earth-rock dam breach based on dynamic Bayesian network. Water 2019, 11, 2305. [Google Scholar] [CrossRef]
- Chen, H.; Ye, Y.C.; Wang, Q.H.; Luo, B.Y.; Liu, R.; Wang, X.H. Tailings pond dam break risk classification study based on both ISM and factor frequency method. China Saf. Sci. J. 2018, 28, 150. [Google Scholar]
- Zhang, L.; Huang, Y.; Wu, X.; Skibniewski, M.J. Risk-based estimate for operational safety in complex projects under uncertainty. Appl. Soft Comput. 2018, 54, 108–120. [Google Scholar] [CrossRef]
- Xu, Z.K.; Liu, X.; Wei, B.W.; Zhang, L.; Wen, Y.B. Tailings dam risk fuzzy evaluation model based on the cloud model. Transf. Water Sci. Technol. 2016, 14, 122127. [Google Scholar]
- Frigerio Porta, G.; Bebbington, M.; Xiao, X.; Jones, G. Bayesian lifetime analysis for landslide dams. Landslides 2010, 17, 1835–1848. [Google Scholar] [CrossRef]
- Wang, W.; Wang, Y.; Wang, G.; Li, M.; Jia, L. Identification of the critical accident causative factors in the urban rail transit system by complex network theory. Phys. A Stat. Mech. Its Appl. 2023, 610, 128404. [Google Scholar] [CrossRef]
- Deng, J.; Liu, S.; Shu, Y.; Hu, Y.; Xie, C.; Zeng, X. Risk evolution and prevention and control strategies of maritime accidents in China’s coastal areas based on complex network models. Ocean Coast. Manag. 2023, 237, 106527. [Google Scholar] [CrossRef]
- Wang, Y.; Zhai, H.; Cao, X.; Geng, X. Cause Analysis and Accident Classification of Road Traffic Accidents Based on Complex Networks. Appl. Sci. 2023, 13, 12963. [Google Scholar] [CrossRef]
- Yang, J.F.; Wang, P.C.; Liu, X.Y.; Bian, M.C.; Chen, L.C.; Lv, S.Y.; Dou, Z. Analysis on causes of chemical industry accident from 2015 to 2020 in Chinese mainland: A complex network theory approach. J. Loss Prev. Process Ind. 2023, 83, 105061. [Google Scholar] [CrossRef]
- Miao, D.; Wang, W.; Liu, L.; Yao, K.; Sui, X. Coal mine roof accident causation modeling and system reliability research based on directed weighted network. Process Saf. Environ. Prot. 2024, 183, 653–664. [Google Scholar] [CrossRef]
- Qin, X.; Li, Z.X.; Zhao, Y.Q. A complex network model for analyzing risks and major hazards of tailing impoundments. Chinese.] Sys. Eng.-Theory Pract. 2017, 37, 1648–1653. [Google Scholar]
- Zhen, Z.; Wu, X.; Ma, B.; Zhao, H.; Zhang, Y. Propagation network of tailings dam failure risk and the identification of key hazards. Sci. Rep. 2022, 12, 5580. [Google Scholar] [CrossRef]
- Dai, J.Y.; Wang, W.W.; Huang, X.Q.G. Safety assessment of tailings reservoirdam break based on network cloud model. J. Saf. Environ. 2022, 22, 1–7. [Google Scholar]
- Hao, T.T.; Zheng, X.; Wang, H.; Xu, K.; Yu, Y. Development of a method for weight determination of disaster-causing factors and quantitative risk assessment for tailings dams based on causal coupling relationships. Stoch. Environ. Res. Risk Assess. 2023, 37, 749–775. [Google Scholar] [CrossRef]
- Liu, J.; Wan, L.; Wang, W.; Yang, G.; Ma, Q.; Zhou, H.; Lu, F. Integrated fuzzy DEMATEL-ISM-NK for metro operation safety risk factor analysis and multi-factor risk coupling study. Sustainability 2023, 15, 5898. [Google Scholar] [CrossRef]
- Xiong, M.; Wang, H.; Che, C.; Sun, M. Application of text mining and coupling theory to depth cognition of aviation safety risk. Reliab. Eng. Syst. Saf. 2024, 245, 110032. [Google Scholar] [CrossRef]
- Xiang, P.; Yang, Y.; Yan, K.; Jin, L. Identification of Key Safety Risk Factors and Coupling Paths in Mega Construction Projects. J. Manag. Eng. 2024, 40, 04024023. [Google Scholar] [CrossRef]
- Ding, J.; Han, X.; Ni, L. Research on multi factor coupling accident triggering mechanism and accident risk control of gas pipeline leakage. Emerg. Manag. Sci. Technol. 2024, 4, e009. [Google Scholar] [CrossRef]
- Shao, Z.G.; Zhang, J.X.; Wang, W. Coupling analysis of new energy vehicle combustion-explosion risk factors based on N–K model and SNA. J. Saf. Environ. 2023, 23, 363–371. [Google Scholar]
- Mendes, R.G.; do Valle Junior, R.F.; de Melo, M.M.A.P.; de Morais Fernandes, G.H.; Fernandes, L.F.S.; Pissarra, T.C.T.; Pacheco, F.A.L. Scenarios of environmental deterioration in the Paraopeba River, in the three years after the breach of B1 tailings dam in Brumadinho (Minas Gerais, Brazil). Sci. Total Environ. 2023, 891, 164426. [Google Scholar] [CrossRef]
- Lin, S.Q.; Wang, G.J.; Liu, W.L.; Zhao, B.; Shen, Y.M.; Wang, M.L.; Li, X.S. Regional distribution and causes of global mine tailings dam failures. Metals 2022, 12, 905. [Google Scholar] [CrossRef]
- Darbra, R.M.; Palacios, A.; Casal, J. Domino effect in chemical accidents: Main features and accident sequences. J. Hazard. Mater. 2010, 183, 565–573. [Google Scholar] [CrossRef]
- Suryoputro, M.R.; Sari, A.D.; Kurnia, R.D. Preliminary study for modeling train accident in Indonesia using Swiss Cheese Model. Procedia Manuf. 2015, 3, 3100–3106. [Google Scholar] [CrossRef][Green Version]
- Lower, M.; Magott, J.; Skorupski, J. A system-theoretic accident model and process with human factors analysis and classification system taxonomy. Saf. Sci. 2018, 110, 393–410. [Google Scholar] [CrossRef]
- Li, J.; Qin, Y.; Wang, Z.; Xin, Y. How to analyse the injury based on 24Model: A case study of coal mine gas explosion injury. Inj. Prev. 2021, 27, 542–553. [Google Scholar] [CrossRef]
- GB 39496-2020; Safety Regulation for Tailings Pond. Standardization Administration of China: Beijing, China, 2020.
- Zhang, W.; Zhang, Y. Research on coupling mechanism of intelligent ship navigation risk factors based on NK model. J. Mar. Sci. Technol. 2023, 28, 195–207. [Google Scholar] [CrossRef]
- Wu, B.J.; Jin, L.H.; Zheng, X.Z.; Chen, S. Coupling analysis of crane accident risks based on Bayesian network and the NK model. Sci. Rep. 2024, 14, 1133. [Google Scholar]
- Guo, J.; Luo, C.; Ma, K. Risk coupling analysis of road transportation accidents of hazardous materials in complicated maritime environment. Reliab. Eng. Syst. Saf. 2023, 229, 108891. [Google Scholar] [CrossRef]
- Zaefarian, G.; Misra, S.; Koval, M.; Iurkov, V. Social network analysis in marketing: A step-by-step guide for researchers. Ind. Mark. Manag. 2022, 107, A11–A24. [Google Scholar] [CrossRef]
- Shi, J.; Liu, Z.; Feng, Y.; Wang, X.; Zhu, H.; Yang, Z.; Wang, H. Evolutionary model and risk analysis of ship collision accidents based on complex networks and DEMATEL. Ocean Eng. 2024, 305, 117965. [Google Scholar] [CrossRef]
- Klockner, K.; Toft, Y. Railway accidents and incidents: Complex socio-technical system accident modelling comes of age. Saf. Sci. 2018, 110, 59–66. [Google Scholar] [CrossRef]
- Es’haghi, M.; Nikravesh, A.; Allah-Bakshi, H.; Yarahmadi, H.; Poursheikhali, E. Identifying the indicators influencing zero accident vision through social network analysis: Case study in a mine. Int. J. Min. Miner. Eng. 2022, 13, 185–204. [Google Scholar]
- Feng, J.R.; Zhao, M.; Yu, G.; Zhang, J.; Lu, S. Dynamic risk analysis of accidents chain and system protection strategy based on complex network and node structure importance. Reliab. Eng. Syst. Saf. 2023, 238, 109413. [Google Scholar] [CrossRef]
- Wang, N.; Yin, J.; Khan, R.U. Risk Coupling Assessment of Vehicle Scheduling for Shipyard in a Complicated Road Environment. J. Mar. Sci. Eng. 2024, 12, 685. [Google Scholar] [CrossRef]
- Wang, F.; Ding, L.; Love, P.E.; Edwards, D.J. Modeling tunnel construction risk dynamics: Addressing the production versus protection problem. Saf. Sci. 2016, 87, 101–115. [Google Scholar] [CrossRef]
- Yan, X.L.; Hu, X.J.; Wang, Y.Z. Coupling mechanism of safety risk in construction projects and the countermeasures: From the perspective of construction workers. Saf. Environ. Eng. 2016, 23, 106–113. [Google Scholar]


Disclaimer/Publisher’s Note: The statements, opinions and data contained in all publications are solely those of the individual author(s) and contributor(s) and not of MDPI and/or the editor(s). MDPI and/or the editor(s) disclaim responsibility for any injury to people or property resulting from any ideas, methods, instructions or products referred to in the content. |
© 2024 by the authors. Licensee MDPI, Basel, Switzerland. This article is an open access article distributed under the terms and conditions of the Creative Commons Attribution (CC BY) license (https://creativecommons.org/licenses/by/4.0/).