Article

Extending the IoT-Stream Model with a Taxonomy for Sensors in Sustainable Smart Cities

by
Rodrigo Santos 
1,*,†,
Gabriel Eggly
2,†,
Julián Gutierrez
1,† and
Carlos I. Chesñevar 
3,†
1
Department of Electrical Engineering and Computers, UNS, ICIC-CONICET-UNS, Bahia Blanca 8000, Argentina
2
Department of Electrical Engineering and Computers, UNS/LISSI-CICPBA-UNS, Bahia Blanca 8000, Argentina
3
Department of Computer Science and Engineering, UNS, ICIC-CONICET-UNS, Bahia Blanca 8000, Argentina
*
Author to whom correspondence should be addressed.
These authors contributed equally to this work.
Sustainability 2023, 15(8), 6594; https://doi.org/10.3390/su15086594
Submission received: 28 February 2023 / Revised: 20 March 2023 / Accepted: 7 April 2023 / Published: 13 April 2023
(This article belongs to the Special Issue Sustainable Cities: Challenges and Potential Solutions)

Abstract

:
Sustainable cities aim to have a lower environmental impact by reducing their carbon footprints as much as possible. The smart city paradigm based on the Internet of Things (IoT) is the natural approach to achieving this goal. Nevertheless, the proliferation of sensors and IoT technologies, along with the need for annotating real-time data, has promoted the need for light weight ontology-based models for IoT environments, such as IoT-Stream. The IoT-Stream model takes advantage of common knowledge sharing of the semantics while keeping queries and inferences simple. However, sensors in the IoT-Stream model are conceptualized as single entities, exluding further analysis concerning their features (energy consumption, cost, etc.) or application areas. In this article, we present a taxonomy of sensors that expands the original IoT-Stream model by facilitating the mapping of sensors/actuators and services in the context of smart cities in such a way that different applications can share information in a transparent way, avoiding unnecessary duplication of sensors and network infrastructure.

1. Introduction

The proliferation of ICTs, which started in the beginning of 21st century, has changed the way in which we live completely. These new technologies have considerably improved productivity in many scenarios and have created new business and activities for almost every aspect of life, including health, education, work, and entertainment, among others. With the enhancement of network bandwidth, the increasing computing power of processors, and the growth of memory capacities, the introduction of wireless protocols has allowed the development of new applications not feasible in the last century but of common use today (such as audio and video streaming). Real-time services [1,2] are now possible and are strongly connected with the underlying network infrastructure, and a large amount of technologies are available for different scenarios.
In this context, the Internet of Things (IoT) has consolidated itself as a new paradigm that allows one to integrate different ICTs seamlessly, providing an ecosystem consisting of web-enabled smart devices that use embedded systems (such as processors, sensors, and communication hardware) to collect, send, and act on data they acquire from their environments. IoT devices share the sensor data they collect by connecting to an IoT gateway or other edge device. Data are either analyzed locally or sent to the cloud for this. Sometimes, these devices communicate with other related devices and act on the information they get from one another. The devices do most of the work without human intervention, although people can interact with the devices—for instance, to set them up, give them instructions, or access the data.
IoT ecosystems provide the technological backbone for the deployment of smart cities, a term that has been a hot topic in the last decade. Indeed, one of the main reasons for the emergence of smart cities as a concept was to create a sustainable model for cities and preserve quality of life of their citizens, and this has prompted the definition of sustainable smart cities (SSCs). According to UNECE (United Nations Economic Commission for Europe), the notion of SSC “entails the implementation of technologies and strategies aimed at meeting today’s needs without compromising those of future generations. It is also about understanding the city itself—its identity, its goals, its stakeholders and their priorities. In this way, SSC projects can be tailored to the unique aspects of each city, supporting and developing them, while enhancing the living quality and sustainability of the city.” [3]. In order to better assess how sustainability is addressed in SSC, the UNECE, along with other international organizations, has worked on actions for identifying so-called key parameter indicators (KPIs) to be considered when measuring sustainability in SSC. KPIs are organized in a hierarchical structure around three basic dimensions (economic, environment, and society and culture) and several subdimensions, including a number convention to identify them [4]. The parameters are then divided in two subcategories, core and advanced, according to the relation they have to the main dimensions and sub-dimensions. Each KPI can be used to measure the development degree of a sustainable smart city in that specific area and eventually to guide the implementation of private and public actions to improve the indicators.
Thus, sustainability has become a central notion in smart cities (being a transversal dimension in our society nowadays). At the same time, the proliferation of sensors and IoT technologies, along with the need for annotating real-time data associated with the different devices involved in the above ecosystem, has promoted the need for light weight ontology-based models for IoT environments, such as IoT-Stream [5]. The IoT-Stream model takes advantage of common knowledge sharing of the semantics while keeping queries and inferences simple at the same time. Indeed, the main idea behind IoT-Stream is the simplicity of the information model, and especially the individual streams, which are the heavier part of the annotations (as they represent most of the information annotated).
In the context of IoT, sensors are considered as a prospective field. Ubiquitous sensing abilities offer shared information to develop a common operating picture, making it possible to create smart environments for various IoT applications. Nevertheless, sensors in the IoT-Stream model are conceptualized as single entities, without providing further analysis concerning their intrinsic features (energy consumption, application area, operational cost, etc.). Such features are extremely relevant when using a particular IoT model in SSCs, where economic and environmental needs of present and future generations are to be taken into account. There is indeed a sustainability-related impact that can be connected with different KPIs (as defined in [4]). Sensor technologies for solving the same problems may differ in several ways (e.g., some sensors provide high precision at the cost of higher energy consumption, whereas others have low precision but are very cheap from an energy viewpoint). Assessing which is the right sensor to use according to each IoT application involved, or deciding on a particular trade-off when solving SSCs needs, is therefore, very important.
In this article, we present a taxonomy of sensors that expands the original IoT-Stream model presented in [5] by facilitating the mapping of sensors/actuators and services in the context of smart cities in such a way that different applications can share information in a transparent way. The proposed taxonomy is based on the use of an identifier associated with the sensor being used, which allows one to identify several relevant features of every possible sensor (application area, sub-area, topic, and sensor type). We present a case study that illustrates the importance of making use of such a classification in the context of sustainable smart cities. We also analyze how the proposed taxonomy can be associated with different KPIs in the context of SSCs.
The rest of this article is structured as follows. First, in Section 2, we review relevant existing work on IoT and SSCs related to our proposal. In Section 3, we review some concepts of smart cities and sustainable smart cities, providing a summary of the IoT-Stream model in order to make this article self-contained. Then, in Section 4, we present an extension of the IoT-Stream model to handle sensors in a taxonomic way. We discuss some of the most common sensor types, considering the impacts of their features in the context of SSCs. We propose a taxonomy for sensors and illustrate how this taxonomy can be aligned with the KPI numbering convention for SSCs. Section 5 presents a brief case study, where we analyze the impact of our proposal in the context of SSCs. Finally, Section 6 outlines future research and concludes.

2. Related Work

To the best of our knowledge, there is no previous work that integrates a taxonomy of sensors with an IoT ontology (such as IoT-Stream), aiming at an improved model for sustainable smart cities. In what follows, we will sum up some of the most relevant contributions in the area of smart cities and sustainability related to our proposal.
Our approach to providing a taxonomy for sensors in an IoT ecosystem is particularly relevant when considering the notions of openness and a holistic view of IoT. In [6], the authors analyzed how openness represents the next key phase for smart cities, highlighting the importance of having an interoperable and scalable network infrastructure and an open management platform at the core. This enables cities to add vertical smart-city applications when appropriate and therefore, enables them to advance much more organically. Thus, an open architecture and platform also make it easier to scale projects and assure the ability to easily accommodate future needs without being locked in to proprietary technologies. A holistic review of the Internet of Things in smart cities is presented in [7]. The authors start by discussing the fundamental components that make up the IoT-based smart-city landscape, followed by the technologies that enable these domains to exist in terms of architectures utilized, the networking technologies used, and the artificial algorithms deployed in IoT based smart-city systems.
Emerging technologies for sensing and their impact in IoT-based models have been discussed extensively in the literature, but without resorting to a taxonomic view and selection mechanism as presented in this article. In [8], the authors provide an overview of smart cities’ concepts, characteristics, and applications, with a focus on emerging technologies. A review is provided that thoroughly investigates smart-city applications, challenges, and possibilities with solutions in recent technological trends and perspectives (such as machine learning and blockchain). Nevertheless, no taxonomy-based approach for handling sensors is given, as proposed in this paper. In [9], a comprehensive and thorough survey of ICT-enabled waste management models is introduced. Specifically, the authors focus on the adoption of smart devices as a key enabling technology in contemporary waste management and report on the strengths and weaknesses of various models to reveal their characteristics. This survey sets up the basis for delivering new models in the domain, as it reveals the needs for defining novel frameworks for waste management. In [10], the authors introduced an IoT architecture and a dynamic adaptation for the connectivity of new devices and devices with transient connections. The authors proposed a matching service to pair services and IoT devices considering the functional requirements and quality attributes.
Recent research has also focused on integrating different aspects from IoT and cyber-physical systems (CPSs), without referring to a taxonomic classification of the sensors/services, as done in this article. In [11], the authors revised the proposals for a middleware IoT layer. The purpose of this new layer would be to combine heterogenous hardware and software as the integrated system in the IoT. The authors discussed in the survey the requirements and challenges and presented the current state of research in this domain. A survey covering the main CPS architecture models available in the industrial environment is presented in [12], emphasizing their key characteristics and technologies, along the correlations among them, pointing out objectives, advantages, and contributions for the Industrial IoT introduction in I4.0. This survey also provides a literature review covering projects from CPSs and the IIoT point-of-view, identifying main technologies employed in current state-of-the-art and how they can meet the I4.0 key features of vertical and horizontal industrial integration.
There have been some approaches to classifying IoT sensors using a taxonomic view, without providing integration with an underlying ontology (as done in this article with respect to the IoT-Stream). Thus, for example, in [13], the authors introduced a taxonomy for IoT sensors based on dimensions, applications areas, and types of sensors. The dimensions and areas they proposed are industrial (agriculture, logistic, and plant floor), smart cities (transport, buildings, and environment), and healthcare (monitoring and management). Sensor types are classified according to motion, position, environment, mass measurement, and biosensors. While this approach is similar to a taxonomy, as proposed in our paper, it is limited to three dimensions, and there is no specific identification mechanism. In [14], the Internet of Everything (IoE) was presented as an extension of the IoT but involving people, services, and processes. The authors proposed a taxonomy for the IoE based on four categories: knowledge, type, observation, and capability. These categories are oriented toward the way the information is handled. This is different with respect to our proposal, as the purpose of our taxonomy is to provide a simple method to search and access data avoiding unnecessary duplication of sensors, reducing the associated infrastructure deployment. In [15], the authors proposed a taxonomy for the sensors, but the classification was made based on the way in which the data were acquired and read by the processors for their processing. They differentiated two types of sensors (digital and analog), and as a third element they include d the communication protocol. In our taxonomy, the sensor type is included as a specific dimension to provide reliability and precision information. We think is more important than the way in which the information reach the IoT device (communication protocol) or if its origin is analog or digital. In [16], the authors classified the IoT devices communications into four main types: device to device, device to cloud, device to gateway, and device to application. Although this approach is interesting, it is not oriented toward guiding the search for information and data on the IoT and its use in the different dimensions of sustainable smart cities, as done in this article. In [17], the authors proposed a taxonomy based on the definition of the “network of things” introduced by Voos [18] that is based on three building blocks: sensors, aggregators, and communication channels. Based on these elements, they defined a decision tree identifying different aspects related to each one. In contrast with our proposal, this approach does not provide the means to locate and identify sensors or services, nor for providing a taxonomic view of them. Finally, in [19], the authors presented an exhaustive investigation of the various applications and algorithms of the big-data analytics in 5G-driven IoT and industrial IoT systems. A detailed taxonomy of the existing analytical systems is provided, along with a discussion of the different challenges specific to the applications in an IoT environment. This approach, however, does not deal with an annotation system for classifying sensors, actuators, or services, as done in this article.

3. Sustainable Smart Cities and Iot-Stream: Fundamentals

“Smart Cities” or “intelligent cities” have emerged as cities that offer innovative solutions to improve the quality of life for urban communities in a sustainable and equitable manner, emerging as a possible solution to sustainability problems derived from rapid urbanization [20]. As pointed out by [21], it is estimated that 85% of the world’s population is expected to live in cities by 2050, which implies that urban centers will face a growing number of problems, such as (1) energy supply, (2) greenhouse gases emissions, (3) mobility systems planning, (4) raw materials and goods provision, and (5) the provision of health and security services.
The typical IoT architecture of a smart city has four layers: (i) sensing, (ii) communication, (iii) data, and (iv) services (Figure 1) [22,23]. In this generic IoT architecture, data flow from sensors attached to “things” through a network, before being eventually stored on a cloud-based corporate data center for processing, analysis, and storage. At the lower end, the sensing or perception layer holds the sensing and actuators components that interact with the environment and ultimately with the users or stake holders at the other end. The next layer is the network or transmission layer where several technologies are used (including mobile telephone 4G, low power wide area networks (LPWAN)—LoRa or Sigfox—Wi-Fi: IEEE 802.11, Bluetooth, ZigBee, satellite links, and wired Internet access). On top of this layer, a middleware or data-management layer is in charge of storing the data in databases and servers for its subsequent processing and sharing. At this layer, data fusion may be performed with some early processing before being consumed by the users or stake holders. On top of the middleware, the application layer provides services based on the rest of the stack. In this layer, industry-specific and/or company-specific applications can be used.
Figure 2 illustrates different dimensions on which a smart city may develop, taking as a basis the previous IoT layered model. At the middleware level, several service-oriented applications can be developed, covering a wide range of areas (e.g., traffic, transport, city-services, infrastructure, health, home, environment, energy, and education, among others) [7,23].

3.1. From Smart Cities to SSCs

The Sustainable Development Goals (SDGs), also known as the Global Goals, were adopted by the United Nations in 2015 as a universal call to action to end poverty, protect the planet, and ensure that by 2030, all people enjoy peace and prosperity [24]. The different SDGs are integrated; they recognize that action in one area will affect outcomes in others, and that development must balance social, economic, and environmental sustainability.
Providing a proper IoT model for sustainable smart cities is not an easy task. It must be noted that the layer model proposed in the literature is organized vertically, having no explicit relations among the different components within the same layer. Thus, when handling environmental issues in a smart city, we should consider not only the processing of data related to the quality of water and air as potential polluters, but also other related issues, such as traffic, industrial activities, and energy demand, among others. Along the same lines, traffic accidents usually injure people such that they should be hospitalized. The integration of a smart health service with the other smart services in the city would provide a better understanding of the situation. Consequently, a proper formal model is needed in order to interconnect the different dimensions shown in Figure 2, so that the middleware is capable of processing data streams coming from sensors, annotating the data and sharing them with the different applications involved. As we will discuss in the next subsection, lightweight ontologies provide a flexible solution for this problem.

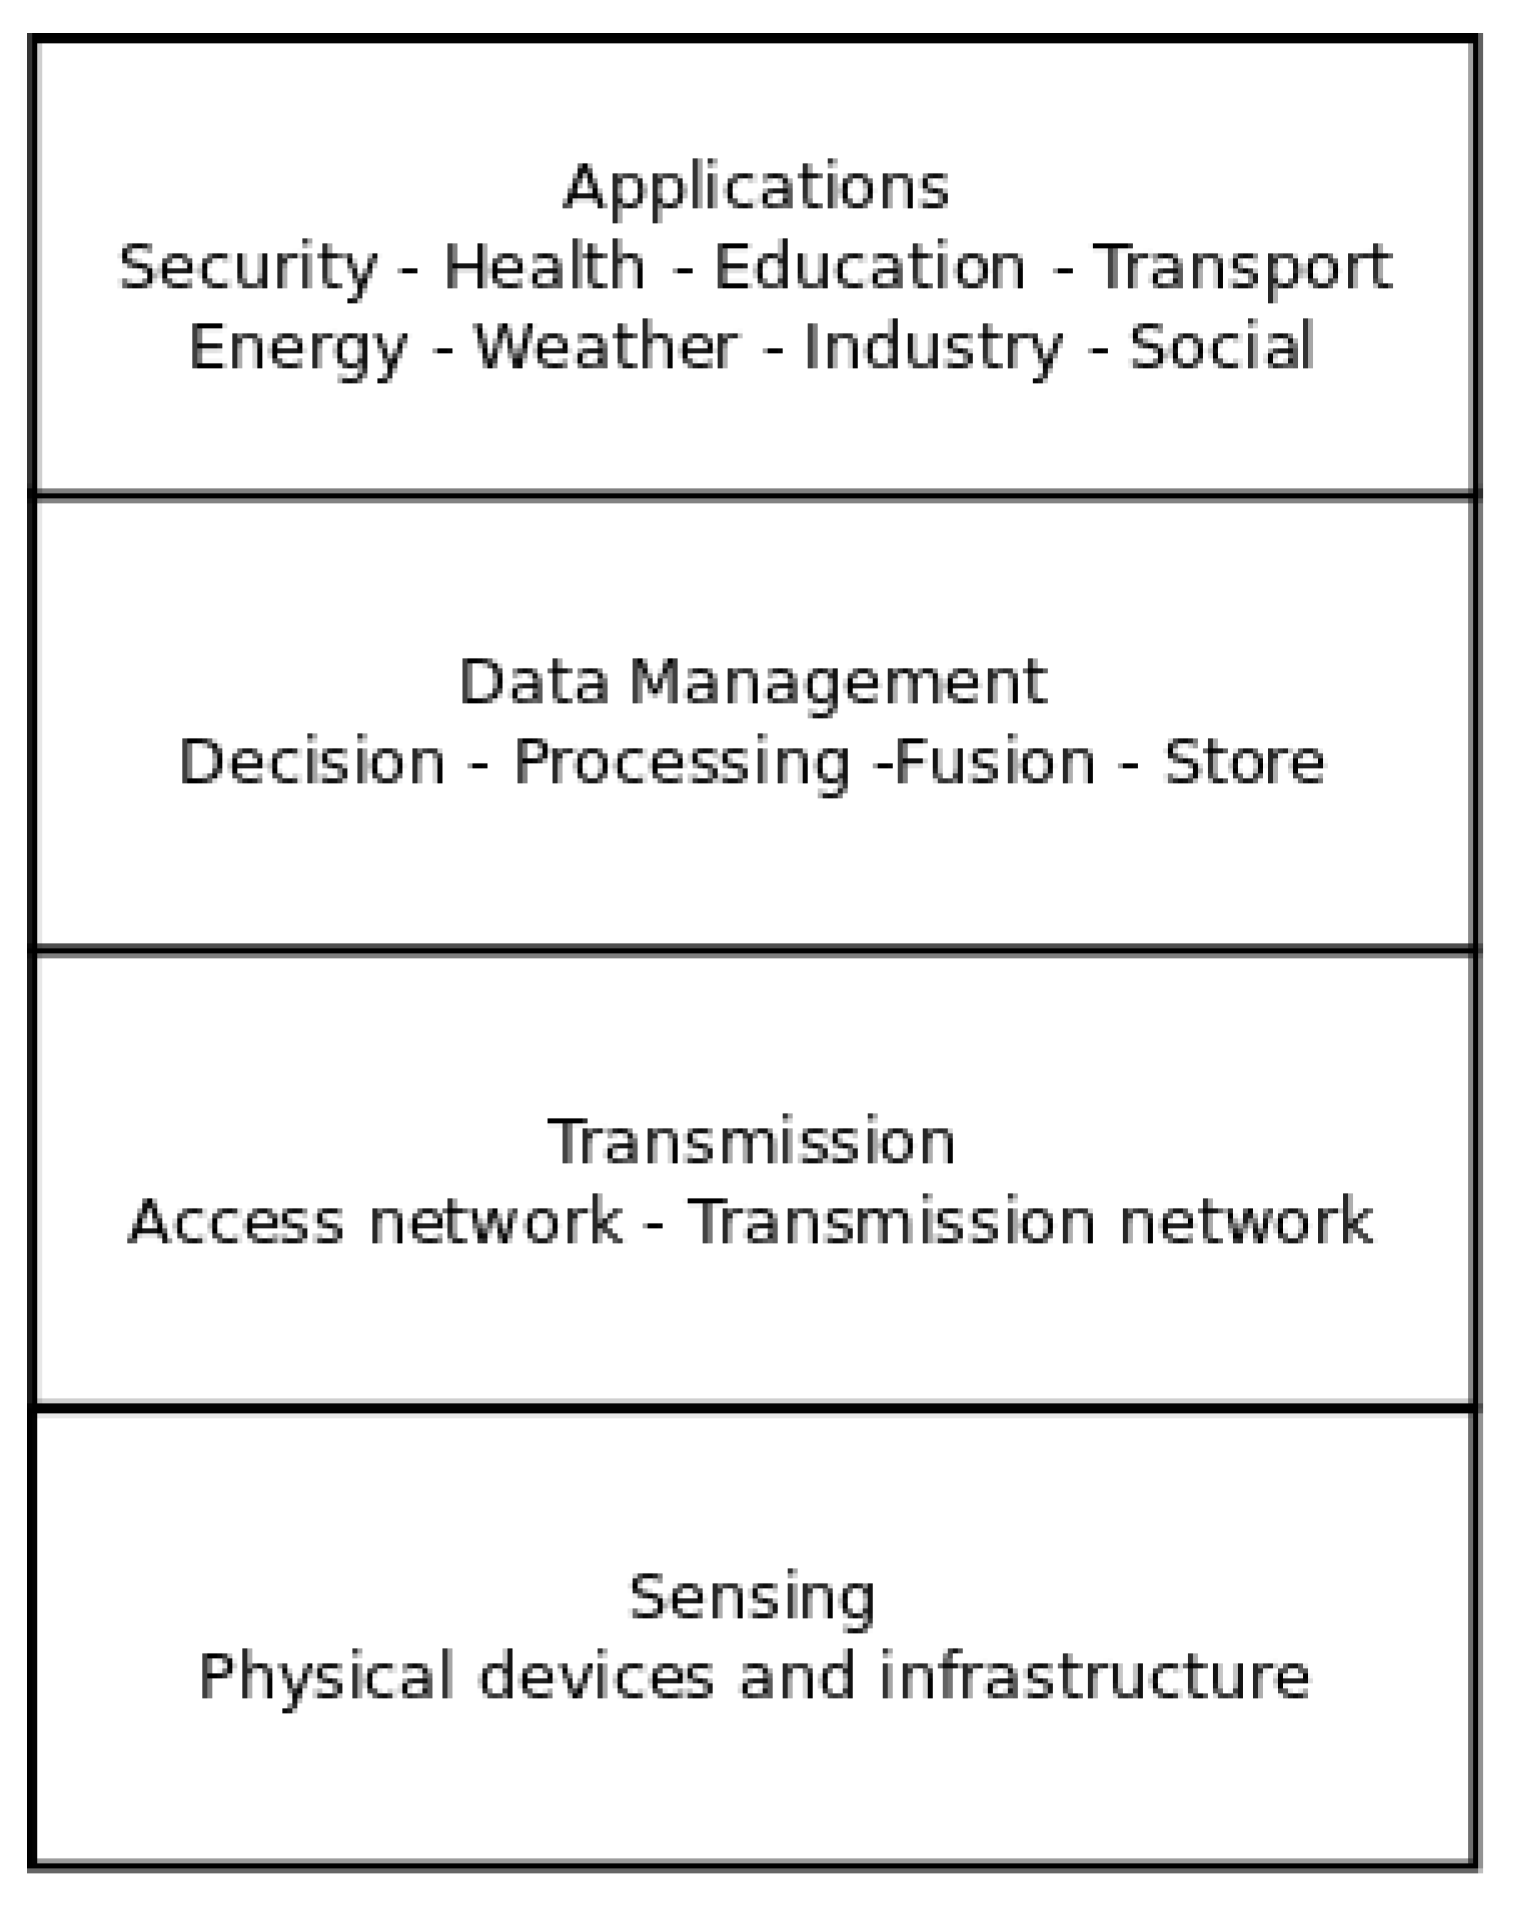
3.2. Iot-Stream: A Lightweight Ontology for IoT

Analyzing real-time data plays a significant role in modeling and understanding smart cities. The proliferation of IoT technologies [25] makes it possible to integrate different services and applications in a variety of areas (energy, transportation, health, education, etc.), where the raw data are provided by different types of sensors associated with the IoT ecosystem. However, annotating real-time data is a complex task, due to the heterogeneity of sources and technologies. Thus, ontology-based approaches have been developed in order to add semantics to an IoT-based model, taking into consideration that data are frequently updated, and inferences and queries are to be solved under real-time constraints. In particular, IoT-Stream [5] was proposed as a lightweight ontology for IoT data streams, oriented towards semantically annotated data streams. IoT-Stream is on its turn based on IoT-Lite, a lightweight instantiation of the semantic sensor network (SSN) ontology.
As explained in [5], the information model for IoT-Stream adopts several concepts to provide real-world context. Thus, spatial attributes are modeled on the basis of the W3C Geo ontology, which provides a set of basic concepts that represent the location of an entity (i.e., gesospatial properties), extended by other additional elements (relative location, relative altitude, etc.). A particularly important element in Iot-Stream is related to the generating sources of streams in the real world, namely, sensors. This is achieved by linking the SOSA sensor concept [26] to the IoT-Stream model. In fact, the SOSA ontology is a lightweight core for SSN ontology in W3C [27] that provides concepts for sensors, observation values, and other features of interest. Its purpose is to simplify the SSN ontology so as to allow its use with the generally limited-in-memory-and-computation-power IoT devices. Within the SSN ontology, sensors have fifteen classes and three properties. The SSN ontology defines a sensor as a sensing device that implements sensing. The associated classes are: accuracy, detection limit, drift, frequency, latency, precision, resolution, response time, sensitivity, selectivity, measurement range, and measurement property. All these describe the characteristics of the sensor device. IoT-Lite describes concepts in three classes: objects, system resources, and services. In the simplification, IoT-Lite reduces the sensor classes to just four: hasUnit, hasQuantity, hasMetadata, and SensingDevice.
Figure 3 shows the different components involved in the IoT-Stream model, highlighting the connections with other ontologies. Note that the class Sensor is defined as a single box within the SOSA ontology. Through the object properties defined by IoT-Lite, the QU ontology’s qu:QuantityKind and qu:Unit concepts are also linked [5]. For actual instantiations for these concepts, other taxonomies, such as QU-rec [28] and M3-lite [29], can be used. The concept of the sensor can be extended also to include platforms or even people that may act as human sensors, provided the mobile phones have become communication platforms with the possibility of informing in real-time what is going on [30].
In [26], the authors described sensors in SOSA as physical devices, but also simulations, numerical models, or even people (just to give a few examples). Such sensors respond to different stimuli (e.g., a change in the environment, or input data composed from the results of prior observations) to generate the results. Conceptually, they can be thought of as implementations (of parts) of an observation procedure. One or more sensors (and actuators and samplers) can be hosted on a platform. Such platforms can also define the geometric properties, i.e., placement, of sensors in relation to one another. Figure 4 presents an example from [26]. It must be remarked that SOSA does not provide explicit properties to model the geometry, but delegates this to ontologies dealing with space, metric, and topological properties, e.g., GeoSPARQL [31].
An important limitation in the IoT-Stream model is that sensors are considered as a collection of sensing devices based on different technologies which provide the basic input for the IoT architecture. Elements from this collection can be located using the associated URI (uniform resource identifier) corresponding to each sensor involved. This approach is indeed generic, but has two important drawbacks in the context of a sustainable IoT model:
  • Identifying possible sensing technologies related to different applications: Given the collection of sensors associated with the IoT model, it is difficult to classify them according to their underlying technology. Assume, for example, that an application connected to the IoT model makes use of the temperature in the city downtown in order to provide citizens with weather-related information. There may be several types of sensors in the IoT ecosystem that can provide this data, but not all of them will be useful (e.g., a sensor based on a thermocouple will provide a coarse temperature reading that is not useful for the application, whereas a reading based on a LM35 diode technology can read temperatures with high precision in certain ranges).
  • Finding alternative sensors as back-up solutions:
    Sensors in an IoT ecosystem may fail and become inactive for several reasons (malfunctioning, unexpected damage because of weather conditions, etc.). Therefore, the IoT model needs to be able to show “graceful degradation” when such a malfunctioning occurs. Having the ability to identify alternative sensors which might provide back-up hardware in such cases would be a significant improvement in IoT-Stream (and in any IoT model).
In the next section, we will propose a solution for the previous problem based on two elements, namely, a taxonomy for sensors and a sensor management table (or SMT for short). The taxonomy for sensors is intended to provide a number ID (similar to the one used in IP addresses), according to which sensors can be classified into different dimensions (intended use, underlying technology, etc.). Every sensor in the IoT-model will receive a taxonomic ID, along with the the URI associated within the IoT-Stream model. The SMT is intended to help monitoring which are the sensors currently being used, identifying their associated features (associated with their taxonomic IDs). The SMT will also provide a list of alternative sensors that can be used to ensure the sustainability of the sensor ecosystem (in case some particular sensor fails, or alternative solutions are required in terms of lower consumption requirements, etc.).

4. A Taxonomy for Sensors in Iot-Stream Oriented towards SSCs

In this section, we present a taxonomy for sensors that takes advantage of the ontology-based approach used in IoT-Stream. The basic idea is to provide a common hierarchical identification for the different sensors and related services with respect to each possible dimension in smart cities (as defined in Figure 2). Sensors are organized in terms of a tree-like structure, whose inner nodes correspond to relevant key terms when classifying sensors in the context of SSCs, namely: (a) dimension (corresponding to different categories, such as energy and education); (b) a application area (corresponding to a sub-category related to the dimension under consideration); (c) a sensed variable (corresponding to a variable V under analysis to be considered); and (d) a sensor type (corresponding to the specific sensor to be used for sensing the variable V). Next, we will show how this organization is possible by providing each sensor with a taxonomy ID within an ontology-based approach to IoT (such as the one provided by IoT-Stream).

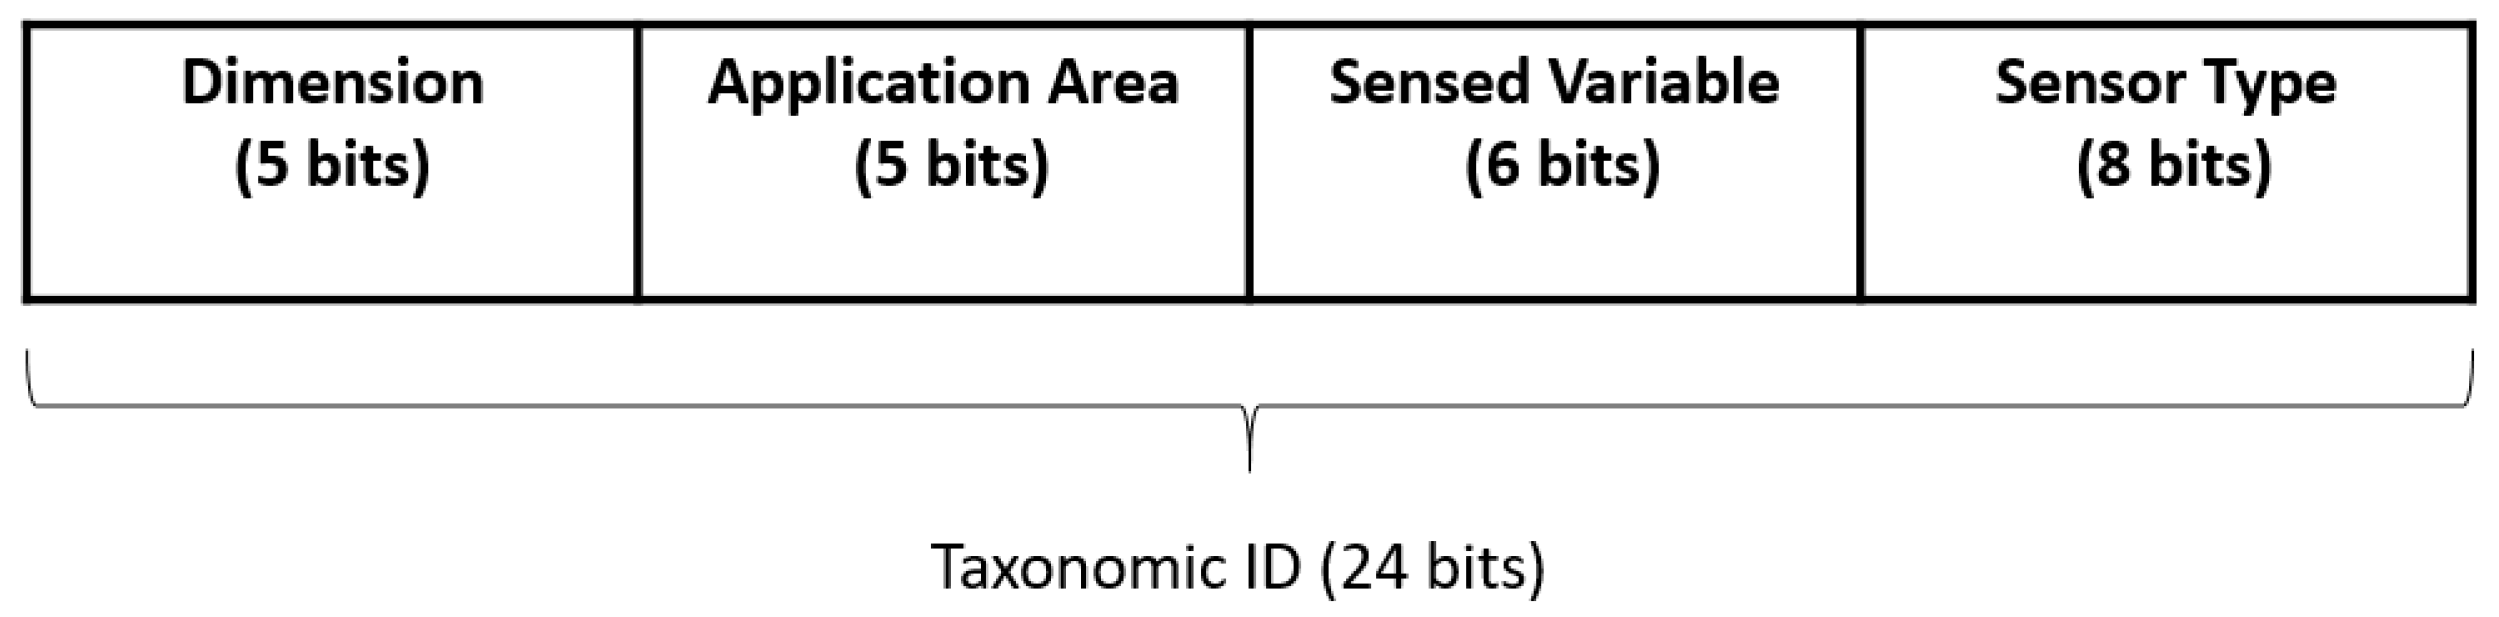
4.1. Providing IDs for Sensors: The Sensor Management Table (SMT)
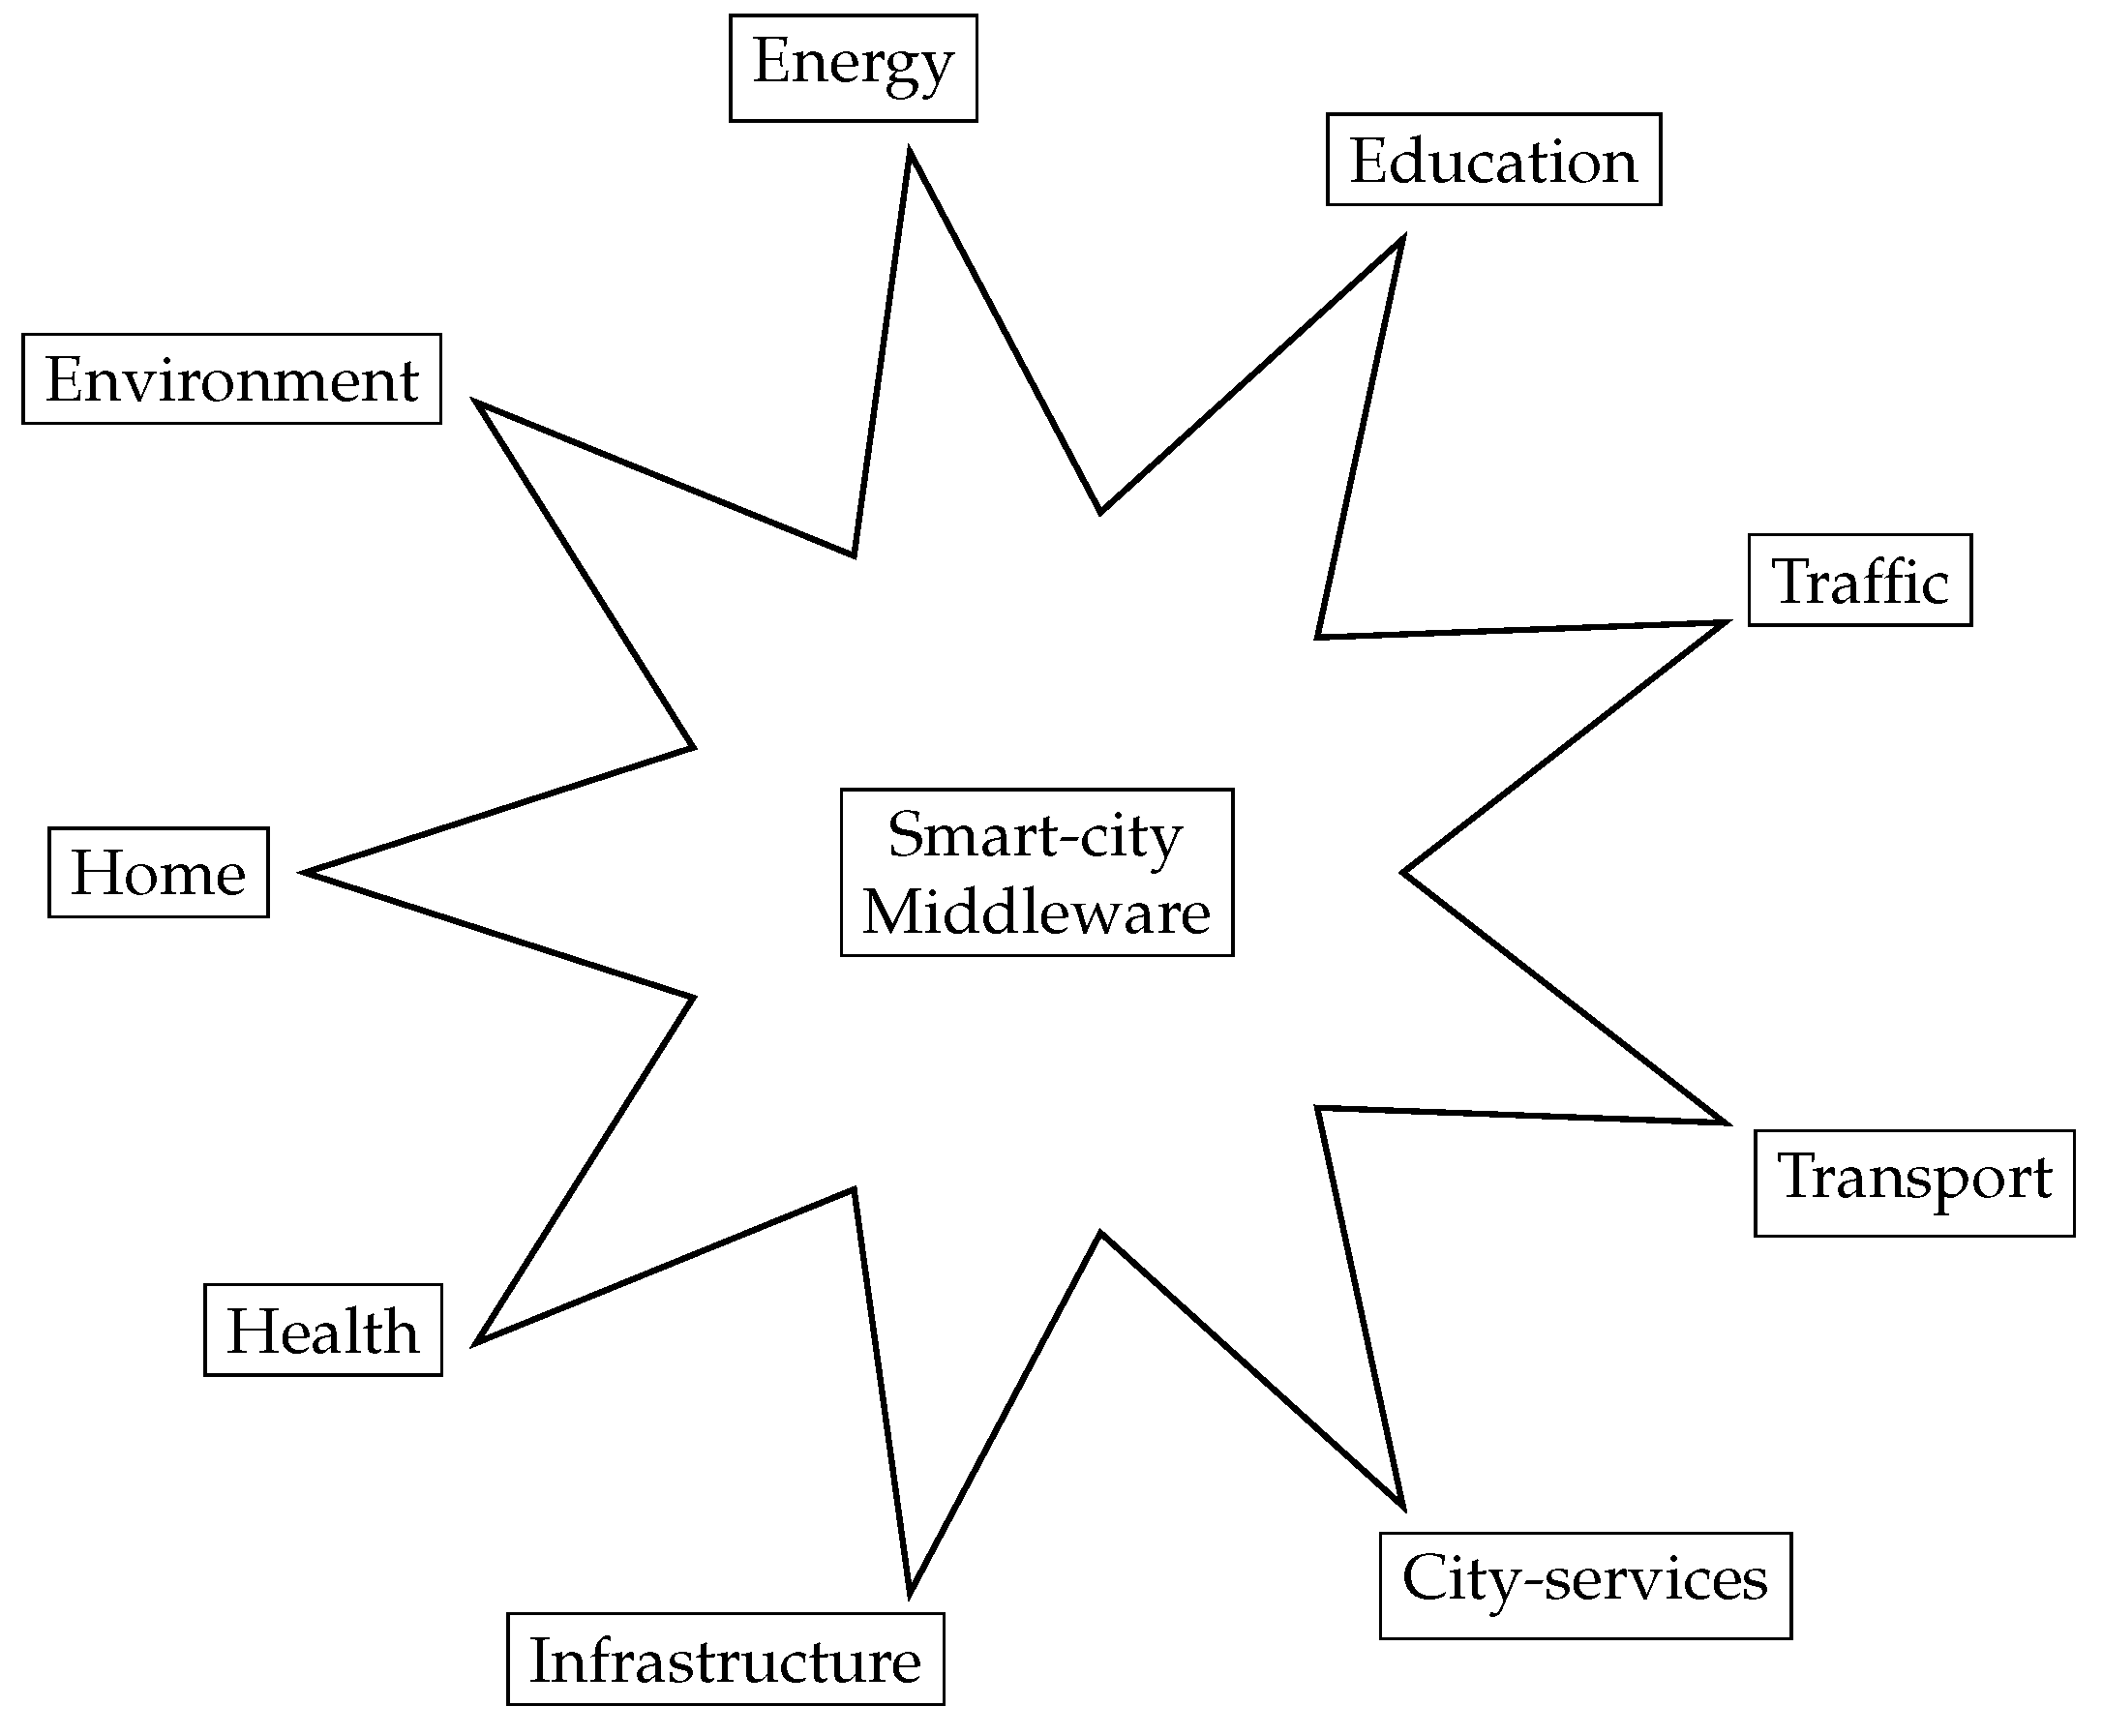
In our proposal, we will assume that every single sensor available in IoT-Stream is tagged with an ID. The ID is a 24-bit-long string, divided into four sections. Each section involving n bits corresponds to 2 n possible values. The proposed ID has some resemblance with Internet Protocol numbers (IPs), which are defined into different sections to identify the class of the network. Note that the number of 24 bits associated with an ID is defined on the basis of the cardinality of the different sets being considered in our proposal. In other scenarios, longer bit strings could be used, e.g., 36 bits, using the same underlying approach. Thus, with 24 bits, we can classify up to 16,777,216 different types of devices. For any ID number i d , the most significant bits in i d correspond to more general elements in the taxonomy, organized as follows:
  • Dimensions: The first 5 bits in i d (32 possible values) represent a number associated with the dimensions in a smart city being sensed with the sensor in the IoT-Stream ecosystem (energy, education, traffic, city-services, etc.). At the current stage, we consider only nine dimensions (as depicted in Figure 2), but other alternatives might be relevant (industry, tourism, etc.).
  • Application area: The second 5 bits in i d (32 possible values) correspond to some specific application area within the dimension under consideration (e.g., if the dimension is “environment”, possible application areas might be soil, water, or air).
  • Sensed Variable: the third six bits in the ID (64 possible values) correspond to the variable being sensed by the sensor associated with the ID (e.g., temperature, wind direction, or atmospheric pressure).
  • Sensor type: The fourth 8 bits (256 possible values) correspond to the type of sensor being identified, according to its technological features (e.g., mercury or aneroid, in the case of a sensor for atmospheric pressure).
The resulting 24-bit ID is stored as part of a record associated with each sensor. Figure 5 presents the format of the hierarchical identifier. In the sensor management table (SMT) (see the upper part of Figure 6), every record contains a device IoT ID (a row number associated with the sensor); the uniform resource identifier or URI (the directory path associated with the resource), the taxonomic id; extra features such as sensor position (latitude, longitude, height); and a list of pointers to alternative back-up sensors. Table 1 illustrates how the SMT is structured. The last column corresponds to the list of possible backup sensors, in case of possible failure or malfunctioning. Thus, for example, sensor 1 can be backed up by sensors 2 or 3 (note that all three sensors correspond to wind speed measurement).
The SMT aims at the ultimate goal of creating a public directory of sensing devices within the IoT ecosystem. In that way, at the set-up stage, all sensors publish their IDs and associated URIs, and any extra features (such as which backup sensors are available). Based on this information, upper layers services within the IoT model can request data or information from them. The public directory is managed by brokers within the network that can share data using, e.g., the MQTT extension (as proposed in [32]). Note that the taxonomic ID corresponding to every record in Table 1 is displayed using 4-value notation (corresponding to the different sections associated with a sensor’s ID). This notation is useful for applying bitmasking operations in order to easily detect sensors in the SMT satisfying some particular constraints (e.g., 30:40:xx:yy will correspond to environment sensors related to the application area “air”).
As explained before, the taxonomic ID notation includes information about the sensor/service type (4th section). This item is particularly relevant, as it provides information on which technology is being used for measuring variables (which is in its turn related to accuracy, precision, and reliability features of that technology). Thus, home-made sensors may indeed provide information that can be made available in the IoT public directories, but such sensors will probably have low reliability or accuracy (e.g., surveillance home cameras).
In some dimensions of smart cities, it is common to refer to services being provided rather than sensors being available. Consider, for example, a hospital, in which there is emergency service personnel which comes into action when a serious traffic accident occurs. Even in such cases, we must be aware that there are always underlying “sensing devices” of some sort which come into play for making this communication possible (e.g., the emergency doctor gets an alert message on his mobile phone from the traffic department; in such a case, the doctor will rush to immediate action, and his mobile phone can be seen as a “sensing device” in such an scenario). When dealing with services provided from some dimensions (e.g., health care, education, etc.), some categories will play the role of “application areas”, and subcategories may play the role of “variables” to be considered. For example, in the case of describing healthcare as a dimension, different “application areas” will include hospitals, medical centers, etc., and different variables will be associated with specific capabilities (e.g., intensive care units, maternity units, and image diagnosis, among others). An exhaustive description of the different kind of sensors and services in the context of a smart city is beyond the purpose of this article. The aim of our proposal is to provide the taxonomic structure in which the different elements involved can be characterized, so that experts can later complete the taxonomy through appropriate information.
For the sake of illustration, Appendix A presents a tentative taxonomy for the nine dimensions given in Figure 2 (indicating application areas, variables, and when possible, the associated types of sensors).
Figure 6 presents high-level descriptions of the different components in IoT-Stream with the proposed taxonomy directory (the upper part corresponds to the format associated with a single record in the SMT). The SMT sensors can be seen as devices with different features (URI, taxonomic ID, etc.), to be stored in a IoT registry with the ability to generate data to be published in an MQTT broker [32], associated with an analytic service. IoT-based applications will be able to subscribe to particular sensors, invoking the analytic service in order to solve different problems.
It must be remarked that sensors are at the lowest layer in the IoT, having a direct interaction with the physical environment. When characterizing ontologies, however, they are represented by a semantic annotation that describes the variable being measured along with some associated properties. A limitation in different formalizations (e.g., IoT-Lite, IoT-Stream, SOSA, and SSN) is that there is no clear identification on the type of sensor (considering its underlying technology) being used when producing measurements. This information is indeed important, as it is related to different features of the sensor (reliability, precision, accuracy, scope, etc.).

4.2. Example: Measuring Carbon Monoxide ( CO )

Let us consider an application needing to measure the presence of carbon monoxide ( CO ) in air. It is well known that CO is lethal in closed environments and causes several deaths every year by bad functioning of gas appliances in homes [33]. However, CO is also produced by diesel or gasoline vehicles in city streets. The problem of detecting CO levels is different in both cases and makes clear the importance of having a taxonomy where sensors can be oriented towards similar purposes but involving different application areas.
There may exist home- or public-building sensors that control the presence of this gas to prevent people from gas poisoning (e.g., in the case of a heater not working properly), such sensors cannot be used for providing information on the CO level in a downtown street. Both sensors can be based on similar hardware and purposes, but their roles are semantically different. There are several companies that provide sensors for both applications areas, in the context of smart homes (https://www.fibaro.com/en/products/co-sensor/ last accessed 12 April 2023) and smart environments (https://www.pranaair.com/solutions-by-industry/environmental/ lasta accessed 12 April 2023), respectively. In the previous scenario, for each CO sensor, a different taxonomy ID should be defined, according to the associated application area. Note that if both sensors share the same technological features, the last 8 bits associated with their IDs will be the same (as they correspond to the sensor type and associated technology).
Assume now that according to a sustainability study, all CO sensors based on a particular technology have to be replaced by new ones (based on an alternative, more sustainable technology). The SMT facilitates performing such an updating task, by identifying all sensors to be removed by matching the last 8 bits associated with their taxonomic ID. This simple example shows the power of having a taxonomic representation of sensors for updating an IoT ecosystem according to sustainability issues based on the use of particular technologies. A more detailed discussion concerning these issues is provided in Section 5.

5. Sustainability in Smart Cities: A Case Study

Smart cities’ applications are related to the different dimensions mentioned in Figure 2. However, it is clear that they are not independent of each other and that the information generated in the context of an application in one dimension can be used by any other application in the different dimensions. To take advantage of this, the middleware on which all the dimensions converge should provide a proper directory of data or processed information. The use of IoT-Stream/SOSA and IoT-Lite ontologies helps in the identification of data streams with the semantic information provided. While for IoT-Stream, the authors suggest the use of MQTT servers, we proposed a more elaborated resource than that provided by the Software Real-Time Interaction Protocol (SRTI) [32].
We chose MQTT (Message Queuing Telemetry Transport) as an underlying protocol due to its widespread use in IoT applications. MQTT [34] is a lightweight, low-power messaging protocol that makes uses of publish–subscribe operations to exchange information between clients and the server, providing simple, reliable connections with limited network bandwidth. Another option is CoAP [35], but it does not provide the possibility of incorporating a directory and special functions to add intelligence at that stage of the data processing. Additionally, the MQTT server has a special “intelligent real-time agent” that has the ability to instrument functions on the data published by sensing nodes in order to provide subscribers with the appropriate information. The MQTT-SRTI servers are geographically distributed in such a way that publishers are connected to the closest one. Data are organized by topics related to the ontology, and the subscribers may require new functions to be implemented in the context of the IRTA. Through the integration of the preceding elements, our proposal for a taxonomy for sensors is able to identify sensors and services within the IoT ontology through the sensor management table (SMT). Its hierarchical formulation allows for a quick search within the IRTA directory and the use of the information by different applications. In what follows, we describe a case study and relate it with the KPIs (key performance indicators) introduced by UNECE [3].

Case Study

Environment and traffic are two dimensions that are related. Vehicles’ engines produce pollutants such as carbon monoxide and dioxide ( CO and CO 2 , respectively), formaldehyde ( CH 2 O ), benzene ( C 6 H 6 ), and several other hydrocarbons. They are also an important source of noise that is considered as a pollutant too. The air quality in cities affects the quality of life of people, as some respiratory diseases have their origin in the presence of these chemical elements. The number of vehicles circulating within a city is important, but so is the way in which they move—traffic flow and throughput being of major importance. Several applications provide assistance to drivers at the moment of choosing the best route to follow while driving, depending on different parameters (e.g., estimated distance to travel, estimated time of arrival, or paths that include tolling stations). Thus, the information collected for the traffic flow determination is useful to computing the degree of pollutants being produced in certain areas within a city; in the same way, the presence of certain levels of gases may indicate the number of vehicles in a certain region.
Following our proposal, the taxonomy can clearly help in the search of sensors. The ID of each kind of sensor can be used to request the available list of sensors/data within the IRTA directory. Thus, for example, when dealing with traffic in highways, tolling stations provide the best knowledge about the number of cars on the road. These data are clearly identified in the taxonomy with traffic/traffic control/toll station/automatic or traffic/traffic control/toll station/manual. In the case of streets or avenues within cities, this information is searched through the combination traffic/traffic control/car count/cameras,
Traffic/traffic control/car count/pressure sensors, or traffic/traffic control/car count/rfids, etc. (see Appendix A for more details). The richness of the taxonomy identification for sensors provides the application developer with a wider range to choose the best possible information source from. The air quality may be measured with several sensors. In this case, the search can be specifically oriented, as the taxonomy considers the CO 2 and CO sensors, among others, following some specific paths in the hierarchy (e.g., environment/air/CO/NIR, or environment/air/other gases/electrochemical).
Weather information, specially that related to wind direction and speed, provides estimates of the probable movement of pollutants in the air. In fact, while the wind can sometimes disperse the gases produced by vehicles or industries, it can also concentrate them in densely populated areas. Therefore, weather conditions can help to indicate the locations of the pollutant sources.The application for air quality might therefore refer to other sensors for wind direction and speed (to be found under environment/air/wind direction/vane and environment/air/wind speed/cups in the taxonomy). Rainfall records also provide important information in cities with rapidly rising rivers, especially those in mountain valleys environment/water/level/river. The flooding of streets makes driving or walking dangerous. The information obtained from the infrastructure dimension becomes relevant so as to alert drivers on the best routes to follow, avoiding certain areas and indicating if bridges and streets are open to transit: infrastructure/bridges/operation/open and infrastructure/streets/operation/open.
The use of proper sensors for each variable related to a particular application is indeed important, as this is directly related to the quality and reliability of the sensed information (as discussed in the CO example in the previous section). The measurements should also be performed within a limited time frame for the values to be consistent. In this context, the proposed taxonomy plays also an important role, as it can provide the necessary information on the sensors to be used as data sources. Thus, for example, the presence of NO 2 has better reliability if detected with a catalytic diffusion sensor rather than with an NDIR (nondispersive infrared detector). This makes IoT-related applications more reliable and flexible, improving the user satisfaction and the overall performance of the IoT ecosystem. A similar approach has been recently proposed in [36].
The UNECE defines three KPIs (key parameter indicators) related to traffic management in the economic dimension, sub-dimension ICT, category transport: traffic congestion, traffic monitoring, and intersection control [4]. In the first case, the KPI is used to tell people about the time needed to complete a trip within the city. The second one allows the monitoring of traffic in highways and main avenues/streets. The third indicator is related to the possibility of changing traffic lights’ synchronization or even traffic direction at certain hours to improve the traffic flow based on data obtained from the sensors. The air pollution KPI is found in the dimension Environment, sub-dimension environment, category air quality. The air-quality index is based on the presence of NO 2 (nitrogen dioxide), SO 2 (sulfur dioxide), particulate matter (PM10 and PM2.5), and O 3 (ozone). KPIs are used to measure the degree of sustainability of the smart cities. Improving these parameters implies improving the quality of life of the citizens with respect to the environment, reducing the negative impact of people’s carbon footprint. The introduction of the taxonomy helps this by providing application developers the possibility of choosing the best sensor/actuator or service to provide a particular parameter and to share this information in a transverse way, preventing unnecessary duplication of sensors and eventually network infrastructure.

6. Conclusions and Future Work

In this article, we have proposed a taxonomy of sensors that expands the original IoT-Stream model by facilitating the mapping of sensors/actuators and services in the context of sustainable smart cities. Our proposal extends the original IoT-Stream framework, avoiding unnecessary duplication of sensors and network infrastructure, which is in itself expensive. Within the IoT ecosystem, the taxonomy is handled through a sensor management table (SMT) which provides a fast identification system when looking for alternative resources (sensors). We have presented a case study based on the IoT-Stream model that illustrates how the proposed taxonomy and the associated sensor management table can help to improve sustainability and the overall reliability of the IoT ecosystem.
We contend that the deployment of IoT models (such as the one provided by IoT-Streams and the extension to include a taxonomy for sensors, as proposed in this article) will play a major role in the coming years. Indeed, the COVID-19 pandemic has been a worldwide crisis which has shown the importance of virtualization. Countries in general (and cities in particular) that were prepared to operate with digital services had better tools to deal with the different challenges to be faced during quarantine and self-isolation periods. The lack of access to Internet and services for different aspects of everyday life (e-commerce, e-health, e-government, e-education, etc.) shows the worst face of the digital gap between developed and underdeveloped societies. The introduction of IoT as the basis of smart environments is an important resource not only to shorten this gap, but also to work in the path of sustainability. Reducing the carbon footprint by diminishing traffic, saving energy through better street lightning systems, and monitoring the environment for early detection of problems are just some of the possible benefits resulting from the implementation of IoT-based models. Our proposal goes in line to strengthening sustainability capabilities in IoT models, by providing a flexible classification and selection mechanism for sensing devices within the IoT ecosystem.
At the current extent of our research, we have not carried out an extensive quantitative analysis of our proposal, as a full-fledged deployment of our approach would be needed in order to collect enough experimental data. The case study analyzed in Section 5 provides a conceptual view of the feasibility of our proposal in technical terms, and shows the flexibility and impact of our approach in the context of dealing with KPIs (key performance indicators) in sustainable smart cities. In order to perform a more exhaustive empirical analysis, our future work will involve the deployment of the taxonomy and the sensor management table to validate their operation in a real-world scenario. As a case study, we are planning to work on the industrial petrochemical pole in the city of Bahía Blanca (Argentina), where the estimation of vulnerability due to technological risks has been under study [37]. Due to its closeness to populated areas, risk management is essential to developing integral actions to address disaster scenarios. As a response, the city of Bahía Blanca has implemented a monitoring system with several sensors measuring pollutants in the region. We think that the use of an IoT model, along with the taxonomy for sensors we have developed, can enhance the reliability of the existing monitoring system, providing better management for keeping real-time pollution records.

Author Contributions

Conceptualization, R.S. and C.I.C.; methodology, C.I.C. and R.S.; validation, G.E. and J.G.; formal analysis, C.I.C.; investigation, J.G. and G.E.; data curation, R.S.; writing—original draft preparation, R.S.; G.E. and C.I.C.; writing—review and editing, C.I.C. and R.S.; visualization, G.E.; supervision, C.I.C.; funding acquisition, R.S. and C.I.C. All authors have read and agreed to the published version of the manuscript.

Funding

This research was funded by CONICET PUE Project “Diseño y Desarrollo de Soluciones Inteligentes para la Innovación Digital en el Contexto de Servicios Públicos a Nivel Municipal y Regional” (2019–2023). ICIC CONICET UNS, Bahía Blanca, Argentina; and Universidad Nacional del Sur, PGI “INTEGRACIÓN DE SISTEMAS DE TIEMPO REAL: HARDWARE-SOFTWARE. III”.

Institutional Review Board Statement

Not applicable.

Informed Consent Statement

Not applicable.

Data Availability Statement

No new data were created or analyzed in this study. Data sharing is not applicable to this article.

Conflicts of Interest

The authors declare no conflict of interest.

Appendix A. A Taxonomy for Sensors: Details

In what follows, we detail a possible taxonomy for sensors following the discussion given in Section 4. For each proposed dimension in the smart-city model, some areas and variables, along with different kinds of sensors or services, are described. Note that this is not an exhaustive description of all possible sensors to be used in a smart-city model, as a full-fledged analysis is beyond the purpose of this work. When deploying the taxonomy in an actual IoT ontology (such as IoT-Stream), experts in sensor technologies may include those extra dimensions and areas that they consider to be relevant.
Environment Soil Conductivity < T y p e s   o f   s e n s o r s > ph < T y p e s   o f   s e n s o r s > Water Temperature < T y p e s   o f   s e n s o r s > ph < T y p e s   o f   s e n s o r s > Arsine < T y p e s   o f   s e n s o r s > Turbidity < T y p e s   o f   s e n s o r s > Level sensors Rivers Lakes Sea Air Temperature T h e r m o c o u p l e R T D   ( R e s i s t a n c e   t e m p e r a t u r e   d e t e c t o r ) T h e r m i s t o r S e m i c o n d u c t o r   b a s e d Wind direction < T y p e   o f   s e n s o r s > Wind Speed C u p s V a n e H o t w i r e P i t o t t u b e Humidity < T y p e   o f   s e n s o r s > Atmospheric pressure < T y p e   o f   s e n s o r s > Rainfall < T y p e   o f   s e n s o r s > CO 2 N D I R E l e c t r o c h e m i c a l C a t a l y t i c   D i f u s s i o n Other gases N D I R E l e c t r o c h e m i c a l C a t a l y t i c   D i f u s s i o n Noise < T y p e   o f   s e n s o r s >
In the case of the environment dimension, we include three different areas: air, soil, and water. In the case of air, we include various types of variables, such as those related to weather conditions (temperature, atmospheric pressure, humidity, wind direction, and speed), rainfall record, and the presence of the main pollutants ( CO , C O 2 , N O 2 , and many others). It must be noted that the list of types of sensors is not exhaustive, representing only some of those of more widespread use. The entry <Type of sensors> denotes that for the sake of simplicity, the different types of the possible sensors are not explicitly listed.
T r a f f i c = P a r k i n g O n - s t r e e t T y p e   o f   s e n s o r s O f f - s t r e e t T y p e   o f   s e n s o r s G a r a g e T y p e   o f   s e n s o r s T r a f f i c   c o n t r o l T r a f f i c   l i g h t s R e d / Y e l l o w / G r e e n T u r n   l e f t P e d e s t r i a n I n t e r m i t e n t C a r   c o u n t C a m e r a s P r e s s u r e   s e n s o r s R F I D S p e e d   c o n t r o l C a m e r a s L i D A R I n f r a r e d T o l l s t a t i o n s A u t o m a t i c M a n u a l
Traffic is an important dimension in any smart-city model, as it represents one of the main problems in the development of modern cities, being connected with other dimensions (e.g., transport and environment). There are two areas we included within the traffic dimension: parking and traffic control. Different variables can be considered for parking (e.g., parking lots have sometimes capacity counters updated in real time). Traffic control, on its turn, requires the knowledge of how many vehicles are present at any moment in the streets, avenues, or highways. For this, different types of sensors can be used to monitor and count them. In order to avoid traffic jams and facilitate the car flow, it is also necessary to provide smart management of traffic lights.
T r a n s p o r t = B y   g r o u n d B u s < T y p e   o f   s e n s o r s > T a x i < T y p e   o f   s e n s o r s > T r a i n < T y p e   o f   s e n s o r s > U n d e r g r o u n d < T y p e   o f   s e n s o r s > P a r t i c u l a r < T y p e   o f   s e n s o r s > B y   w a t e r F e r r y < T y p e   o f   s e n s o r s > S h i p s < T y p e   o f   s e n s o r s > T a x i < T y p e   o f   s e n s o r s > B y   A i r H e l i c o p t e r < T y p e   o f   s e n s o r s > P l a n e < T y p e   o f   s e n s o r s > D r o n e s < T y p e   o f   s e n s o r s >
Transport is also an important dimension, which is associated with three environmental media (land, water, and air) and different kinds of transportation means. The last field related to the type of sensor involved might include the geolocalization (GPS), available seats, speed and direction, and engine sensors, among others.
H e a l t h   c a r e = H o s p i t a l s L o w   C o m p l e x i t y < T y p e   o f   s e n s o r s > M e d i u m   C o m p l e x i t y < T y p e   o f   s e n s o r s > H i g h   C o m p l e x i t y < T y p e   o f   s e n s o r s > M e d i c a l   C e n t r e L o w   C o m p l e x i t y < T y p e   o f   s e n s o r s > M e d i u m   C o m p l e x i t y < T y p e   o f   s e n s o r s > M o b i l e A m b u l a n c e < T y p e   o f   s e n s o r s > C P R   E q u i p m e n t < T y p e   o f   s e n s o r s >
The smart-health dimension involves facilities, services, sensors, and actuators. We provide just an indicative list of possible elements to consider. For example, when referring to ambulances, it is necessary to identify the medical equipment they have, so as to provide patients with the appropriate resources for their proper treatment while being transported to hospital. Similarly, hospitals and medical centers should be classified according to the complexity they can handle (low, medium, or high) and the equipment they have. High-cost equipment (e.g., tomographs or magnetic resonators) is not usually available in low-complexity hospitals, whereas they may be available in intensive care units (ICU). Hospitals with maternity units should have the equipment (sensors) needed for providing assistance during births.
E d u c a t i o n = K i n d e r C l a s s r o o m s < T y p e   o f   s e n s o r s > S t u d e n t s < T y p e   o f   s e n s o r s > F a c i l i t i e s < T y p e   o f   s e n s o r s > S c h o o l s C l a s s r o o m s < T y p e   o f   s e n s o r s > S t u d e n t s < T y p e   o f   s e n s o r s > F a c i l i t i e s < T y p e   o f   s e n s o r s > U n i v e r s i t y C l a s s r o o m s < T y p e   o f   s e n s o r s > S t u d e n t s < T y p e   o f   s e n s o r s > F a c i l i t i e s < T y p e   o f   s e n s o r s > L a b o r a t o r i e s < T y p e   o f   s e n s o r s >
The smart education dimension involves different aspects; an exhaustive analysis is outside the scope of this article. In this dimension, the types of sensors are associated with supporting the teaching/learning process (computers, smart boards, access to Internet, etc.) within the facilities. Such sensors might include other elements needed in daily life (e.g., soft-drink dispensers or coffee machines, among others). Similarly, laboratories might include specific sensors (e.g., in a computer laboratory, the availability of routers, switches, computers, and general equipment).
E n e r g y = P o w e r   u t i l i t y   g r o u p V o l t a g e   l i n e < T y p e   o f   s e n s o r s > T r a n s f o r m e r   s t a t i o n s < T y p e   o f   s e n s o r s > G a s   d i s t r i b u t i o n T u b e s < T y p e   o f   s e n s o r s > V a l v e s < T y p e   o f   s e n s o r s > C o n s u m e r s P o w e r   m e t e r s < T y p e   o f   s e n s o r s > G a s   m e t e r s < T y p e   o f   s e n s o r s > U s e r s   g e n e r a t i o n E o l i c < T y p e   o f   s e n s o r s > S o l a r < T y p e   o f   s e n s o r s >
The smart-energy dimension has also several aspects that should be incorporated into the taxonomy. Gas distribution, consumers, and user generation are some of the possible application areas. Different types of variables are to be considered (valves, power meters, gas meters, etc.), which are associated with particular types of sensors.
H o m e = H o u s e S i n g l e   f a m i l y   h o m e < T y p e   o f   s e n s o r s > D u p l e x   f a m i l y   h o m e < T y p e   o f   s e n s o r s > M o t o r h o m e s < T y p e   o f   s e n s o r s > T o w e r s F l a t - L i g h t s < T y p e   o f   s e n s o r s > F l a t - P r e s e n c e < T y p e   o f   s e n s o r s > E l e v a t o r - M o v e m e n t < T y p e   o f   s e n s o r s > E l e v a t o r - w e i g h t < T y p e   o f   s e n s o r s > F a c i l i t i e s < T y p e   o f   s e n s o r s >
Smart-homes represent an important dimension within the smart-city paradigm. For the sake of example, we identify here two possible application areas (houses and tower buildings) and some of the possible variables to be considered (e.g., elevator movement could be a variable to be measured, which is associated with the working of an elevator in a building).
I n f r a s t r u c t u r e = S t r e e t s P a v e m e n t < T y p e   o f   s e n s o r s > S e e w e r s < T y p e   o f   s e n s o r s > Z e b r a   c r o s s i n g < T y p e   o f   s e n s o r s > F l o o d e d < T y p e   o f   s e n s o r s > O p e r a t i o n < T y p e   o f   s e n s o r s > B r i d g e s B e a m   B r i d g e s < T y p e   o f   s e n s o r s > < T y p e   o f   s e n s o r s > C a n t i l e v e r   B r i d g e s < T y p e   o f   s e n s o r s > < T y p e   o f   s e n s o r s > A r c h   B r i d g e s < T y p e   o f   s e n s o r s > < T y p e   o f   s e n s o r s > C a b l e - s t a y e d   B r i d g e s < T y p e   o f   s e n s o r s > < T y p e   o f   s e n s o r s > T u n n e l s C u t - a n d - C o v e r < T y p e   o f   s e n s o r s > < T y p e   o f   s e n s o r s > B o r e d < T y p e   o f   s e n s o r s > < T y p e   o f   s e n s o r s > I m m e r s e d < T y p e   o f   s e n s o r s > < T y p e   o f   s e n s o r s > W a t e r   d i s t r i b u t i o n T u b e s < T y p e   o f   s e n s o r s > P u m p s < T y p e   o f   s e n s o r s > F i l t e r s < T y p e   o f   s e n s o r s > O p e r a t i o n < T y p e   o f   s e n s o r s >
Infrastructure is a dimension within the smart-city model that covers all that is related to the hard services provided by the government. Consequently, this dimension will interact with many of the other dimensions (e.g., traffic, health, energy, and transport, among others). The elements listed are just provided as examples. The types of sensors involved cover a wide range of situations (those related to sensing the stability of bridges or tunnels, the operation of the piping dedicated to the water distribution, etc.).
C i t y - s e r v i c e s = T a x e s P r o p e r t y < T y p e   o f   s e n s o r > V e h i c l e s < T y p e   o f   s e n s o r > A u t h o r i z a t i o n s C o m m e r c i a l < T y p e   o f   s e n s o r > T r a n s p o r t < T y p e   o f   s e n s o r > R e s t a u r a n t s < T y p e   o f   s e n s o r > D o c u m e n t a t i o n P e r s o n a l   r e c o r d s < T y p e   o f   s e n s o r > C i t y - p l a n n i n g C o n s t r u c t i o n s < T y p e   o f   s e n s o r > I n f r a s t r u c t u r e < T y p e   o f   s e n s o r > T r a n s p o r t < T y p e   o f   s e n s o r >
City services may depend on the administrative structure of the region and the country in which the city is located. The inclusion of these services in the taxonomy is based on the fact that for the virtualization it is necessary to count with sensing/actuating devices to implement them. Some city services may include tax payment, requesting authorizations from the town hall, etc., which may require the use of electronic counters, QR readers, and geographic information systems (GISs), among others.
City services are important within the taxonomy, being required for implementing successful digital governance policies. For example, when dealing with the citizen permit needed for building a house to be provided by the city hall, paperwork has been replaced by digital records, which may be officially sealed by means of a blockchain application, which can be read using QR codes.

References

  1. Santos, R.M.; Santos, J.; Orozco, J.D. A least upper bound on the fault tolerance of real-time systems. J. Syst. Softw. 2005, 78, 47–55. [Google Scholar] [CrossRef]
  2. Santos, R.; Lipari, G.; Bini, E.; Cucinotta, T. On-line schedulability tests for adaptive reservations in fixed priority scheduling. Real-Time Syst. 2012, 48, 601–634. [Google Scholar] [CrossRef] [Green Version]
  3. UNECE Publications. A U4SSC Deliverable—Guidelines on Tools and Mechanisms to Finance Smart Sustainable Cities Projects. Technical Report. 2021. Available online: https://unece.org/sites/default/files/2021-08/U4SSC_Guidelines-on-tools-and-mechanisms-to-finance-SSC-projects.pdf (accessed on 1 February 2023).
  4. UNECE Publications. Collection Methodology for Key Performance Indicators for Smart Sustainable Cities. Technical Report. 2017. Available online: https://unece.org/DAM/hlm/documents/Publications/U4SSC-CollectionMethodologyforKPIfoSSC-2017.pdf (accessed on 1 February 2023).
  5. Elsaleh, T.; Enshaeifar, S.; Rezvani, R.; Acton, S.T.; Janeiko, V.; Bermudez-Edo, M. IoT-Stream: A Lightweight Ontology for Internet of Things Data Streams and Its Use with Data Analytics and Event Detection Services. Sensors 2020, 20, 953. [Google Scholar] [CrossRef] [PubMed] [Green Version]
  6. Weekes, S. The Open Road. Technical Report. 2019. Available online: https://www.smartcitiesworld.net/ebooks/ebooks/the-open-road-a-smart-city-is-an-interoperable-city (accessed on 1 February 2023).
  7. Syed, A.S.; Sierra-Sosa, D.; Kumar, A.; Elmaghraby, A. IoT in smart cities: A survey of technologies, practices and challenges. Smart Cities 2021, 4, 429–475. [Google Scholar] [CrossRef]
  8. Whaiduzzaman, M.; Barros, A.; Chanda, M.; Barman, S.; Sultana, T.; Rahman, M.S.; Roy, S.; Fidge, C.J. A Review of Emerging Technologies for IoT-Based Smart Cities. Sensors 2022, 22, 9271. [Google Scholar] [CrossRef] [PubMed]
  9. Anagnostopoulos, T.; Zaslavsky, A.; Ntalianis, K.; Anagnostopoulos, C.; Ramson, S.J.; Shah, P.J.; Behdad, S.; Salmon, I. IoT-enabled tip and swap waste management models for smart cities. Int. J. Environ. Waste Manag. 2021, 28, 521–539. [Google Scholar] [CrossRef]
  10. Ariza, J.; Garcés, K.; Cardozo, N.; Sánchez, J.P.R.; Vargas, F.J. IoT architecture for adaptation to transient devices. J. Parallel Distrib. Comput. 2021, 148, 14–30. [Google Scholar] [CrossRef]
  11. Zhang, J.; Ma, M.; Wang, P.; Sun, X.d. Middleware for the Internet of Things: A Survey on Requirements, Enabling Technologies, and Solutions. J. Syst. Archit. 2021, 117, 102098. [Google Scholar] [CrossRef]
  12. Pivoto, D.G.; de Almeida, L.F.; da Rosa Righi, R.; Rodrigues, J.J.; Lugli, A.B.; Alberti, A.M. Cyber-physical systems architectures for industrial internet of things applications in Industry 4.0: A literature review. J. Manuf. Syst. 2021, 58, 176–192. [Google Scholar] [CrossRef]
  13. Rozsa, V.; Denisczwicz, M.; Dutra, M.L.; Ghodous, P.; da Silva, C.F.; Moayeri, N.; Biennier, F.; Figay, N. An Application Domain-Based Taxonomy for IoT Sensors. In Proceedings of the ISPE Conference, Curitiba, Brazil, 3–7 October 2016; pp. 249–258. [Google Scholar]
  14. Farias da Costa, V.C.; Oliveira, L.; de Souza, J. Internet of Everything (IoE) Taxonomies: A Survey and a Novel Knowledge-Based Taxonomy. Sensors 2021, 21, 568. [Google Scholar] [CrossRef]
  15. Rosero-Montalvo, P.D.; López-Batista, V.F.; Peluffo-Ordóñez, D.H. A New Data-Preprocessing-Related Taxonomy of Sensors for IoT Applications. Information 2022, 13, 241. [Google Scholar] [CrossRef]
  16. Souri, A.; Hussien, A.; Hoseyninezhad, M.; Norouzi, M. A systematic review of IoT communication strategies for an efficient smart environment. Trans. Emerg. Telecommun. Technol. 2022, 33, e3736. [Google Scholar] [CrossRef]
  17. Mountrouidou, X.; Billings, B.; Mejia-Ricart, L. Not just another Internet of Things taxonomy: A method for validation of taxonomies. Internet Things 2019, 6, 100049. [Google Scholar] [CrossRef]
  18. Voas, J. Networks of ‘things’. NIST Spec. Publ. 2016, 800, 800-183. [Google Scholar]
  19. Mukherjee, S.; Gupta, S.; Rawlley, O.; Jain, S. Leveraging big data analytics in 5G-enabled IoT and industrial IoT for the development of sustainable smart cities. Trans. Emerg. Telecommun. Technol. 2022, 33, e4618. [Google Scholar] [CrossRef]
  20. Toli, A.M.; Murtagh, N. The Concept of Sustainability in Smart City Definitions. Front. Built Environ. 2020, 6, 77. [Google Scholar] [CrossRef]
  21. Ramírez-Moreno, M.A.; Keshtkar, S.; Padilla-Reyes, D.A.; Ramos-López, E.; García-Martínez, M.; Hernández-Luna, M.C.; Mogro, A.E.; Mahlknecht, J.; Huertas, J.I.; Peimbert-García, R.E.; et al. Sensors for Sustainable Smart Cities: A Review. Appl. Sci. 2021, 11, 8198. [Google Scholar] [CrossRef]
  22. Yaqoob, I.; Ahmed, E.; Hashem, I.A.T.; Ahmed, A.I.A.; Gani, A.; Imran, M.; Guizani, M. Internet of things architecture: Recent advances, taxonomy, requirements, and open challenges. IEEE Wirel. Commun. 2017, 24, 10–16. [Google Scholar] [CrossRef]
  23. Borgia, E. The Internet of Things vision: Key features, applications and open issues. Comput. Commun. 2014, 54, 1–31. [Google Scholar] [CrossRef]
  24. United Nations. SDG Indicators: Global Indicator Framework for the Sustainable Development Goals and Targets of the 2030 Agenda for Sustainable Development. Technical Report. 2017. Available online: https://unstats.un.org/sdgs/indicators/indicators-list/ (accessed on 1 February 2023).
  25. Fagroud, F.Z.; Ajallouda, L.; Lahmar, E.H.B.; Toumi, H.; Zellou, A.; El Filali, S. A Brief Survey on Internet of Things (IoT). In Digital Technologies and Applications; Motahhir, S., Bossoufi, B., Eds.; Springer International Publishing: Cham, Switzerland, 2021; pp. 335–344. [Google Scholar]
  26. Janowicz, K.; Haller, A.; Cox, S.J.; Le Phuoc, D.; Lefrançois, M. SOSA: A lightweight ontology for sensors, observations, samples, and actuators. J. Web Semant. 2019, 56, 1–10. [Google Scholar] [CrossRef] [Green Version]
  27. Bendadouche, R.; Roussey, C.; De Sousa, G.; Chanet, J.P.; Hou, K.M. Extension of the Semantic Sensor Network Ontology for Wireless Sensor Networks: The Stimulus-WSNnode-Communication Pattern. In Proceedings of the 5th International Conference on Semantic Sensor Networks, Boston, MA, USA, 12 November 2012; CEUR-WS.org: Aachen, Germany, 2012; Volume 904, pp. 49–64. [Google Scholar]
  28. OMG. OMG System Modeling Language (SysML). Specification, OMG. Technical Report. 2019. Available online: https://www.omg.org/spec/SysML/ (accessed on 1 February 2023).
  29. Agarwal, R.; Fernandez, D.G.; Elsaleh, T.; Gyrard, A.; Lanza, J.; Sanchez, L.; Georgantas, N.; Issarny, V. Unified IoT ontology to enable interoperability and federation of testbeds. In Proceedings of the 2016 IEEE 3rd World Forum on Internet of Things (WF-IoT), Reston, VA, USA, 12–14 December 2016; pp. 70–75. [Google Scholar] [CrossRef]
  30. Meseguer, R.; Molina, C.; Ochoa, S.F.; Santos, R. Energy-aware topology control strategy for human-centric wireless sensor networks. Sensors 2014, 14, 2619–2643. [Google Scholar] [CrossRef] [PubMed] [Green Version]
  31. Perry, M.; Herring, J. OGC GeoSPARQL-A Geographic Query Language for RDF Data. Implementation Standard, OGC. Technical Report. 2019. Available online: https://opengeospatial.github.io/ogc-geosparql/geosparql11/spec.html (accessed on 1 February 2023).
  32. Finochietto, M.; Eggly, G.M.; Santos, R.; Orozco, J.; Ochoa, S.F.; Meseguer, R. A Role-Based Software Architecture to Support Mobile Service Computing in IoT Scenarios. Sensors 2019, 19, 4801. [Google Scholar] [CrossRef] [PubMed] [Green Version]
  33. Mattiuzzi, C.; Lippi, G. Worldwide epidemiology of carbon monoxide poisoning. Hum. Exp. Toxicol. 2020, 39, 387–392. [Google Scholar] [CrossRef] [PubMed]
  34. Shilpa, V.; Vidya, A.; Pattar, S. MQTT based Secure Transport Layer Communication for Mutual Authentication in IoT Network. Glob. Transit. Proc. 2022, 3, 60–66. [Google Scholar] [CrossRef]
  35. Tariq, M.A.; Khan, M.; Raza Khan, M.T.; Kim, D. Enhancements and Challenges in CoAP—A Survey. Sensors 2020, 21, 6391. [Google Scholar] [CrossRef]
  36. Fadda, M.; Anedda, M.; Girau, R.; Pau, G.; Giusto, D.D. A Social Internet of Things Smart City Solution for Traffic and Pollution Monitoring in Cagliari. IEEE Internet Things J. 2023, 10, 2373–2390. [Google Scholar] [CrossRef]
  37. Gentili, J.O.; Fernández, M.E.; Campo, A.M. Vulnerability in Bahía Blanca. Estimating technology-related risks. Int. J. Disaster Risk Reduct. 2018, 31, 659–667. [Google Scholar] [CrossRef]
Figure 1. The IoT 4-layer model: applications, data management, transmission, and sensing.
Sustainability 15 06594 g001
Figure 2. Smart cities’ dimensions considered in this study.
Sustainability 15 06594 g002
Figure 3. The IoT-Stream model and its connection with other ontologies (as proposed in [5]).
Sustainability 15 06594 g003
Figure 4. A listing corresponding to a platform associated with an Iphone 7 expressed in the SOSA ontology (as proposed in [26]).
Sustainability 15 06594 g004
Figure 5. Structure of a taxonomic identifier for sensors using 24 bits, where four different sections are distinguished (dimension, application area, sensed variable and sensor type).
Sustainability 15 06594 g005
Figure 6. The sensor management table and the different components related to the IoT-Stream ontology: a high-level data flow architecure.
Sustainability 15 06594 g006
Table 1. Sensor management table: sample records corresponding to different sensors.
Dev. IoT IDURITaxonomy IDLatLongHeightBackup by
1weatherstation/wind/speed30:40:5:738.192462.0324252,3
2airport/wind/speed30:40:5:738.345062.1245251,3
3park/wind/speed30:40:5:738.400062.1250251,2
4weatherstation/wind/direction30:40:5:838.192462.0324255,6
5airport/wind/direction30:40:5:838.345062.1245254,6
6park/wind/direction30:40:5:838.400062.1250254,5
7
Disclaimer/Publisher’s Note: The statements, opinions and data contained in all publications are solely those of the individual author(s) and contributor(s) and not of MDPI and/or the editor(s). MDPI and/or the editor(s) disclaim responsibility for any injury to people or property resulting from any ideas, methods, instructions or products referred to in the content.

