Article

Towards Carbon Neutrality: A Comprehensive Analysis on Total Factor Carbon Productivity of the Yellow River Basin, China

1
School of Agricultural and Rural Development, Renmin University of China, Beijing 100872, China
2
School of Economics, North Minzu University, Yinchuan 750030, China
3
School of Computer Science and Engineering, North Minzu University, Yinchuan 750030, China
*
Authors to whom correspondence should be addressed.
Sustainability 2023, 15(8), 6591; https://doi.org/10.3390/su15086591
Submission received: 19 February 2023 / Revised: 13 March 2023 / Accepted: 7 April 2023 / Published: 13 April 2023
(This article belongs to the Section Energy Sustainability)

Abstract

:
Increasing total factor carbon productivity (TFCP) is crucial to mitigate global climate change and achieve carbon neutrality target. The Yellow River Basin is a critical energy area in China, but its TFCP is relatively low, which results in particularly prominent environmental problems. This paper investigates TFCP using MCPI, Global Moran’s I and kernel density estimation based on panel data of the 9 provinces along this vast basin in 2007–2017. The results demonstrate that: the average value of TFCP fluctuates around 1 and overall TFCP evolution exhibits significant spatial aggregation effect, and technological progress is the dominant impetus for TFCP growth. At regional level, regional heterogeneities of TFCP change and its dynamics exactly exist, with Qinghai the lowest performance and Shandong the highest performance. Moreover, global Moran’s I index reflects there is a significant positive spatial correlation between provincial TFCP, and cumulative TFCP takes on a certain degree of club convergence features. Furthermore, specific and targeted recommendations have drawn from this paper, in particular for the Yellow River Basin, to increase TFCP and achieve sustainable development in the long run.

1. Introduction

Under the background of global climate change, scientific evidence shows that the economic and social system is facing the great challenge of low-carbon transformation [1,2]. As the world’s largest developing country, China attaches enormous importance to its response to climate change and advocates achieving the ambitious goals of peaking carbon emissions before 2030 and subsequent carbon neutrality before 2060. It is a broad consensus that the Yellow River basin is a critical ecological barrier, economic belt and poverty alleviation zone. As is known as an energy basin, its energy resources are the largest among China’s seven major river basins [3], the stability and sustainability of the energy-rich area in the vast basin dramatically affect China’s energy security. As revealed by the State Council (The State Council of People’s Republic of China. Let the Yellow River become a happy river that benefits the people. Available from: http://www.gov.cn/xinwen/2021-10/23/content_5644491.htm (accessed on 23 October 2021)), the ecological conservation and high-quality development of the Yellow River Basin is significant for China’s northern strategy. Yet, over past decades, linear extensive economic growth, in turn, had caused huge negative externalities to social economy. Consequently, the Yellow River basin is presently one of the regions with the greatest pressure on resources and environment in China [4], achieving its coordinated development of ecological protection and social economy is particularly necessary.
TFCP is an indicator of efficient energy utilization, clean energy development and the pursuit of green GDP, with the core of energy technology and emission reduction technology innovation, and the fundamental shift of the concept of human survival and development [5,6,7,8]. In the critical period of industrialization and urbanization, improving TFCP may prove to be pivotal in achieving the economic growth transformation from the extensive to the intensive that mainly relies on technological innovation and efficiency enhancement. As far as we know, there are plenty of studies on TFCP, and most studies are at national, provincial and regional levels [5,9,10,11]. Nevertheless, no previous literature, to our knowledge, paid attention to internal commonness and regional heterogeneities of TFCP in the Yellow River Basin, and discussed its spatial-temporal characteristics, dynamic decomposition and policy implications. What’s more, few studies have further investigated the inter-regional imparities of such effects across the overall basin. There is no denying that China’s regional economic development is highly unbalanced, with southern China accounting for more than 60 percent of the national GDP [3,4]. It is an obvious fact that improving the TFCP of the Yellow River Basin will not only achieve a “win-win” situation of dual-carbon goals and economic growth, but also optimize the spatial pattern of China’s economic development. Thereupon, it is an urgent task to explore the TFCP of the Yellow River Basin in depth and find out its key problems. We present an attempt to conduct a comprehensive measurement and decomposition of TFCP of the Yellow River Basin to fill the research gap, which will provide new ideas for promoting the benign evolution of economic development and ecological environment.
Distinct from the current studies, the potential contributions of this paper are shown as follows: Firstly, selecting the Yellow River Basin as the study area, we depict a picture of the spatial-temporal trajectories for TFCP growth using MCPI, conduct spatial autocorrelation analysis of TFCP growth through Global Moran’s I index, and reveal its dynamic evolution trend with kernel density estimation, which is an extension and enrichment of the research on carbon emission performance. Secondly, we conduct DFAP2.1 software to decompose provincial TFCP to capture its internal commonness and regional heterogeneity, and further investigate the inter-regional imparities of such effects across the overall basin, our empirical findings shed new light on the understanding of how technological advancement take effect in improving TFCP. Thirdly, the insights gained from this study is beneficial to propose differentiated and diversified “low-carbon” policies compatible with ecological protection and high-quality development of the Yellow River Basin. Our empirical findings have a certain meaning for the civilization construction in China and offer a reference for the formulation of carbon reduction policies in the future.
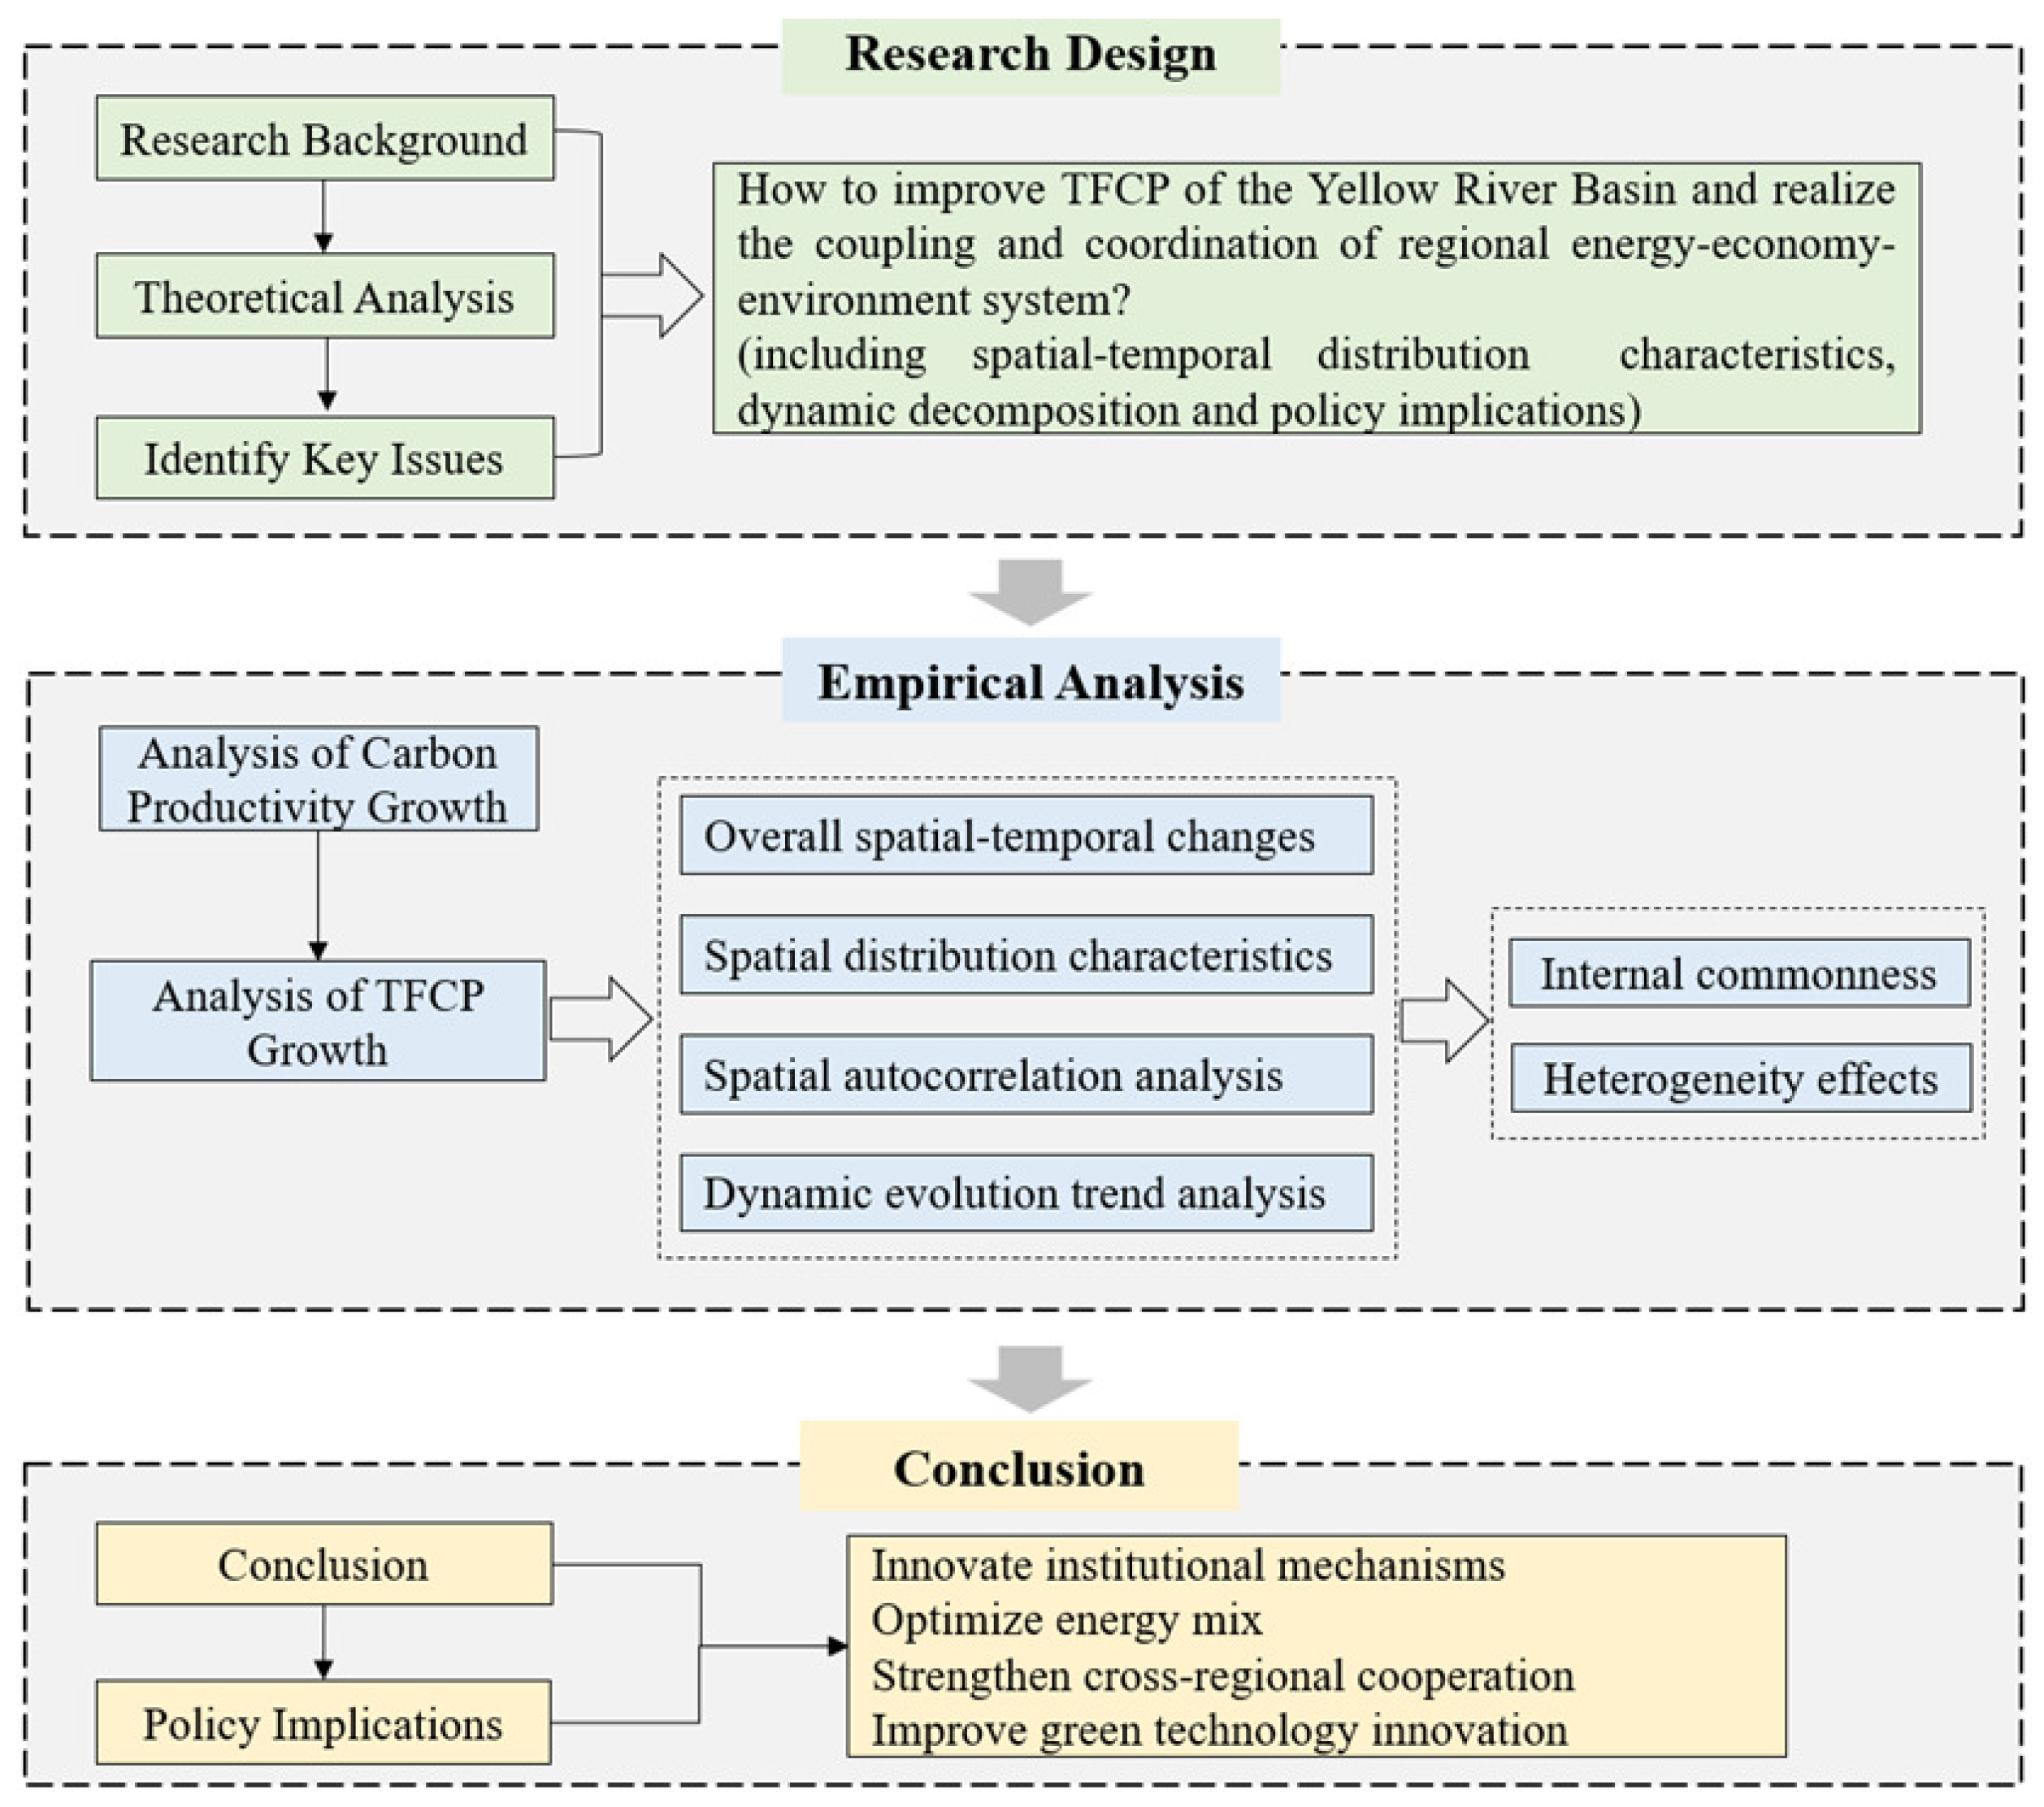
The remainder of the paper is organized as follows: Section 2 lays out literature review and theoretical basis. Section 3 gives an outline of the study area. In Section 4, we introduce the methodology in detail, and describe the sources and construction of data. Section 5 carries out the empirical study and discusses the results. Section 6 concludes the paper with targeted policy implications. The research framework of this article is displayed in Figure 1.

2. Literature Review

Carbon productivity is an indicator proposed to measure carbon emission performance in different spatial and temporal scales. It has different economic interpretations under different measurement methods. Carbon productivity can fall into two mainstream categories by definition: single factor carbon productivity and total factor carbon productivity. As such, the paper is tightly related to the above two strands.

2.1. Single Factor Carbon Productivity

In recent years, carbon productivity has gained broad interest in academia. Relevant research is abundant, focusing on its definition, measurement methods, dynamics decomposition, and the relationship between carbon productivity and economic growth. These studies have enriched the research content of carbon emission performance from different perspectives and spatial scales.
Conceptually, the origin of carbon productivity can be traced back to the 1990s. Scholars Kaya and Yokobofi first put forward the connotation of carbon productivity, defined as the ratio of GDP output to per unit of carbon dioxide emission [12]. In 2008, McKinsey again expounded the connotation of carbon productivity in its report (Report, M., 2008. The carbon productivity challenge: curbing climate change and sustaining economic growth. Mckinsey Global Institute.) “Carbon productivity challenge: curbing global change and sustaining economic growth”. So far, carbon productivity has attracted extensive attention from academia and society. Later, carbon intensity (Carbon intensity has been an important indicator for policy-making reference in the Chinese government. See [13] for more details.) is proposed and regarded as an alternative or proxy to carbon productivity. Carbon productivity and carbon intensity are generally considered to be the most effective ways to solve environmental problems [13,14,15]. The main purpose of explaining carbon productivity is to link it with the policy goals. Carbon productivity bears on balancing the relationship between decarbonization and sustainable development, and it is a critical “bridge” connecting economic growth and environmental protection [16]. As revealed in [5,17], the core aim of carbon productivity is to create greater social value with less resource consumption and less environmental pollution. As an intuitive measurement of carbon emission performance, carbon productivity considers synthetically ecological and economic benefits, adding new constraints in the analysis framework of social economy through input factors [18,19,20]. It is more appropriate for considering carbon productivity as an equivalent factor productivity like capital productivity and labor productivity, to reflect the scarcity and urgency of carbon emission space under the restrictive conditions faced by the social economy [21]. Such studies are highly impactful for policy making.
The measurement of carbon productivity makes the effort of carbon emission control accountable and provides intuitive insights for academia and practice. According to previous findings, the mathematical expression of carbon productivity and carbon intensity are reciprocal to each other, which is employed to describe the internal mechanism of carbon emission governance [22,23]. Based on its basic connotation, most scholars calculate carbon productivity in different spatial scales such as countries, regions and industries. Among these studies, for example, presently scholars Jahanger [17] and Yu et al. [23] explored the dynamic evolution and regional differences of carbon productivity using the method of convergence and decoupling index. Moreover, taking China as the research object, Wang et al. [16] investigated carbon productivity and predicted its change trend in 2005–2020. According to [24], there were obvious regional and industry differences in carbon productivity through the comparison of Shanghai and Shaanxi, China. Above all, these studies convinced that focusing carbon regulation on carbon productivity was in line with the reality of environmental regulation and climate control. Notably, some studies argued that although the current level of China’s carbon productivity was lower than that of developed countries, its growth rate remained high [25,26,27], these studies might be of assistance to accurately formulate environmental regulation policies in developing countries, and his has received considerable attention from policymakers.
In terms of the dynamics of carbon productivity, a majority of researchers confirmed that technological progress was the dominant force. This theory is supported by many empirical studies. Accordingly, related research [28,29,30] suggested that technological innovation plays a key potential role in carbon productivity growth. Many studies, for example, Yu [25] conducted the measurement and decomposition of carbon productivity, and the results showed that production technology exhibited an increasing trend for power plants. More importantly, some studies confirmed that environmental regulation also had positive impact on carbon productivity, such as [10,23], etc. Furthermore, the results concluded by Liu [9], Song and Han [31] indicated that there was a significant U-shaped relationship between environmental regulation and carbon productivity. It is especially true that regional heterogeneity of propulsive power on carbon productivity exists universally. Similarly, Wang et al. [16] presented that the impact differences of heterogeneous environmental regulation on regional carbon productivity exactly existed. The rest of studies analyzed the impact of urbanization [10], income inequality [32,33], factor input [34], foreign direct investment [30,35] on carbon productivity. However, these studies are hard to form a unified conclusion.

2.2. Total Factor Carbon Productivity

Despite its ease of use and intuitive connotation, carbon productivity has its own limitation. Firstly, it only reflects partial aspects of carbon performance and neglects other input indicators, thereby falling to reflect how far is the production activity from the optimal production state, and to judge whether current production situation is effective, let alone used for long-term prediction [36,37]. Additionally, its measurement covers a wide range at the national level and produces a weak role in guiding inter-provincial differences and policy formulation [16,22]. Finally, in the absence of production efficiency of total factor, carbon productivity ignores the substitution effect between input factors and the influence of random factors. Therefore, it is of great necessity to measure carbon productivity in an integrated production framework.
Recently, a growing number of researchers began to study TFCP, and it has been broadly recognized by academia (See, for example, [5,38,39,40], etc.) In definition, the concept of TFCP has been discussed, more examples of such studies include [38,41,42], etc. In conformity with prior findings, academia has not yet reached a consensus on the definition of TFCP. It is worth noting that the concept of TFCP is derived from total-factor productivity (TFP) and total-factor energy productivity (TFEP), which are widely utilized to measure economic development in environmental economics [40,43]. On this basis, some researchers insisted that CO2 should be regarded as a production factor like labor and capital in the total-factor analysis framework. This theory is supported by many empirical studies since it is more consistent with the appeal of green and sustainable development. For instance, considering carbon emission as an output variable, Ramanathan [44], Kuang and Peng [45] and Shen et al. [46] investigated environmental TFP in their studies. More representative literature includes [42,47], etc. On the above basis, more scholars argued that it was reasonable to view CO 2 as an unexpected output and integrate it into total factor analysis framework, e.g., [48,49].
Theoretically, the measurement of TFCP is more complicated compared with single factor carbon productivity. There are two mainstream research methods: Stochastic Frontier Approach (SFA) and Data Envelopment Analysis (DEA). DEA is a non-parametric technique and is more favored by scholars in that there is no need to determine any weight and specific function expression, and it could avoid model mis-specification risk. As such, DEA was widely utilized to evaluate total factor carbon emission performance in academia. Furthermore, the DEA linear programming method constructed by Fare, Grosskopf and Norris [50] is preferred to measure Malmquist index (abbreviated as MCPI) by most researchers. For instance, Zhang [51] employed DEA Malmquist model to compute China’s TFCP, its results highlighted that Malmquist index was an effective way to assess TFCP. The literature of [5,38,40] also drew similar conclusions. Whereas, DEA ignores the statistical noises and other random errors. Different from the aforementioned literature, some recent studies developed SFA and advocated using it for efficiency evaluation, e.g., [52,53,54]. As discussed in Tan [55] and Li [56], the merit of SFA was that it both took statistical noises and individual heterogeneities into consideration. However, Wang et al [57] argued that SFA also had its own limitations, for instance, it was still needed to impose restrictions on the form of distance function.
To make up for the deficiency of production status and long-term application, some researchers advocated using directional distance function to trace productivity changes. The example of such studies includes [38,58], etc. As discussed in [54], it needed to construct a corresponding technological frontier to investigate the production effectiveness in each phase, this will bring challenges to technological benchmark selection and technological inefficiency measurement. Thereupon, some studies developed a framework of biased technological progress and extended the relaxation directional distance function based on SBM model [16,35]. In this way, technological progress could be reflected in the catching-up process of each decision-making unit to the global cutting-edge technology. It further describes the low-carbon governance effectiveness under the existing technological progress, and perfectly presents the coordination between carbon regulation and economic growth [59]. As verified by [34,60], energy and environment related innovations (hereafter carbon control technology innovations) may be a pivotal supplement to addressing the above problem. This has drawn much attention from academia and policymakers. Such studies provide a reliable theoretical basis for the research of carbon emission control.
Currently, exploring the sources of TFCP has not yet formed a systematic framework. These empirical studies are distinguished for the fact of that research methodology varies, e.g., multi-dimensional decomposition technology, nonparametric directional distance function, LMDI [57,61]. Since the subjects of these studies are different, the research perspectives are also of great imparities. Most stirring evidence confirmed that per capita GDP, technological progress, energy consumption structure, industrial structure adjustment, independent innovation and environmental regulation have great influence on TFCP [8,39,48].
To sum up, previous studies have given in-depth analysis on carbon productivity and laid a solid foundation for us to study carbon emission performance, yet the study of TFCP in the Yellow River Basin has yet received the attention that it deserves. There is still some expansion room. On the one hand, existing studies have focused on the world’s major economies, countries along the Belt and Road, the national level, China’s eastern coastal areas, Beijing-Tianjin-Hebei Urban Agglomeration, the Yangtze River Basin, and specific sectors such as industry, manufacturing, agriculture, construction, etc. [23,24,26,34,36]. However, far too little attention has been paid to the systematic research on the TFCP of the Yellow River Basin. On the other hand, the existing single factor research in prior studies is lack consideration of the synergistic effect of multiple factors in production process, thereby falling to explore its dynamic evolution law and revealing the dominant driving sources. Besides, domestic research on TFCP is still in the exploratory stage and empirical evidence is still rather scarce. This paper performs the exploratory research in the existing studies. It is therefore the purpose of this paper to fill some research gaps by empirical evidence on TFCP in the Yellow River Basin.
3. Study Area Description

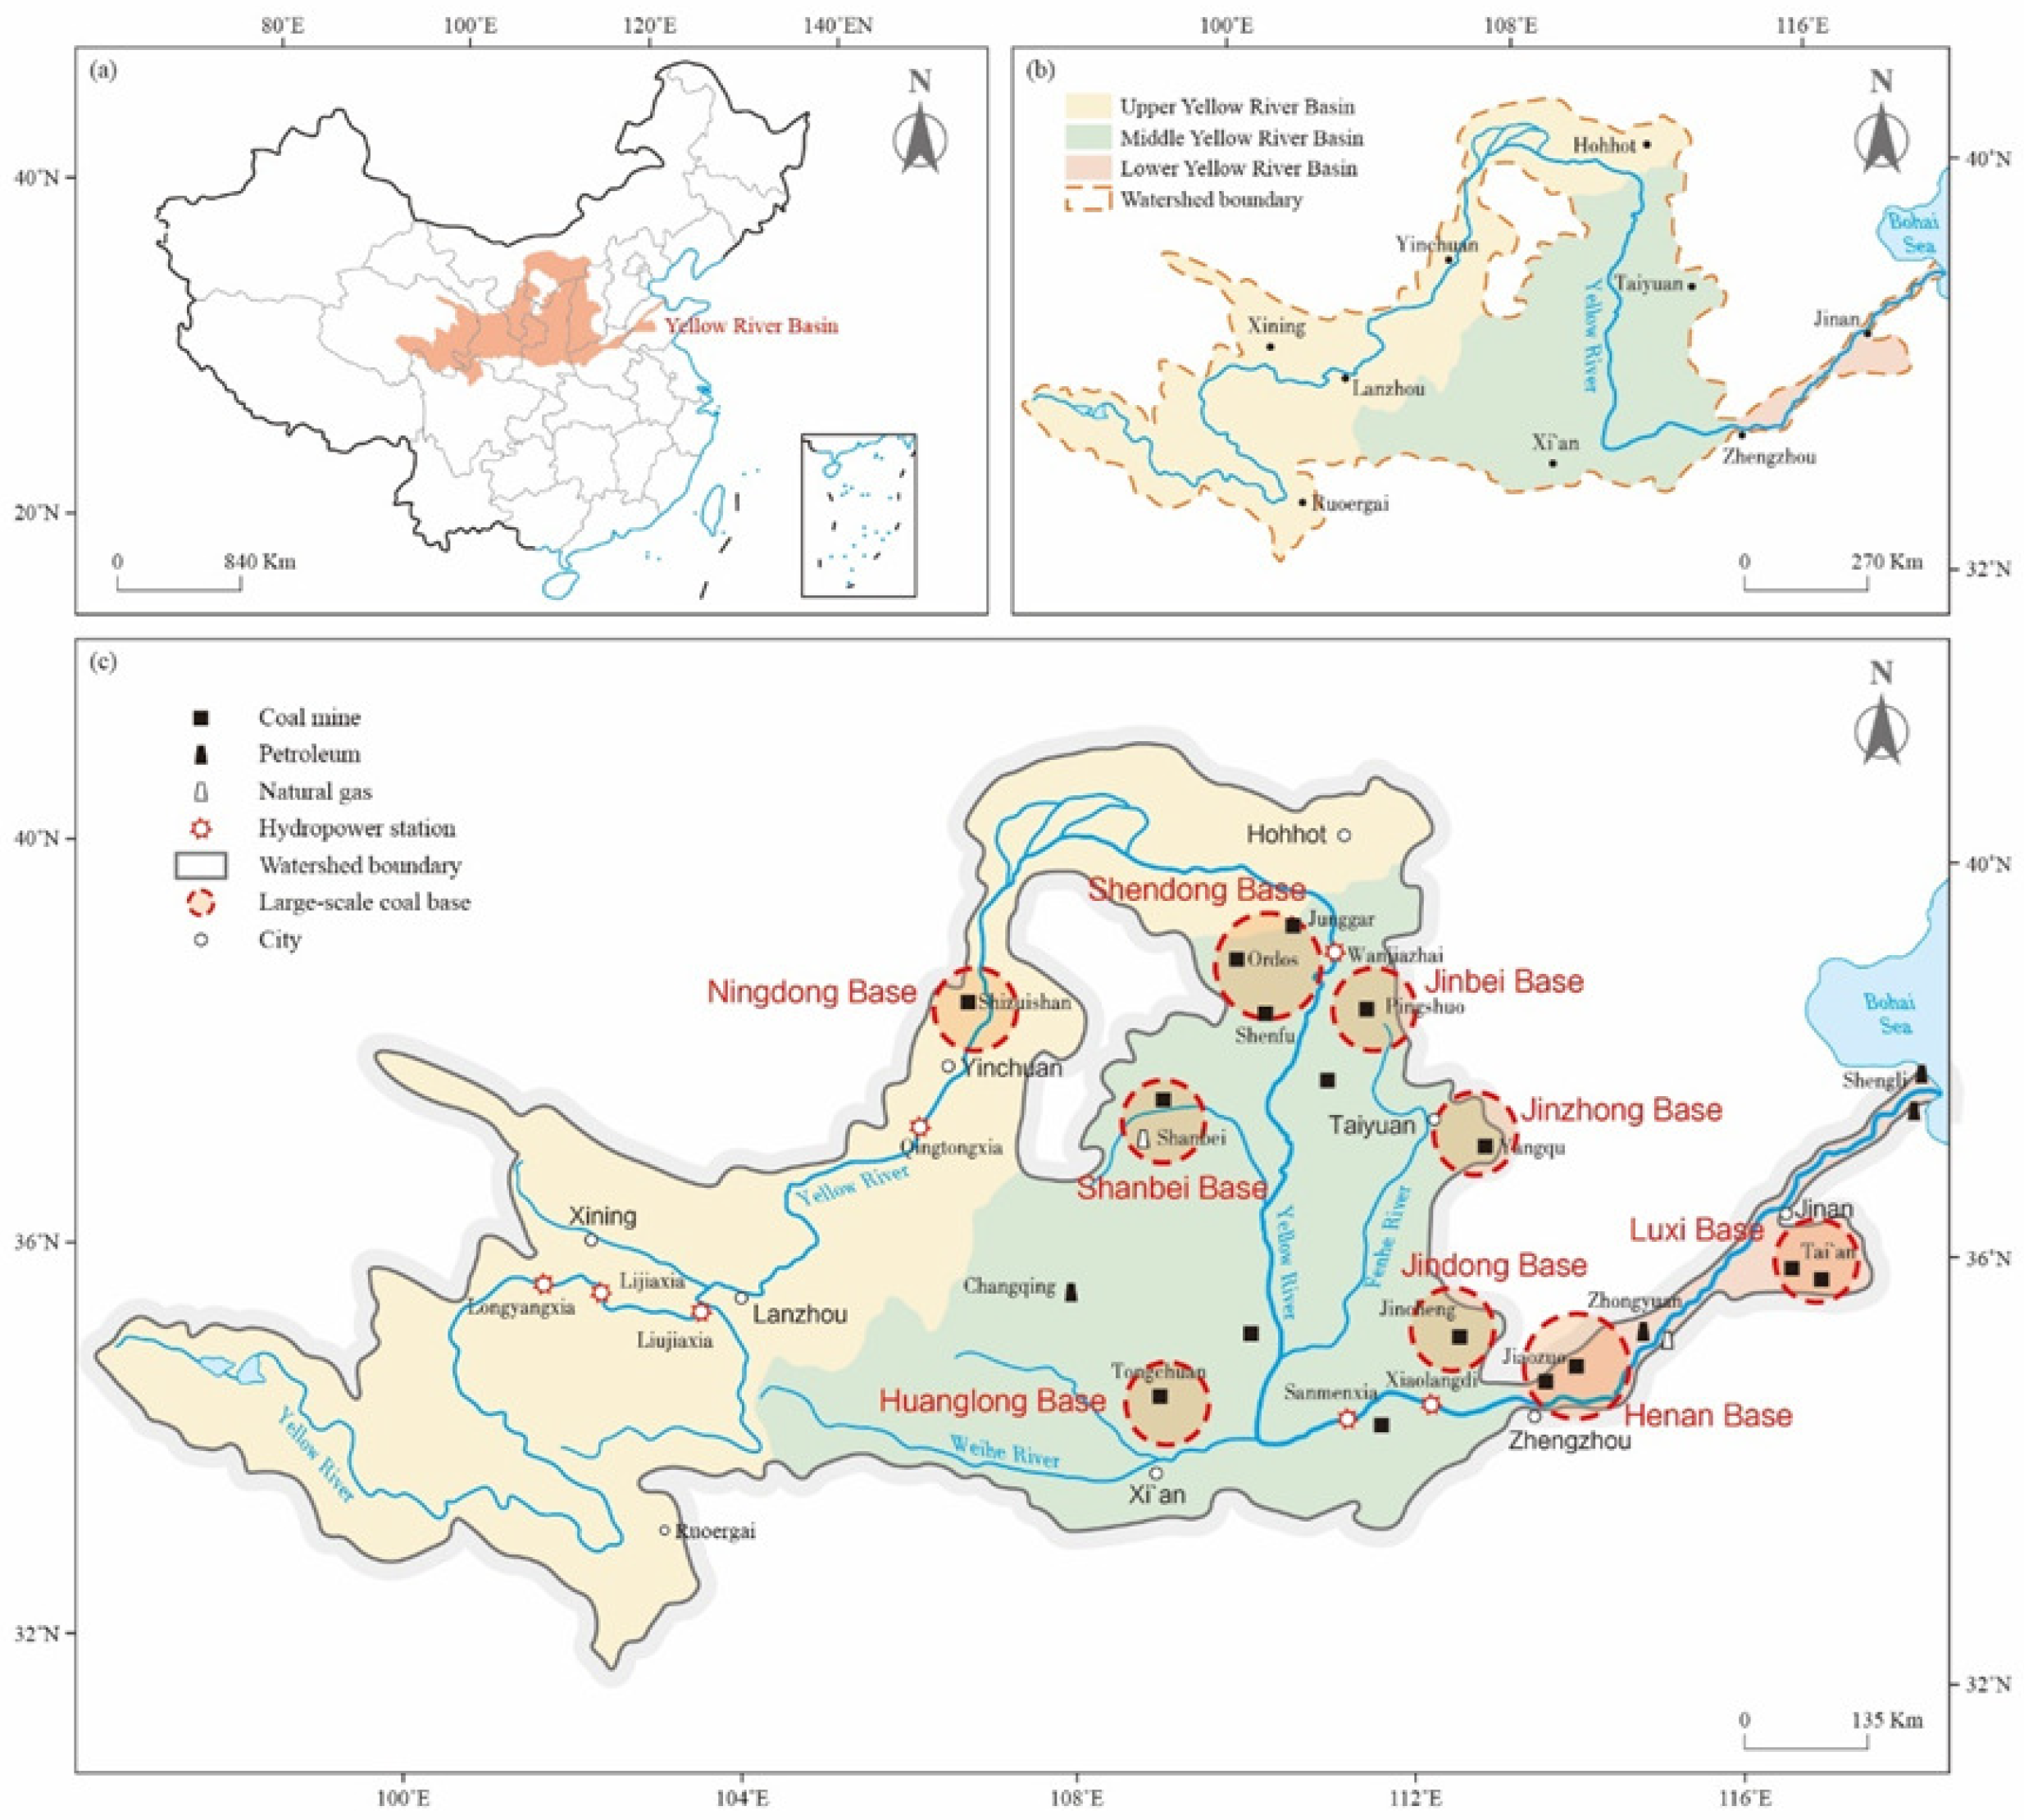
The Yellow River is the second-longest river in China, measuring 5464 km in length. It runs through nine provinces (autonomous regions), including Qinghai, Sichuan, Gansu, Ningxia, Inner Mongolia, Shanxi, Shaanxi, Henan and Shandong. The watershed covers 750,000 square kilometers and is the main birthplace of Chinese civilization, often described as “Cradle of Chinese Civilization” and “China’s Mother River”. According to river channel characteristics and drainage basin topography, this vast Basin is divided into three sub-watersheds. Tuoketuo County in Inner Mongolia is the dividing point of upstream and midstream, and Mengjin County, Henan is the dividing point of midstream and downstream (Figure 2).
As revealed by the State Council (The State Council of People’s Republic of China. Outline Development Plan for Ecological Protection and High-quality Development of the Yellow River Basin. Available from: http://www.gov.cn/zhengce/2021-10/08/content_5641438.htm (accessed on 8 October 2021)), the GDP of the Yellow River basin was 2.48 trillion yuan in 2020, accounting for 25% of China’s total GDP, the population of the Yellow River basin was 435 million, accounting for 35.3% of China’s total population. It has been proven that energy-rich area of the Yellow River Basin is strategically important energy base, characterized by the distribution pattern of “upstream hydropower, midstream coal, downstream oil” (Table A1). It is estimated that the proven reserves of coal account for 66.1% of China’s total reserves, with 9 of 14 national large-scale coal bases located in this basin. The proven geological reserves of coalbed methane account for 50% of China’s total reserves, and the reserves of natural gas account for 38% of China’s total reserves. Known as China’s Golden Triangle of Energy, cities such as Ningdong, Yulin and Ordos have built large-scale coal bases and chemical industries (China Energy Statistical Yearbook. Available from: https://www.yearbookchina.com/ (accessed on 5 December 2017)). Since energy structure is biased, a huge amount of fossil energy has been consumed, resulting in prominent industrial pollution and low energy efficiency. This study area inevitably has fall into the dilemma of economic development and carbon emissions mitigation. Under the constraints of carbon neutrality, how to improve TFCP and realize the coupling and coordination development of the energy-economy-environment system is the core of high-quality development in the Yellow River Basin.

4. Research Methodology and Data

This chapter mainly introduces the research methodology in detail, lays out the indicator selection for TFCP measurement and describes the sources and construction of data in empirical analysis.

4.1. Measuring Total Factor Carbon Productivity

Calculating TFCP of the Yellow River Basin is the basis and premise for studying the spatiotemporal distribution and dynamic changes of TFCP. Based on the Shephard carbon distance function and DEA, this paper uses MCPI to measure the TFCP. The specific research methods are as follows:

4.1.1. Directional Distance Function

Referring to Faere et al. [62], we first need to construct a production possibility set (PPS) to incorporate energy resource and environmental regulation into the productivity analysis framework. As such, PPS is the Environmental Technology. We suppose each decision-making unit (DMU) uses N inputs x = x 1 , , x N R N + to produce M desirable outputs y = y 1 , , y M R M + and I undesirable outputs (by-products) b = b 1 , , b I R I + .
Assuming P(x) represents PPS, it can be defined as:
P x = x , y , b : x c a n p r o d u c e y , b , x R + N
P x should satisfy the following properties to represent Environmental Technology (See Faere et al. [62] for more details):
(1) P x is closed and bounded, meaning that limited inputs produce limited outputs.
(2) Strong disposability of input and desirable output.
(3) Axiom 1: Null-jointness Axiom or By-products Axiom, which is defined as:
I f y , b P x a n d b = 0 , s o y = 0
Axiom 1 indicates there is null jointness of desirable output and undesirable output. If the region has no undesirable output, there will be no desirable output. If there is desirable output, there must be undesirable output.
(4) Axiom 2: Week disposability of output Axiom, which is defined as:
I f y , b P x a n d 0 θ 1 , s o θ y , θ b P x
According to Axiom 2, desirable output and undesirable output decrease in the same proportion, and the production feasibility is still concentrated. So we must reduce desirable output to reduce undesirable output. It also indicates that pollution reduction has a high cost, and environmental regulation is incorporated into the analysis.
Suppose at each period t = 1 , 2 , , T , the input and output of the region is k = 1 , 2 , , K ( x k , t , y k , t , b k , t ) . DEA is used to model environmental technologies that meet the above axioms as:
P t x t = y t , b t : k = 1 K Z k t y k m t y k m t , m = 1 , , M ; k = 1 K Z k t b k i t , i = 1 , , I ; k = 1 K Z k t x k n t x k n t , n = 1 , , N ; Z k t 0 , k = 1 , , K
where, Z k t denotes the weight of each cross-sectional observation, the non-negative weight variable indicates that the production technology is constant return to scale. In Equation (4), inequality constraints mean that there is strong disposability of desirable output and input, while there is week disposability of undesirable output.
Additionally, the following two conditions need to be emphasized to represent the zero combination of outputs in the DEA model:
k = 1 K b k i t > 0 , i = 1 , 2 , , I
i = 1 I b k i t > 0 , k = 1 , 2 , , K
Condition (5a) indicates that each undesirable output is produced in at least one region, condition (5b) indicates that each region produces at least one undesirable output.
It needs to define the production technology function using DEA method to measure TFCP. We consider each region as a DMU, and suppose each region uses capital and labor to produce desirable output together with undesirable output. In this paper, the input factors include capital and labor. The desirable output is provincial real GDP, the undesirable output is carbon emission. In order to model such a production process, we need to introduce Shephard carbon distance function. Referring to [62], the Shephard carbon distance function is defined as:
D = K , L , Y , C = s u p θ : K , L , Y , C / θ P
where, K, L, Y and C denote capital, labor, real GDP and carbon emission separately; P refers to the production technology (PPS) and is defined as:
P = K , L , Y , C : K , L c a n p r o d u c e Y , C

4.1.2. DEA

DEA was first put forward by Charnes and Cooper in 1978, and had been widely applied in different industries and sectors to measure efficiency, where the presence of multiple inputs and outputs makes comparison difficult [22]. DEA mainly uses mathematical programming and input-output functions to determine effective stochastic frontiers, the commonly used models are CCR model with constant return to scale and BCC model with changeable return to scale. Since it is difficult to keep the scale return of each region in the Yellow River Basin unchanged while investing less and obtaining excellent output, we select BCC model to study carbon productivity. Suppose there are k DMUs, and each DMU has n inputs and m outputs, input vector is X i = x 1 i , x 2 i , x n i T , output vector is Y i = y 1 i , y 2 i , y m i T , λ i is weight coefficient and it is parameter, ε e i , s + , s are relaxation variables, the BBC model is displayed as follows:
min θ ε e T s + e T s + = v s . t . i = 1 n λ i X i + s = θ X i 0 i = 1 m λ i Y i s + = Y i 0 λ i = 1 λ i 0 , j = 1 , 2 , , n s + 0 , s 0
where, if ν = 1 , decision making unit is valid; otherwise, it is invalid.

4.1.3. Malmquist Carbon Productivity Index

The core aim of traditional DEA model is to measure the static relative efficiency of different DMUs in the same period. Comparatively, Malmquist index model is targeted to measure the dynamic efficiency of time series data. Strictly speaking, the Malmquist index model is a dynamic efficiency analysis of the data of each DMU in different periods, including technological efficiency changes and technological progress indexes.
The Malmquist index was first proposed by Swedish economist Malmquist (See Malmquist [63] for more details). Later, Fare [50] combined it with DEA to support an effective method to measure the change of TFP. Referring to [52], we utilize the Malmquist index to measure and decompose the TFCP of the study area. Based on the Shephard carbon distance function, the TFCP using Malmquist index is defined as:
M C P I i t , t + 1 = D t K i t , L i t , Y i t , C i t × D t + 1 K i t , L i t , Y i t , C i t D t K i t + 1 , L i t + 1 , Y i t + 1 , C i t + 1 × D t + 1 K i t + 1 , L i t + 1 , Y i t + 1 , C i t + 1 1 2
Where, MCPI represents the measurement of the TFCP, D t · and D t + 1 · refers to the Shephard carbon distance function regarding the production technology at period t and period t + 1 , respectively.
Additionally, MCPI can be decomposed into technological efficiency change component (EFFCH) and technological progress change component (TECCH) to gain a deeper insight into the sources of TFCP growth [50], which is displayed in Equations (10)–(12):
M C P I i t , t + 1 = E F F C H i t , t + 1 × T E C C H i t , t + 1
E F F C H i t , t + 1 = D t K i t , L i t , Y i t , C i t D t + 1 K i t + 1 , L i t + 1 , Y i t + 1 , C i t + 1
T E C C H i t , t + 1 = D t + 1 K i t + 1 , L i t + 1 , Y i t + 1 , C i t + 1 D t K i t + 1 , L i t + 1 , Y i t + 1 , C i t + 1 × D t + 1 K i t , L i t , Y i t , C i D t K i t , L i t , Y i t , C i t
where, M C P I i t , t + 1 stands for TFCP change from period t to period t + 1 , E F F C H i t , t + 1 represents the technological efficiency component and reveals the change in distance of actual production activity relative to the production frontier. T E C C H i t , t + 1 denotes technological progress component and captures the changes in the production frontier along the CO 2 direction. If EFFCH > 1, it gets closer to the production frontier, evidencing a catching-up effect. If EFFCH < 1, it moves further away from the production frontier, indicating an efficiency deterioration. If TECCH > 1, it traces advances in technology. Otherwise, it means technology regression.

4.2. Global Spatial Autocorrelation

Global Moran’s I index reflects whether there is spatial relevance of the TFCP, and the formula is as follows:
I = n i = 1 n j = 1 n W i j y i y y j y i = 1 n j = 1 n W i j y i y 2
where, I is the global Moran’s I value, n represents the number of observations, y i and y j represent the TFCP of location i and location j, y ¯ donate the mean of TFCP in the study area, W i j refers to spatial weight matrix, representing the spatial relationship of location i relative to location j. We select the adjacency geographic distance to measure the adjacency between locations, that is, when location i is adjacent to location j, W i j = 1 , otherwise, W i j = 0 . The value of Moran’s I is between −1 and 1, if I > 0 , it indicates that there is positive spatial autocorrelation; if I = 0 , it indicates that the spatial distributions are independent of each other. The larger the absolute value of Moran’s I index, the stronger the spatial correlation of provincial TFCP; Otherwise, it means the spatial correlation is weaker.

4.3. Kernel Density Estimation Method

As is discussed in [64], it needs to compare the average growth level and analyze the relative differences to study the output performance heterogeneities of different economies. We first measure the cumulative TFCP ( C M C P I i t ), cumulative relative technological efficiency ( C M E F i t ), and cumulative relative technological progress ( C M T E i t ) of region i in period t, and the formula is:
C M C P I i t = 1 1 + D i t 0 x i t 0 , y i t 0 , b i t 0 ; y i t 0 b i t 0 × t = t 0 t M C P I i t
C M E F i t = 1 1 + D i t 0 x i t 0 , y i t 0 , b i t 0 ; y i t 0 b i t 0 × t = t 0 t E F F C H i t
C M T E i t = 1 1 + D i t 0 x i t 0 , y i t 0 , b i t 0 ; y i t 0 b i t 0 × t = t 0 t T E C C H i t
where, D i t 0 x i t 0 , y i t 0 , b i t 0 ; y i t 0 b i t 0 is the obtained direction distance function, 1 / D i t 0 x i t 0 , y i t 0 , b i t 0 ; y i t 0 b i t 0 is used to measure the environmental efficiency of observation points, M C P I i t , E F F C H i t , T E C C H i t is the TFCP, technological efficiency and technological progress of region i in period t, separately.
The kernel density estimation method is used to intuitively reflect the dynamic evolution characteristics of cumulative TFCP and its decomposition terms, and explore their relative differences. The expression of kernel density is as follows:
f x = 1 N h i = 1 n K X i x h
where, x is observation vector, N donates the number of observation samples, h is the bandwidth, reflecting curve smoothness, X i refers to independent and identically distributed sample, K represents kernel function. The commonly used Epanechikov is adopted in this study.

4.4. Indicator Selection

The statistical descriptions of the variables used in this study are summarized in Table 1. It is not surprising that labor force and capital stock are necessary input variables. The real provincial GDP is used as desirably economic output variable, and CO 2 represents undesirable output variable, hopefully the less, the better. The evaluation indicators are described below in detail:
(1) Labor force (L). For the sake of the inaccessibility of the data of working hours, the number of provincial employed persons is applied as the indicator of labor input. We select the total employed persons at the end of 2007–2017 as the representative indicator of labor force.
(2) Capital stock (K). There is no currently statistical data on capital stock in China. Based on different methodologies and data, the measurement methods and procedures of provincial capital stock may lead to variations in reported results of TFCP analysis. In most studies, provincial physical capital stocks are usually re-constructed by individual researchers based on official statistics. Referring to previous scholars [34], we utilize the Perpetual Inventory Method (PIM) to estimate capital stocks in this study. To avoid the impact of price fluctuation, it is noted that all nominal variables are converted into 2007 constant price (100 million yuan) using the Gross Domestic Product deflator.
The expression of the capital input indicator is defined as follows:
K i , t = I i , t + 1 δ i , t K i , t 1
where, t and i represent the year and region respectively. K i , t denotes capital stock in year t of region i, δ i , t stands for the depreciation rate of capital in year t of region i, I i , t refers to fixed asset investment in year t of region i. It is worth noting that a unified capital depreciation rate will inevitably cause deviations when regional economic development differences are considered. This paper applies the relevant depreciation rates of the regions along the Yellow River Basin.
(3) Undesirable output: carbon emission (C). We choose carbon emission as an undesirable output indicator. This paper adopts the calculation method proposed by the IPCC. In order to unify the measurement unit, it is required to convert different kinds of energy consumption into standard coal firstly, then calculate provincial carbon emission based on the carbon emission coefficient of each energy source. This calculation method is defined as Equation (19) below:
C T = i = 1 m C i t = 44 12 j = 1 n E i j t × N C V j × C E F j × C O F j
where, C T represents the total carbon emission, C i t donates the carbon emission in the year t of the region i. E i j t refers to the energy consumption of the energy source j in the year t of the region i, and is calculated by standard coal. N C V j means the Net heat value of energy source j. C E F j and C O F j are the carbon emission factor and carbon oxidation factor of unit calorific value equivalent, separately.
Additionally, 14 types of energy consumption such as coal, crude oil and natural gas are selected as research indicators. Considering China’s energy utilization process and referring to relevant scholars [56,65], the carbon emission factor and carbon oxidation factor are consequently determined (Table A2).
(4) Desirable output: provincial GDP (Y). Provincial GDP in 2007–2017 is used as the representative economic output, the bigger, the better. Each provincial GDP and its corresponding GDP deflator (2007 as basic year) are acquired from the official website of National Bureau of Statistics (The website is available at: http://www.stats.gov.cn/).

4.5. Data Source and Preprocessing

It is worth noting that the range of selected variables in this paper is set to be consistent with the previous literature to avoid omitted bias. Based on existing research results, we select energy consumption, output of major industrial products, output of major crops, crop economic coefficient, crop carbon absorption rate, GDP, population as basis data. In view of the continuity, availability and accuracy of relevant data in various areas, as well as the official release of the Responding to Climate Change: China’s Policies and Actions (The State Council Information Office of the People’s Republic of China. The website is available at: http://www.scio.gov.cn/zfbps/ndhf/44691/Document/1715537/1715537.htm (accessed on 27 October 2021)) by Chinese government in 2007, the study period is set from 2007 to 2017.
The data in this paper have been compiled mainly from China Energy Statistical Yearbook, China Statistical Yearbook, China Environmental Statistical Yearbook, China Agricultural Yearbook, and the provincial statistical yearbooks. Additionally, Interpolation and moving average are also applied for data completion of some regions in some years. In order to align this research with practice, part of data is also obtained through documentation and fieldwork. The above data are based on the actual data of the current year.

5. Empirical Results and Analysis

Based on the research methodology and data presented in last chapter, this chapter discusses the overall spatiotemporal changes and spatial distribution characteristics of the TFCP, carries out the spatial autocorrelation analysis and dynamic evolution analysis of the TFCP in the Yellow River Basin.

5.1. Overall Spatial-Temporal Changes Analysis of TFCP Growth

The spatial pattern research is used to reveal the aggregation phenomena in the Yellow River Basin. Table 2 reports the variance and spatial distribution of carbon productivity in 2007–2017. It is on the rise with the linear growth of GDP, presenting a significant upward trend. The mean of carbon productivity increased from 1200 yuan/ton in 2007 to 4600 yuan/ton in 2017, with an increase of 283.3%. We employ DFAP2.1 software for the estimation and decomposition of TFCP, and the results are shown in Table 3. The overall changes of TFCP fluctuate during the sample period, and year-on-year growth rate is basically increasing. In 2008–2009, the TFCP of most provinces declined due to global economy downturn affected by financial crisis. With softening demand in China, it imposed negative impact on the investment-driven economic growth of China, and MCPI growth slowed down and dropped. Under the guidance of macroeconomic policies such as the supply-side reform policy, social economy maintains an expeditious growth through industrial structure adjustment and economic mode transition, MCPI has begun to edge up in the following years. The evaluation results are in accordance with our earlier observation.
According to previous research [62], we further decompose MCPI to formulate productivity growth change and its components decomposition. The mean values of EFFCH and TECCH are 1.008 and 1.016 in 2007–2017, respectively, indicating technological efficiency and progress contribute 0.8% and 1.6% separately to TFCP growth. It can be seen that TFCP growth is the result of technological progress and efficiency change working together, and technological progress is the dominant driving force. When it comes to the technological change, the average value of EFFCH ranged from 0.986 in 2007 to 1.019 in 2017, and the average value of TECCH ranged from 1.001 in 2007 to 1.041 in 2017, evidencing that the promotion effect of scientific and technological innovation on momentum conversion is increasingly apparent.
One potential explanation for these results is that since the “11th Five-Year Plan” (2006–2010), relevant policies and countermeasures for emission reduction have been introduced, and the importance of technological innovation in boosting economic growth has been stressed. In 2013, the Chinese government promulgated the National Climate Change Adaptation Strategy and Clean Air Action Plan, which aimed to build a climate-resilient society. According to statistics from NDRC (The NDRC of People’s Republic of China. The introduction work related to ecological civilization construction. Available from: https://www.ndrc.gov.cn/xwdt/wszb/stwmjsyggzqk/wzsl/202209/t20220922_1335923.html?code=&state=123 (accessed on 22 September 2022)), out of entire 4000 billion yuan investment, 210 billion yuan had been allocated to energy conservation during the “11th Five-Year Plan”, and 370 billion yuan had been allocated to technological innovation related to renewable energy supply and efficient end-use. As revealed by the NDRC (The NDRC of People’s Republic of China. Walk out a green, low-carbon and high-quality development path in the past decade. Available from: https://www.ndrc.gov.cn/wsdwhfz/202209/t20220926_1336342.html?code=&state=123 (accessed on 26 September 2022)), China’s investment in renewable energy has ranked first in the world for many years, with the cost of renewable energy decreasing day by day. Of particular concern is numerous solar and wind farms have been built in the Yellow River basin, the installed capacity of wind power and photovoltaic reach 140 million kilowatts and 120 million kilowatts respectively in 2021, accounting for 46.7% and 43.3% of the national total. Clean Development Mechanism (CDM) and lagre-scale development of biomass energy has been achieved in this area. Additionally, regions along the river actively implement the relevant measures of Technological Innovation to Promote Technological Progress promulgated by the State Council, which increases the supply of green and low-carbon products in the field of transportation, vigorously promotes energy-saving and new energy vehicles, strengthens vehicle integration technology innovation, and improves the concentration of new energy vehicle industry. All of the above is beneficial for efficiency improvement and TFCP growth.
Another possible explanation is the Yellow River Basin has been committed ecological civilization construction. According to the report of the National Forestry and Grassland Administration (The National Forestry and Grassland Administration. Available from: http://www.forestry.gov.cn/main/131/index.html (accessed on 8 April 2023)), through major ecological projects, the forest area of the Yellow River Basin has increased by 5.63 million hectares, the forest coverage rate has increased from 11.06% to 21.83%, and the comprehensive vegetation coverage has reached 59% over the past 40 years. The National Grassland Monitoring Report 2017 shows that the total area of grasslands in China is 39.28 million hectares in 2017, and the grassland area of the Yellow River basin is 17.23 million hectares, accounting for 43.86% of the total area in China. More importantly, we carry out a special study on the outstanding problems of forest and grass ecological protection and restoration, launch the comprehensive monitoring of forest and grass resources in the Yellow River basin, and formulate The Plan for Forest and Grass Ecological Protection in the Yellow River Basin, and form The Monitoring Report on Forest and Grass Resources and Ecological Conditions in the Yellow River Basin as well as The Comprehensive Monitoring Plan for Forest and Grass Resources in the Yellow River Basin (See more details in The State Council of People’s Republic of China. Ecological environment protection planning of the Yellow River basin. Available from: http://www.gov.cn/zhengce/2022-06/30/content_5698484.htm (accessed on 30 June 2022)). These measures have promoted the low-carbon economy development and further increased TFCP in this vast area. So one promising path is to combine efficiency improvement and technology enhancement without detrimental consequences to economic society.

5.2. Spatial Distribution Characteristics Analysis of TFCP Growth

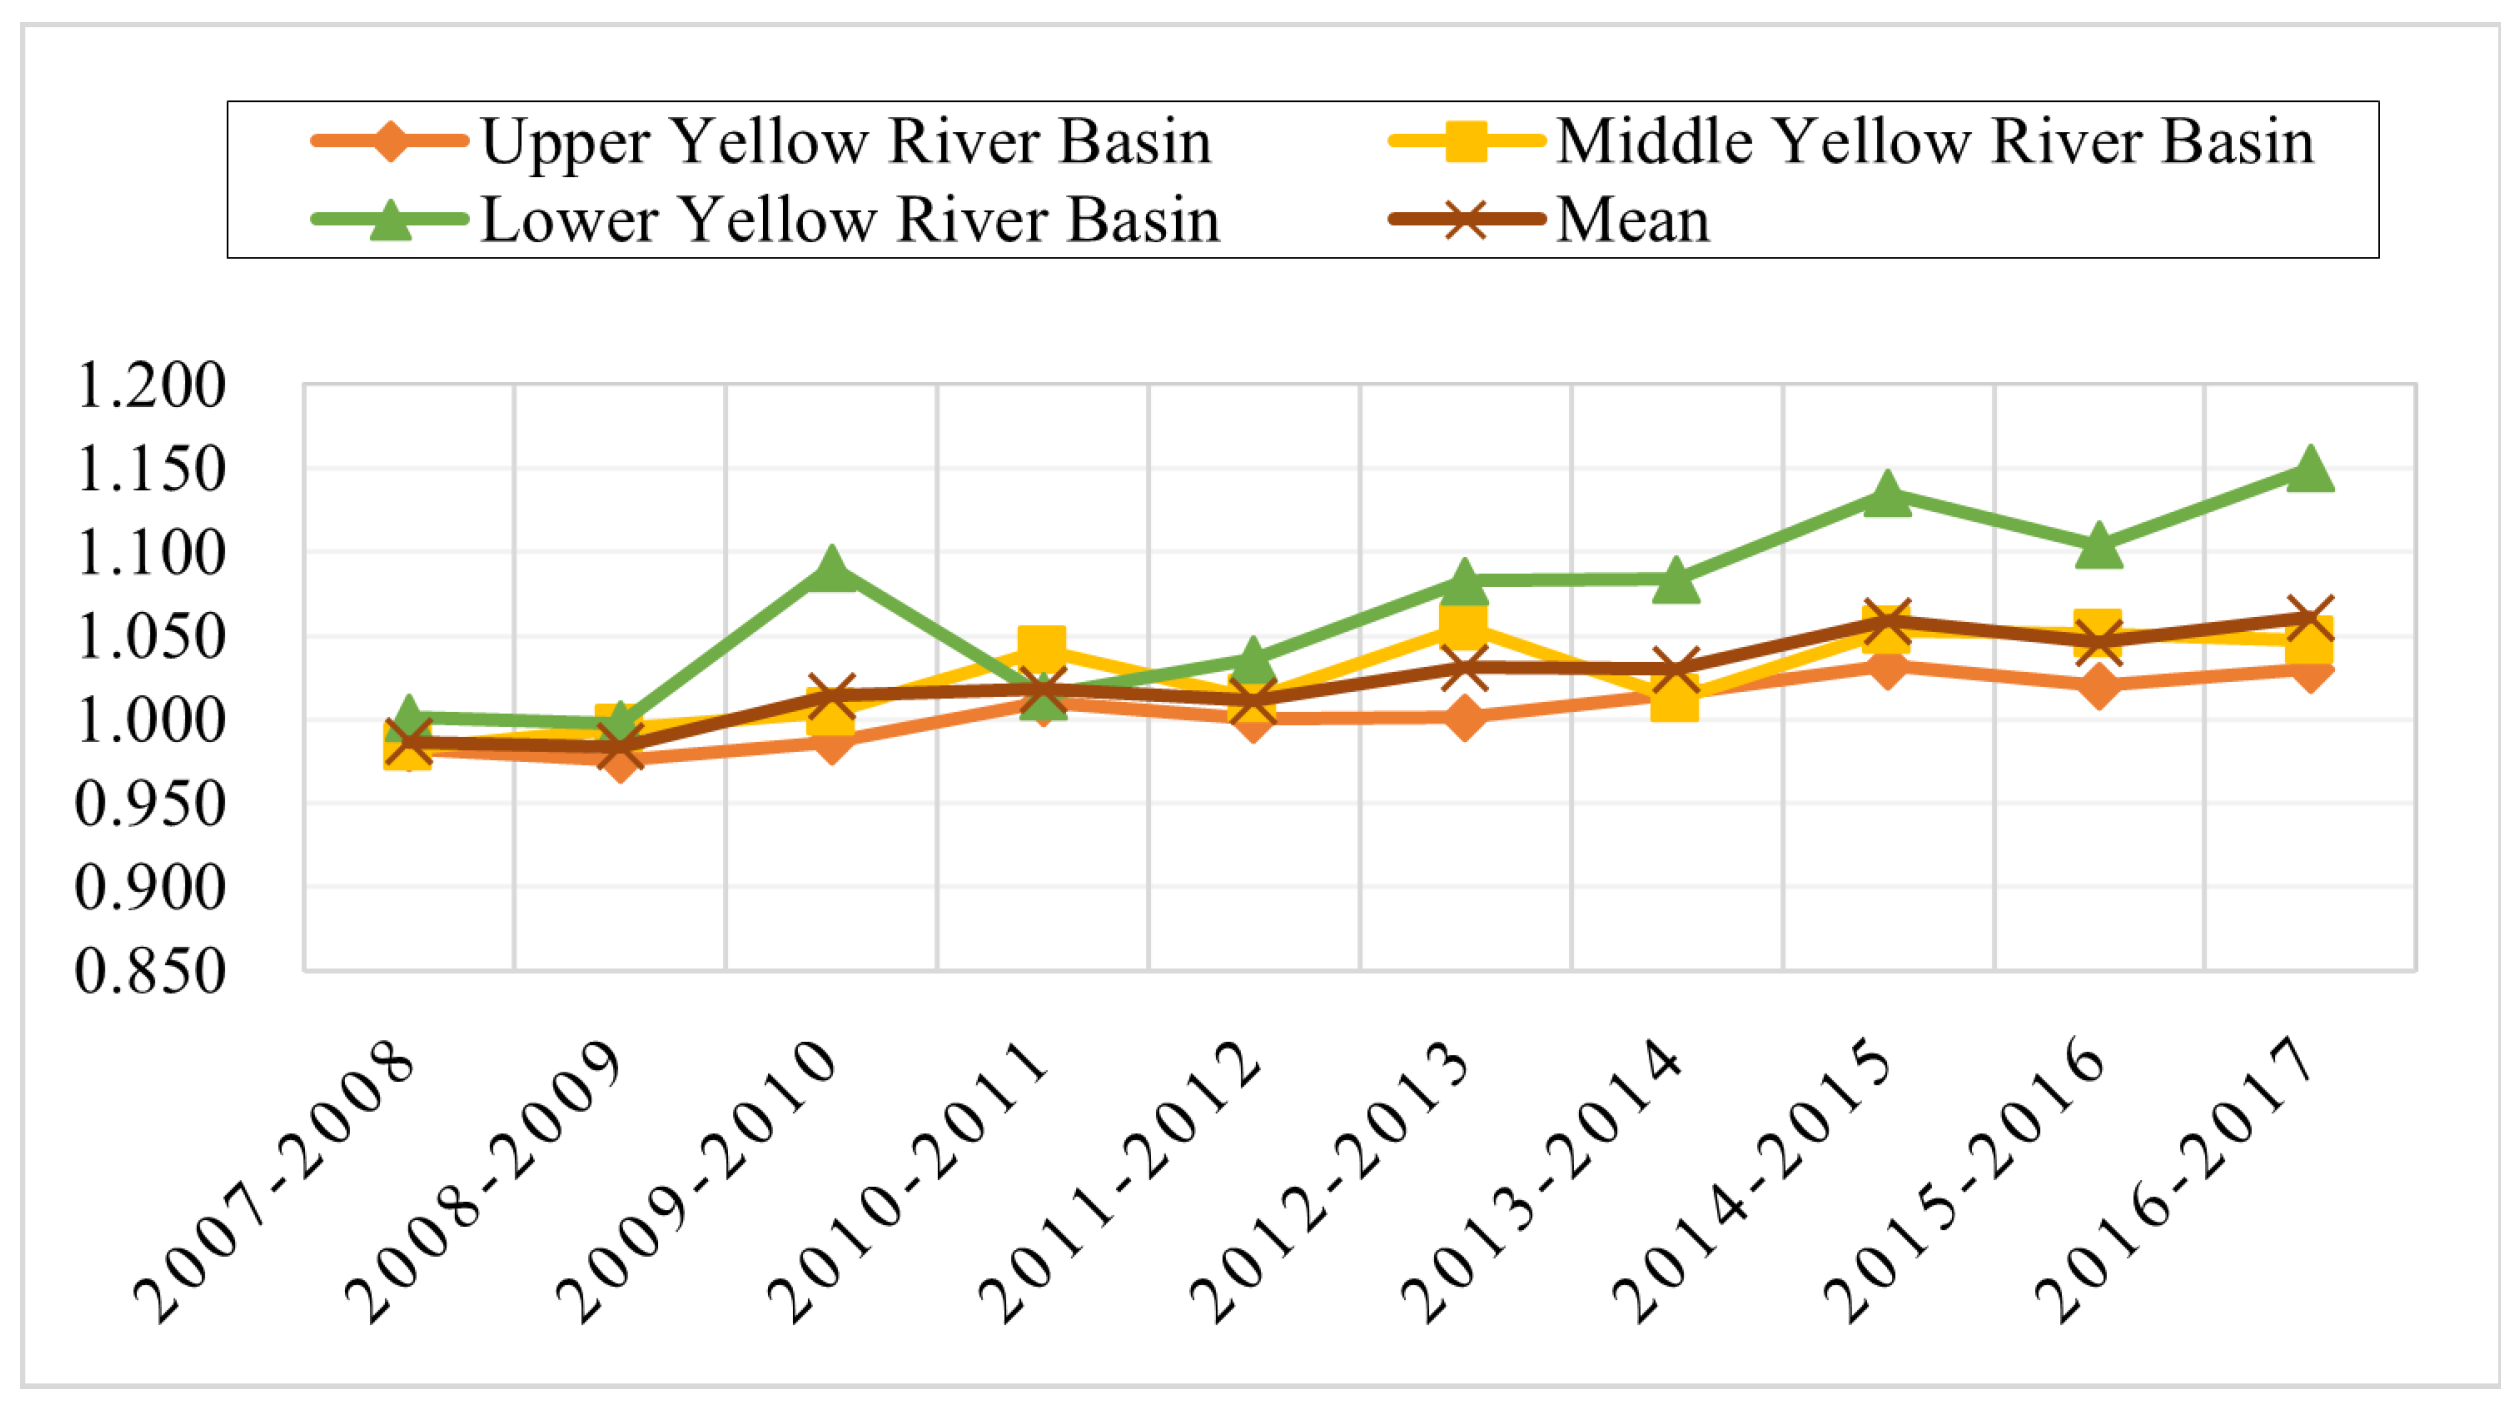
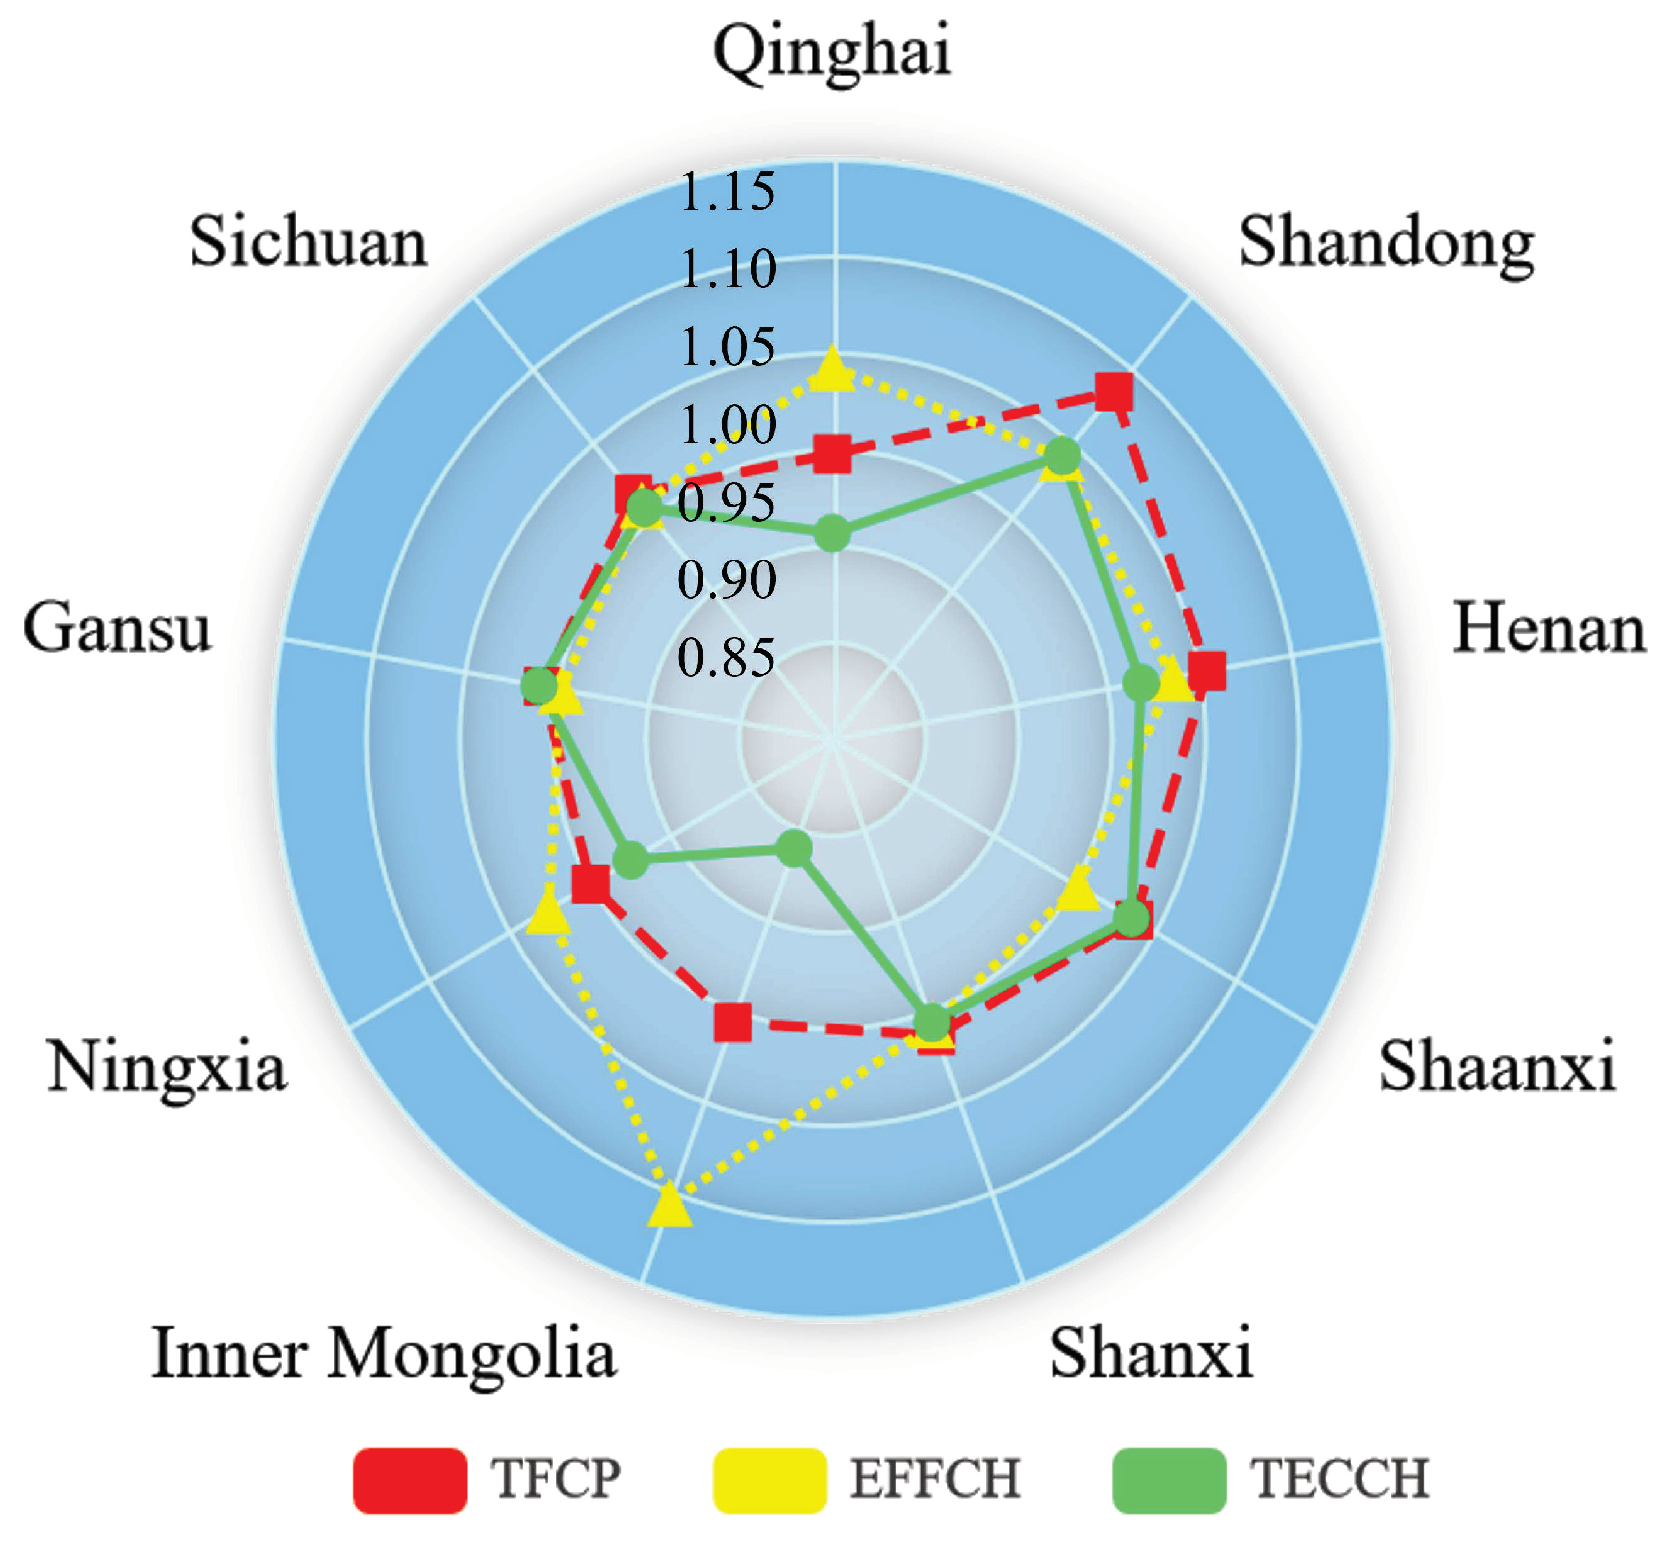
The Yellow River Basin is vast, areas along this river are of great diversity. At regional level, TFCP presents an evolution pattern characterized by the lower watershed is higher than the middle and upper watersheds, while the middle watershed exhibits obvious catching-up effect in 2007–2017 (Figure 3). The TFCP growth has been achieved in most provinces while others see decline (Table 4). The mean of TFCP in Shaanxi, Henan and Shandong is higher than the mean of the overall basin, with Qinghai the lowest performance (0.998) and Shandong the highest performance (1.085). In terms of decomposition efficiency change, EFFCH is greater than 1 except for Gansu, TECCH is greater than 1 except for Qinghai, Ningxia and Inner Mongolia and exhibits catching-up effect (Figure 4). It indicates that Sichuan, Shanxi, Shaanxi, Henan and Shandong have developed in an all-round way in 2007–2017, giving due consideration to resource allocation and output scale in low-carbon development, so the TFCP has achieved accelerated growth.
The average growth rates of TFCP in the upper, middle and lower watershed are 0.6%, 2.5% and 6.9% respectively (It is calculated by the author according to Table 4, while the sources of TFCP growth are of wide difference.) In the upper and middle watershed, the impetus of technical efficiency is stronger than that of technical progress, and the role of technological progress is weaker, making these two watersheds are technical efficiency dominated. This reveals that these two areas are keeping strive for efficiency enhancement through factors combination and resource management. In effect, these two areas are relatively backward areas in economy, with large-scale coal bases of China such as Sichuan, Gansu, Ningxia, Inner Mongolia. Counties along these watersheds are a typical region of spatial coupling between fragile ecological environment and poverty, presenting a highly consistent coupling phenomenon on geospatial scale. Their economic development mode relies heavily on energy consumption and technological innovation is rather scarce, so the upper and middle watersheds are not “Technical Innovator” in TFCP growth.
In the lower watershed, the MCPI growth averages 3.4% in 2007–2017, and the contribution of technological efficiency and progress are 0.8% and 1.6%, respectively (Table 3). So the TFCP growth is a combined result of technological progress and technological efficiency, and technological progress is a more powerful force. This can be explained that the technology and management level is more mature with continuous marketization improvement, and the marginal productivity of factor input is reduced, resulting in sufficient efficiency growth. It also shows that the economic development of these provinces tends to be resource-intensive and environment-friendly. This is much compatible with the reality. Cities in the lower watershed are located in the “Yellow River Economic Belt”, due to substantial advancement of technological progress, the optimal production frontier is driven outward through technological innovation. Therefore, it is the foremost contributor to TFCP growth in the overall basin.
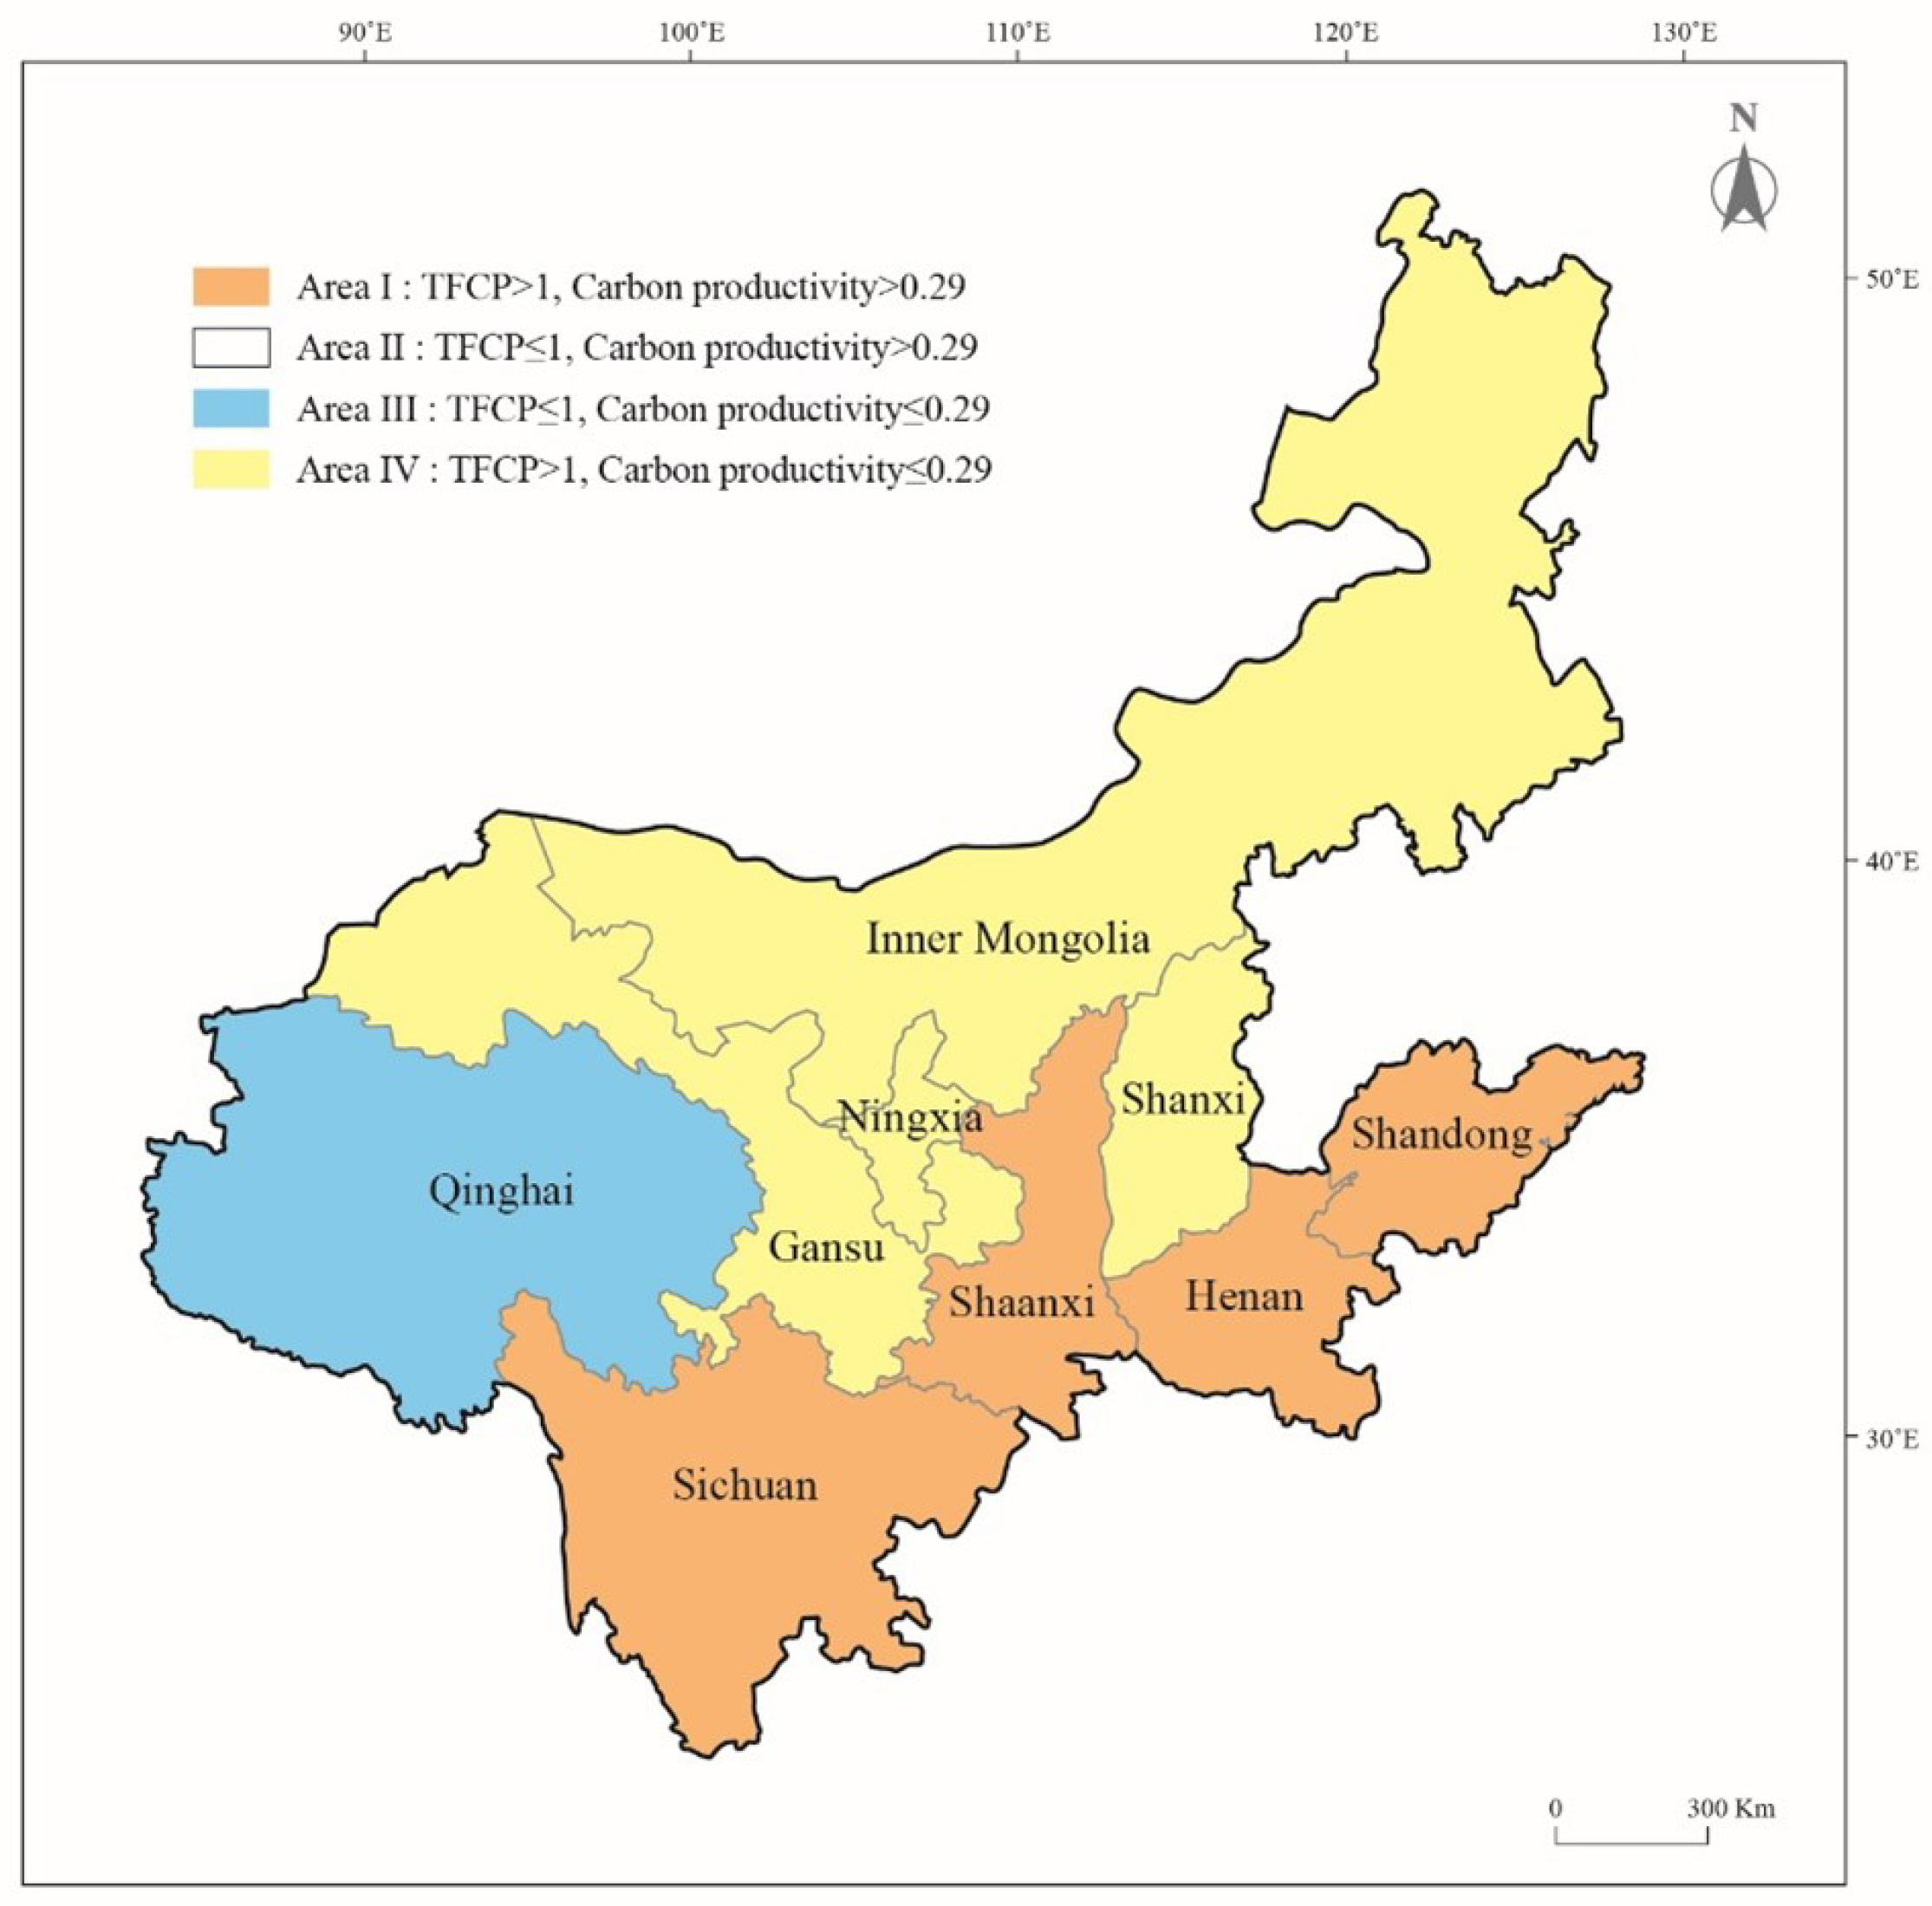
The year average value of carbon productivity in 2007–2017 is 2900 yuan/ton (Table 2), referring to prior studies [5,20], we classify areas with average value more/less than 2900 yuan/ton as high/low carbon productivity area. If the MCPI is higher than 1, these areas belong to high TFCP areas, otherwise, they are low TFCP areas. On this basis, the 9 provinces (autonomous region) can be classified into 4 categories: Area I (high carbon productivity, high TFCP), Area II (low TFCP, high carbon productivity), Area III (low TFCP, low carbon productivity), Area IV (high TFCP, low carbon productivity), as is shown in Figure 5.
Obviously, TFCP and carbon productivity do not change in the same direction. Henan, Shandong, Sichuan and Shaanxi are located in Area I, which is in line with the reality that these four provinces have recognized the significance of coordinated development of social economy, and have attached great importance to technological progress over past decades. Qinghai is located in Area III where TFCP and carbon productivity are both relatively low. This is because its economic development and technological innovation are relatively backward, it is reasonable to infer that there is tremendous potential for TFCP increase in Qinghai. Area IV includes Shanxi, Ningxia, Gansu and Inner Mongolia, where technological efficiency is improving and technological progress is getting worse. It is therefore advisable to push the production possibility boundary outward through continuous technological innovation.
Through above analysis, empirical evidence verify that regional disparity effect exists, and confirm that different regions have different production frontiers. Meanwhile, the spatial-temporal difference highlights the uneven speed of regional development. There is a synergetic evolution law between TFCP and regional economy, and the similarity of industrial structure and economic patterns of different regions may lead to resemble in economic scale and development. It is possible that TFCP growth is slow since the economy remains sluggish, resulting in insufficient investment in technology R&D and technology transformation. Once the GDP rises, the technology R&D investment increase and technological innovation is improved subsequently. Therefore, economic development level and technological innovation capability may be the critical reasons for TFCP growth. Besides, “rich coal, lack of oil, less gas” energy structure determines the demand and supply of coal in the foundation position in China’s energy for a long time are hard to change. As revealed by the China Mineral Resources Report (2017) (See more details from the website: https://www.mnr.gov.cn/sj/sjfw/kc_19263/zgkczybg/201710/t20171017_1997930.html (accessed on 17 October 2017)), with the westward shift of China’s energy strategy, the coal development intensity of Shanxi, Shaanxi, Inner Mongolia and Ningxia has been increasing, energy mix and industrial structure is biased, which puts a brake on the quality of social economy. It reveals that energy utilization and industrial structure widen the TFCP gaps between regions, and interregional environment governance is extremely difficult.

5.3. Spatial Autocorrelation Analysis of TFCP Growth

Global Moran’s I index reflects the global characteristics of TFCP. We use the Global Moran’s I to analyze the spatial characteristics of TFCP in the study area. Table 5 reports the test results of spatial autocorrelation, it can be seen that Moran’s I index is all positive in 2007–2017, indicating that there is a significant positive spatial correlation between provincial TFCP. In addition, the p-value < 0.05 and the z-score > 1.96 suggest that TFCP presents spatial aggregation characteristics, and the regions with high (low) TFCP of this study area are adjacent to each other.
This is because neighboring provinces have close similarity in economic foundation, cultural environment and resource endowment, making the spatial correlation between factor inputs and TFCP in the industry production process is relatively high. Meanwhile, the exchange and promotion of clean technology in neighboring provinces also make the low-carbon development of the study area spatially relevant. Additionally, Moran’s I index shows a rising trend of fluctuation during the sample period, indicating that with the development of transportation and communication facilities, economic and technological exchanges in various regions have become closer, and the spatial autocorrelation of TFCP in the Yellow River Basin has become increasingly higher.

5.4. Dynamic Evolution Trend Analysis of TFCP Growth

To avoid curve overlap and facilitate curve changes observation, we select 2007, 2008, 2011, 2014 and 2017 as the investigation profiles, the kernel density distribution at each cumulative level is shown in Figure 6. It can be seen from the Figure 6a that the kernel density curve of cumulative TFCP decreases year by year and drifts to the right, and the data of right tail increases with time, indicating that the cumulative TFCP of the Yellow River basin increases significantly during the study period. In 2007–2011, the right tail of the curve presents a multi-peak distribution, showing that the cumulative TFCP distribution of the Yellow River basin is concentrated in a small area, and there are also some characteristics of club convergence. In 2014–2017, the multi-peak phenomenon gradually diminishes at the right tail of the curve, the wave crest gradually broadens to unimodal distribution, which means that the provincial gap of cumulative TFCP has expanded, and the high-level provinces is rather limited.
As is shown in Figure 6b, the curve of cumulative relative technical efficiency of the Yellow River basin is apparently bimodal or even trimodal in 2007–2011, yet the curve is mainly unimodal in 2014–2017. In addition, the length of the right tail is greater than the left tail, suggesting that the distribution of CMEF is relatively divergent, and provincial gap of efficiency growth is large. However, the length of the right tail shortens with time, presenting signs of moving to the left, and the curve turns from multi-peak to single peak performance. This indicates that the distribution of CMEF tends to concentrate in recent years, and the gap between different provinces is gradually narrowing, while the efficiency improvement is not ideal, exhibiting a worsening trend.
The peak height of the CMTE curve decreases significantly and shifts to the right, as is shown in Figure 6c, indicating that the technological level of most provinces is gradually improving. In 2007–2011, it is found that double and triple peak distribution appear and the right tail is not obvious, showing that there is little difference between provinces in this period. In 2014–2017, the wave crest height decreases significantly and exhibits obvious right tail, indicating that inter-provincial differentiation is significant and only a few regions grow rapidly during this period, and the catching-up effect between lower and higher CMTE provinces is insufficient.

6. Conclusions and Policy Implications

This paper explores the spatial-temporal characteristics and dynamic evolution trend of TFCP in the Yellow River Basin using MCPI, global spatial autocorrelation and kernel density estimation. The results discussed above can be concluded as below:
In general, the average value of TFCP fluctuates around 1 and TFCP growth exhibits spatial aggregation effect in 2007–2017. At the regional level, the middle watershed presents obvious catching-up effect, the lower watershed plays the role of “demonstrator” in TFCP growth. Our empirical results verify regional heterogeneities of TFCP exactly exist.
Secondly, through dynamic decomposition, the contribution of EFFCH and TECCH are 1.008 and 1.016 separately to TFCP growth, and technological progress is the dominant impetus. When it comes to sub-watersheds, the upper and middle watersheds are driven by technological efficiency and progress change exists degradation sign. Our findings highlight the significance of technological progress on TFCP and further strengthen the research and investment on technological innovation.
Finally, Global Moran’s I index reflects there is a significant positive spatial correlation between provincial TFCP, and TFCP presents spatial aggregation characteristics. It is found that the cumulative TFCP exhibits a certain degree of club convergence features through kernel density estimation. The provincial gap of CMEF is narrowing with time and takes on a certain backward trend. The CMTE of most provinces has improved significantly, and the catching-up effect between lower and higher CMTE provinces is insufficient.
The above-mentioned research findings have brought four specific and targeted recommendation to seek new impetus for the further growth of TFCP. It is embodied in the following aspects:
Firstly, what is critical for TFCP growth is to increase their investment in R&D, and to stimulate technological innovation and transformation of scientific and technological achievements, this is of some assistance to narrow the gap with the frontier technology and to break development bottlenecks. It is also of vital necessity to reduce substantially the cost of mitigating carbon emissions with the development of more affordable technologies such as renewable technologies, carbon sequestration technologies and energy storage technologies through technological innovation and technological diffusion. In order to generate institutional environment in favor of innovation, strict environmental regulation is suggested to promote the realization of innovation by putting external pressure on pollution-intensive areas and providing direction for technological innovation. All of this would deepen technical reform and further promote TFCP growth.
Secondly, based on the regional heterogeneities of TFCP and its impetus, differentiated and diversified development strategies should be specially designed across different regions in the overall basin. Different regions should fully consider their functional positioning, resource endowment and industrial structure, and adopt prudent measures to improve TFCP. It is noteworthy that the access conditions, regulatory rules and standards system need to be enhanced to curb the blind expansion of energy-intensive industry in resource-based provinces such as Ningxia, Gansu, Sichuan and Inner Mongolia. Special emphasis should be placed on the lower watershed, major urban agglomerations and technology-intensive industries by considering their special attributes of TFCP advancement. Especially, some “scattered, chaotic and polluting” enterprises in the “Golden Triangle of Energy” of the upper-middle reaches should be rectified to reduce the impact on TFCP growth.
Thirdly, the significant spatial aggregation effect of TFCP and the club convergence features of cumulative TFCP highlight the importance of cross-regional and cross-industrial cooperation. As the Yellow River spans nine provinces (autonomous regions), regional industrial policy and layout are fragmented, and unified planning mechanism is not formed. It is advisable for different regions to integrated into the coordinated development of the overall basin. We should break the administrative barriers between different regions through further open up, and build a long-term linkage and synergy mechanism for carbon reduction. This might be beneficial to cultivate high-tech industry and new economic growth point, and further enhance TFCP through urban agglomeration effect and industrial agglomeration effect. Besides, this would reduce the spatial spillover effect and narrow regional gaps of TFCP.
Finally, there is a strong demand for strengthening the top-level design of green development in the Yellow River Basin, and formulating more resilient and sustainable economic development plans and emission reduction plans. It is requisite to make a good start in momentum conversion and accelerate the removal of backward production capacity to help form a green way of production and living from all aspects such as low-carbon urban planning, industrial system optimization, carbon financial incentives, carbon sink construction, carbon market trade and public awareness stimulation. Hence, the collaborative emission-reduction mechanism of “government-enterprise-market-residents” could be specially designed, this would strike a balance between the social economy evolution and TFCP in the long run.

Author Contributions

Conceptualization, M.M.; methodology, S.K.; software, Q.L.; validation, S.K. and Q.L.; formal analysis, M.M. and S.K.; investigation, Y.W.; resources, M.M.; data curation, Q.L. and Y.W.; Writing—original draft preparation, M.M. and Q.L.; Writing—review and editing, M.M., S.K. and Y.W.; visualization, Q.L.; supervision, S.K.; project administration, M.M.; funding acquisition, M.M. and Q.L. All authors have read and agreed to the published version of the manuscript.

Funding

This paper was funded by National Social Science Fund (No. 21XMZ051), the National Natural Science Foundation (No. 61962002, 72101006), the Natural Science Foundation of Ningxia (No. 2022AAC05040), and the Supporting Plan for Outstanding Young Talents Project in Ningxia, China.

Institutional Review Board Statement

Not applicable.

Informed Consent Statement

Not applicable.

Data Availability Statement

Data is generated during the study from annual reports available in China Energy Statistical Yearbook, China Statistical Yearbook, China Environmental Statistical Yearbook, China Agricultural Yearbook, and the provincial statistical yearbooks. In order to align this research with practice, part of data is also obtained through documentation and fieldwork.

Acknowledgments

The authors thank Weidong Xu for valuable and constructive comments. We thank anonymous reviewers for their helpful comments and suggestions which led to an improved version of this paper.

Conflicts of Interest

The authors declare no conflict of interest.

Abbreviations

The following abbreviations are used in this manuscript:
TFCPTotal factor carbon productivity
MCPIMalmquist carbon productivity index
TFPTotal factor productivity
TFEPTotal factor energy productivity
SFAStochastic Frontier Approach
DEAData Envelopment Analysis

Appendix A

Table A1. Energy statistics of the Yellow River Basin 1.
Energy TypeProportion in the Country (%)Proportion in the Total Amount of the Whole Basin (%)
Upper WatershedMiddle WatershedLower Watershed
Coal66.17.089.73.3
Fossil oil23.19.83.686.6
Natural gas383.8/96.2
Hydropower9.170.229.70.1
1 Note: The statistics of Coal, Petroleum and Natural gas are obtained from China Energy Statistical Yearbook. The statistics of Hydropower is the exploitable capacity obtained from water resources bulletin of each province (autonomous regions).
Table A2. Estimated parameters of various fossil fuels for carbon emission measurement 1.
Fuel TypeNet Heat Value (kJ/kg)Carbon Emission Factor (kg C/GJ)Carbon Oxidation Factor
Raw coal20,90825.80.980
Clean coal26,34425.80.980
Other washing coal9,40925.80.980
Coke28,43529.20.980
Coke oven gas173,5012.10.995
Other gas182,7012.10.995
Gasoline43,07020.20.990
Kerosene43,07019.60.990
Diesel fuel42,62520.20.990
Fuel oil41,81621.10.990
Liquefied petroleum gas50,17917.20.995
Refinery dry gas46,05515.70.995
Other petroleum products40,19020.00.990
Natural gas38,931 (kJ/m3)15.30.995
1 Note: Net heat values are obtained from China Energy Statistical Yearbook. Carbon emission factor and Carbon oxidation factor come from the People’ Republic of China Second National Communication on Climate Change.

References

  1. Sierra, C.A.; Metzler, H.; Müller, M.; Kaiser, E. Closed-loop and congestion control of the global carbon-climate system. Clim. Chang. 2021, 165, 15. [Google Scholar] [CrossRef]
  2. Jakob, M. The political economy of carbon border adjustment in the EU. Oxf. Rev. Econ. Policy 2023, 39, 134–146. [Google Scholar] [CrossRef]
  3. Wu, S.; Han, H. Energy transition, intensity growth, and policy evolution: Evidence from rural China. Energy Econ. 2022, 105, 105746. [Google Scholar] [CrossRef]
  4. Zhao, K.; Zhang, R.; Liu, H.; Wang, G.; Sun, X. Resource endowment, industrial structure, and green development of the Yellow River Basin. Sustainability 2021, 13, 4530. [Google Scholar] [CrossRef]
  5. Li, W.; Wang, W.; Wang, Y.; Ali, M. Historical growth in total factor carbon productivity of the Chinese industry–a comprehensive analysis. J. Clean. Prod. 2018, 170, 471–485. [Google Scholar] [CrossRef]
  6. Nibedita, B.; Irfan, M. The role of energy efficiency and energy diversity in reducing carbon emissions: Empirical evidence on the long-run trade-off or synergy in emerging economies. Environ. Sci. Pollut. Res. 2021, 28, 56938–56954. [Google Scholar] [CrossRef]
  7. Debanshi, S.; Pal, S. Assessing the role of deltaic flood plain wetlands on regulating methane and carbon balance. Sci. Total. Environ. 2022, 808, 152133. [Google Scholar] [CrossRef]
  8. Ehigiamusoe, K.U.; Dogan, E. The role of interaction effect between renewable energy consumption and real income in carbon emissions: Evidence from low-income countries. Renew. Sustain. Energy Rev. 2022, 154, 111883. [Google Scholar] [CrossRef]
  9. Liu, C.; Hu, W.; Wu, H. Environmental Regulation, Economic Growth and Regional Carbon Productivity: An Empirical Study Based on Provincial Data in China. Res. Financ. Econ. Issues 2015, 10, 31–37. [Google Scholar]
  10. Xu, K.; Zhang, H. Impact of Environmental Regulation and Technical Progress on Industrial Carbon Productivity: An Approach Based on Proxy Measure. Sustainability 2016, 8, 819. [Google Scholar] [CrossRef] [Green Version]
  11. Sun, W.; Han, Y.; Zhang, F.; Hu, C.; He, Y. Research on carbon productivity of the construction industry in Beijing-Tianjin-Hebei region using system dynamics model. Int. J. Glob. Warm. 2021, 25, 390–407. [Google Scholar] [CrossRef]
  12. Kaya, Y.; Yokobori, K. Environment, Energy, and Economy: Strategies for Sustainability; United Nations University Press: Tokyo, Japan, 1997. [Google Scholar]
  13. Xu, R.; Xu, B. Exploring the effective way of reducing carbon intensity in the heavy industry using a semiparametric econometric approach. Energy 2022, 243, 123066. [Google Scholar] [CrossRef]
  14. Kuosmanen, N.; Maczulskij, T. The Role of Firm Dynamics in the Green Transition: Carbon Productivity Decomposition in Finnish Manufacturing; IZA: Bonn, Germany, 2023. [Google Scholar]
  15. Drescher, K.; Janzen, B. Determinants, persistence, and dynamics of energy poverty: An empirical assessment using German household survey data. Energy Econ. 2021, 102, 105433. [Google Scholar] [CrossRef]
  16. Wang, K.; Xian, Y.; Wei, Y.M.; Huang, Z. Sources of carbon productivity change: A decomposition and disaggregation analysis based on global Luenberger productivity indicator and endogenous directional distance function. Ecol. Indic. 2016, 66, 545–555. [Google Scholar] [CrossRef]
  17. Jahanger, A.; Usman, M.; Ahmad, P. A step towards sustainable path: The effect of globalization on China’s carbon productivity from panel threshold approach. Environ. Sci. Pollut. Res. 2022, 29, 8353–8368. [Google Scholar] [CrossRef]
  18. Yang, Y.; Wei, X.; Wei, J.; Gao, X. Industrial Structure Upgrading, Green Total Factor Productivity and Carbon Emissions. Sustainability 2022, 14, 1009. [Google Scholar] [CrossRef]
  19. Zhai, X.Q.; Xue, R.; He, B.; Yang, D.; Pei, X.Y.; Li, X.; Shan, Y. Dynamic changes and convergence of China’s regional green productivity: A dynamic spatial econometric analysis. Adv. Clim. Chang. Res. 2022, 13, 266–278. [Google Scholar] [CrossRef]
  20. Gao, W.; Zhu, Z. The technological progress route alternative of carbon productivity promotion in China’s industrial sector. Nat. Hazards 2016, 82, 1803–1815. [Google Scholar] [CrossRef]
  21. D’Amato, A.; Mazzanti, M.; Nicolli, F. Green technologies and environmental policies for sustainable development: Testing direct and indirect impacts. J. Clean. Prod. 2021, 309, 127060. [Google Scholar] [CrossRef]
  22. Ren, X.; Ma, Q.; Liu, Y.; Zhao, G. The impact of carbon trading policy on industrial carbon productivity and its transmission mechanism. China Environ. Sci. 2021, 41, 5427–5437. [Google Scholar]
  23. Yu, Y.; Choi, Y.; Wei, X.; Chen, Z. Did China’s regional transport industry enjoy better carbon productivity under regulations? J. Clean. Prod. 2017, 165, 777–787. [Google Scholar] [CrossRef]
  24. Zhan, W.; Zhu, D.; Bai, Z. Research on relationship between industrial carbon emissions and carbon productivity in Shanghai. China Popul. Resour. Environ. 2010, 20, 24–29. [Google Scholar]
  25. Yu, Y.; Qian, T.; Du, L. Carbon productivity growth, technological innovation, and technology gap change of coal-fired power plants in China. Energy Policy 2017, 109, 479–487. [Google Scholar] [CrossRef]
  26. Zhang, N.; Wei, X. Dynamic total factor carbon emissions performance changes in the Chinese transportation industry. Appl. Energy 2015, 146, 409–420. [Google Scholar] [CrossRef]
  27. Chen, G.; Hou, F.; Chang, K.; Zhai, Y.; Du, Y. Driving factors of electric carbon productivity change based on regional and sectoral dimensions in China. J. Clean. Prod. 2018, 205, 477–487. [Google Scholar] [CrossRef]
  28. Gilli, M.; Mancinelli, S.; Mazzanti, M. Innovation complementarity and environmental productivity effects: Reality or delusion? Evidence from the EU. Ecol. Econ. 2014, 103, 56–67. [Google Scholar] [CrossRef] [Green Version]
  29. Cheng, Y.; Sun, Y.; Wang, X. Research on the impact of global scientific and technological innovation on carbon productivity and countermeasures. China Popul. Resour. Environ. 2019, 29, 31–40. [Google Scholar]
  30. Pan, X.; Li, M.; Wang, M.; Chu, J.; Bo, H. The effects of outward foreign direct investment and reverse technology spillover on China’s carbon productivity. Energy Policy 2020, 145, 111730. [Google Scholar] [CrossRef]
  31. Song, W.; Han, X. Heterogeneous two-sided effects of different types of environmental regulations on carbon productivity in China. Sci. Total. Environ. 2022, 841, 156769. [Google Scholar] [CrossRef]
  32. Du, M.; He, L.; Zhao, M.; Wang, J.; Cao, Y.; Li, H. Examining the relations of income inequality and carbon productivity: A panel data analysis. Sustain. Prod. Consum. 2022, 31, 249–262. [Google Scholar] [CrossRef]
  33. Theine, H.; Humer, S.; Moser, M.; Schnetzer, M. Emissions inequality: Disparities in income, expenditure, and the carbon footprint in Austria. Ecol. Econ. 2022, 197, 107435. [Google Scholar] [CrossRef]
  34. Su, B.; Ang, B.W. Multiplicative decomposition of aggregate carbon intensity change using input-output analysis. Appl. Energy 2015, 154, 13–20. [Google Scholar] [CrossRef]
  35. Trinks, A.; Mulder, M.; Scholtens, B. An efficiency perspective on carbon emissions and financial performance. Ecol. Econ. 2020, 175, 106632. [Google Scholar] [CrossRef]
  36. Xiong, C.; Wang, G.; Xu, L. Spatial differentiation identification of influencing factors of agricultural carbon productivity at city level in Taihu lake basin, China. Sci. Total. Environ. 2021, 800, 149610. [Google Scholar] [CrossRef] [PubMed]
  37. Guevara, Z.; Domingos, T. The multi-factor energy input–output model. Energy Econ. 2017, 61, 261–269. [Google Scholar] [CrossRef]
  38. Chen, H.; Guo, W.; Feng, X.; Wei, W.; Liu, H.; Feng, Y.; Gong, W. The impact of low-carbon city pilot policy on the total factor productivity of listed enterprises in China. Resour. Conserv. Recycl. 2021, 169, 105457. [Google Scholar] [CrossRef]
  39. Hu, W.; Xiong, Z. Do stringent environmental regulations help improve the total factor carbon productivity? Empirical evidence from China’s industrial sectors. Appl. Econ. 2021, 53, 6398–6411. [Google Scholar] [CrossRef]
  40. Du, K.; Li, J. Towards a green world: How do green technology innovations affect total-factor carbon productivity. Energy Policy 2019, 131, 240–250. [Google Scholar] [CrossRef]
  41. Lahouel, B.B.; Taleb, L.; Zaied, Y.B.; Managi, S. Does ICT change the relationship between total factor productivity and CO2 emissions? Evidence based on a nonlinear model. Energy Econ. 2021, 101, 105406. [Google Scholar] [CrossRef]
  42. Honma, S.; Hu, J.L. Total-factor energy productivity growth of regions in Japan. Energy Policy 2009, 37, 3941–3950. [Google Scholar] [CrossRef]
  43. Prescott, E.C. Needed: A Theory of Total Factor Productivity. Staff Rep. 1997, 39, 525–551. [Google Scholar]
  44. Ramanathan, R. An analysis of energy consumption and carbon dioxide emissions in countries of the Middle East and North Africa. Energy 2005, 30, 2831–2842. [Google Scholar] [CrossRef]
  45. Kuang, Y.; Peng, D. Analysis of environmental production efficiency and environmental total factor productivity in China. Econ. Res. J. 2012, 47, 62–74. [Google Scholar]
  46. Shen, Y.; Yue, S.; Sun, S.; Guo, M. Sustainable total factor productivity growth: The case of China. J. Clean. Prod. 2020, 256, 120727. [Google Scholar] [CrossRef]
  47. Amin, M.; Zhou, S.; Safi, A. The nexus between consumption-based carbon emissions, trade, eco-innovation, and energy productivity: Empirical evidence from N-11 economies. Environ. Sci. Pollut. Res. 2022, 29, 39239–39248. [Google Scholar] [CrossRef]
  48. Xiaofei, X.; Yanjuan, C.; Yundi, Z. Impact of Environmental Regulation and FDI on Green Total Factor Productivity: Evidence from China. Environ. Eng. Manag. J. (EEMJ) 2021, 20, 177–184. [Google Scholar]
  49. Wang, X.; Lu, Y.; Chen, C.; Yi, X.; Cui, H. Total-factor energy efficiency of ten major global energy-consuming countries. J. Environ. Sci. 2023, 137, 41–52. [Google Scholar] [CrossRef] [PubMed]
  50. Färe, R.; Grosskopf, S.; Norris, M. Productivity growth, technical progress, and efficiency change in industrialized countries: Reply. Am. Econ. Rev. 1997, 87, 1040–1044. [Google Scholar]
  51. Zhang, S. Evaluating the method of total factor productivity growth and analysis of its influencing factors during the economic transitional period in China. J. Clean. Prod. 2015, 107, 438–444. [Google Scholar] [CrossRef]
  52. Bai, C.; Du, K.; Yu, Y.; Feng, C. Understanding the trend of total factor carbon productivity in the world: Insights from convergence analysis. Energy Econ. 2019, 81, 698–708. [Google Scholar] [CrossRef]
  53. Kumar, S.; Khanna, M. Temperature and production efficiency growth: Empirical evidence. Clim. Chang. 2019, 156, 209–229. [Google Scholar] [CrossRef] [Green Version]
  54. Dong, J.; Wu, D. An evaluation of the impact of ecological compensation on the cross-section efficiency using SFA and DEA: A case study of Xin’an River Basin. Sustainability 2020, 12, 7966. [Google Scholar] [CrossRef]
  55. Tan, X.; Choi, Y.; Wang, B.; Huang, X. Does China’s carbon regulatory policy improve total factor carbon efficiency? A fixed-effect panel stochastic frontier analysis. Technol. Forecast. Soc. Chang. 2020, 160, 120222. [Google Scholar] [CrossRef]
  56. Li, Z.; Lin, B.; Luan, R. Impact assessment of clean air action on total factor energy productivity: A three-dimensional analysis. Environ. Impact Assess. Rev. 2022, 93, 106745. [Google Scholar] [CrossRef]
  57. Wang, J.; Sun, K.; Ni, J.; Xie, D. Evaluation and Factor Analysis of Industrial Carbon Emission Efficiency Based on “Green-Technology Efficiency”—The Case of Yangtze River Basin, China. Land 2021, 10, 1408. [Google Scholar] [CrossRef]
  58. Coderoni, S.; Vanino, S. The farm-by-farm relationship among carbon productivity and economic performance of agriculture. Sci. Total. Environ. 2022, 819, 153103. [Google Scholar] [CrossRef] [PubMed]
  59. Alola, A.A.; Bekun, F.V. Pandemic outbreaks (COVID-19) and sectoral carbon emissions in the United States: A spillover effect evidence from Diebold and Yilmaz index. Energy Environ. 2021, 32, 945–955. [Google Scholar] [CrossRef]
  60. Erdoğan, S.; Onifade, S.T.; Altuntaş, M.; Bekun, F.V. Synthesizing urbanization and carbon emissions in Africa: How viable is environmental sustainability amid the quest for economic growth in a globalized world? Environ. Sci. Pollut. Res. 2022, 29, 24348–24361. [Google Scholar] [CrossRef]
  61. Zhang, N.; Zhao, Y.; Wang, N. Is China’s energy policy effective for power plants? Evidence from the 12th Five-Year Plan energy saving targets. Energy Econ. 2022, 112, 106143. [Google Scholar] [CrossRef]
  62. Färe, R.; Grosskopf, S.; Lovell, C.K.; Pasurka, C. Multilateral productivity comparisons when some outputs are undesirable: A nonparametric approach. Rev. Econ. Stat. 1989, 71, 90–98. [Google Scholar] [CrossRef]
  63. Malmquist, S. Index numbers and indifference surfaces. Trab. Estadística 1953, 4, 209–242. [Google Scholar] [CrossRef]
  64. Hall, R.E.; Jones, C.I. Why do some countries produce so much more output per worker than others? Q. J. Econ. 1999, 114, 83–116. [Google Scholar] [CrossRef]
  65. Solaymani, S. CO2 emissions patterns in 7 top carbon emitter economies: The case of transport sector. Energy 2019, 168, 989–1001. [Google Scholar] [CrossRef]
Figure 1. The research framework of this article.
Sustainability 15 06591 g001
Figure 2. Location of the study area. (a) location of the Yellow River Basin in China. (b) boundary map of the upper, middle and lower watershed. (c) energy resource distribution of the study area. Note: Considering the availability of research data, the upper watershed in this paper includes Qinghai, Sichuan, Gansu, Ningxia, and Inner Mongolia, the middle watershed includes Shanxi and Shaanxi, and the lower watershed includes Henan and Shandong.
Sustainability 15 06591 g002
Figure 3. Evolution of MCPI in the upper, middle and lower watershed in 2007–2017.
Sustainability 15 06591 g003
Figure 4. Provincial TFCP and decomposition efficiency change index. Note: The “mean” is the geometric average of TFCP in the Yellow River basin over the years. The values in the figure represent the efficiency change level on the same envelope.
Sustainability 15 06591 g004
Figure 5. Distribution diagram for carbon productivity and TFCP in the Yellow River basin.
Sustainability 15 06591 g005
Figure 6. Kernel density distribution of the cumulative TFCP and its decomposition.
Sustainability 15 06591 g006
Table 1. Descriptive statistics of inputs and outputs for TFCP measurement and decomposition.
CategoryVariablesDefinitionApproachUnit
Input indicatorsLaborThe employed population of the study area.See China Statistical Yearbook. 10 4 persons
CapitalAn important part of the System of National Accounts (SNA), its data is core determinants of macroeconomic policy research.The logarithm of capital stock calculated by PIM. 10 10 yuan
Undesirable outputCO 2 The sum of carbon emission produced by energy consumption in all industries.The logarithm of carbon emission calculated by IPCC (2006) Guidelines. 10 5 tons
Desirable outputGDPThe total GDP of each province (autonomous region).See China Statistical Yearbook. 10 9 yuan
Table 2. Provincial carbon productivity of the Yellow River Basin in 2007–2017 (Unit: 10 4 yuan/ton).
YearUpper WatershedMiddle WatershedLower WatershedMean
QinghaiSichuanGansuNingxiaInner MongoliaShanxiShaanxiHenanShandong
20070.080.340.090.050.070.060.130.100.160.12
20080.100.430.100.060.090.080.200.130.260.16
20090.120.450.140.070.110.090.210.200.290.18
20100.120.520.160.090.100.110.330.290.340.23
20110.150.590.180.090.140.120.340.330.380.25
20120.230.620.220.100.170.140.450.390.470.30
20130.230.660.280.140.190.160.480.440.470.33
20140.260.720.360.150.210.170.510.490.560.37
20150.290.780.330.160.230.220.490.500.590.39
20160.300.810.360.190.240.260.570.510.610.42
20170.320.840.410.200.260.310.620.580.660.46
Mean0.200.610.240.120.160.160.390.360.440.29
Table 3. Overall evolution and decomposition of the TFCP in the Yellow River basin in 2007–2017 1.
TimeMeanUpper WatershedMiddle WatershedLower Watershed
(Year)MCPIEFFCHTECCHMCPIEFFCHTECCHMCPIEFFCHTECCHMCPIEFFCHTECCH
07–080.9890.9861.0010.9831.0020.9810.9830.990.9851.0010.9981.003
08–090.9891.0020.9820.9761.0090.9670.9940.9970.9970.9970.9971.000
09–101.0270.9961.0180.9871.0190.9691.0041.0480.9581.0911.0481.041
10–111.0220.9991.0191.0101.0340.9771.0410.9931.0481.0140.9931.021
11–121.0161.0091.0021.0001.0570.9461.0121.0021.0101.0361.0121.024
12–131.0461.0081.0231.0011.0160.9851.0551.0421.0121.0831.0421.039
13–141.0371.0101.0201.0151.0141.0071.0121.0390.9741.0841.0391.043
14–151.0731.0341.0241.0321.0151.0171.0531.0341.0181.1351.0641.068
15–161.0581.0151.0311.0201.0230.9971.0511.0431.0081.1041.0431.058
16–171.0761.0191.0411.0301.0211.0091.0471.0271.0191.1501.0791.066
Mean1.0331.0081.0161.0061.0210.9861.0251.0221.0031.0691.0321.036
1 Note: MPCI index is calculated according to the geometric mean of the adjacent two years, so the MPCI index in 2007–2017 has 10 values.
Table 4. The estimated results of provincial MCPI in the Yellow River basin from 2007–2017 1.
YearQinghaiSichuanGansuNingxiaInner MongoliaShanxiShaanxiHenanShandongMean
2007–20080.9771.0040.9650.9730.9960.9561.0091.0001.0010.987
2008–20090.9761.0230.9210.9561.0020.9871.0010.9960.9980.984
2009–20100.9540.9981.0150.9830.9870.9961.0121.1051.0761.014
2010–20111.0121.0121.0211.0100.9961.0031.0780.9921.0361.018
2011–20120.9981.0210.9971.0040.9811.0211.0030.9891.0831.011
2012–20130.9760.9871.0231.0191.0021.0371.0721.0641.1021.031
2013–20140.9970.9961.0541.0231.0061.0280.9951.0691.0991.030
2014–20151.0211.0101.0671.0271.0341.0421.0641.1381.1311.059
2015–20161.0311.0650.9890.9991.0181.0481.0531.0821.1251.046
2016–20171.0331.0431.0321.0081.0361.0091.0851.1021.1981.061
Mean0.9981.0161.0081.0001.0061.0131.0371.0541.0851.024
1 Note: The results are calculated by the author, and the “mean” is the geometric average of TFCP in the Yellow River basin over the years.
Table 5. Spatial autocorrelation test of TFCP in the Yellow River Basin.
YearMoran’s I E ( I ) sd ( I ) z-Scorep-Value
20070.1210−0.0340.1192.00160.0124
20080.2231−0.0340.122.07280.0067
20090.2651−0.0340.1212.34760.0156
20100.2848−0.0340.1182.37290.0013
20110.3213−0.0340.122.01230.0078
20120.3372−0.0340.1242.03660.0184
20130.3290−0.0340.122.34230.0019
20140.3921−0.0340.1192.56710.0217
20150.4175−0.0340.123.10340.0036
20160.4366−0.0340.1223.33870.0041
20170.4531−0.0340.1213.34650.0052
Disclaimer/Publisher’s Note: The statements, opinions and data contained in all publications are solely those of the individual author(s) and contributor(s) and not of MDPI and/or the editor(s). MDPI and/or the editor(s) disclaim responsibility for any injury to people or property resulting from any ideas, methods, instructions or products referred to in the content.