Abstract
This article offers a power quality (PQ) strategy to reduce light intensity flickers, voltage enhancements, and harmonics mitigation of the grid current in extensive networks of LED lighting at Cairo airport, Egypt. A transformerless unified power quality conditioner (TL-UPQC) with its controls is presented to address the majority of PQ issues in a network. The TL-UPQC comprises a dynamic voltage restorer (DVR) as a series compensator, which quickly maintains the load voltage when there is a voltage decrease, surge, or flickering in the network and an active power filter (APF) acts as a shunt compensator that reduces harmonic currents and injects reactive currents. The gain values of the PI controller are obtained using an extended bald eagle search (EBES) optimizer. In addition, a comparative study of three optimizers, namely, moth flame (MFO), cuckoo search (CSA), and salp swarm algorithm (SSA), is presented to test the performance of the PI controller and fast dynamic response. The results showed that the APF nearly obtained unity PF and that the harmonics produced as THD by LED light bulbs for current at the grid were abolished that becomes 3.29%. Additionally, the results verified that TL-UPQC could cancel voltage fluctuations at grid problems so that UPQC’s performance is successfully achieved to provide a flicker-free LED lighting network and this appeared clearly when used in LED lighting network at Cairo airport. MATLAB simulation has been employed to confirm the proposed TL-UPQC’s effectiveness.
1. Introduction
Power quality (PQ) has become a major challenge as a result of the increasing usage of solid-state controls for power conditioning [1]. It is currently challenging to meet high PQ standards due to the extensive use of products based on power electronics [2]. In the end, low PQ will affect a variety of businesses, including manufacturing, vital services, domestic use, commercial enterprises, etc. [3]. During a power sag or surge, equipment may not perform properly or may be harmed. Additionally, loads reliant on contemporary electronic devices pay close attention to PQ variations, which directly affect a great number of customers [4]. Better PQ features are, therefore, highly desired by both the utility and the customers [5]. Flickering in networks of light-emitting diode (LED) lights is a direct outcome of a network’s poor power quality, including prolonged and brief voltage swings [6]. However, a vast network of LED lights creates high harmonic components from the internal drivers of the LEDs. Excessive voltage and current total harmonic distortion will arise from the grid’s quality being warped [7].
In the literature, Gil-de-Castro et al. proposed two PQ issues of harmonics and flicker in LED bulbs. When various LED bulbs are influenced by the same voltage swings, the findings indicate a wide variance in light intensity variations [8]. While Phannil et al. introduced an investigation and evaluation of LED lamps used in commercial building lighting systems concerning harmonics, energy usage, and PQ [9], Iqbal et al. offered the change in current harmonics created by LED lighting and its impact on low-voltage network harmonic estimation. That study examines how thermal stability affects current harmonics introduced by LED lights [10]. Abdalaal et al. investigated the problems of current and voltage quality in commercial dimmable LED bulb operation and how it impresses PQ issues through a variety of real experiments that address voltage sag, harmonic analysis, voltage flashing, and other PQ problems [11]. Hermoso-Orzáez et al. stated a workable way to evaluate replacing outdoor lighting fixtures with LED luminaires before making a significant investment. Many of the tested luminaires’ primary problems are caused by inrush peak currents at cold starts that could result in ignition issues with unpredictable shutdowns and harmonic distortions in their electronic driver, which is tied to AC/DC and depends on the ambient temperature for functionality. The results showed that each luminaire selection will have an effect on the predicted long-term dependability of the lighting installation in the event that the grid generates poor PQ [12], as Wibowo et al. additionally suggested, which is based on SNI IEC 61000-3-2 Standard harmonic testing analysis of LED Lamps. Twenty-two samples of LED bulbs from 10 different brands were used to analyze harmonic currents, each with a different type of EMI filter, and were subjected to harmonics measurements [13]. Yang et al. submitted an experiment to detect harmonic characteristics and used an artificial intelligence algorithm which is mind evolution algorithm-generalized regression neural network (MEA-GRNN) and improved-adaptive boosting (AdaBoost) to predict THD for LEDs [14]. Molina et al. nominated the harmonic analysis of distribution systems using LED lamp modeling. That approach provided an estimating method for model parameters from experimental observations and, moreover, a model for LED lights in the frequency domain for calculating harmonic emission [15]. Raciti et al. recommended a LED light bulb circuit model appropriate for typical voltage THD on LV distribution networks. That model was developed precisely to mimic the current waveform in the case of network voltage variability [16]. In addition, Junior et al. imitated residential LED bulbs with E27 sockets sold in Brazil subjected to an experimental study of PQ indicators. In that study, the harmonic and power factor (PF) generation of many brands of LED bulbs sold in Brazil was examined. The estimated PF and THD of the current in each light were then determined [17]. Due to the programmable LED current, several LED branches could be driven and controlled from a single output from a half-bridge. The presented converter also offered continuous switching frequency operation as additional advantages, high efficiency, analog and PWM dimming capability, simple dynamics, and zero voltage and zero current switching [18]. While Baek et al. inspected employing current path control switches to create a single-stage LED driver and an inverted buck topology. That converter changed the LED forward voltage, which decreased the switching frequency and current ripple while using a relatively low inductance value [19]. After that, da Motta et al. presented a non-isolated single-stage converter that employed the charge pump and valley-fill theories to power LEDs. The charge-pump setup was utilized to lessen the current ripple of the LEDs. Utilizing levels below the input voltage peak, the valley fill was utilized to limit the DC bus voltage while maintaining a good power factor [20], whereas in Pouladi et al., an easy to use, battery-powered application-friendly low input voltage level, buck-boost LED driver was developed. Additionally, as soon as the current switches to zero (ZCS), all of the diodes turn off, reducing reverse recovery losses and increasing efficiency, in order to execute soft switching [21]. Efendi et al. adduced using a BIFRED converter to improve an LED lamp driver’s power factor. The BIFRED converter may boost the power factor from 0.84 to 0.98 when used as an LED light driver, and IEC61000-3-2 class C’s standards for line-current harmonics were met by this driver circuit [22]. In addition, Ramakrishnareddy et al. urged a full bridge LED driver controlled by buck-boost with zero voltage switching. Current stress on switches in a full bridge is significantly decreased in the suggested layout. In addition, full bridge devices are capable of zero-voltage switching (ZVS). To maintain a consistent LED lamp current, input voltage changes can be corrected [23]. The final solution in Hsieh et al. research was a Coupled Inductor Interleaved Buck-Boost LED Driver by Soft Switching. Experimental results show that all semiconductor devices operate at either ZVS or ZCS. Experimental findings exhibit that all semiconductor devices operate at either ZVS or ZCS [24].
Abdalaal et al. presented a PQ approach to reduce grid current harmonics, and light intensity flickers in large LED lighting networks. That approach created a single-phase transformer-free half-bridge universal power quality conditioner (TL-UPQC) architecture with associated controls to handle the majority of PQ issues in a network [25]. Even though Campanhol et al. suggested a grid-connected single-stage photovoltaic (PV), three phases and four wires are utilized, and a dual compensating strategy and feed-forward control loop (FFCL) are both utilized. Using only the PV system as a power quality conditioner (UPQC), the grid, by increasing active power, reduces load harmonic currents, balancing reactive power [26]. Moreover, Devassy et al. proposed a three-phase single-stage PV-integrated UPQC’s (PV-UPQC) design and performance evaluation. The recommended solution combines the advantages of sustainable energy production with bettering electricity quality [27]. Additionally, Pappula et al. advised the use of a multi-converter-UPFC (MC-UPFC) system for harmonic mitigation in multiple feeders. To improve both the load side and overall power quality and the source side, MC-UPQC combined two series converters and a shunt converter [28]. Finally, Choudhury et al. simulated control of the UPQC via adaptive shunt filtering under rising nonlinear loads. A UPQC was used in a distribution system to minimize harmonic currents and offset the impact of voltage sag/swell. That study advocated a method to resolve this problem by placing active filtering second to sag/swell correction [29].
Addressing issues with PQ brought on by the use of budget-friendly LED bulbs in lighting networks, this study discusses the optimization of transformerless power electronic equipment (including topology and control technique). It is recommended that TL-UPQC optimization be utilized as a thorough remedy for the PQ problems with LEDs in Cairo airport, Egypt, which has been determined. The most severe PQ issues, such as voltage drops, swell, flickering, transient, and current harmonics, can be mitigated by the system. To address PQ issues, this study introduces the single-phase transformer-free unified power quality conditioner (TL-UPQC) topology, to provide a flicker-free lighting network with a constant voltage output. Through filtering the harmonics produced by LED bulbs, the topology aims to improve the power factor. Additionally, it prevents any voltage dips, swells, or flashing that may occur in the network from affecting the load voltage. In this study, the proposed topology and associated control mechanism are presented. A recently developed metaheuristic optimization approach called the Enhanced Bald Eagle Search (EBES) [30] is employed in this study to adjust the PI controller’s gain parameters. A comparison of three optimizers, including moth flame (MFO) [31], cuckoo search (CSA) [32], and salp swarm algorithms (SSA) [33], is proposed to verify the performance of the PI controller to attain a global error minimalization and fast dynamic response. Thus, the contribution of this topology can be summarized as follows:
- A new TL-UPQC is presented to enhance power quality for LED lighting network in the Cairo airport, Egypt;
- Enhanced Bald Eagle Search Optimization is used for controller circuit to get optimum results from TL-UPQC scheme;
- The effectiveness of the TL-UPQC is verified by showing the waveforms of grid voltage and load voltage in cases of voltage sag, voltage swell, voltage transient, harmonics, and voltage flickering for TL-UPQC system in LED lighting network;
- In addition, a comparison between different optimization techniques CSA, MFO, and SSA is made, and the proposed EBES technique implemented on the PI controller to imitate the actions of the proposed UPQC topology and exhibit the efficiencies and differences in parameters;
- Finally, experimental validations are implemented to verify the proposed TL-UPQC scheme.
The rest of the essay is organized as follows: The model description is presented in Section 2. The proposed topology principle of operation is discussed in Section 3. In Section 4, The results of the suggested topology are given, together with the optimization procedure that are presented and discussed in Section 5.
2. Case under Study
Figure 1 presents a transformerless power electronic device to deal with power quality problems of feeding LED bulbs in the Cairo airport lighting system in Egypt. A circuit of Cairo airport taxiway centerline is composed of 134 LED lighting units including two types of bulbs; 106 LED bulbs each is of 12 W and 28 each is of 7 W, and the total circuit load of 10.5 kVA, including primary cables, secondary cables, and transformer losses. In our case study a constant current regulator based on TL-UPQC topology is used to solve PQ issues. The reported PQ difficulties with LEDs are addressed in the TL-UPQC completely. The system may reduce the most significant power quality issues, including current harmonics, flickering, voltage swell, and dips. The following part presents the topology and its control methods. The following benefits of the proposed TL-UPQC topology are as follows:
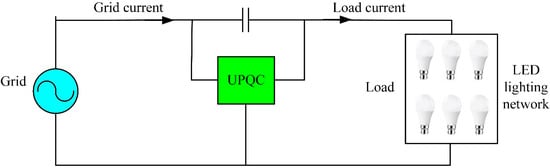
Figure 1.
The system under study.
- Transformerless: No transformer is presented between the grid and the VSC. It has good effects and is economical;
- Low common-mode (CM) voltage: In the absence of a transformer, the parameters CM voltage and leakage current become important. The connection to the bank’s central capacitor may allow the topology to maintain a low CM voltage;
- Simple topology: the topology saves money, lessens the complexity of the controller design, and results in fewer losses; for each power stage, just two active devices are required;
- LED lighting networks with grid voltage transients offer excellent and reliable load voltage;
- It provides current harmonics elimination features.
3. Proposed TL-UPQC Topology
3.1. Principle of Operation
Figure 2 depicts how the suggested single-phase TL-UPQC architecture is made precisely. A converter with a complete bridge whose topology can be divided into two HB bi-directional VSCs, one with a shunt active power filter (APF) to add harmonic and reactive currents for compensation, the other with a series APF, will be referred to as a Dynamic Voltage Restorer (DVR) in this research to improve voltage quality. The left side of the series converter is where the shunt converter is connected.
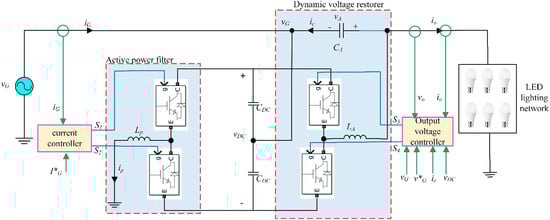
Figure 2.
The proposed single-phase TL-UPQC [34].
The proposed approach addresses the two main goals listed below and mitigates the serious PQ issues.
- Verify the sinusoidal and voltage-in-phase nature of the input current;
- Supply LED bulbs with a steady, sinusoidal voltage.
The output current () from the regulated current source needs to be sinusoidal in phase with the grid voltage (); as a result, the APF, which is a shunt, injects reactive and harmonic current () to make up for the distorted current () of the load, so the present relationship is,
The relationship between grid voltage and current is,
where is the angular grid frequency. and are the grid voltage and current in steady-state expressed as root-mean-square (RMS) values, respectively.
Between the grid voltage () and the load voltage (), the DVR can be viewed as a controlled voltage source (). The voltages relationship is,
The controlled out voltage is indicated by a reference signal applied to the DVR converter, which is used to control the load voltage. The value of the reference signal can be changed to regulate the amount of voltage delivered to the load.
In order to immediately make up for the discrepancy between the nominal voltage and the actual voltage, the grid voltage must be injected in series with the series DVR. If there is a dynamic voltage variation, the necessary voltage must be provided to prevent variations, voltage sags, and flashing. It can maintain a good voltage quality with consistent amplitude for the load voltage. In practice, an inverter with a dc-ac voltage source, such as the one in Figure 2, can be used to build the DVR. When the grid is undervolted, energy is needed to maintain the compensating voltage at a constant level. Therefore, as shown in Figure 3, these two ac sources are connected using a dc link controller so that power can be exchanged and the input and output power of the system is balanced (b). The APF VSC balances the load’s current harmonics by injecting current and acting as a rectifier and current filter. Through the DC link, the DVR is also powered. The dc link voltage controller thus controls the dc link voltage by varying the amplitude of the grid current (vDC). The system is stable until the dc link voltage reaches a steady state, a constant value. This suggests that the input power () and output power () are equal. The powers are arranged as follows in a steady state:
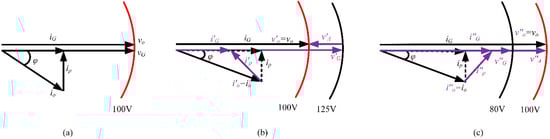
Figure 3.
Phasor diagrams of TL-UPQC. (a) normal operation, (b) voltage swell, and (c) voltage sag.
Figure 2 depicts the three controllers that make up the system in summary. The following are some of the controllers’ duties:
- To maintain a sinusoidal, constant amplitude output voltage, an output voltage controller is used. Additionally, it reacts quickly to transients, such as fluctuations in grid voltage;
- Input current controller—utilized to maintain sinusoidal and in-phase grid current;
- Dc link voltage controller—used to maintain the dc link voltage between two VSCs—assists in result of the optimal balance between input and output power.
In this architecture’s series DVR correction, a voltage that is in phase with the grid voltage is injected using this method when there is a voltage sag. To account for an increase in voltage, the voltage which is injected will be out of phase with the grid voltage. Figure 3 depicts the phasors diagram in normal operation, together with a voltage surge and voltage sag. During a voltage swell, the values of , , , , and represent the grid voltage, the grid current, the injected voltage, the output current, and the shunt current, in that order, while the values during a voltage sag are , , , , and . Three modes of operation are available: (a) In a reactive power mode, UPQC functions; (b) utilizing a series converter, to balance out the added power, UPQC absorbs energy; and (c) UPQC uses the series converter to supply energy to replenish lost power. When in steady-state operation, the shunt converter provides the active power needed by the series converter in modes (b) and (c).
The series converter will help deliver reactive power, according to the phasor diagrams concerning the load phase angle (∅) during voltage sag. This happens more frequently in the network. The DVR provides sophisticated power in this case. Due to the voltage sag, the series converter will be used more frequently while the shunt converter will be loaded less, supporting both the reactive power requirements of the load and the increased active power requirement.
3.2. Controller Design and Implementation
Control Methodology of APF
Figure 4 shows the controller block diagram of the TL-UPQC’s active power filter (APF) in the appropriate ways.
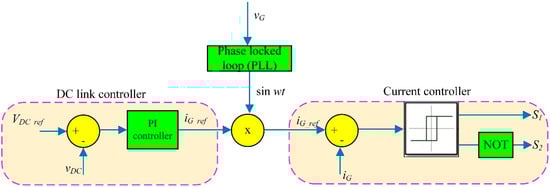
Figure 4.
Control circuit of the TL-UPQC-APF [34].
A voltage controller and a current controller are both present in the shunt APF. Both controllers can be built using digital signal processors (DSP) or analog hardware. This study adopted the latter methodology. A PI controller is used to adjust the dc link voltage in the outer voltage control loop, the reference for the inner loop. By contrasting the input current with a reference signal produced by the outer loop and phase-locked loop, the inner control loop that generates the input current employs a hysteresis controller (PLL). If the load current, , is disregarded, the system is a fundamental power factor correction (PFC). The grid current is equal to the inductor current when a source is connected to the dc connection. A reference current signal is created with preset upper and lower limits in order to guide the inductor current depending on the reference and lower bands.
Criteria of switching = on and = off.
When the lowest band of the inductor current is reached, the hysteresis controller will change the switch’s operating modes, turning on while is off to give the inductor current time to start charging. The following will be the switching criteria:
where is the region of hysteresis in the inductor current, and is reference inductor current.
Criteria of switching = off and = on.
Upon reaching the upper band, the inductor current, the controller will activate to alter the operating modes of the switches, turning off while is on to enable the discharge of the inductor current. Therefore, the switching standards will be,
According to Figure 4, the TL-UPQC system’s source is linked in parallel with the APF circuit. If the load current is assumed to be constant, the ripple in the grid current and the inductor current is the same. As a result, it is possible to produce a grid current reference signal that can be compared to the actual grid current. We can rewrite Equations (6) and (7) as follows:
Criteria of switching = on & = off
Criteria of switching = off and = on
where whether the hysteresis ripple band of the inductor current exists, and is reference grid current.
3.3. Control Methodology of DVR
As based on Figure 1, it is comparable to the widely used half-bridge voltage source inverter (HBVSI). The voltages and currents of passive components are forecasted using the switching trajectory. The inverter is subsequently provided with the switching decisions (gate signals) at the proper moment. These predictions ensure an extremely swift dynamic response to any outside disruption.
Utilizing the inverter’s output, the gap between the source and load voltages is filled in Equation (4). The following is how the switching criteria for the topology of a simple HBVSI were found:
Criteria of switching = on and = off
Criteria of switching = off and = on
where denotes a constant value and it is,
and are min. and max. boundaries of the reference signal, respectively,
ΔV stands for the hysteresis voltage ripple.
Keeping the output voltage’s amplitude constant is the DVR in the UPQC’s control objective. It is, therefore, possible to change the reference signal to the output voltage associated with Equation (4),
where is the reference load voltage.
The new switching criterion will be the following substituting (4) and (17) into (10)–(13) to cancel all terms related to ,
Criteria of switching = on and = off
Criteria of switching = off and = on
Similar to the grid’s frequency and voltage, the amplitude of is regulated at the necessary RMS value. The sinusoidal input voltage , the PLL generates the load reference voltage . The switching criteria from equation (18) to (21) determines the gate signals to the switches. Utilizing feedback signals from the UPQC power circuit, switching actions are given while the switching criterion inequalities are checked, and the reference voltage amplitude is assigned externally as the output. It is possible to utilize it to generate a high voltage quality at the load.
4. Formulation of the Optimization Problem
4.1. Fitness Function
The fitness function is used to adjust the gains of the proposed UPQC-PI controllers and is defined as:
where J is the proposed TL-UPQC controller’s overall error, and ITAE stands for integral time absolute error. The mathematical representation of the ITAE performance index is provided as:
where represents the error signal. The optimization problem is subject to the following constraints.
4.2. Constraints
- The second feeder’s voltage level is restricted to the range between its minimum and maximum values, as determined by Equation (26); thus
- The current’s THD (THDi), determined by Eq (27), should be below its maximum value () reported in IEEE Standard 519 [27,28]; thus
4.3. Enhanced Bald Eagle Search Optimization Algorithm
The BES optimization method is one of the most sophisticated meta-heuristic algorithms [30,35]. It is influenced by nature. One of the eagles, the bald eagle, and its hunting tactics are models in the BES algorithm. Three sections make up the BES algorithm’s hunting operation. The first is referred to as “selecting space,” which entails an eagle selecting a place with the most prospective victims. In the second stage, which is often referred to as the “hunting in space phase,” the hunter advances toward the chosen search area’s victims. In the third and last stage, the hunting eagle selects the ideal location to snag the victim. It takes off from the optimal location selected during the swooping phase, also known as the second phase, and flies there. The advantages of evolutionary and swarm-based approaches for optimization are combined in the recently created BES algorithm.
4.3.1. Bald Eagles Hunting Strategy
Protein-rich meals are regularly consumed by bald eagles. Fish are its major focus. As the initial step in its hunting technique, the eagle moves towards a specific location known as the exploration space. The eagle selects a region that lies between the land’s surface and the deep sea. The search process starts whenever the hunter arrives at the designated location. The bald eagle was able to view the fish in the water from a great distance in the air, thanks to its exceptional vision. When the hunter specifies its goal, it begins to slowly descend in order to capture its prey and seize the fish. In Figure 5, these actions are further illustrated.
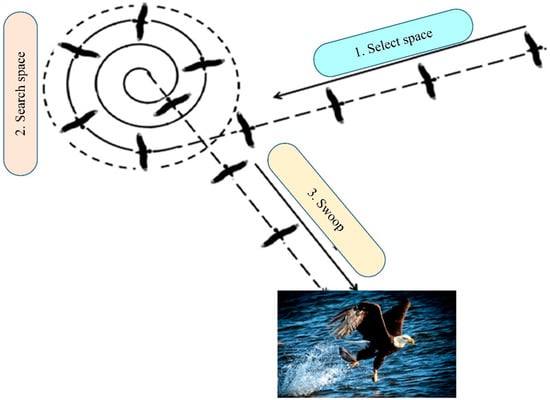
Figure 5.
Co-sequences for the hunting stages.
4.3.2. The BES Algorithm
This section contains equations and mathematical analyses of the three stages of bald eagle hunting.
- The first stage (Selection)
The location of the fish can be found by the bald eagle. The following equation serves as a mathematical representation of this period,
where is a control parameter for position change [1.5, 2] and ∈ [0, 1], randomly. A nearby exploring region of the one that was previously chosen is chosen. The bald eagle’s current exploration space, designated as . It is chosen in accordance with the top position already defined. The eagle gains from the knowledge of the preceding places, as shown by . In terms of the mean position and the ideal position, this first stage significantly improves the candidate solutions;
- The second stage (Search)
In the second phase, the hunter looks for the prey. At this stage, the search is conducted inside the previously selected exploration area. The bald eagle then makes a number of circuitous movements within a spiral area to quicken the hunt. Mathematically, this stage can be expressed as the following equation:
where an is an arbitrary parameter. The element R ∈ [0.5, 2] and regulates how many exploring cycles there are. Additionally, ‘a’ and ‘R’ are referred to as factors that control how the spiral’s shape can change. During this phase, the location rotates around the central one. The BES diversifies as the ‘a’ and ‘R’ vary to prevent becoming stuck with the local answers and to look for more precise alternatives;
- The third stage (Swooping)
This third and last step of the hunting process involves the hunting eagle flying from the best vantage point toward the intended victim. That stage can be mathematically expressed as shown in Equation (35).
where c1, c2 are random parameters with a range of 1 to 2 that are changed to intensify the movements of the direction of the ideal location by the hunting eagle. The eagle’s swooping motion is reflected by the polar equation. The proposed method may become more complex and/or diversified to reach the ideal solution as a result of the mean solution.
At the conclusion of the three phases, the ideal result is attained with the fewest possible iterations. Intensity and diversification are the two variables that influence each stage. They are crucial for the ongoing improvement of the potential solutions until the best one is found;
- The Levy function
The addition of the levy function enhances the performance of the proposed BES algorithm. By altering the search agents with the “LF” factor, this is achieved. This factor can be determined numerically as follows:
where , are random values from 0 and 1;
- Enhanced BES
The third step, the Swoop step, is when the Levy function is added. The following formula is used to calculate the modified new populations:
where P1 and CF are constants. between 0 and 1 that was chosen at random, as follows, is the calculation for the :
The next technique incorporates the pseudo-code to provide more understanding of the recently published EBES optimization Algorithm 1.
| Algorithm 1 Initialize the first population. |
| Evaluate the objective function of the initial population. While (the current iteration number < max. number of iterations) Stage 1: Selection of the research space For (each population i < population size) If f() < f() If f() < f() End If End If End for Stage 2: Searching within the selected space For (each population i < population size) If f() < f() If f() < f() End If End If End for Stage 3: Swoop For (each point i in the population) If f() < f() If f() <f () End If End If End for Set k=k+1 End While |
The simulation model is examined in four operation modes: voltage sag, swell, flickering, and transient. The comprehensive parameters of the optimized PI controllers’ gains are stated in Table 1.

Table 1.
Optimal controller parameters of the PI using the EBES approach.
5. Results and Discussion
The results present several solutions facing the electrical grid in the field of power quality improvement of LED lamps. The corresponding PQ issues are voltage sag, swell, flickering, and transients. In addition, harmonic analysis is also demonstrated. Further, a comparison between different optimization techniques is technique implemented on the PI controller to imitate the actions of the proposed TL-UPQC topology. Finally, experimental validations are implemented to verify the proposed TL-UPQC scheme.
5.1. Modeling and Simulation
As illustrated in Figure 6, the newly introduced TL-UPQC is tested using the MATLAB/Simulink platform, demonstrating enhancing voltage sag, swell, flickering, and transients. In addition, THD condition for the system is also demonstrated. The parameters taken in the MATLAB/Simulink environment are discussed in Table 2.
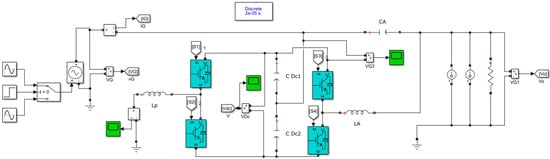
Figure 6.
The model under study MATLAB Simulation.
Table 2.
System specifications.
5.2. Case I: Voltage Sag
In this case, an overload occurs between 0.2 and 0.4 s, causing the grid voltage to drop to 70% of its maximum value. It must be emphasized that the UPQC recognizes this sag state promptly and injects the required output voltage to deliver a stable and sinusoidal voltage to the LED load. The series DVR is in charge of swiftly injecting a voltage in series with the supply voltage through the gate pulses of IGBTs in order to make up for the discrepancy between the nominal voltage and the needed voltage to be supplied. This is done by using series capacitors. A reference signal is provided to the DVR to direct the regulated voltage in order to control the load voltage. The DC link has successfully restored the power that was pumped into the parallel converter. Figure 7 shows the voltage profile on the grid, following compensation, the load voltage distribution, and the necessary injected voltage.
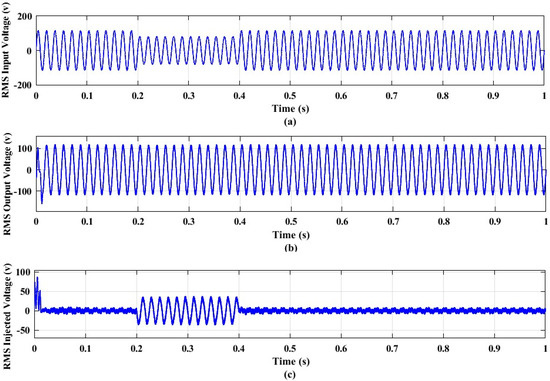
Figure 7.
Simulated results for Case I—voltage sag: (a) load voltage before compensation, (b)load voltage after compensation, and (c) injected voltage in volts.
5.3. Case II: Voltage Swell
In this case, Since a number of heavy loads are turned off, a swell mode develops. The swell mode was therefore supposed to be employed for this test from 0.2 to 0.4 s, and the voltage at the grid is increased to 140% of its RMS value. It should be noted that the UPQC quickly recognizes this swell state and absorbs the necessary output voltage magnitude so that it supports voltage at LED load to be stable and sinusoidal. The series DVR is in charge of swiftly absorbing a voltage in series with the supply voltage through the gate pulses of IGBTs in order to make up for the discrepancy between the nominal voltage and the needed voltage to be supplied. This is done by using series capacitors. A reference signal is provided to the DVR to direct the regulated voltage in order to control the load voltage. The parallel converter’s injected power has been successfully restored by the DC link. Figure 8 depicts the grid voltage profile, following compensation, the load voltage profile, and the required injected voltage.
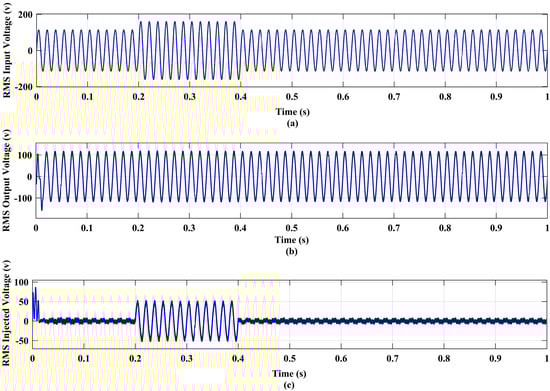
Figure 8.
Simulated results for case II—voltage swell: (a) load voltage before compensation, (b) load voltage after compensation, and (c) injected voltage in volts.
5.4. Case III: Voltage Flickering
In this case, voltage flickering occurs because of some loads such as electric arc furnaces, arc welders, and arc motor drives with cyclic operations. As a result, it was believed that the flickering mode would be used for this test from 0.2 to 0.35 s and from 0.65 s to 0.8 s, and the voltage at the grid is flickered around ±10% of its RMS value. Since the output voltage has been preserved in the shape of a sinusoidal wave with a fixed peak value, the results demonstrate the system’s capability to avoid flickering. The series DVR is in charge of swiftly injecting and absorbing a voltage in series with the supply voltage through the gate pulses of IGBTs in order to make up for the discrepancy between the nominal voltage and the needed voltage to be supplied. This is done by using series capacitors. A reference signal is provided to the DVR to direct the regulated voltage in order to control the load voltage. Supporting the load voltage is necessary; the dc link capacitor provides voltage for the UPQC to inject. The grid voltage profile, the load voltage profile after correction, and the required injected voltage are all shown in Figure 9.
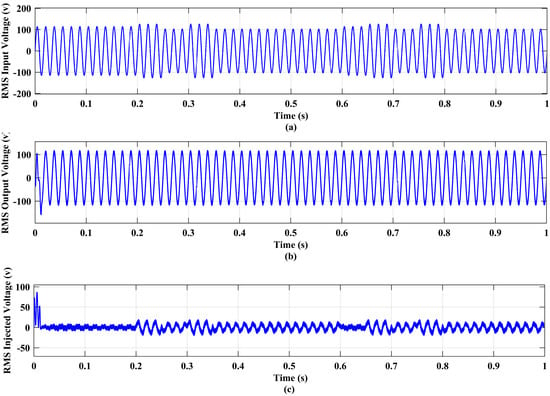
Figure 9.
Simulated results for Case III—voltage flickering: (a) load voltage before compensation, (b) load voltage after compensation, and (c) Injected voltage in volts.
5.5. Case IV: Voltage Transient
Transients or spikes, which fall under the categories of impulsive and oscillatory transients, when a nonpower frequency change takes place in a very short amount of time at a very high voltage, another PQ index may be employed. The impulsive transient type seen in Figure 10 is the result of a lightning strike occurring as the initial event. According to IEEE 1159, this occurs when the voltage’s magnitude abruptly changes for a very short time frame (less than 50 ns). The suggested UPQC finds and injects the necessary voltage in 0.063 s after the 10 kV lightning strike is applied. The series DVR is in charge of swiftly absorbing a voltage in series with the supply voltage through the gate pulses of IGBTs in order to make up for the discrepancy between the nominal voltage and the needed voltage to be supplied. This is done by using series capacitors. A reference signal is provided to the DVR to direct the regulated voltage in order to control the load voltage.
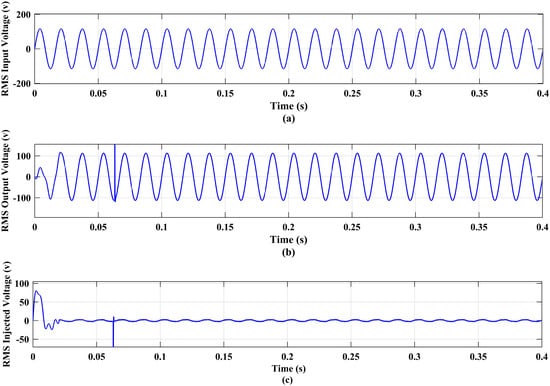
Figure 10.
Simulated results for Case IV—voltage transients: (a) load voltage before compensation, (b) load voltage after compensation, and (c) injected voltage in volts.
5.6. Case V: Analysis of Harmonic Distortion
THD is a crucial measurement for determining the degree to which voltage or current waveforms exhibit harmonic distortion. The voltage or current waveforms’ harmonic distortion level can be measured, and THD is an important measurement. The system’s capability to eliminate harmonics is demonstrated by testing the LEDs. To make up for the distorted current of the load, the shunt APF injects current harmonics through parallel capacitors and IGBT gate pulses. The input current controller is responsible for forcing the actual input current to match the identified fundamental current. The dc link voltage controller is responsible for identifying the fundamental component of the load current.
The DC link has been subjected to a steady 400 V. It can be observed that all harmonic contents for the LED network load have been compensated by the APF. The TL-UPQC complies with IEEE 519 standard standards by keeping the to below 20%.
Figure 11a depicts the measured of the output current, and Figure 11b depicts the measured of the input current after compensation to assess the APF scheme’s efficiency once it was implemented.
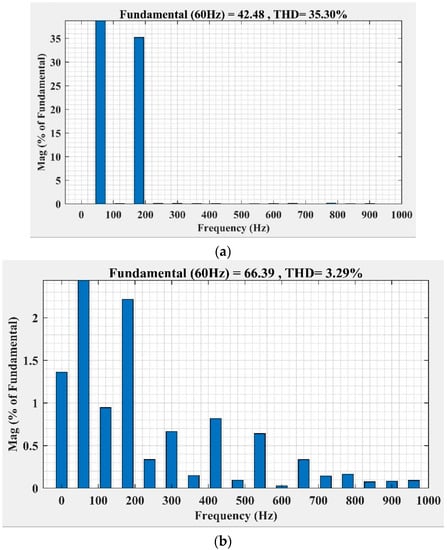
Figure 11.
THD for current before and after compensation. (a) THDi before compensation and (b) THDi after compensation.
5.7. Comparative Study
An evaluation of the performance of the used optimization techniques, CSA, MFO, SSA, and EBES methods are used by the PI to replicate the behaviors of the suggested UPQC typology. Table 3 shows a study of the four algorithms concerning Case I to imitate the actions of the proposed typology. These data show that EBES consistently influences the best values of the OF in the fewest repetitions.
Table 3.
Comparative analysis of the PI controller using different optimization techniques during Case I.
5.8. TL-UPQC Experimental Validation
To experimentally test the suggested TL-UPQC, a 500 VA/120 V UPQC converter prototype with DS controller has been set up, as shown in Figure 12. Two cases of PQ problems of voltage sag and swell conditions have been examined to verify the UPQC’s behavior.
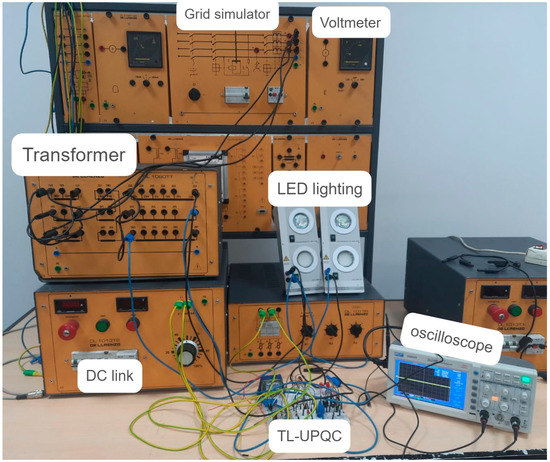
Figure 12.
TL-UPQC experimental validation.
Figure 13 applies a 25% rms input voltage sag to demonstrate the controller’s dynamic reaction. The output voltage is then restored to 120 V rms, and the DC link is able to restore the injected power by the parallel converter. Figure 14 demonstrates that an input voltage swell of 10% was tolerated while the output voltage was kept at a consistent peak value.
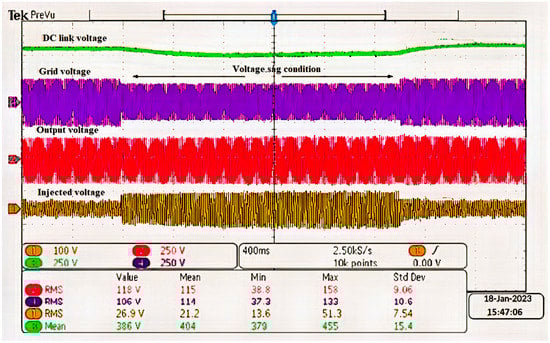
Figure 13.
TL-UPQC results for voltage sag condition.
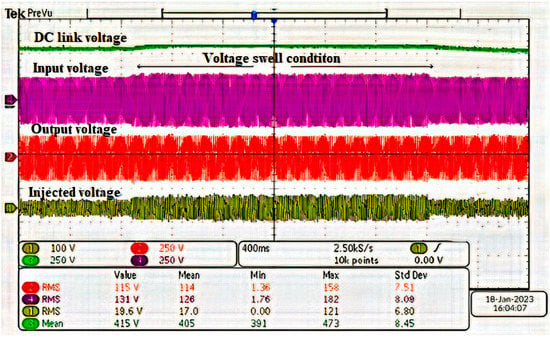
Figure 14.
TL-UPQC results for voltage swell condition.
6. Conclusions
In this section, a TL-UPQC’s effectiveness for LED lighting networks is shown. The input and output powers of the APF were balanced using the capacitor bank voltage. The results showed that the APF nearly obtained unity PF and that the harmonics produced as THD by LED light bulbs for current at the grid were abolished, at 3.29% below 20% that complies with IEEE 519, while that value produced by LED light bulbs is 35.3% so that the effectiveness of APF is successfully achieved. In addition, the results verified that TL-UPQC could cancel voltage fluctuations at grid problems that affect badly on LED lighting intensity by keeping the voltage at the load sinusoidal wave with a constant value. It is verified in case of voltage sag by applying a reduction of 70% of the grid’s RMS value or, in the event of a voltage swell, applying an increase of 140% of the grid’s RMS value after applying flickering at roughly 10% of its RMS value to voltage if a lightning strike of 10 kV is applied in the event of a voltage transient and the results have shown that in all cases the UPQC injects the required voltage magnitude so that UPQC’s performance is successfully achieved to provide a flicker-free LED lighting network. The technology can address the severe dynamic and static PQ challenges for networks of LED lighting.
Author Contributions
Conceptualization, S.E.A.M. and A.I.O.; methodology, A.I.O.; software, S.E.A.M.; validation, A.M.I.; formal analysis, S.E.A.M.; investigation, A.M.I.; resources, Z.M.S.E.; data curation, A.I.O.; writing—original draft preparation, S.E.A.M.; writing—review and editing, A.I.O.; visualization, Z.M.S.E.; supervision, A.M.I.; project administration, Z.M.S.E.; funding acquisition, Z.M.S.E. All authors have read and agreed to the published version of the manuscript.
Funding
This work was supported by the Deanship of Scientific Research, King Khalid University, under Grant RGP.1/223/43.
Institutional Review Board Statement
Not applicable.
Informed Consent Statement
Not applicable.
Data Availability Statement
Data sharing is not applicable to this article as no datasets were generated or analyzed during the current study.
Conflicts of Interest
The authors declare no conflict of interest.
Abbreviations
| List of abbreviations | |
| AdaBoost | Adaptive boosting |
| APF | Active power filter |
| BES | Bald Eagle Search |
| BIFRED | Boost integrated flyback rectifier/energy storage dc-dc converter |
| CM | Common mode |
| CSA | Cuckoo search algorithm |
| DSP | Digital signal processors |
| DVR | Dynamic voltage restorer |
| EBES | Enhanced Bald Eagle Search |
| FFCL | Feed-forward control loop |
| HB | Half bridge |
| HBVSI | Half-bridge voltage source inverter |
| LED | Light emitting diode |
| MC-UPQC | Multi-converter unified power quality conditioner |
| MEA-GRNN | Mind evolution algorithm-generalized regression neural network |
| MFO | Moth flame optimization |
| PFC | Power factor correction |
| PI | Proportional integral |
| PLL | Phase-locked loop |
| PQ | Power quality |
| PV | Photovoltaic |
| SSA | Salp swarm algorithm |
| THD | Total harmonic distortion |
| TL-UPQC | Transformerless half-bridge unified power quality conditioner |
| VI | Variable inductor |
| VSC | Voltage source converter |
| ZCS | Zero current switching |
| ZVS | Zero voltage switching |
| List of Symbols | |
| Grid voltage during sag | |
| Inductor current hysteresis ripple band | |
| Inductor current hysteresis ripple band | |
| Best position | |
| Mean position | |
| Switching the ith IGBT | |
| Grid current during sag | |
| Output current during sag | |
| Shunt current during sag | |
| Grid current during swell | |
| Output current during swell | |
| Shunt current during swell | |
| Injected current of DVR | |
| Grid current | |
| Reference grid current | |
| Load’s distorted current | |
| Reactive and harmonic current | |
| Reference inductor current | |
| Constant value | |
| Input power | |
| Output power | |
| Injected voltage during sag | |
| Output voltage during sag | |
| , | Injected voltage during swell |
| Output voltage during swell | |
| Maximum boundary of a reference signal | |
| Minimum boundary of a reference signal | |
| Controlled voltage source | |
| Dc link voltage | |
| Grid voltage | |
| Grid voltage during swell | |
| Load voltage | |
| ∅ | Load phase angle |
| a | Variable parameter |
| c1 | Random parameter |
| c2 | Random parameter |
| R | Variable parameter |
| ΔV | Voltage hysteresis ripple band |
| Levy function factor | |
| Random value | |
| The position change control parameter | |
References
- Adewumi, O.B.; Fotis, G.; Vita, V.; Nankoo, D.; Ekonomou, L. The Impact of Distributed Energy Storage on Distribution and Transmission Networks’ Power Quality. Appl. Sci. 2022, 12, 6466. [Google Scholar] [CrossRef]
- Remigio-Carmona, P.; González-de-la-Rosa, J.-J.; Florencias-Oliveros, O.; Sierra-Fernández, J.-M.; Fernández-Morales, J.; Espinosa-Gavira, M.-J.; Agüera-Pérez, A.; Palomares-Salas, J.-C. Current Status and Future Trends of Power Quality Analysis. Energies 2022, 15, 2328. [Google Scholar] [CrossRef]
- Martinez, R.; Castro, P.; Arroyo, A.; Manana, M.; Galan, N.; Moreno, F.S.; Bustamante, S.; Laso, A. Techniques to Locate the Origin of Power Quality Disturbances in a Power System: A Review. Sustainability 2022, 14, 7428. [Google Scholar] [CrossRef]
- Thentral, T.M.T.; Palanisamy, R.; Usha, S.; Bajaj, M.; Zawbaa, H.M.; Kamel, S. Analysis of Power Quality Issues of Different Types of Household Applications. Energy Rep. 2022, 8, 5370–5386. [Google Scholar] [CrossRef]
- Krishna, D.; Sasikala, M.; Ganesh, V. Adaptive FLC-Based UPQC in Distribution Power Systems for Power Quality Problems. Int. J. Ambient. Energy 2022, 43, 1719–1729. [Google Scholar] [CrossRef]
- Dzhuraev, S.D.; Rahimov, R.A.; Sultonov, S.M.; Nazirov, K.B.; Ganiev, Z.S.; Karimov, R.C. Study and Analysis of Power Quality in the Electrical Networks of the Outdoor Lighting of the Dushanbe City. In Proceedings of the 2022 Conference of Russian Young Researchers in Electrical and Electronic Engineering (ElConRus), Saint Petersburg, Russia, 25–28 January 2022; IEEE: Piscataway, NJ, USA, 2022; pp. 1166–1169. [Google Scholar]
- Meinck, M.; Blanco, A.M.; Kannan, S.; Meyer, J.; Pavas, A. Harmonic Interaction of LED Lamps in Islanded Microgrids. In Proceedings of the 2022 20th International Conference on Harmonics & Quality of Power (ICHQP), Naples, Italy, 29 May–1 June 2022; IEEE: Piscataway, NJ, USA, 2022; pp. 1–6. [Google Scholar]
- Gil-de-Castro, A.; Rönnberg, S.K.; Bollen, M.H.J. Light Intensity Variation (Flicker) and Harmonic Emission Related to LED Lamps. Electr. Power Syst. Res. 2017, 146, 107–114. [Google Scholar] [CrossRef]
- Phannil, N.; Jettanasen, C.; Ngaopitakkul, A. Harmonics and Reduction of Energy Consumption in Lighting Systems by Using LED Lamps. Energies 2018, 11, 3169. [Google Scholar] [CrossRef]
- Iqbal, M.N.; Kütt, L.; Asad, B.; Shabbir, N.; Rasheed, I. Time-Dependent Variations in Current Harmonic Emission by LED Lamps in the Low-Voltage Network. Electr. Eng. 2021, 103, 1525–1539. [Google Scholar] [CrossRef]
- Abdalaal, R.M.; Man Ho, C.N. Characterization of Commercial LED Lamps for Power Quality Studies. IEEE Can. J. Electr. Comput. Eng. 2021, 44, 94–104. [Google Scholar] [CrossRef]
- Manuel Jesús, H.-O.; Gago-Calderon, A.; Rojas Sola, J.I. Power Quality and Energy Efficiency in the Pre-Evaluation of an Outdoor Lighting Renewal with Light-Emitting Diode Technology: Experimental Study and Amortization Analysis. Energies 2017, 10, 836. [Google Scholar] [CrossRef]
- Wibowo, R.; Suryadi; Priambodo, P.S. Harmonic Testing Analysis of Light Emitting Diode ({LED}) Lamps Based {SNI} {IEC} 61000-3-2 Standard. J. Phys. Conf. Ser. 2021, 1803, 12023. [Google Scholar] [CrossRef]
- Yang, J.; Ma, H.; Dou, J.; Guo, R. Harmonic Characteristics Data-Driven THD Prediction Method for LEDs Using MEA-GRNN and Improved-AdaBoost Algorithm. IEEE Access 2021, 9, 31297–31308. [Google Scholar] [CrossRef]
- Molina, J.; Mesas, J.J.; Mesbahi, N.; Sainz, L. LED Lamp Modelling for Harmonic Studies in Distribution Systems. IET Gener. Transm. Distrib. 2017, 11, 1063–1071. [Google Scholar] [CrossRef]
- Raciti, A.; Rizzo, S.A.; Susinni, G. Circuit Model of LED Light Bulb Suitable for Typical Voltage THD on LV Distribution Networks. Energy Build. 2020, 212, 109665. [Google Scholar] [CrossRef]
- Junior, E.; Stoller, H.; Scofield, P. Análise Experimental de Indicadores de Qualidade de Energia de Lâmpadas LED E27 Residenciais Disponíveis No Mercado Brasileiro. Semin. Ciências Exatas E Tecnológicas 2020, 41, 125. [Google Scholar] [CrossRef]
- Alonso, J.M.; Perdigão, M.S.; Dalla Costa, M.A.; Martínez, G.; Osorio, R. Analysis and Experiments on a Single-Inductor Half-Bridge LED Driver With Magnetic Control. IEEE Trans. Power Electron. 2017, 32, 9179–9190. [Google Scholar] [CrossRef]
- Baek, J.-B.; Chae, S. Single-Stage Buck-Derived LED Driver With Improved Efficiency and Power Factor Using Current Path Control Switches. IEEE Trans. Ind. Electron. 2017, 64, 7852–7861. [Google Scholar] [CrossRef]
- da Motta, L.C.; Agostini, E.; Nascimento, C.B. Single-Stage Converter Based on the Charge-Pump and Valley-Fill Concepts to Drive Power LEDs. IEEE J. Emerg. Sel. Top. Power Electron. 2018, 6, 1131–1142. [Google Scholar] [CrossRef]
- Pouladi, F.; Farzanehfard, H.; Adib, E. Battery Operated Soft Switching Resonant Buck–Boost LED Driver With Single Magnetic Element. IEEE Trans. Power Electron. 2019, 34, 2704–2711. [Google Scholar] [CrossRef]
- Efendi, M.; Murdianto, F.; Fitri, F.; Badriyah, L. Power Factor Improvement on LED Lamp Driver Using BIFRED Converter. TELKOMNIKA (Telecommun. Comput. Electron. Control) 2020, 18, 571. [Google Scholar] [CrossRef]
- Kasi Ramakrishnareddy, C.; Kumar, S.R.; Surya Kalavathi, M. A Buck-Boost Controlled Full Bridge LED Driver with Zero-Voltage Switching. J. Power Technol. 2021, 101, 62–69. [Google Scholar]
- Hsieh, Y.-C.; Cheng, H.-L.; Chang, E.-C.; Huang, W.-D. A Soft-Switching Interleaved Buck-Boost LED Driver with Coupled Inductor. IEEE Trans. Power Electron. 2022, 37, 577–587. [Google Scholar] [CrossRef]
- Abdalaal, R.M.; Ho, C.N.M. Transformerless Single-Phase UPQC for Large Scale LED Lighting Networks. In Proceedings of the IECON 2017—43rd Annual Conference of the IEEE Industrial Electronics Society, Beijing, China, 29 October–1 November 2017; pp. 1629–1634. [Google Scholar]
- Campanhol, L.B.G.; da Silva, S.A.O.; de Oliveira, A.A.; Bacon, V.D. Single-Stage Three-Phase Grid-Tied PV System With Universal Filtering Capability Applied to DG Systems and AC Microgrids. IEEE Trans. Power Electron. 2017, 32, 9131–9142. [Google Scholar] [CrossRef]
- Devassy, S.; Singh, B. Design and Performance Analysis of Three-Phase Solar PV Integrated UPQC. IEEE Trans. Ind. Appl. 2018, 54, 73–81. [Google Scholar] [CrossRef]
- Pappula, S.K.; Malaji, S. Harmonic Mitigation In Multi Feeder Using Multi Converter-Unified Power Quality Conditioning System. In Proceedings of the 2018 8th IEEE India International Conference on Power Electronics (IICPE), Jaipur, India, 13–15 December 2018; pp. 1–6. [Google Scholar]
- Choudhury, S.R.; Das, A.; Anand, S.; Tungare, S.; Sonawane, Y. Adaptive Shunt Filtering Control of UPQC for Increased Nonlinear Loads. IET Power Electron. 2019, 12, 330–336. [Google Scholar] [CrossRef]
- Alsattar, H.A.; Zaidan, A.A.; Zaidan, B.B. Novel Meta-Heuristic Bald Eagle Search Optimisation Algorithm. Artif. Intell. Rev. 2020, 53, 2237–2264. [Google Scholar] [CrossRef]
- Mirjalili, S. Moth-Flame Optimization Algorithm: A Novel Nature-Inspired Heuristic Paradigm. Knowl. Based Syst. 2015, 89, 228–249. [Google Scholar] [CrossRef]
- Yang, X.-S.; Deb, S. Cuckoo Search: Recent Advances and Applications. Neural Comput. Appl. 2014, 24, 169–174. [Google Scholar] [CrossRef]
- Mirjalili, S.; Gandomi, A.H.; Mirjalili, S.Z.; Saremi, S.; Faris, H.; Mirjalili, S.M. Salp Swarm Algorithm: A Bio-Inspired Optimizer for Engineering Design Problems. Adv. Eng. Softw. 2017, 114, 163–191. [Google Scholar] [CrossRef]
- Nicola, M.; Nicola, C.-I.; Sacerdoțianu, D.; Vintilă, A. Comparative Performance of UPQC Control System Based on PI-GWO, Fractional Order Controllers, and Reinforcement Learning Agent. Electronics 2023, 12, 494. [Google Scholar] [CrossRef]
- Alsaidan, I.; Shaheen, M.A.M.; Hasanien, H.M.; Alaraj, M.; Alnafisah, A.S. A PEMFC Model Optimization Using the Enhanced Bald Eagle Algorithm. Ain Shams Eng. J. 2022, 13, 101749. [Google Scholar] [CrossRef]
Disclaimer/Publisher’s Note: The statements, opinions and data contained in all publications are solely those of the individual author(s) and contributor(s) and not of MDPI and/or the editor(s). MDPI and/or the editor(s) disclaim responsibility for any injury to people or property resulting from any ideas, methods, instructions or products referred to in the content. |
© 2023 by the authors. Licensee MDPI, Basel, Switzerland. This article is an open access article distributed under the terms and conditions of the Creative Commons Attribution (CC BY) license (https://creativecommons.org/licenses/by/4.0/).