Abstract
The vertical integration of ‘Generation-Grid-Load-Storage’ in microgrids for port areas is a prevailing trend. To comprehensively and accurately assess the operational efficiency of microgrids and develop an effective means for promoting the sustainable and scalable development of microgrids in port areas, an applicable evaluation index system and comprehensive evaluation method are essential. Addressing the issues of subjectivity in quantitative evaluation decision-making for different configuration and allocation schemes in port areas and the lack of a comprehensive evaluation system for microgrids in port areas, this study aims to scientifically and reasonably evaluate and select the most optimal configuration and energy dispatching schemes for microgrids in port areas. In this paper, the performance indicators of microgrids in port areas are hierarchically structured and classified into five dimensions: economic, energy efficiency, environmental, system reliability, and safety. A comprehensive evaluation index system for microgrid systems in port areas is constructed. Furthermore, an evaluation model for microgrid operational efficiency based on improved CRITIC-TOPSIS is proposed. The coefficient of variation is introduced to measure the relative strength and relative variation of indicators among dimensions, reducing the impact of correlation between indicators and improving the accuracy and objectivity of the evaluation results. Then, the TOPSIS method is used to calculate the comprehensive evaluation values and rank the optimal microgrid schemes in port areas. Finally, the feasibility of the evaluation index system and evaluation method for the operational efficiency of microgrids in port areas is verified through case analysis. The results indicate that the evaluation method based on improved CRITIC-TOPSIS can objectively and quantitatively evaluate the operational efficiency of microgrids in different port areas. The proposed method reasonably avoids the strong subjectivity in weight calculation by traditional expert judgment during the planning phase of microgrids in port areas, providing a new and scientifically effective engineering evaluation and analysis method for the evaluation of microgrid operational efficiency in port areas.
1. Introduction
In recent years, microgrids that integrate distributed energy sources, distribution networks, and electricity users have gradually been developed and deployed on a global scale and standardized as a crucial component of smart grids [1,2,3]. In China, in order to better support the ‘Dual Carbon Strategy’ and build a new type of power system, significant attention has been given to the development and utilization of park microgrid demonstration projects. With the trend toward the electrification of cargo handling equipment and the replacement of diesel energy with electricity in port areas, the establishment of a microgrid in port areas has become an emerging alternative solution to provide safe, high-quality, and green energy [4,5]. Against this backdrop, the establishment of green, low-carbon port microgrids primarily powered by clean energy sources has become a development trend [6]. To more effectively address energy consumption and environmental pollution issues in port areas, it is crucial to objectively evaluate the construction levels of various port microgrid projects. This objective assessment is vital for diverse configuration and deployment schemes of microgrids in port areas. It also serves as a foundation and reference for future engineering construction during the planning phase of port areas. The efficiency evaluation of port microgrids holds significant importance in the planning and assessment work. To conduct a meaningful assessment of port microgrids, it is essential to establish a comprehensive evaluation index system and employ scientifically sound evaluation models and methods. Through quantitative assessment, the relative merits and demerits of various planning schemes can be objectively determined, facilitating scientifically sound engineering evaluations and providing decision support for investors.
At present, there is relatively limited research on the comprehensive evaluation of microgrids in port areas. In terms of evaluation methods, valuable insights can be drawn from research on microgrid evaluation methods. From the perspective of microgrid operational objectives, the rationality and comprehensiveness of the evaluation index system construction are of paramount importance. This directly affects the effectiveness and accuracy of the comprehensive evaluation of microgrids and is crucial for the integration and optimization of microgrid systems [7,8]. In terms of the evaluation index system, Pierluigi conducted research on environmental assessment indicators and proposed evaluation metrics considering renewable energy penetration, greenhouse gas emissions, and fossil energy consumption to measure the environmental benefits of the system [9]. Zeng Ming’s team comprehensively considered various uncertainties in microgrid operation and simulation and established an independent microgrid comprehensive performance evaluation model based on indicators related to power supply reliability, energy utilization economics, and environmental friendliness [10]. Vasiljevska J. and others analyzed the impact of different electricity price mechanisms, energy prices, microgrid operation modes, and load–demand differences on various stakeholders within microgrids. They conducted evaluations from the perspectives of microgrid control, construction, operation, and stakeholder interests [11]. Most scholars have conducted research on the economic operation of microgrids from the perspectives of profitability, operating costs, energy conservation, and multi-objectives [12,13,14]. The aforementioned work has explored and researched microgrid evaluation indicators to some extent. It can be observed that the current research on microgrids mainly focuses on planning and operation, with issues such as incomplete and scientifically rigorous evaluation index systems, a lack of a well-structured hierarchy, repetition of indicators, and weak independence among the indicators. Most studies only consider attributes related to one or a few aspects. While some scholars have conducted in-depth research on specific aspects of evaluation, there is limited comprehensive evaluation and analysis of microgrid projects from economic, reliability, and environmental perspectives. Existing microgrid evaluation indicators cannot be directly applied to reflect the comprehensive benefits of microgrids in port areas, especially under the integrated development trend of ‘Generation-Grid-Load-Storage’ in port areas. Therefore, it is imperative to construct a well-structured and mutually independent evaluation index system for the operational efficiency of microgrids in port areas.
In terms of index weighting evaluation methods and evaluation models, the team led by Dong Fugui utilized the Analytic Hierarchy Process (AHP) and the entropy weight method for index weighting. They evaluated and analyzed the distributed energy system solutions based on set-pair analysis theory [15]. Building upon this, Zhang and others, based on AHP and an improved entropy weight method, established a VIKOR multi-criteria evaluation system to determine index weights and conduct evaluation analysis [16]. Wang et al. adopted a combined weighting method based on subjective AHP and objective CRITIC to determine the weights of the index system. Subsequently, they utilized the TOPSIS method to establish a model for assessing and ranking the Joint Operations Command Information System [17]. Some scholars have employed the CRITIC weighting method to assign weights to various indicators and conducted an analysis of the differences and correlations between different indicators. This approach yielded information and weights for each indicator, overcoming the limitations of subjective weighting methods and entropy weighting methods [18]. However, this method still suffers from a certain degree of subjectivity. At the same time, there is currently a lack of comprehensive and effective decision support methods specifically tailored for assessing the operational efficiency of microgrids in port areas in existing research. Furthermore, research on microgrid efficiency assessment methods faces challenges related to the reliability of basic data sources and the subjectivity in weight calculations, which affect the objectivity of evaluation results. Therefore, the development of a scientific, objective, and applicable evaluation model and method for the comprehensive evaluation of microgrid systems in port areas is an urgent problem that needs to be addressed.
The main contributions of this paper are as follows: ① Addressing the issues of the lack of a comprehensive and independent quantitative evaluation system for the operational efficiency of microgrids in port areas under different configurations and deployment schemes, as well as the subjective nature of existing universal evaluation decision methods, this paper hierarchically structures performance indicators for port microgrids. It classifies various indicators and proposes a comprehensive evaluation index system for port microgrid systems, including economic, energy efficiency, environmental, system reliability, and safety indicators. The established index system for port areas is clear and structurally sound. ② Furthermore, this paper introduces an evaluation model for the operational efficiency of port microgrids based on an improved CRITIC-TOPSIS approach for assessing a set of implementation schemes. This method first employs the improved CRITIC method to determine the objective weights of various efficiency indicators. Addressing the limitations of the CRITIC method in reflecting the absolute degree of variation in indicators under different dimensions and scales, this paper introduces the coefficient of variation to measure the comparative strength and relative variation of indicators among dimensions. This reduces the impact of correlations between indicators, thereby improving the accuracy and objectivity of evaluation results. Subsequently, the TOPSIS method is used to calculate comprehensive evaluation values, rank the optimal port microgrid schemes, and analyze evaluation results. This research provides a new and scientifically effective engineering evaluation and analysis method for the evaluation of the operational efficiency of microgrids in port areas. It offers scientific decision support for investors and stakeholders involved in the construction and development of port microgrids.
2. Construction of an Operational Efficiency Evaluation System for Microgrids in Port Areas
The development of microgrid systems in port areas requires multifaceted coordination. This paper takes into consideration various components of microgrids in port areas, employs the Analytic Hierarchy Process, and aligns with the construction and operational objectives of microgrids in port areas. Given that the ultimate goal and core characteristics of microgrid operation in port areas are green economy, high efficiency, safety, reliability, and coordinated operation, this paper constructs evaluation indicators for port microgrid systems from five dimensions: economic, energy efficiency, environmental, system reliability, and safety. It also establishes a framework of indicators that can reflect the operational performance of microgrids.
In this paper, the performance indicators of microgrids in port areas are hierarchically structured, and various indicators are classified and graded to create a comprehensive evaluation system for port microgrids, as shown in Figure 1. The specific steps are as follows: The performance indicators of port microgrids are categorized into four levels after hierarchical organization. The first level is the objective level, which aims to identify the optimal evaluation results for the comprehensive efficiency of the port energy system. These top-level indicators primarily reflect the main ‘outcomes’ of microgrid operation, and their results are comprehensive indicators determined by multiple factors of microgrid operation. The second level is the criterion level, represented by economic viability, energy efficiency, environmental sustainability, reliability, and safety. The third level is the indicator level, which includes the values of various indicators for the fourth-level schemes. The fourth level is the scheme level, representing the set of schemes to be evaluated.
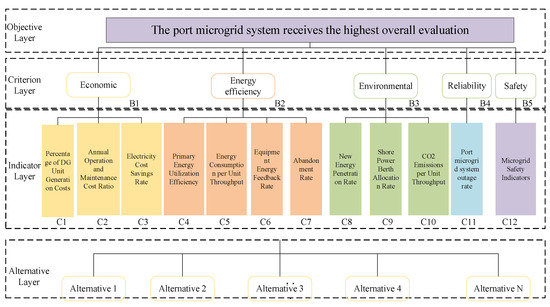
Figure 1.
Performance hierarchy structure diagram of the microgrid in the port area.
The proposed operational efficiency evaluation index system for microgrids in port areas in this paper can be used to assess the construction and operational results of microgrid projects in port areas. It provides a clear understanding of the weak points in microgrid operation and offers scientific guidance for improving the operation and future planning of microgrids in port areas. Within the hierarchical and categorized structure of the index system mentioned above, each category includes several specific indicators, and each indicator has its own quantification and calculation method.
3. Quantification of Operational Efficiency Evaluation Indicators for Microgrids in Port Areas
Within the hierarchical and categorized structure of the index system mentioned above, each category includes several specific indicators, and the specific calculation methods for each category of indicators related to the economic viability, energy efficiency, environmental sustainability, reliability, and safety of microgrids in port areas are detailed in Section 3.1, Section 3.2, Section 3.3 and Section 3.4.
3.1. Microgrid Economic Performance Indicators
- Percentage of Distributed Generation (DG) Unit Generation Costs
In the equation, n represents the number of units in the system; Ka,i represents the unit capacity purchase cost of the i-th unit in the system, measured in CNY per kW; Pi represents the installed capacity of the i-th unit in the system; Cn represents the total generation cost of the system.
- 2.
- Annual Operation and Maintenance Cost Ratio
In the equation, Ca,i represents the unit capacity variable cost of the i-th unit in the system, measured in CNY per kW·h; Ti represents the annual average operating time of the equipment; Cb,i represents the unit capacity fixed cost of the i-th unit in the system, measured in CNY per kW.
- 3.
- Electricity Cost Savings Rate
In the equation, Cg represents the electricity cost savings achieved by all users in response to dynamic pricing during a specific time period, while Pg represents the electricity cost incurred by all users who do not respond to dynamic pricing during the same time period.
3.2. Microgrid Energy Efficiency Indicators
- Primary Energy Utilization Efficiency
The primary energy utilization efficiency can be expressed as the ratio of the sum of various energy outputs from the port energy system to the primary energy consumption.
In the equation, , , and represent the total annual electricity, heating, and cooling loads required by various port areas (in kW h). represents the efficiency of coal-fired power generation, and represents the transmission loss rate, with values of 35% and 7%, respectively. Generally, a higher primary energy utilization efficiency indicates greater energy savings for the system.
- 2.
- Energy Consumption per Unit Throughput
In the equation, Qstec represents the energy consumption for production, which can be considered as the amount of purchased electricity and natural gas converted to standard coal equivalent. represents the throughput of the port. and are the annual consumption of electricity and natural gas for the port’s energy system, respectively. and are the conversion coefficients for electricity and natural gas to standard coal equivalent, which are 0.4040 kgce/kW h and 1.2143 kgce/m3, respectively.
- 3.
- Equipment Energy Feedback Rate
In the equation, Ere represents the energy feedback amount, and Euse represents the actual consumed energy.
- 4.
- Abandonment Rate
In the equation, Pd,t,w represents the curtailed power of renewable energy in the system during different time periods, while Pd,t,g represents the actual power of renewable energy consumed by the system in various time periods.
3.3. Microgrid Environmental Performance Indicators
- New Energy Penetration Rate
In the equation, Ere represents the installed capacity of renewable energy in the system, and Etotal represents the total capacity for renewable energy generation.
- 2.
- Shore Power Berth Allocation Rate
In the equation, Nclean represents the number of shore power berths in use, and Ntot represents the total number of berths at the port.
- 3.
- Carbon Dioxide Emissions per Unit Throughput
In the equation, Qco2 represents the CO2 emissions from the port’s energy system, and C33 is the ratio of emissions to port throughput. Where εCO2 represents the CO2 emission coefficient after converting purchased electricity and natural gas into standard coal, with a value of 2.54 t CO2/tec. When calculating the unit throughput CO2 emissions for the port’s production, the value of port throughput used is consistent with the port throughput value used for calculating the comprehensive energy consumption of the port’s production per unit throughput.
3.4. Microgrid Reliability Indicators
In the equation, WE represents the load demand, and ΔWE represents the electricity supply shortfall.
3.5. Microgrid Safety Indicators
Using the Voltage Security Margin (VSM) C12 as the critical value for the safety domain, denoting it as the safety indicator.
In the equation, represents the maximum allowable voltage deviation at node i; should not exceed ±5% of the rated value; is the safety factor, taken as 0.3; represents the voltage deviation magnitude at node i at time t, and it is defined as follows:
In the equation, Ve represents the rated node voltage of the system, and represents the voltage value at node i at time t.
Considering that the VSM values vary for different nodes i, the minimum value of VSM among all nodes is selected as the safety indicator for the system at time t, denoted as follows:
4. Evaluation Method for the Operational Efficiency of Port Microgrids
As a complex system, port microgrids require a multi-indicator evaluation method to assess their operational efficiency, as summarized and analyzed in the previous section. When conducting a comprehensive assessment of system efficiency, mathematical models are employed to calculate intuitive evaluation results.
4.1. Architecture of the Port Microgrid Operational Efficiency Evaluation Model
After establishing the evaluation indicator system architecture for the port microgrid, this section first employs an improved CRITIC method for objective weighting to determine the weight coefficients of each indicator in the evaluation system, effectively addressing the differences and correlations between the indicators. Then, the TOPSIS method is used to construct a comprehensive evaluation model, enabling a comprehensive and accurate assessment of the overall operational efficiency of the port microgrid. The basic process architecture is shown in Figure 2.
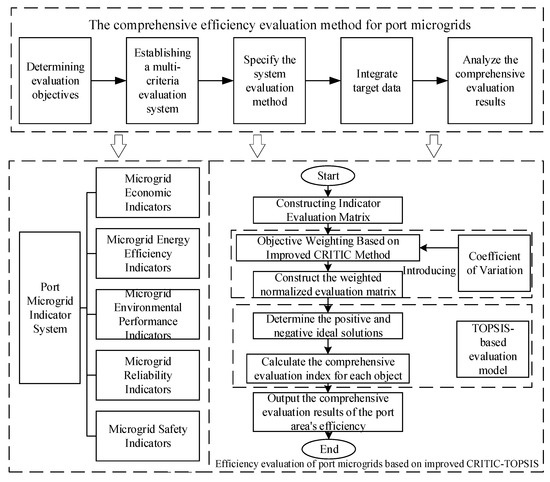
Figure 2.
Efficiency assessment model for port area microgrid systems based on the enhanced CRITIC-TOPSIS evaluation model.
4.2. Port Operational Efficiency Evaluation Based on Improved CRITIC-TOPSIS
4.2.1. Objective Weighting Method Based on Improved CRITIC
The current mainstream objective weighting methods include the entropy weight method, the standard deviation method, and the CRITIC method. Among these, the entropy weight method and the standard deviation method share similar calculation principles, mainly determining objective weights based on the magnitude of indicator variability. The entropy weight method and the standard deviation method typically assume that the criteria are mutually independent, thus neglecting the interrelationships between criteria layer indicators [19]. Therefore, this paper adopts the CRITIC (Criteria Importance Through Intercriteria Correlation) objective weighting method to assign weights to the criteria layer C1–C12, providing the necessary input parameters for the comprehensive evaluation model of port operational efficiency.
The introduction of contrast intensity and the conflict between evaluation indicators is used to calculate the magnitude of information contained in different indicators. By assessing the combination of correlation and information content, the objective weights of indicators are comprehensively measured. Contrast intensity reflects the differences in values between evaluation objects for the same indicator, typically represented in the form of standard deviation. A larger standard deviation indicates greater variability, reflecting larger differences in values among scenarios and, therefore, more information contained, resulting in a higher weight. The conflict between indicators is expressed using correlation coefficients, where a larger correlation coefficient indicates less conflict and, consequently, a lower weight [20,21]. When calculating objective weights, consideration is given to both the variability of indicators and the correlations between them. It is essential to understand that larger numerical values do not necessarily imply greater importance. The CRITIC method utilizes the inherent characteristics of the data for a scientific evaluation. This approach avoids the simplistic interpretation of numerical values as indicators of importance and, through relative relationships, provides a more nuanced assessment of indicator importance. In the CRITIC method, decision-makers can construct the criteria matrix based on data and domain expertise, thereby expressing the interdependence, interaction, and relative importance of indicators, leading to more rational weight results.
Therefore, the CRITIC method is considered a superior objective weighting approach compared to entropy-based and standard deviation-based methods. It effectively combines characteristics such as data variability and correlations to yield objective and reliable weightings. It mitigates the impact of extreme values in individual data points to some extent, making it suitable for the evaluation of microgrid efficiency in this study. However, using standard deviation can only reflect the absolute degree of variation in indicators and does not adequately measure the relative strength and relative changes in indicators concerning dimensions and magnitudes. To address this limitation, the coefficient of variation is introduced for improvement [22]. The specific calculation steps are as follows:
Step 1: Construct the original evaluation matrix X for the efficiency indicators of the port area. Let m be the number of microgrid scenarios in the port area and n be the number of evaluation indicators. The original data evaluation matrix is composed of the original indicator values xpq for the q-th evaluation indicator of the p-th evaluation scenario.
Step 2: To eliminate the influence of dimensions on the evaluation results, the Z-score method is used to normalize the original evaluation matrix X. The calculation formula is as follows:
In the formula, represents the standard deviation of the indicator, where ;
represents the mean value of the same indicator, where in .
After normalization, the matrix .
Step 3: Introduce the coefficient of variation to replace the contrast intensity, reflecting the relative variation of efficiency in the same indicator among various evaluation objects in the port area.
In the formula, represents the coefficient of variation for the q-th indicator.
Step 4: Use correlation coefficients to represent the conflicts of each indicator under different scenarios in the port area, denoted as . Calculate the Pearson correlation coefficients between the efficiency indicators of the port area using the Pearson correlation coefficient calculation method, resulting in a correlation coefficient matrix .
In the equation, and represent the normalized scores of the k-th and l-th efficiency indicators in the p-th scenario, respectively. and represent the normalized means of the k-th and l-th indicators, respectively.
According to the correlation coefficient matrix, the formula for calculating conflict is as follows:
Step 5: Calculate the weight for each indicator.
Combining the results obtained from steps (3) and (4), calculate the comprehensive coefficient Sq for the efficiency indicators of the port area as follows:
The weight of the q-th efficiency indicator of the port area, calculated using the improved CRITIC method for objective weighting, is as follows:
4.2.2. Efficiency Comprehensive Evaluation Method Based on TOPSIS
The Technique for Order of Preference by Similarity to Ideal Solution (TOPSIS) is an approach used to rank multiple evaluation objects based on their proximity to both positive and negative ideal solutions. It is widely applied in multi-objective decision-making and evaluation problems [20]. The optimal solution is the one that is closest to the positive ideal solution while being farthest from the negative ideal solution. The specific calculation is as follows:
Step 1: Obtain the normalized decision matrix based on the original data evaluation matrix .
Step 2: Combine the weight coefficient matrix w obtained from the improved CRITIC objective weighting method to construct the weighted normalized decision matrix, where an element of , is as follows:
Step 3: Determine and construct the positive ideal solution and negative ideal solution sets as follows:
The formula, where and represent the positive ideal solution and negative ideal solution, respectively.
Step 4: Calculate the distance between different port evaluation scenarios and the positive and negative ideal solutions.
The formulas, where and represent the distances between the evaluated solution and the positive and negative ideal solutions, respectively, while and represent the parameters of each evaluation indicator in the positive and negative ideal solution sets.
Step 5: Calculate the comprehensive evaluation value for the evaluated solution.
The larger the value, the closer it is to the optimal solution, indicating that the microgrid scenario in the port area has the highest efficiency.
5. Case Study Analysis
In order to validate the effectiveness of the proposed operational efficiency evaluation system for port microgrids and the improved CRITIC-TOPSIS comprehensive efficiency evaluation method tailored to port microgrids, this study takes three typical port microgrid project scenarios as examples and uses their relevant operational data for performance evaluation and analysis. Among these scenarios, Scenario 1 has a larger installed capacity for wind and solar energy storage; Scenario 2 places greater emphasis on environmental sustainability; and Scenario 3 has higher requirements for power quality.
5.1. Analysis of Original Data for Port Microgrid Indicators
The data requirements, indicator matrices, and rankings based on indicator attributes for various port microgrid configuration scenarios can be found in Table 1 and Table 2.

Table 1.
Sources of data for various evaluation indicators.
Table 2.
Evaluation indicator matrix for port microgrid.
5.2. Comprehensive Efficiency Evaluation of Port Microgrid
According to the improved CRITIC-TOPSIS method, the calculation for different scenarios of the port microgrid samples was performed. Initially, a weight calculation was carried out using the improved CRITIC method by substituting the evaluation indicator matrix of the port microgrid from Table 2 into Equations (18)–(21), resulting in the correlation coefficients for each indicator, as shown in Figure 3.
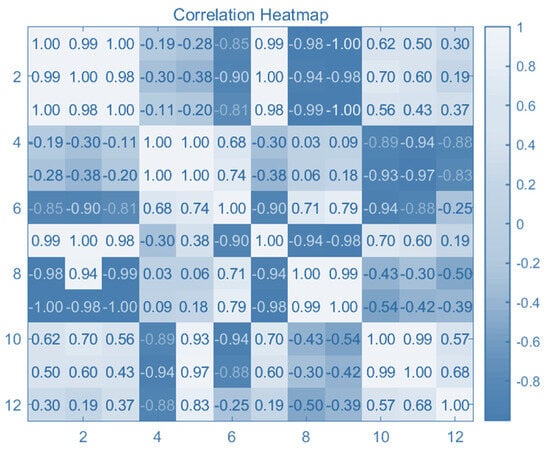
Figure 3.
Correlation coefficients for port microgrid indicators.
The results of calculating the coefficient of variation based on Equation (20) are presented in Table 3.
Table 3.
Results of coefficient of variation calculation.
The efficiency indicator weight coefficients for the port area are calculated based on Table 2 for correlation coefficients and the results of the coefficient of variation from Table 3. These weights are also subject to a rationality test based on the indicator weight of the scheme set. The final weight coefficients for the efficiency indicators in the port area are presented in Table 4.
Table 4.
Indicator weights.
Based on the weight values of the indicators for each microgrid in Table 4, and using the TOPSIS method, the comprehensive evaluation values and rankings of the different microgrid schemes are obtained, as shown in Table 5 below.
Table 5.
Comprehensive evaluation results and rankings.
Based on the calculation results, it can be determined that the comprehensive evaluation values for the microgrid schemes in the port area are 52.97%, 43.15%, and 58.25% for schemes 1–3, respectively. Microgrid scheme 3 has the highest closeness degree at 58.25%, indicating that it is the optimal comprehensive scheme for the port area microgrid. In conclusion, the CRITIC-TOPSIS comprehensive evaluation method for port area microgrids can make full use of existing data information, and the evaluation process from weighting the operational performance indicators to comprehensive evaluation does not require consideration of expert subjective experience. It is entirely based on information from actual data, resulting in more objective and reliable evaluation results for the port area microgrid schemes.
5.3. Results Validation and Discussion
To validate the feasibility and superiority of the improved CRITIC-TOPSIS method proposed in this paper for evaluating the operational efficiency of microgrids in the harbor area, both subjective and objective assessments were conducted using the AHP-expert scoring method and the entropy-weighted TOPSIS method, respectively. Table 6 and Table 7 show the expert scoring results and the evaluation results using different methods. Three experts were involved in the assessment process. According to the scoring rules as shown in Table 6, each expert independently scored the criteria corresponding to different scenarios. The scores assigned by the experts were then combined with the criteria weights to obtain the comprehensive performance scores for different microgrid scenarios. The efficiency scores obtained are shown below.
Table 6.
Expert scoring results.
Table 7.
Comprehensive evaluation results and rankings using different methods.
Comparative experimental results show that due to the relatively high weights of safety and reliability indicators in the microgrid indicator system in the port area, followed by economic indicators, microgrid solution 3 has a higher comprehensive evaluation value due to its better power quality. The method proposed in this paper has a certain feasibility in evaluating the operational efficiency of microgrids in port areas. According to using the comprehensive evaluation ranking in Table 7, the evaluation results of the entropy weight method fluctuate more with changes in data. In contrast, the improved CRITIC method, by avoiding a simple interpretation of numerical magnitude as indicator importance and by using a more detailed assessment of indicator importance through relative coefficients, results in greater stability. At the same time, the proposed method reasonably avoids the strong subjectivity of traditional expert judgment weight calculation during the planning phase of port microgrids.
6. Conclusions
In this paper, with respect to different configurations and deployment schemes for port area microgrids, we first established a comprehensive evaluation system for port area microgrid system indicators from five dimensions: economic, energy efficiency, environmental, system reliability, and safety. We then developed an operational efficiency comprehensive assessment model for port area microgrids based on an improved CRITIC-TOPSIS approach. The following conclusions were drawn:
- (1)
- The constructed evaluation index system for the operational efficiency of port area microgrids in this paper allows for the evaluation of both the construction and operational results of microgrid projects. The evaluation method presented can provide reference insights for the comprehensive energy system design of microgrids in industrial parks, including equipment configuration and safety performance. It identifies the weaknesses within port area microgrids and provides a more rigorous framework with independent indicators. This system offers a more objective assessment of the strengths and weaknesses of different configurations and deployment schemes for port area microgrids. It serves as scientific guidance and aids in decision-making for improving the operation and future planning of port area microgrids.
- (2)
- The proposed operational efficiency evaluation model, based on the improved CRITIC-TOPSIS method, enables the objective quantitative assessment of various port area microgrid operational efficiencies. This method is free from subjective factors and introduces a new, simple, and scientifically effective engineering evaluation approach for assessing the operational efficiency of port area microgrids. It effectively fills the gap in the evaluation techniques for port area microgrid project operation efficiency and holds practical value and applicability.
- (3)
- By incorporating the improved CRITIC method with variation coefficients, this approach scientifically and reasonably determines the weights of different indicators. It considers the interrelationships between indicators while ensuring the objectivity of the weightings, thus enhancing the scientific accuracy of the optimization results.
- (4)
- The paper studied the operational efficiency indicator system of port microgrids. However, factors affecting the safety indicators of port microgrids should not only include voltage stability but also frequency stability, harmonics, flicker values, and other safety indicators. The next step should involve comprehensive efficiency evaluations that take all these factors into account. At the same time, the model and method proposed in this paper also have their limitations, such as overlooking the importance of subjective knowledge and experience. Therefore, further research is needed on how to simultaneously consider objective data and expert experience when determining indicator weights.
Author Contributions
X.X. and K.W.: conceptualization, methodology, formal analysis, investigation, writing—original draft; Y.L.: conceptualization, methodology, writing and revision, supervision; Y.T., L.H. and M.Z.: supervision and revision of the whole work. All authors have read and agreed to the published version of the manuscript.
Funding
This research is supported by the National Key Research and Development Program of China (Grant No. 2021YFB2601300).
Institutional Review Board Statement
Not applicable.
Informed Consent Statement
Informed consent was obtained from all subjects involved in the study.
Data Availability Statement
Where data are unavailable due to privacy or ethical restrictions.
Conflicts of Interest
The authors declare no conflict of interest.
Abbreviations
| CRITIC | Criteria Importance Through Intercriteria Correlation |
| TOPSIS | Technique for Order of Preference by Similarity to Ideal Solution |
| AHP | Analytic Hierarchy Process |
| DG | Distributed Generation |
| VSM | Voltage Security Margin |
References
- Muhtadi, A.; Pandit, D.; Nguyen, N. Distributed energy resources based microgrid: Review of architecture, control, and reliability. IEEE Trans. Ind. Appl. 2021, 57, 2223–2235. [Google Scholar] [CrossRef]
- Yang, X.; Su, J.; Lv, Z. Overview on micro-grid technology. Proc. CSEE 2014, 34, 57–70. [Google Scholar]
- Hatziargyriou, N.D.; Asano, H.; Iravani, R. Microgrids. IEEE Power Energy Mag. 2007, 5, 78–94. [Google Scholar] [CrossRef]
- Molavi, A.; Shi, J.; Wu, Y.; Lim, G.J. Enabling smart ports through the integration of microgrids: A two-stage stochastic programming approach. Appl. Energy 2020, 25, 114022. [Google Scholar] [CrossRef]
- Wang, L.; Liang, C.; Shi, J.; Molavi, A.; Lim, G.; Zhang, Y. A bilevel hybrid economic approach for optimal deployment of onshore power supply in maritime ports. Appl. Energy 2021, 292, 11689. [Google Scholar] [CrossRef]
- Sifakis, N.; Tsoutsos, T. Planning zero-emissions ports through the nearly zero energy port concept. J. Clean. Prod. 2021, 286, 125448. [Google Scholar] [CrossRef]
- Yang, K.; Zhu, N.; Ding, Y. Evaluation of the biomass gasification-based combined cooling, heating and power system using the maximum generalized entropy principle. Energy Convers. Manag. 2019, 192, 150–160. [Google Scholar]
- Wu, M.; Zhao, T.; Zhao, F. Evaluation index system and method for microgrid operation performance assessment. Power Syst. Technol. 2018, 42, 690–697. (In Chinese) [Google Scholar]
- Mancarella, P. MES (multi-energy systems): An overview of concepts and evaluation models. Energy 2014, 65, 1–17. [Google Scholar] [CrossRef]
- Zeng, M.; Li, N.; Ma, M. An integrated performance evaluation model of independent microgrid considering impacts of uncertain factors. Power Syst. Technol. 2013, 37, 1–8. (In Chinese) [Google Scholar]
- Vasiljevska, J.; Lopes, J.A.P.; Matos, M.A. Evaluating the impacts of the multi-microgrid concept using multicriteria decision aid. Electr. Power Syst. Res. 2012, 91, 44–51. [Google Scholar] [CrossRef]
- Tsikalakis, A.G.; Hatziargyriou, N.D. Centralized control for optimizing microgrids operation. IEEE Trans. Energy Convers. 2008, 23, 241–247. [Google Scholar] [CrossRef]
- Hernande, Z.; Aramburo, C.A.; Green, T.C. Fuel consumption minimization of a microgrid. IEEE Trans. Ind. Appl. 2005, 41, 673–681. [Google Scholar] [CrossRef]
- Zhu, L.; Zhou, X.; Tang, L.; Lao, C. Multi-objective optimization operation of microgrid considering interruptible loads. Power Syst. Technol. 2017, 41, 1847–1854. (In Chinese) [Google Scholar]
- Dong, F.; Zhang, Y.; Shang, M. Multi-criteria comprehensive evaluation of distributed energy system. Proc. CSEE 2016, 36, 3214–3222. (In Chinese) [Google Scholar]
- Zhang, S.; Lü, S. Comprehensive energy system evaluation method for park microgrid. Power Syst. Technol. 2018, 42, 2431–2438. (In Chinese) [Google Scholar]
- Wang, S.; Ye, G.M. Comprehensive Evaluation of Joint Operational Command Information System Based on CITIC-TOPSIS. Ship Electron. Eng. 2021, 41, 15–19. [Google Scholar]
- Wang, H.; Li, Y.; Liu, T. Optimizing Irrigation Scheduling for Greenhouse Crops Using the CRITIC-TOPSIS Framework. J. Irrig. Drain. 2023, 42, 52–59. [Google Scholar]
- Hu, N.; Wang, W.; Zhang, N. Morphological evaluation method of CNC machine tools based on improved CRITIC-TOPSIS and computational aesthetics. Mach. Des. Res. 2023, 39, 170–175. (In Chinese) [Google Scholar]
- Zhipeng, L.; Wu, M.; Song, Z. Comprehensive Evaluation of Power Quality on CRITIC-TOPSIS Method. Electr. Mach. Control 2020, 24, 137–144. [Google Scholar]
- Wang, Y.; Chang, Q. Dynamic assessment of urban environmental quality based on quadratic weighting TOPSIS method. J. Saf. Environ. 2018, 18, 784–788. (In Chinese) [Google Scholar]
- Wu, H.W.; Zhen, J.; Zhang, J. Urban rail transit operation safety evaluation based on an improved CRITI method and cloud model. J. Rail Transp. Plan. Manag. 2020, 3, 100206. [Google Scholar]
Disclaimer/Publisher’s Note: The statements, opinions and data contained in all publications are solely those of the individual author(s) and contributor(s) and not of MDPI and/or the editor(s). MDPI and/or the editor(s) disclaim responsibility for any injury to people or property resulting from any ideas, methods, instructions or products referred to in the content. |
© 2023 by the authors. Licensee MDPI, Basel, Switzerland. This article is an open access article distributed under the terms and conditions of the Creative Commons Attribution (CC BY) license (https://creativecommons.org/licenses/by/4.0/).