
A Study of Assessment and Prediction of Water Quality Index Using Fuzzy Logic and ANN Models

 ,
,  ,
,  ,
, 
Abstract
:1. Introduction
1.1. Water Quality Assessment
1.2. Fuzzy Logic
- -
- The solution of issues with numerous input variables and complex interdependencies between them.
- -
- The calculation of the final index occurs by evaluating the behavior of each analyzed parameter in relation to others.
1.3. Artificial Neural Network
- (1)
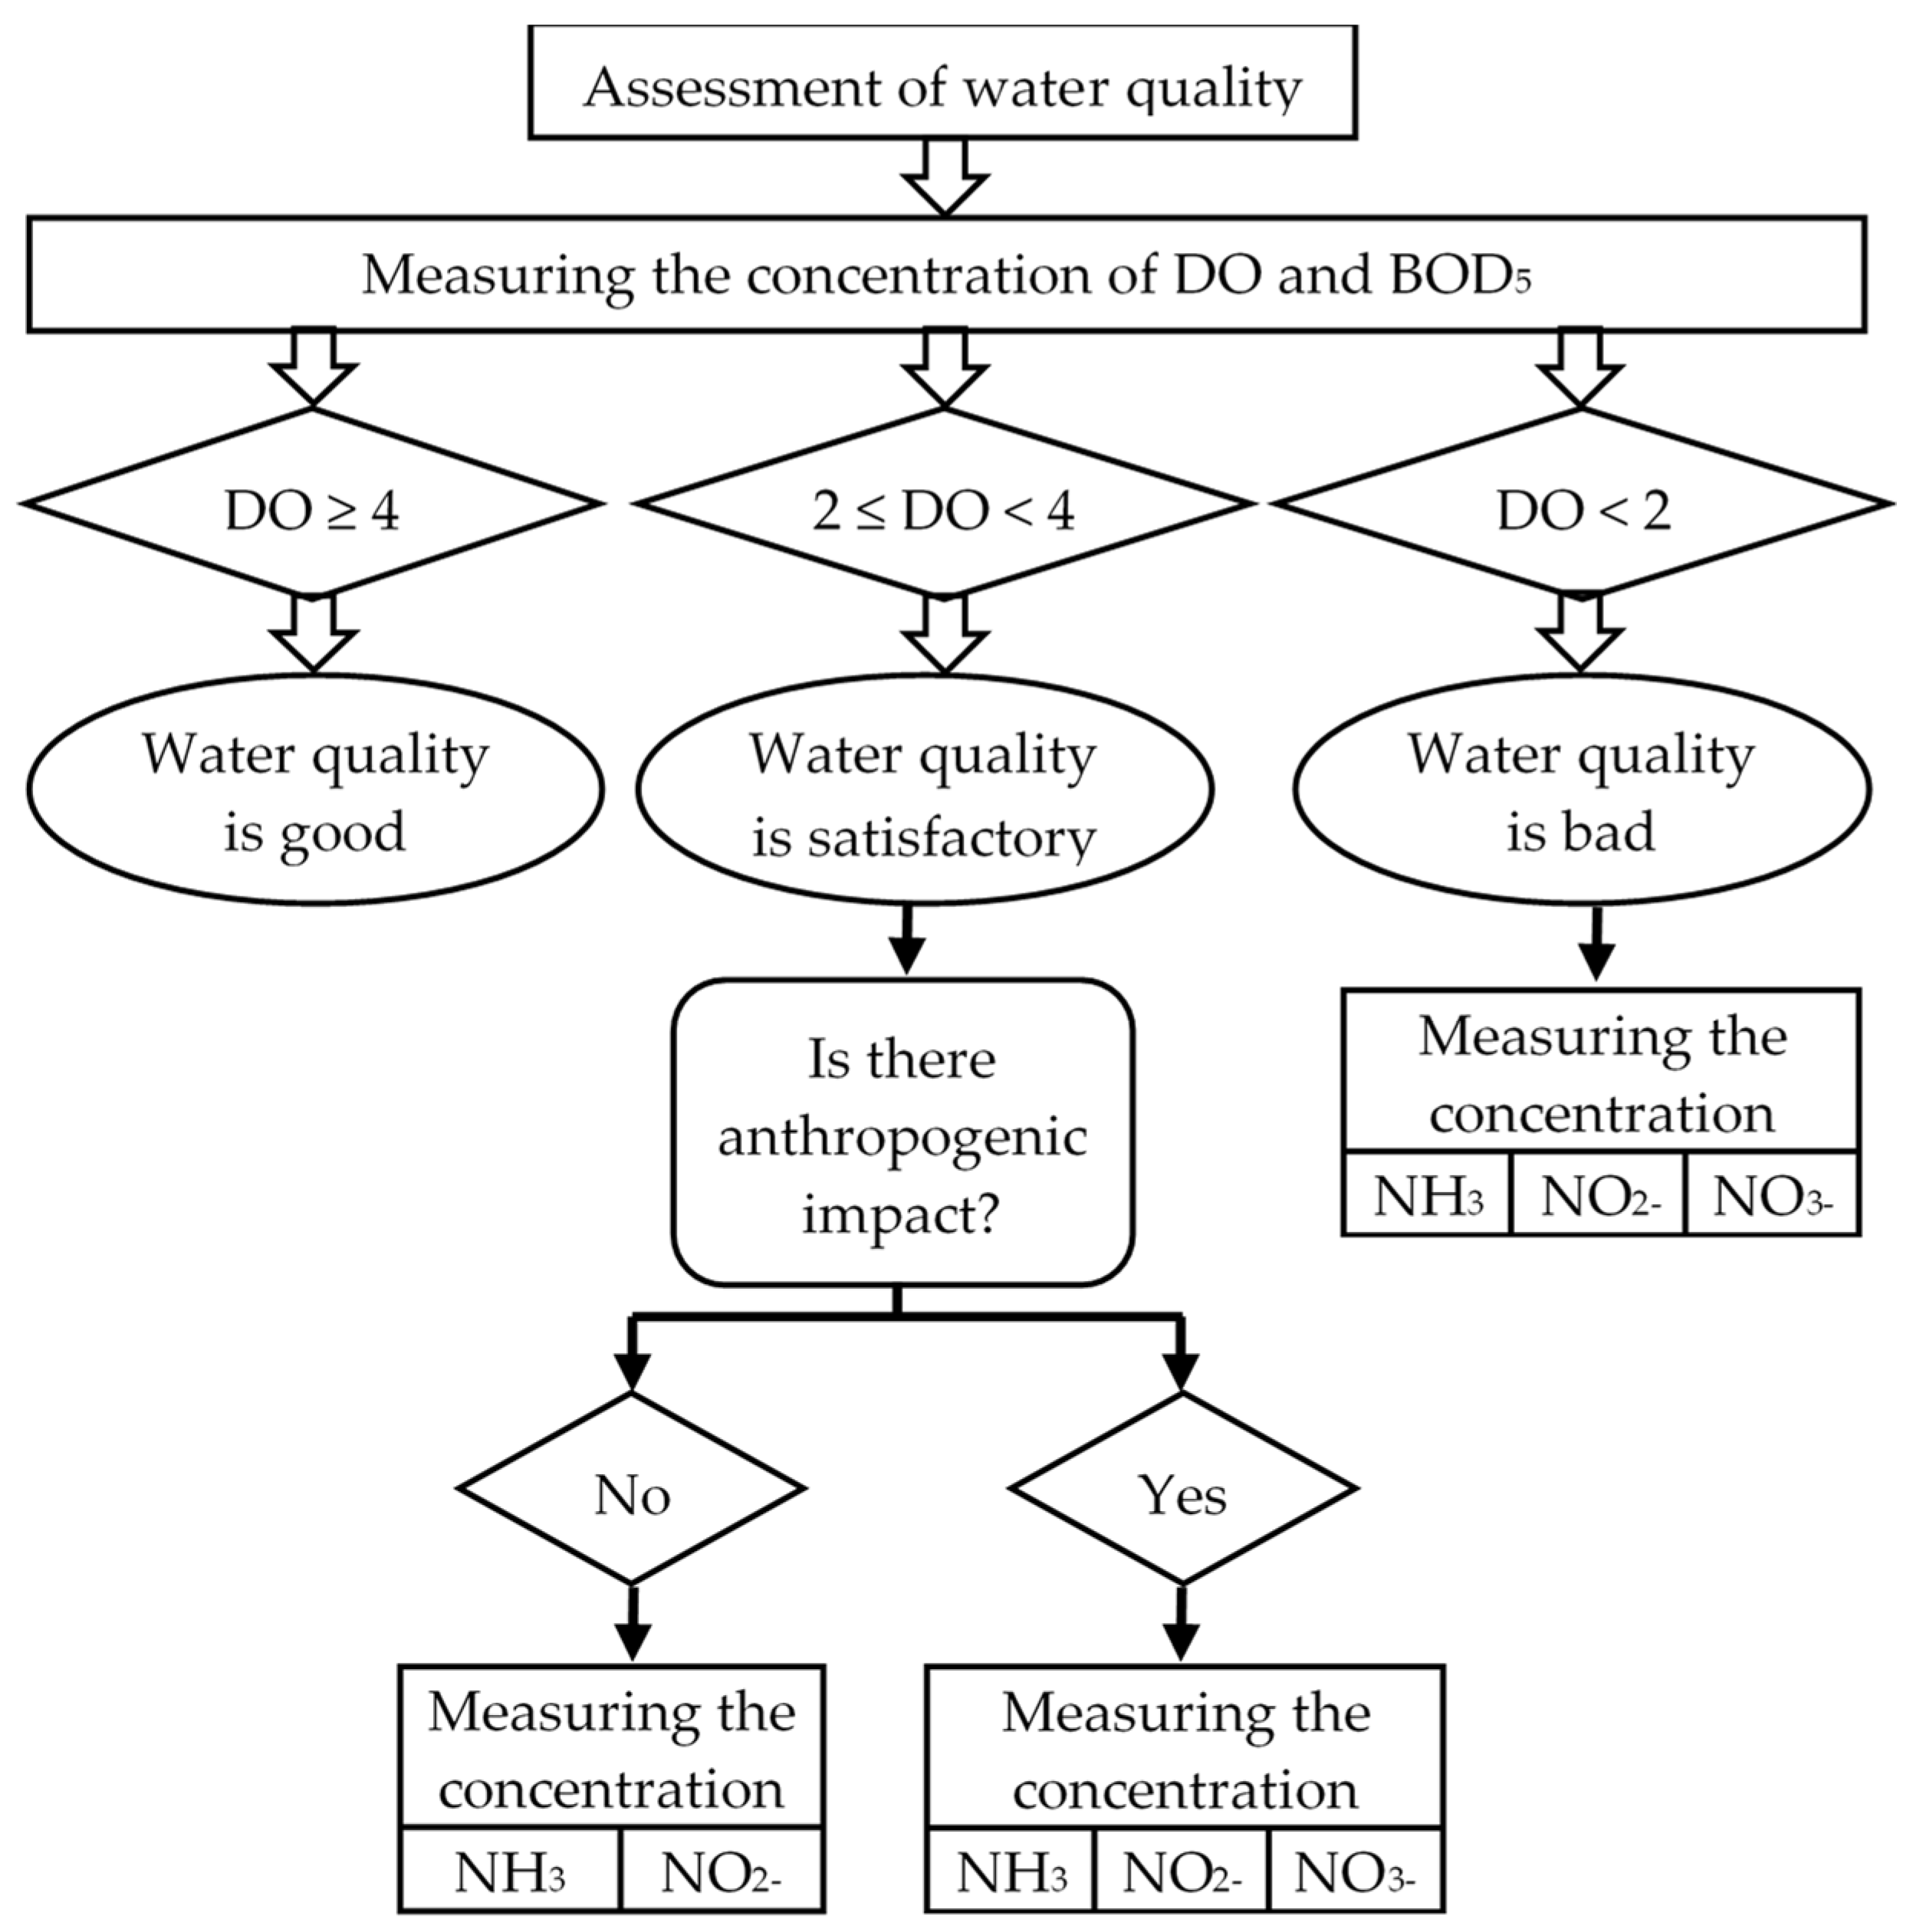
- To propose a diversified approach to assessing the quality of surface water using the number of analyzed chemical indicators depending on the degree of anthropogenic impact on a river basin;
- (2)
- To model WQI evaluation using fuzzy logic;
- (3)
- To create an artificial neural network model for WQI prediction.
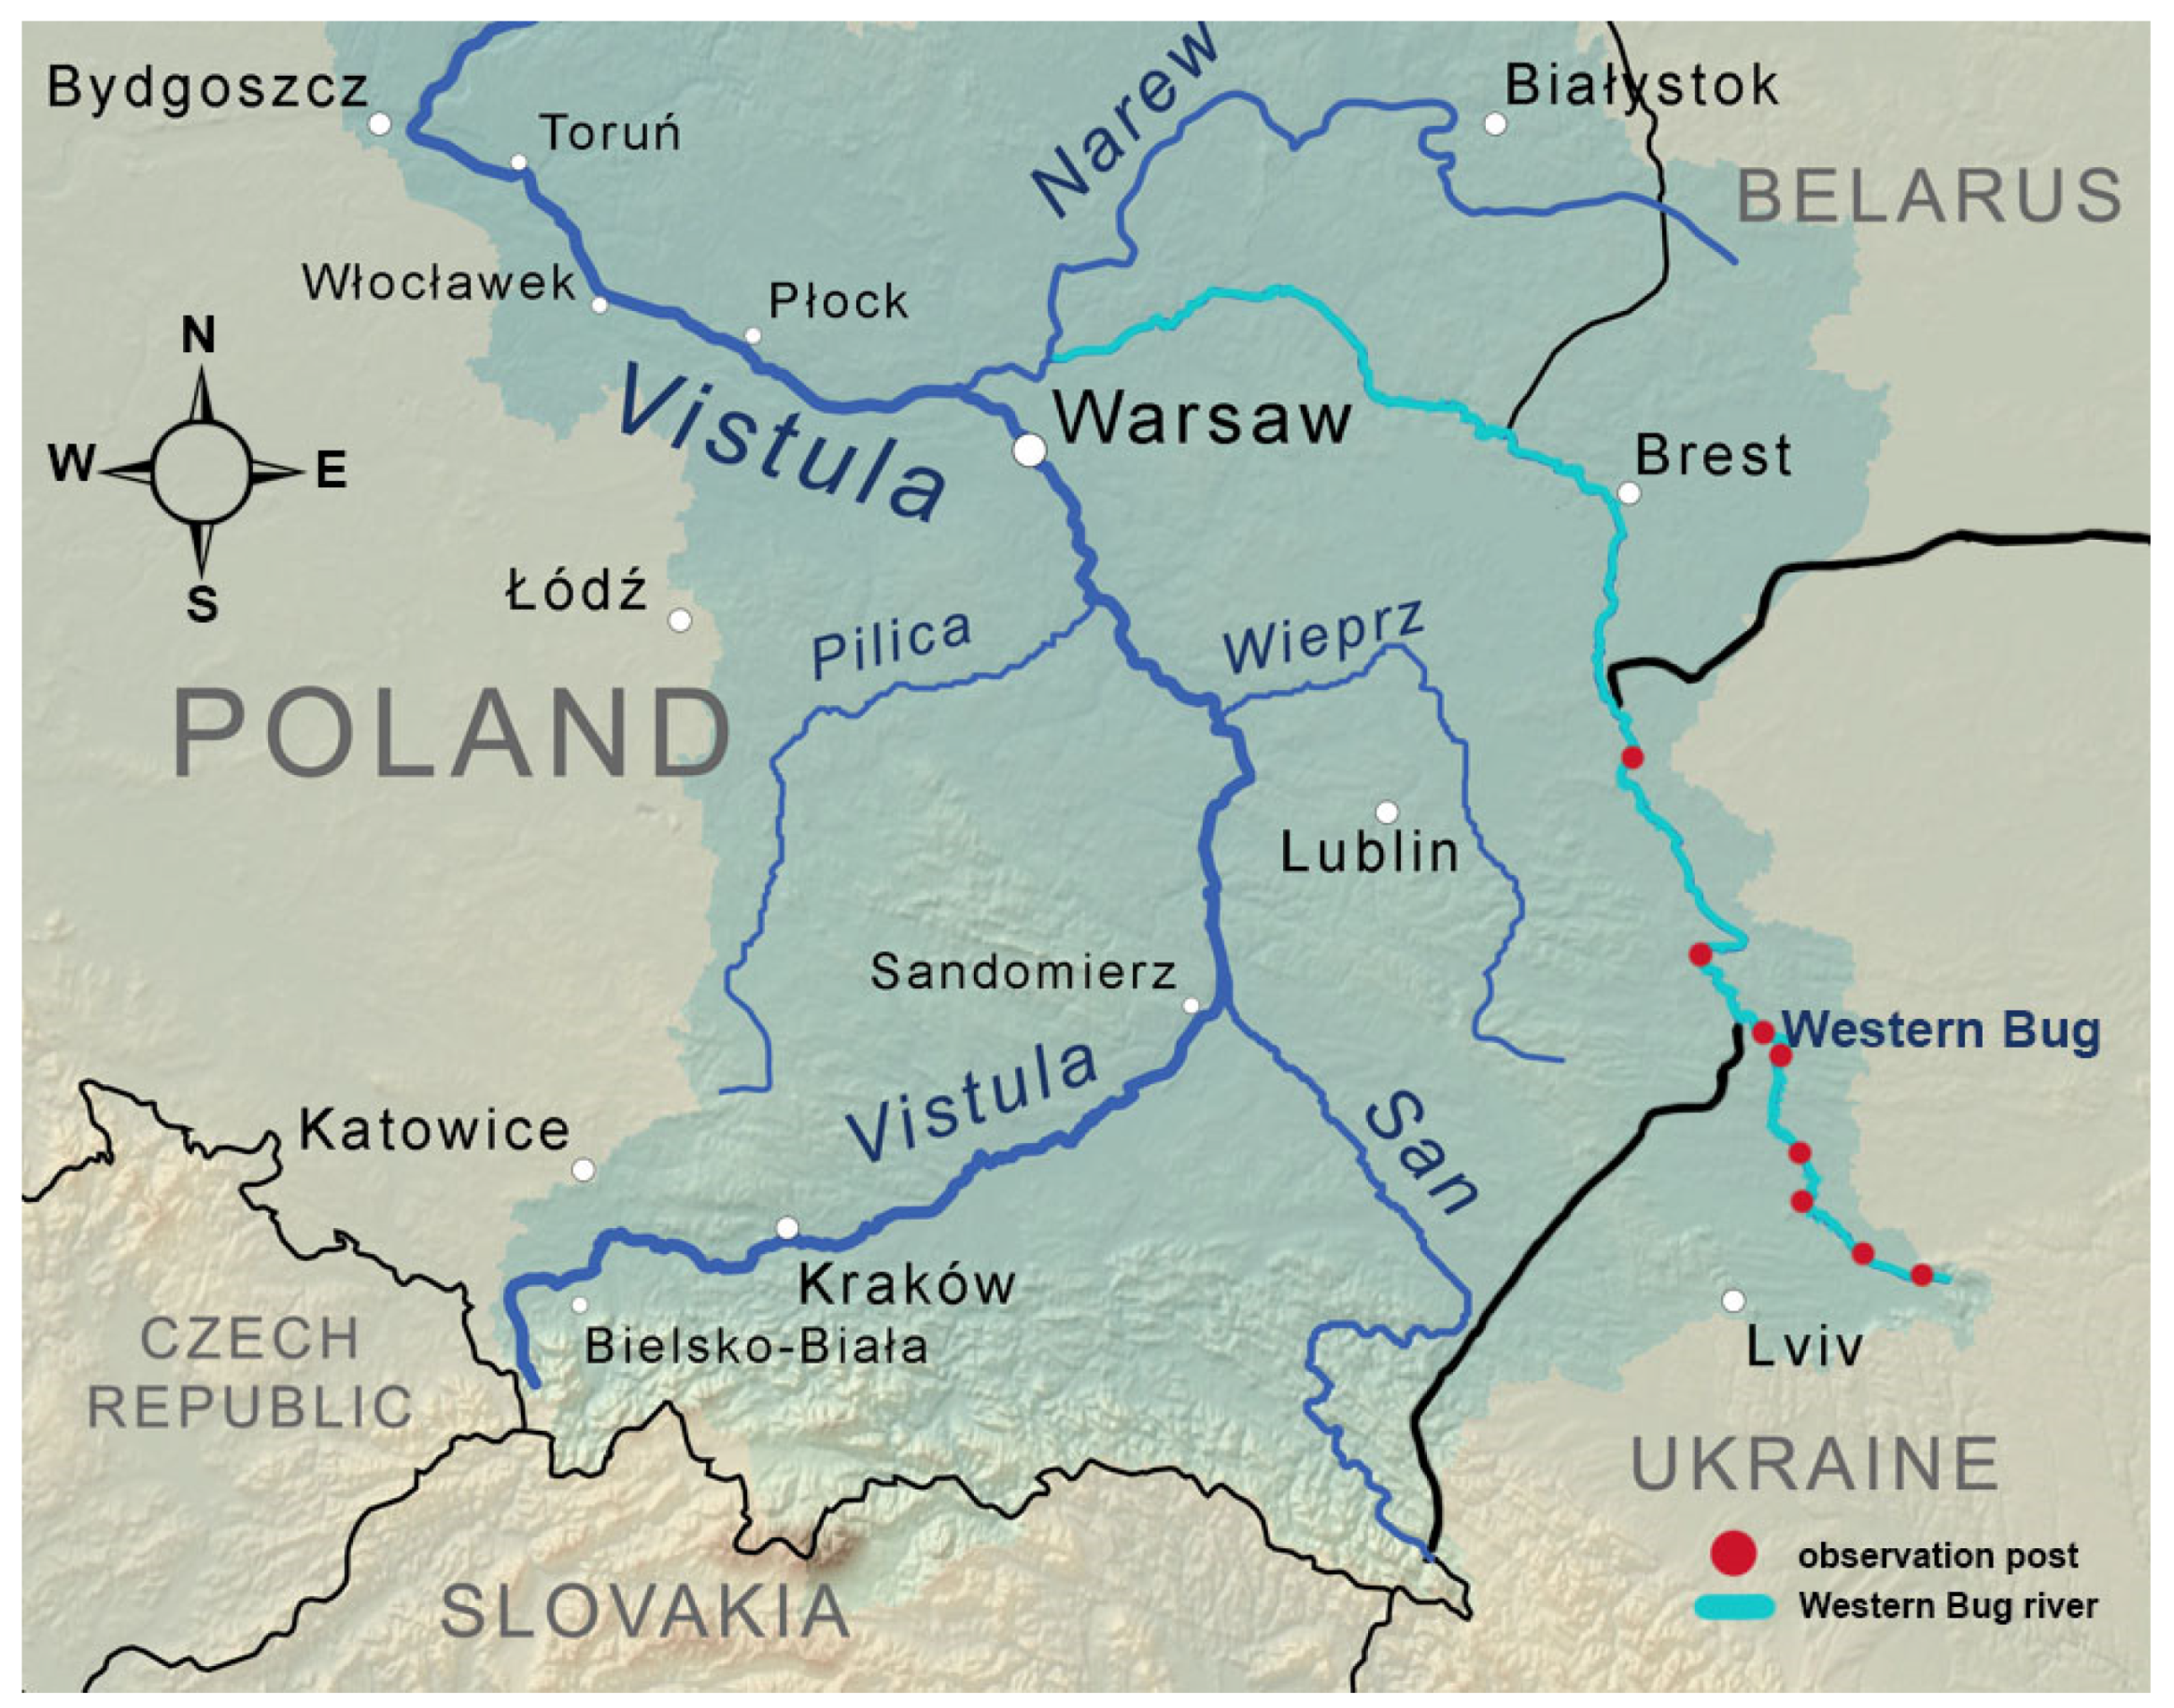
2. Study Area and Datasets
3. Methods
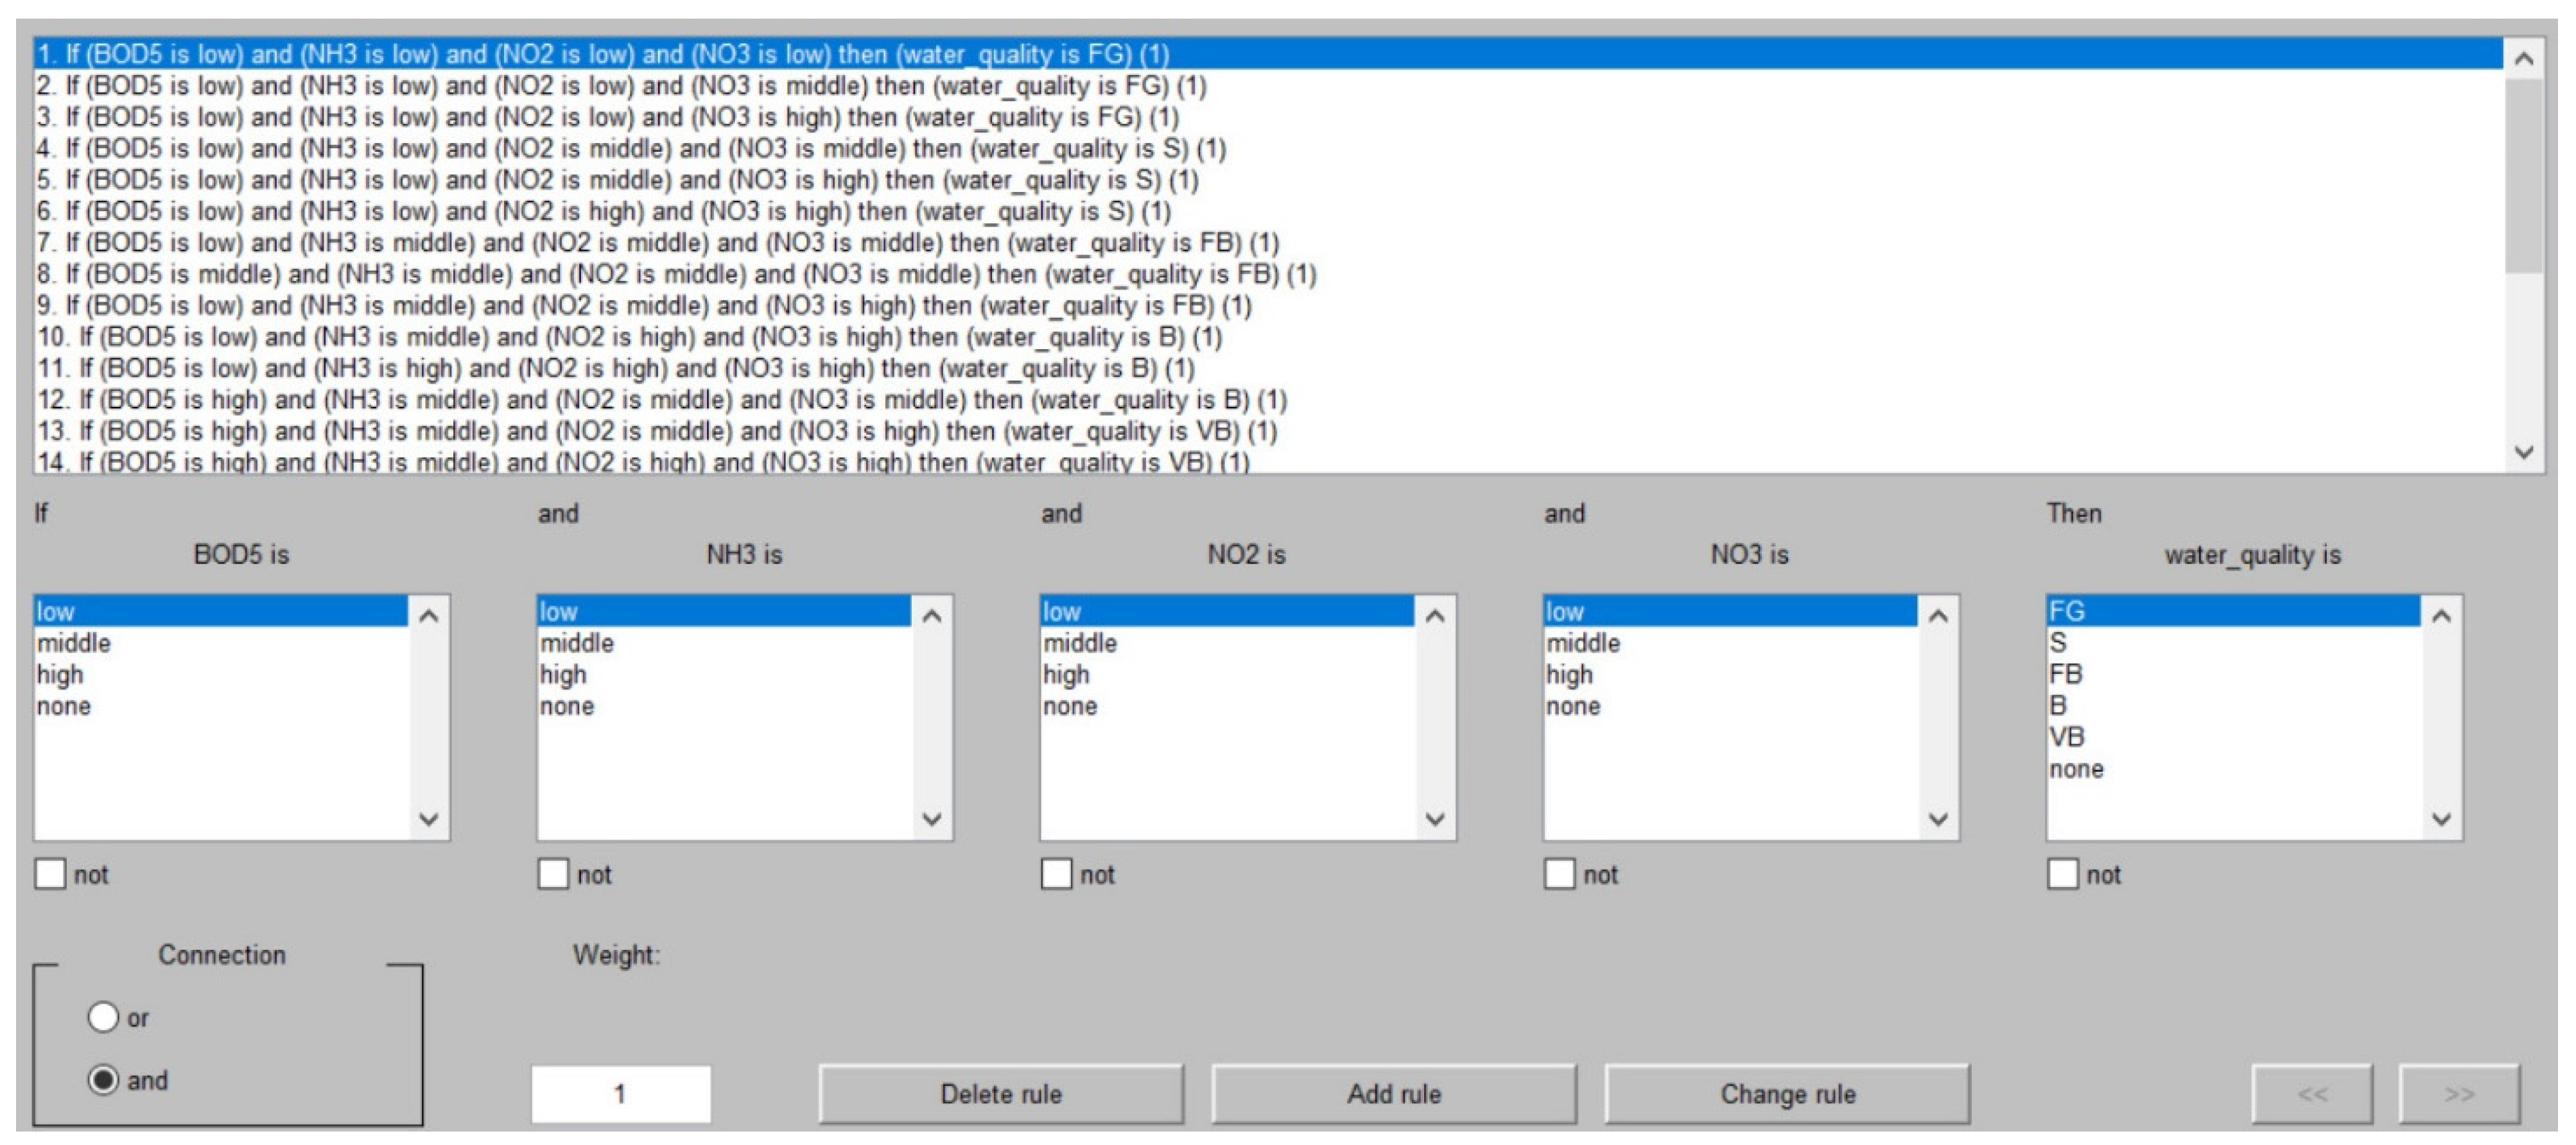
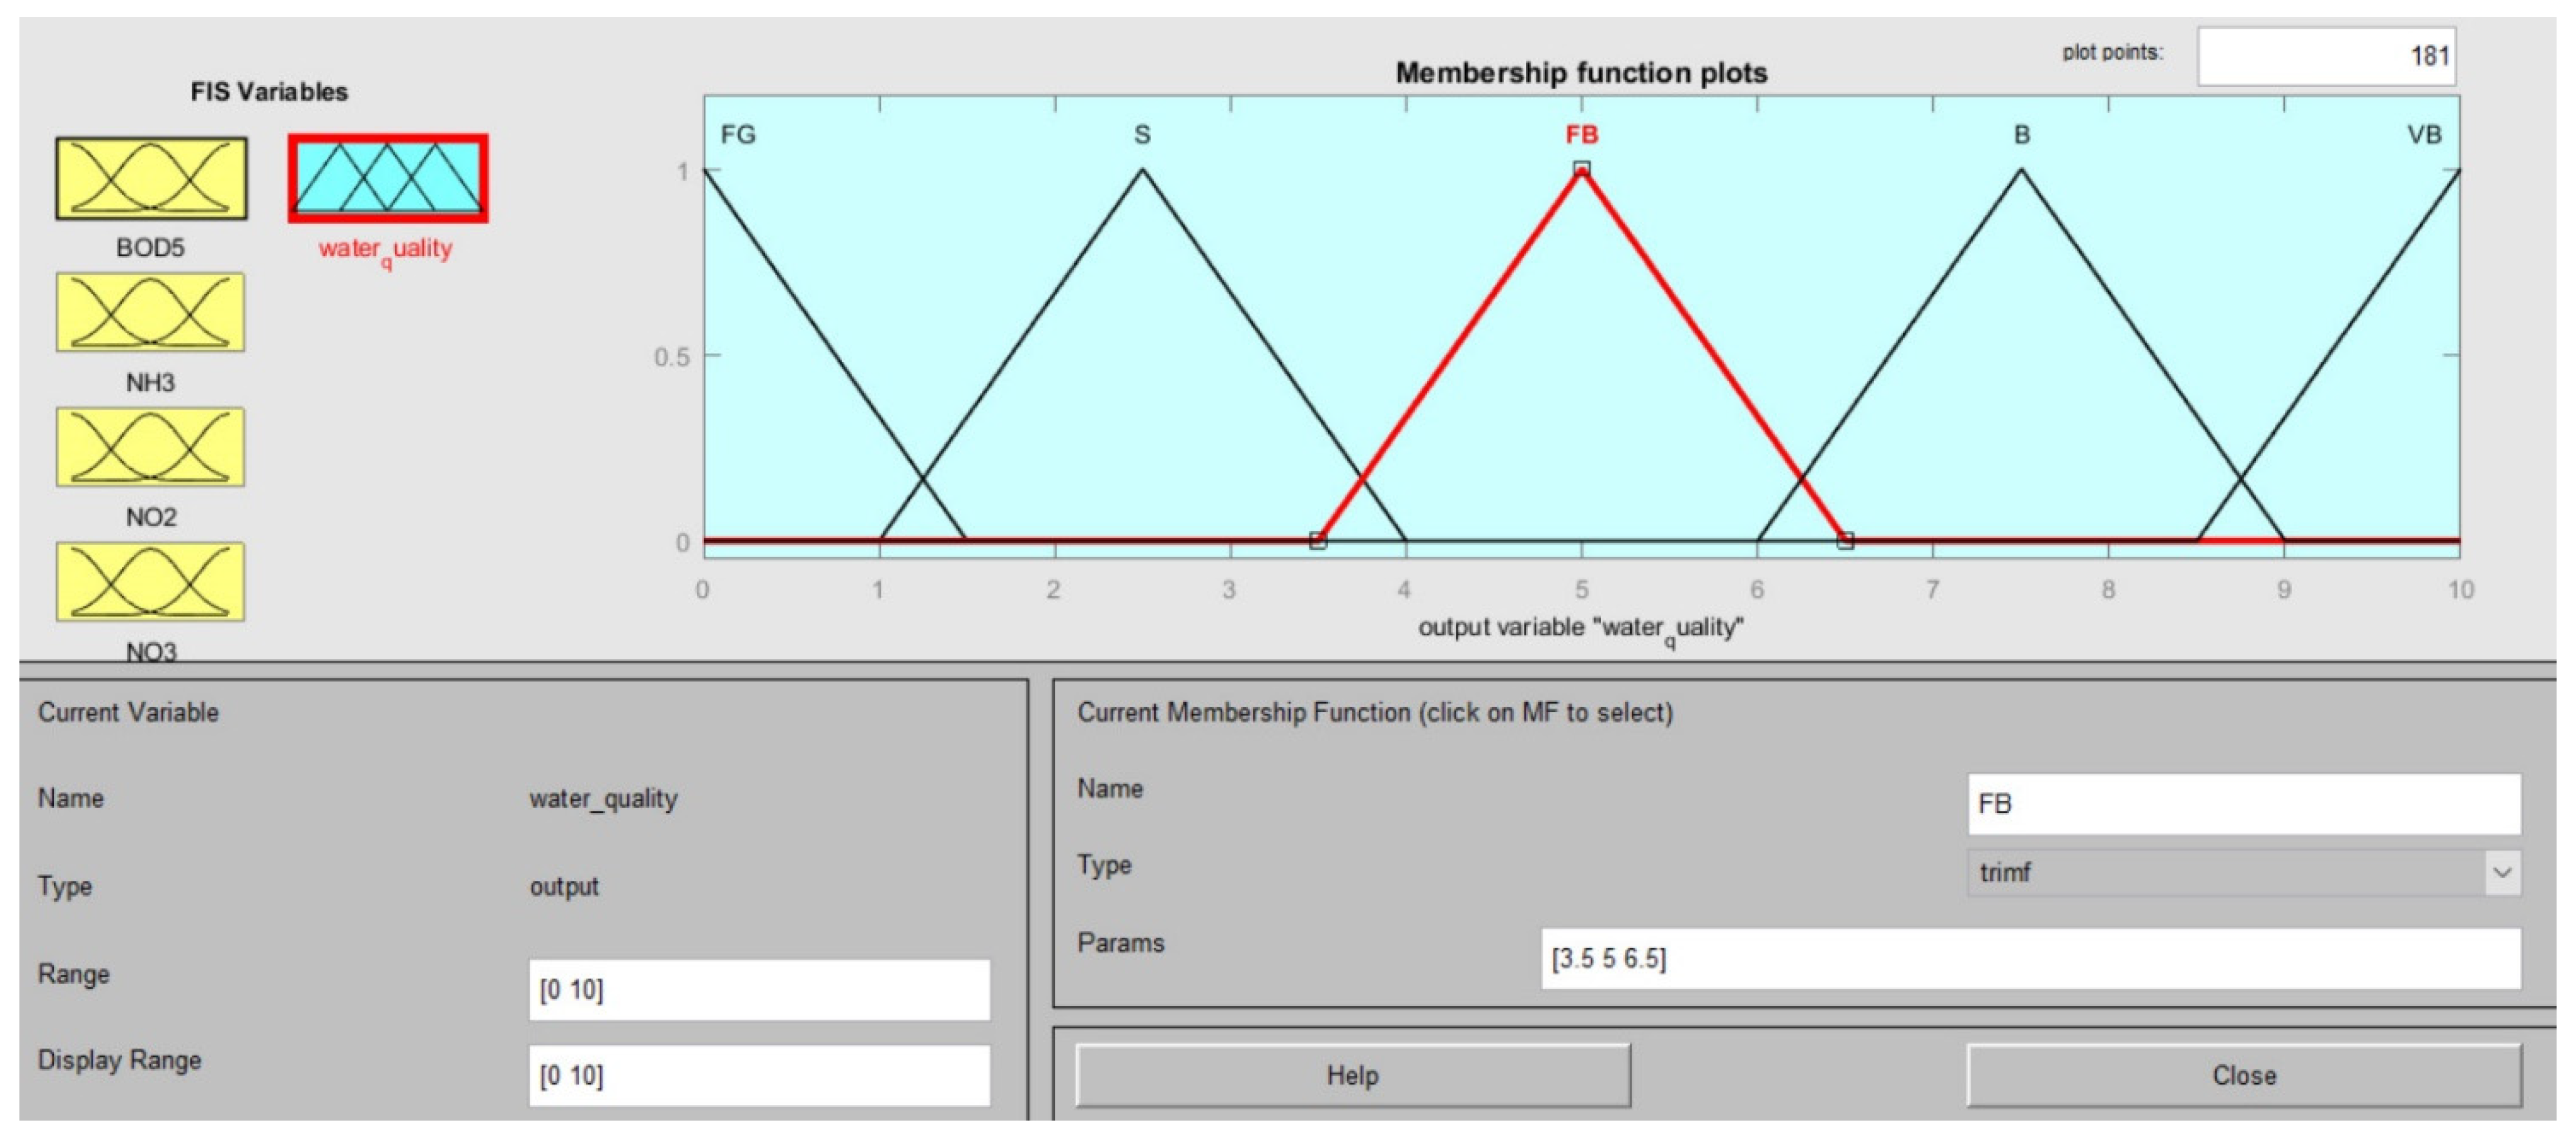
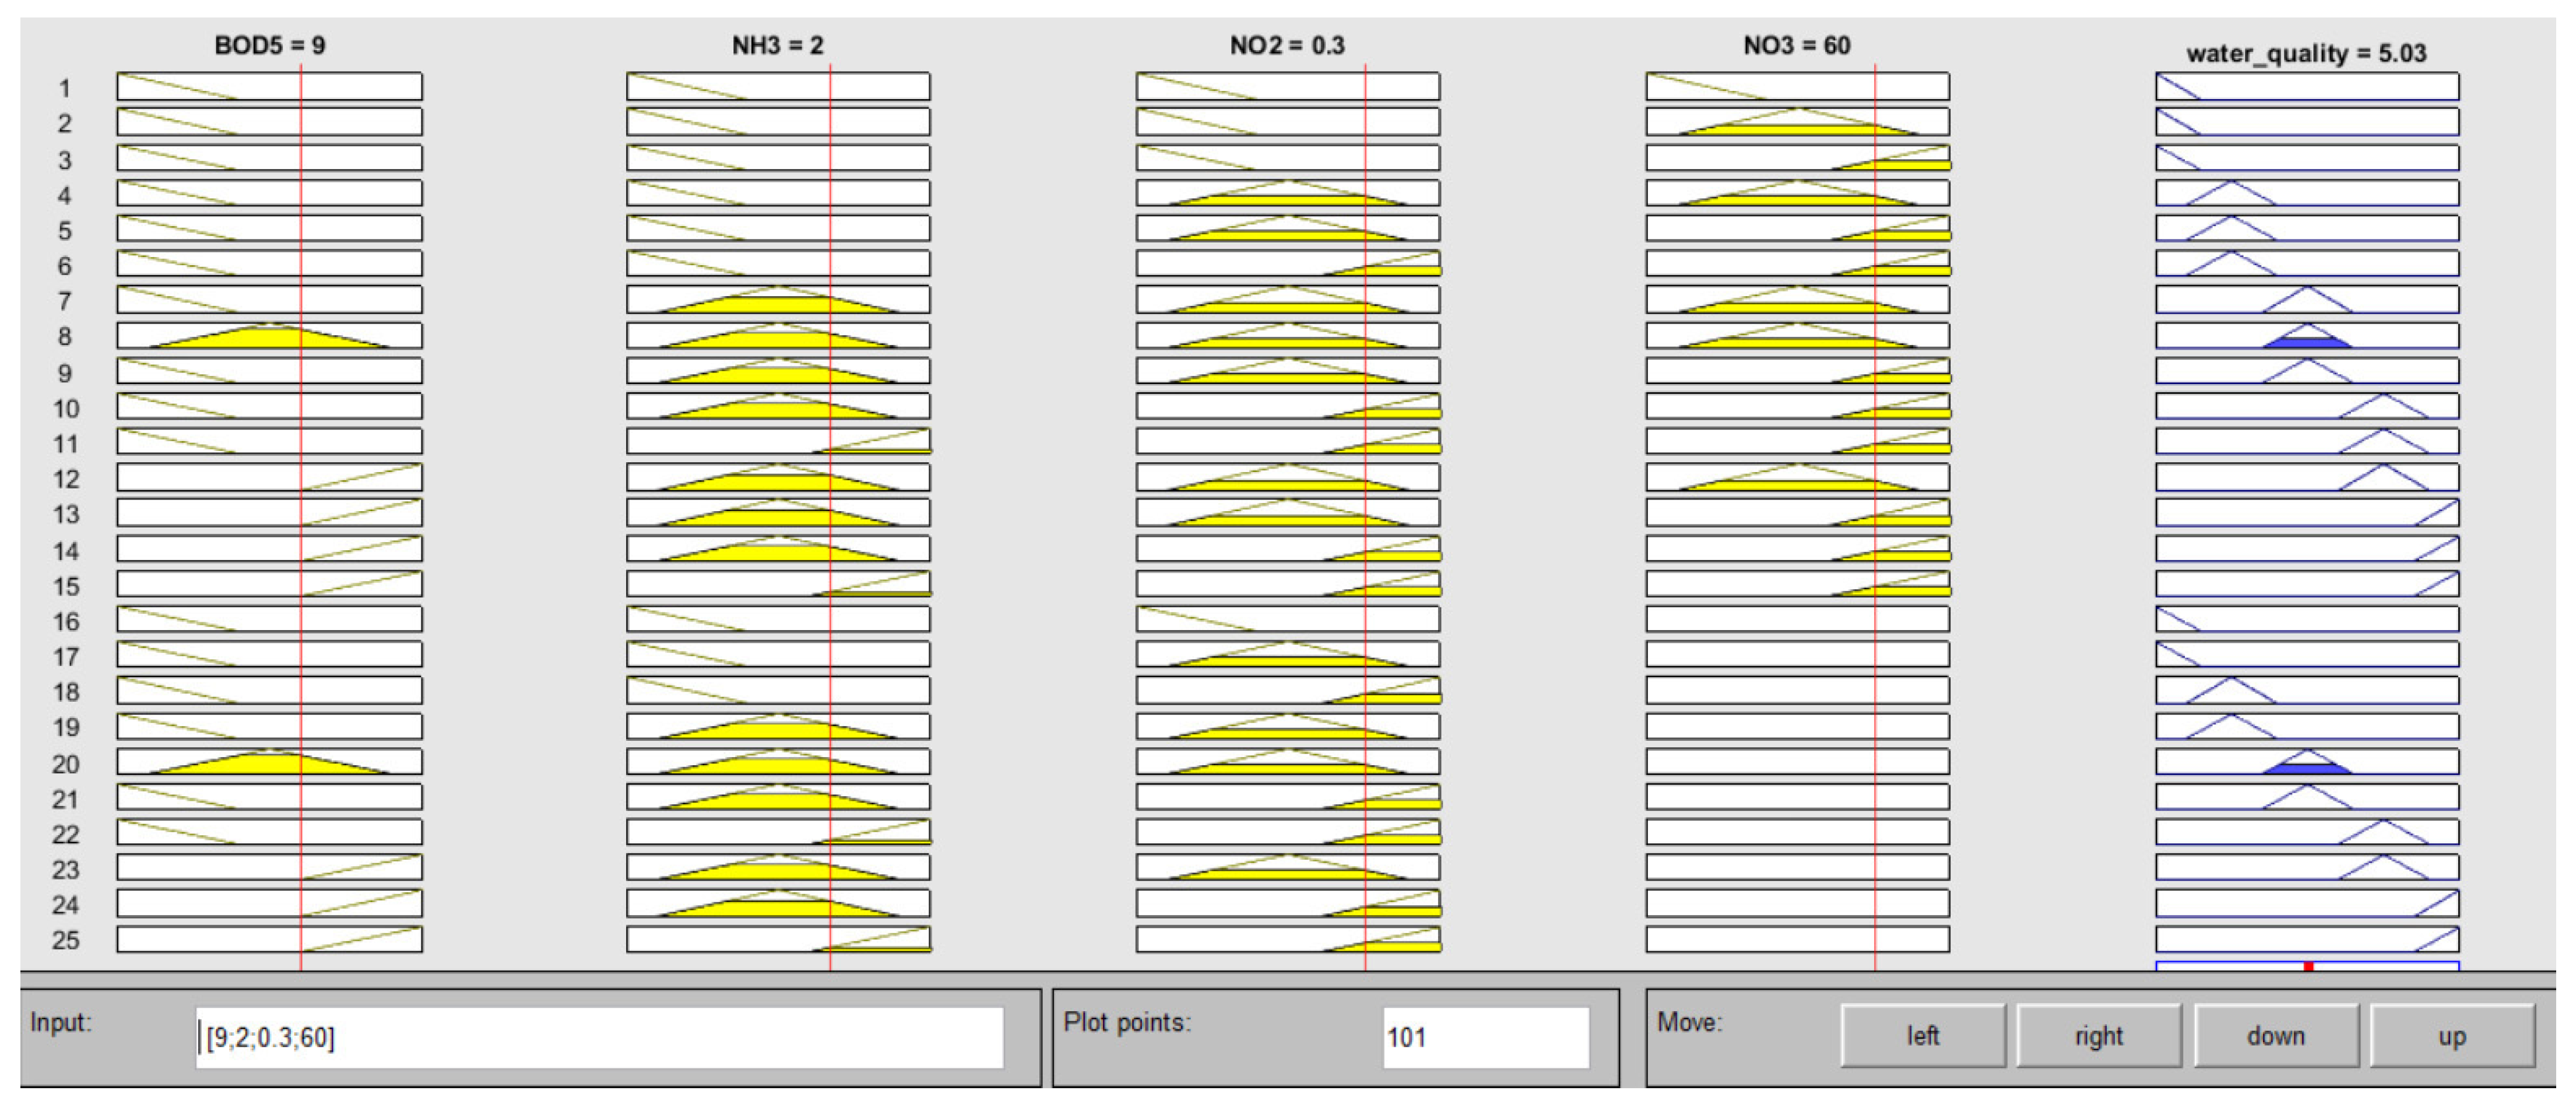
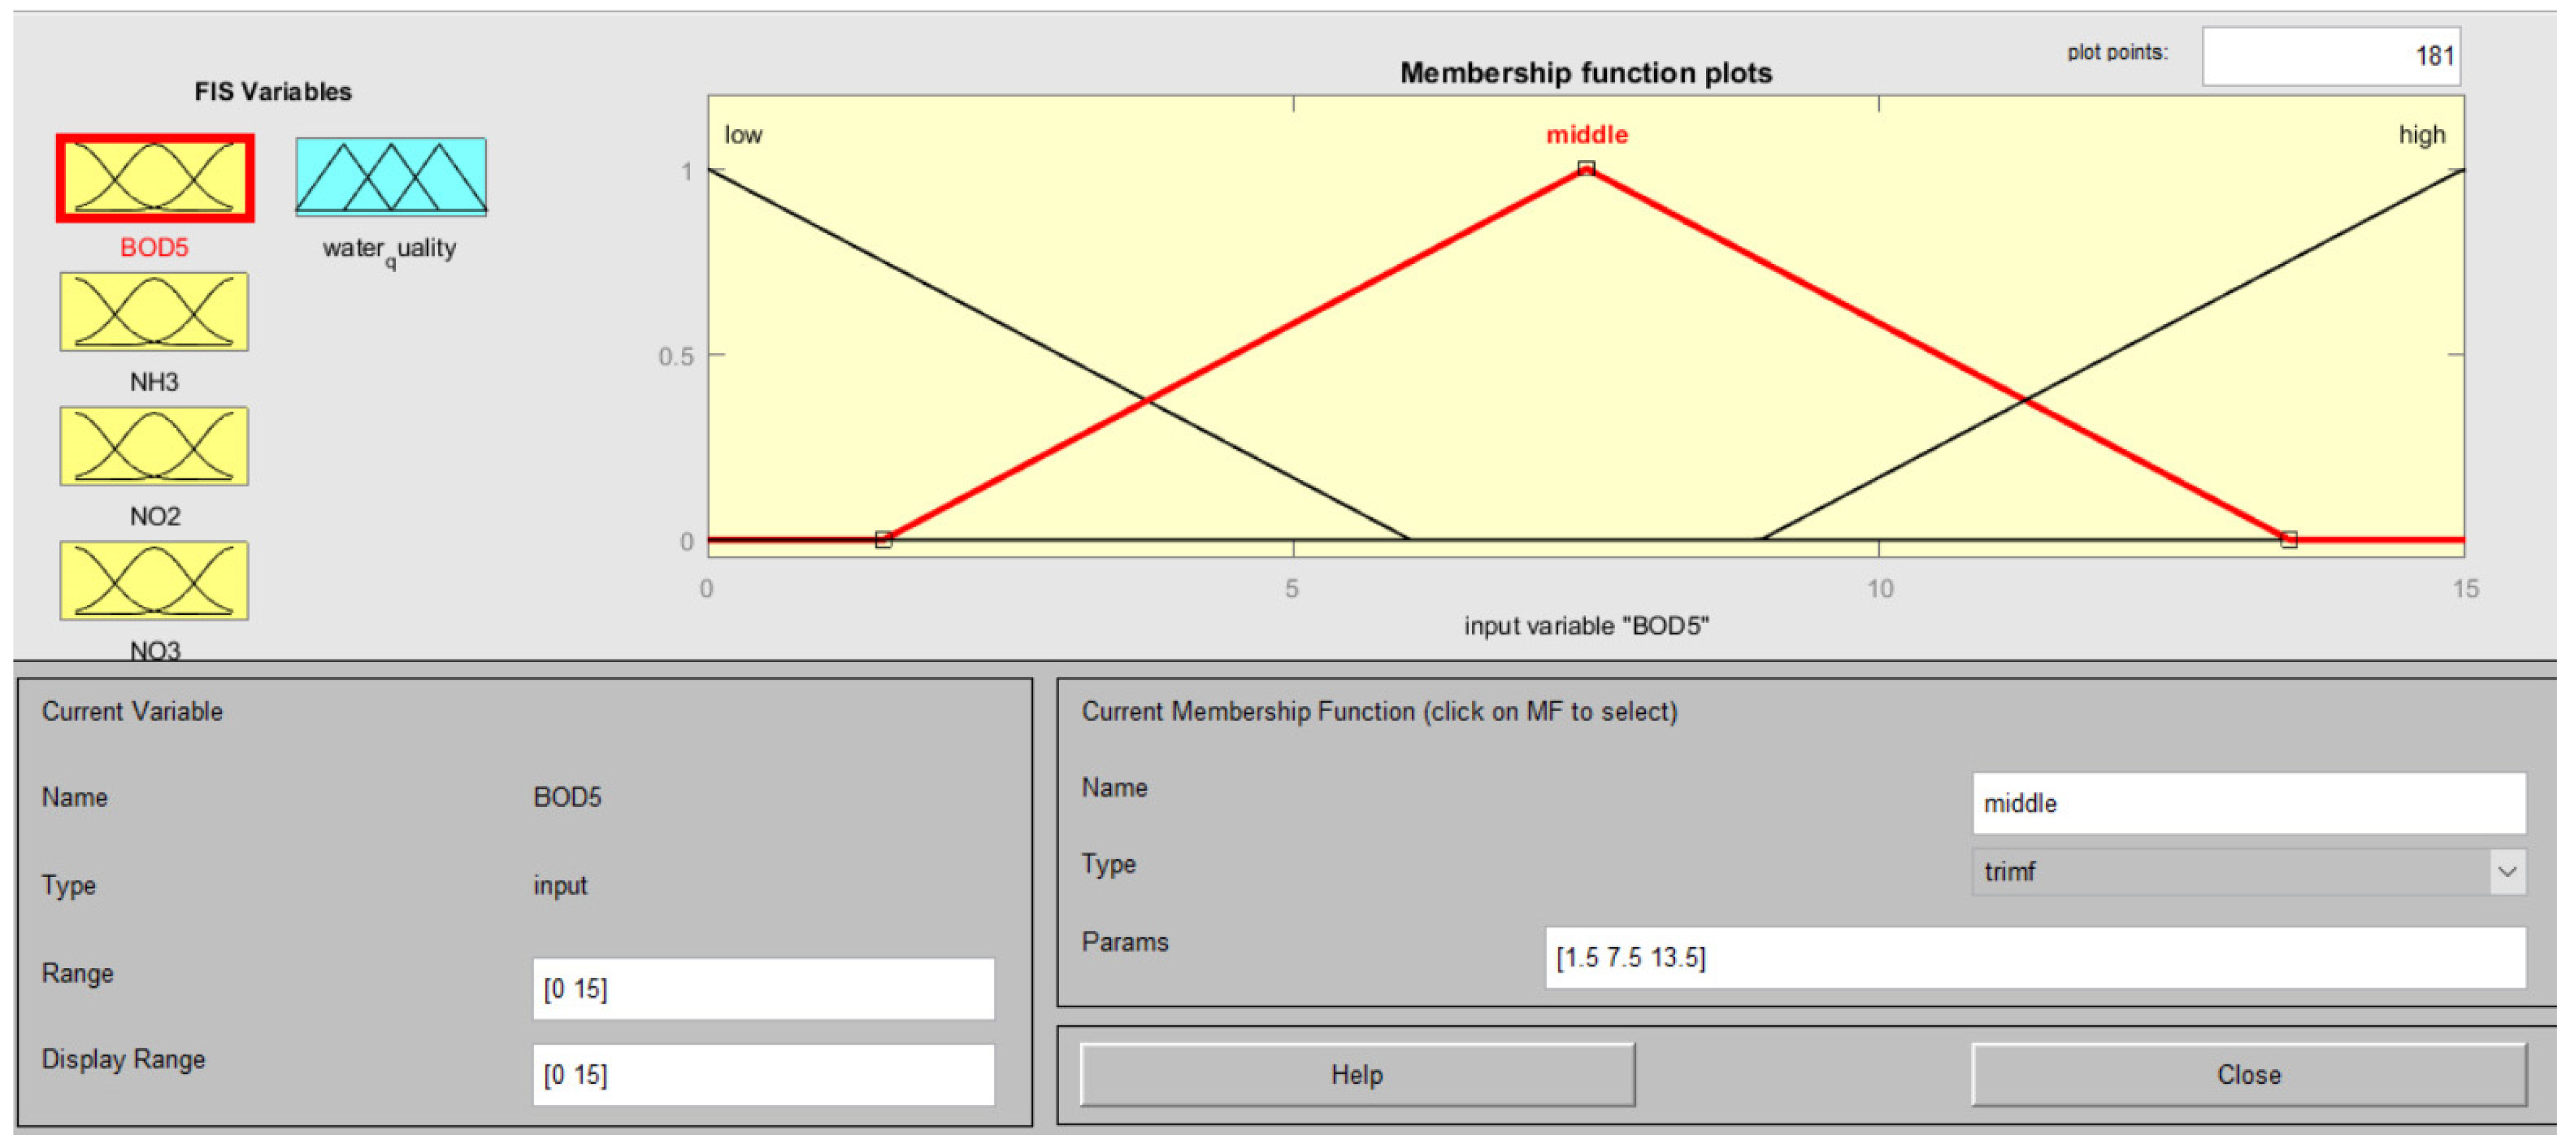
3.1. Fuzzy Logic Modeling
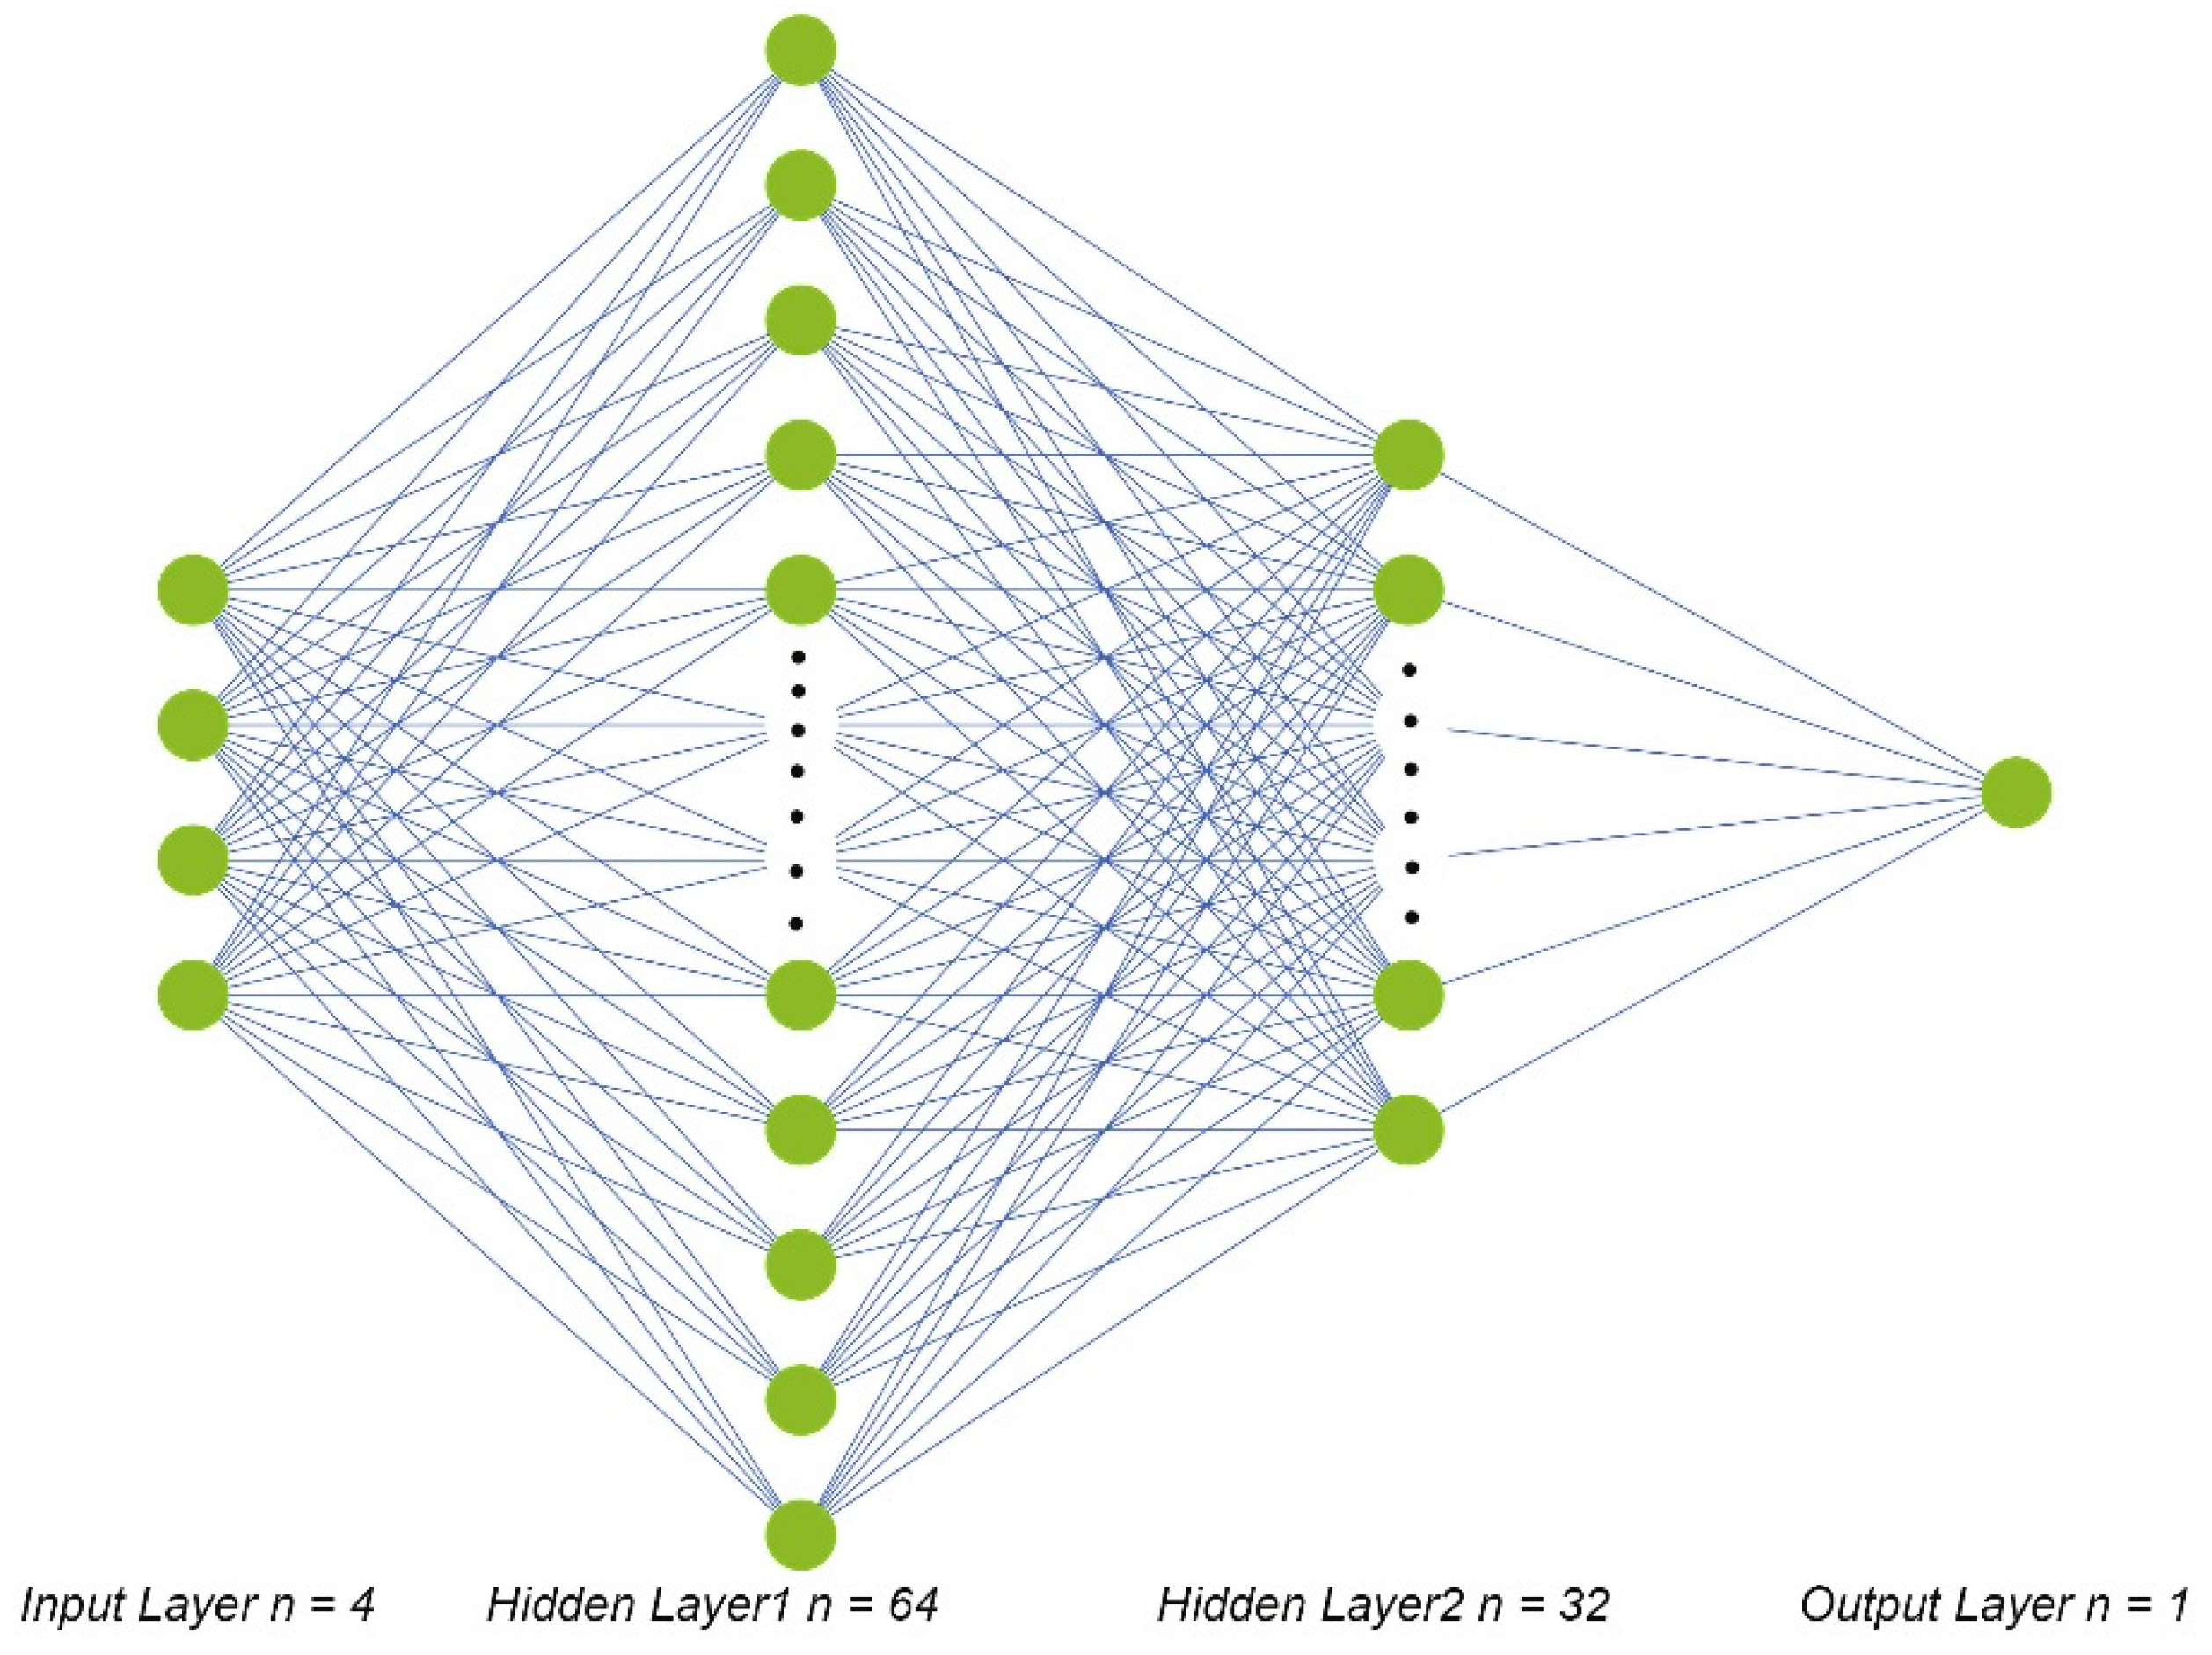
3.2. ANN Modelling
- − The input layer, which consists of four variables;
- − The first hidden layer, which has 64 neurons;
- − The second hidden layer, which has 32 neurons;
- − The output layer, which consists of a single output variable.
4. Results and Discussion
5. Conclusions
Author Contributions
Funding
Institutional Review Board Statement
Informed Consent Statement
Data Availability Statement
Conflicts of Interest
References
- World Health Organization. Guidelines for Drinking-Water Quality: Volume 1: Recommendations; World Health Organization: Geneva, Switzerland, 1993; ISBN 978-92-4-154460-3. [Google Scholar]
- Trach, Y.; Tytkowska-Owerko, M.; Reczek, L.; Michel, M. Comparison the Adsorption Capacity of Ukrainian Tuff and Basalt with Zeolite–Manganese Removal from Water Solution. J. Ecol. Eng. 2021, 22, 161–168. [Google Scholar] [CrossRef]
- Khilchevskyi, V.; Zabokrytska, M.; Sherstyuk, N. Hydrography and Hydrochemistry of the Transboundary River Western Bug on the Territory of Ukraine. J. Geol. Geogr. Geoecol. 2018, 27, 232–243. [Google Scholar] [CrossRef]
- Trach, Y. Metoda perspektywna usuwania metali ciężkich z wód podziemnych zachodniej Ukrainy. Acta Sci. Pol. Archit. Bud. 2020, 19, 85–92. [Google Scholar] [CrossRef]
- Sieczka, A.; Koda, E.; Miszkowska, A.; Osiński, P. Identification of Processes and Migration Parameters for Conservative and Reactive Contaminants in the Soil-Water Environment. In The International Congress on Environmental Geotechnics; Zhan, L., Chen, Y., Bouazza, A., Eds.; Environmental Science and Engineering; Springer: Singapore, 2019; Volume 1, pp. 551–559. ISBN 9789811322204. [Google Scholar]
- Grinberga, L.; Grabuža, D.; Grīnfelde, I.; Lauva, D.; Celms, A.; Sas, W.; Głuchowski, A.; Dzięcioł, J. Analysis of the Removal of BOD5, COD and Suspended Solids in Subsurface Flow Constructed Wetland in Latvia. Acta Sci. Polonorum. Archit. 2021, 20, 8. [Google Scholar]
- Horton, R.K. An Index Number System for Rating Water Quality. J. Water Pollut. Control Fed. 1965, 37, 300–306. [Google Scholar]
- Shwetank; Suhas; Chaudhary, J.K. A Comparative Study of Fuzzy Logic and WQI for Groundwater Quality Assessment. Procedia Comput. Sci. 2020, 171, 1194–1203. [Google Scholar] [CrossRef]
- Pandey, R.; Pattanaik, L. A Fuzzy QFD Approach to Implement Reverse Engineering in Prosthetic Socket Development. Int. J. Ind. Syst. Eng. 2014, 17, 1–14. [Google Scholar] [CrossRef]
- Rezaei, A.; Hassani, H.; Hassani, S.; Jabbari, N.; Fard Mousavi, S.B.; Rezaei, S. Evaluation of Groundwater Quality and Heavy Metal Pollution Indices in Bazman Basin, Southeastern Iran. Groundw. Sustain. Dev. 2019, 9, 100245. [Google Scholar] [CrossRef]
- Li, R.; Zou, Z.; An, Y. Water Quality Assessment in Qu River Based on Fuzzy Water Pollution Index Method. J. Environ. Sci. 2016, 50, 87–92. [Google Scholar] [CrossRef]
- Rezaei, A.; Hassani, H.; Hayati, M.; Jabbari, N.; Barzegar, R. Risk Assessment and Ranking of Heavy Metals Concentration in Iran’s Rayen Groundwater Basin Using Linear Assignment Method. Stoch Environ. Res. Risk Assess. 2018, 32, 1317–1336. [Google Scholar] [CrossRef]
- Pesce, S. Use of Water Quality Indices to Verify the Impact of Córdoba City (Argentina) on Suquía River. Water Res. 2000, 34, 2915–2926. [Google Scholar] [CrossRef]
- Jha, M.K.; Shekhar, A.; Jenifer, M.A. Assessing Groundwater Quality for Drinking Water Supply Using Hybrid Fuzzy-GIS-Based Water Quality Index. Water Res. 2020, 179, 115867. [Google Scholar] [CrossRef] [PubMed]
- Scholten, H.; Kassahun, A.; Refsgaard, J.C.; Kargas, T.; Gavardinas, C.; Beulens, A.J.M. A Methodology to Support Multidisciplinary Model-Based Water Management. Environ. Model. Softw. 2007, 22, 743–759. [Google Scholar] [CrossRef]
- Goguen, J.A. L. A. Zadeh. Fuzzy Sets. Information and Control, Vol. 8 (1965), pp. 338–353. - L. A. Zadeh. Similarity Relations and Fuzzy Orderings. Information Sciences, Vol. 3 (1971), pp. 177–200. J. Symb. Log. 1973, 38, 656–657. [Google Scholar] [CrossRef]
- Ellina, G.; Papaschinopoulos, G.; Papadopoulos, B.K. Research of Fuzzy Implications via Fuzzy Linear Regression in a Eutrophic Waterbody. In AIP Conference Proceedings; AIP Publishing LLC: Thessaloniki, Greece, 2018; p. 290007. [Google Scholar]
- Leśniak, A.; Kubek, D.; Plebankiewicz, E.; Zima, K.; Belniak, S. Fuzzy AHP Application for Supporting Contractors’ Bidding Decision. Symmetry 2018, 10, 642. [Google Scholar] [CrossRef] [Green Version]
- Nagels, J.W.; Davies-Colley, R.J.; Smith, D.G. A Water Quality Index for Contact Recreation in New Zealand. Water Sci. Technol. 2001, 43, 285–292. [Google Scholar] [CrossRef]
- McKone, T.E.; Deshpande, A.W. Can Fuzzy Logic Bring Complex Environmental Problems into Focus? Environ. Sci. Technol. 2005, 39, 42A–47A. [Google Scholar] [CrossRef] [Green Version]
- Gharibi, H.; Sowlat, M.H.; Mahvi, A.H.; Mahmoudzadeh, H.; Arabalibeik, H.; Keshavarz, M.; Karimzadeh, N.; Hassani, G. Development of a Dairy Cattle Drinking Water Quality Index (DCWQI) Based on Fuzzy Inference Systems. Ecol. Indic. 2012, 20, 228–237. [Google Scholar] [CrossRef]
- Lermontov, A.; Yokoyama, L.; Lermontov, M.; Machado, M.A.S. River Quality Analysis Using Fuzzy Water Quality Index: Ribeira Do Iguape River Watershed, Brazil. Ecol. Indic. 2009, 9, 1188–1197. [Google Scholar] [CrossRef]
- Kachroud, M.; Trolard, F.; Kefi, M.; Jebari, S.; Bourrié, G. Water Quality Indices: Challenges and Application Limits in the Literature. Water 2019, 11, 361. [Google Scholar] [CrossRef] [Green Version]
- Caniani, D.; Lioi, D.S.; Mancini, I.M.; Masi, S. Hierarchical Classification of Groundwater Pollution Risk of Contaminated Sites Using Fuzzy Logic: A Case Study in the Basilicata Region (Italy). Water 2015, 7, 2013–2036. [Google Scholar] [CrossRef] [Green Version]
- Yang, H.; Chen, Z.; Ye, Y.; Chen, G.; Zeng, F.; Zhao, C. A Fuzzy Logic Model for Early Warning of Algal Blooms in a Tidal-Influenced River. Water 2021, 13, 3118. [Google Scholar] [CrossRef]
- Hajji, S.; Yahyaoui, N.; Bousnina, S.; Ben Brahim, F.; Allouche, N.; Faiedh, H.; Bouri, S.; Hachicha, W.; Aljuaid, A.M. Using a Mamdani Fuzzy Inference System Model (MFISM) for Ranking Groundwater Quality in an Agri-Environmental Context: Case of the Hammamet-Nabeul Shallow Aquifer (Tunisia). Water 2021, 13, 2507. [Google Scholar] [CrossRef]
- Won Seo, I.; Yun, S.H.; Choi, S.Y. Forecasting Water Quality Parameters by ANN Model Using Pre-Processing Technique at the Downstream of Cheongpyeong Dam. Procedia Eng. 2016, 154, 1110–1115. [Google Scholar] [CrossRef] [Green Version]
- Trach, R.; Pawluk, K.; Lendo-Siwicka, M. The Assessment of the Effect of BIM and IPD on Construction Projects in Ukraine. Int. J. Constr. Manag. 2020, 1–8. [Google Scholar] [CrossRef]
- Zhang, G.; Eddy Patuwo, B.; Hu, M.Y. Forecasting with Artificial Neural Networks: The state of the art. Int. J. Forecast. 1998, 14, 35–62. [Google Scholar] [CrossRef]
- Li, L.; Jiang, P.; Xu, H.; Lin, G.; Guo, D.; Wu, H. Water Quality Prediction Based on Recurrent Neural Network and Improved Evidence Theory: A Case Study of Qiantang River, China. Environ. Sci. Pollut. Res. 2019, 26, 19879–19896. [Google Scholar] [CrossRef] [PubMed]
- Zare, A.H.; Bayat, V.M.; Daneshkare, A.P. Forecasting Nitrate Concentration in Groundwater Using Artificial Neural Network and Linear Regression Models. Int. Agrophys. 2011, 25, 187–192. [Google Scholar]
- Trach, R.; Lendo-Siwicka, M. Centrality of a Communication Network of Construction Project Participants and Implications for Improved Project Communication. Civ. Eng. Environ. Syst. 2021, 38, 145–160. [Google Scholar] [CrossRef]
- Elhatip, H.; Kömür, M.A. Evaluation of Water Quality Parameters for the Mamasin Dam in Aksaray City in the Central Anatolian Part of Turkey by Means of Artificial Neural Networks. Environ. Geol. 2008, 53, 1157–1164. [Google Scholar] [CrossRef]
- Chen, Y.; Song, L.; Liu, Y.; Yang, L.; Li, D. A Review of the Artificial Neural Network Models for Water Quality Prediction. Appl. Sci. 2020, 10, 5776. [Google Scholar] [CrossRef]
- Palani, S.; Liong, S.-Y.; Tkalich, P. An ANN Application for Water Quality Forecasting. Mar. Pollut. Bull. 2008, 56, 1586–1597. [Google Scholar] [CrossRef] [PubMed]
- Wang, T.-S.; Tan, C.-H.; Chen, L.; Tsai, Y.-C. Applying Artificial Neural Networks and Remote Sensing to Estimate Chlorophyll-a Concentration in Water Body. In Proceedings of the 2008 Second International Symposium on Intelligent Information Technology Application, Shanghai, China, 20–22 December 2008; pp. 540–544. [Google Scholar]
- Miao, Q.; Yuan, H.; Shao, C.; Liu, Z. Water Quality Prediction of Moshui River in China Based on BP Neural Network. In Proceedings of the 2009 International Conference on Computational Intelligence and Natural Computing, Wuhan, China, 6–7 June 2009; pp. 7–10. [Google Scholar]
- Singh, S.; Kanli, A.I.; Sevgen, S. A General Approach for Porosity Estimation Using Artificial Neural Network Method: A Case Study from Kansas Gas Field. Studia Geophys. Geod. 2016, 60, 130–140. [Google Scholar] [CrossRef]
- Chen, D.; Lu, J.; Shen, Y. Artificial Neural Network Modelling of Concentrations of Nitrogen, Phosphorus and Dissolved Oxygen in a Non-Point Source Polluted River in Zhejiang Province, Southeast China. Hydrol. Process. 2010, 24, 290–299. [Google Scholar] [CrossRef]
- Markus, M.; Hejazi, M.I.; Bajcsy, P.; Giustolisi, O.; Savic, D.A. Prediction of Weekly Nitrate-N Fluctuations in a Small Agricultural Watershed in Illinois. J. Hydroinform. 2010, 12, 251–261. [Google Scholar] [CrossRef]
- Al-Mahallawi, K.; Mania, J.; Hani, A.; Shahrour, I. Using of Neural Networks for the Prediction of Nitrate Groundwater Contamination in Rural and Agricultural Areas. Environ. Earth Sci. 2012, 65, 917–928. [Google Scholar] [CrossRef]
- Ay, M.; Kisi, O. Modeling of Dissolved Oxygen Concentration Using Different Neural Network Techniques in Foundation Creek, El Paso County, Colorado. J. Environ. Eng. 2012, 138, 654–662. [Google Scholar] [CrossRef]
- Baek, G.; Cheon, S.-P.; Kim, S.; Kim, Y.; Kim, H.; Kim, C.; Kim, S. Modular Neural Networks Prediction Model Based A2/O Process Control System. Int. J. Precis. Eng. Manuf. 2012, 13, 905–913. [Google Scholar] [CrossRef]
- Chen, W.-B.; Liu, W.-C. Artificial Neural Network Modeling of Dissolved Oxygen in Reservoir. Environ. Monit. Assess. 2014, 186, 1203–1217. [Google Scholar] [CrossRef]
- Han, H.-G.; Qiao, J.-F.; Chen, Q.-L. Model Predictive Control of Dissolved Oxygen Concentration Based on a Self-Organizing RBF Neural Network. Control Eng. Pract. 2012, 20, 465–476. [Google Scholar] [CrossRef]
- Ta, X.; Wei, Y. Research on a Dissolved Oxygen Prediction Method for Recirculating Aquaculture Systems Based on a Convolution Neural Network. Comput. Electron. Agric. 2018, 145, 302–310. [Google Scholar] [CrossRef]
- Bug (River). Available online: https://en.wikipedia.org/wiki/Bug_(river) (accessed on 30 April 2022).
- Methodology for the Ecological Assessment of the Quality of Surface Waters for the Relevant Categories; Ukrainian Scientific Research Institute of Environmental Problems: Kharkiv, Ukraine, 1998.
- The State Agency for Water Resources of Ukraine. Public Reports. Monitoring Data (by the Area of the River Basin or Sub-Basin). Available online: http://monitoring.davr.gov.ua/Reporting/ViewReports/ViewReport?id=393 (accessed on 4 March 2022).
- Raman, B.V.; Bouwmeester, R.; Mohan, S. Fuzzy Logic Water Quality Index and Importance of Water Quality Parameters. Air Soil Water Res. 2009, 2, ASWR.S2156. [Google Scholar] [CrossRef]
- Semiromi, F.B.; Hassani, A.H.; Torabian, A.; Karbassi, A.R.; Lotfi, F.H. Water Quality Index Development Using Fuzzy Logic: A Case Study of the Karoon River of Iran. Afr. J. Biotechnol. 2011, 10, 10125–10133. [Google Scholar] [CrossRef]
- Tiri, A.; Belkhiri, L.; Mouni, L. Evaluation of Surface Water Quality for Drinking Purposes Using Fuzzy Inference System. Groundw. Sustain. Dev. 2018, 6, 235–244. [Google Scholar] [CrossRef]
- Oladipo, J.O.; Aboyeji, O.S.; Akinwumiju, A.S.; Adelodun, A.A. Fuzzy Logic Interference for Characterization of Surface Water Potability in Ikare Rural Community, Nigeria. J. Geovisualization Spat. Anal. 2020, 4, 1–14. [Google Scholar] [CrossRef]
- Esmeralda, V.-V.M.; Juan, C.-H.J.; Pastor, S.-F.L.; Luis, V.-B.J.; Antonio, T.-B.J. Weighted Fuzzy Inference System for Water Quality Management of Chirostoma Estor Estor Culture. Aquac. Rep. 2020, 18, 100487. [Google Scholar]
- Ross, T. Fuzzy Logic with Engineering Applications, 3rd ed.; Wiley: Hoboken, NJ, USA, 2010; Available online: https://www.wiley.com/en-us/Fuzzy+Logic+with+Engineering+Applications%2C+3rd+Edition-p-9780470743768 (accessed on 4 March 2022).
- Trach, Y.; Trach, R.; Kalenik, M.; Koda, E.; Podlasek, A. A Study of Dispersed, Thermally Activated Limestone from Ukraine for the Safe Liming of Water Using ANN Models. Energies 2021, 14, 8377. [Google Scholar] [CrossRef]
- Lesniak, A.; Plebankiewicz, E.; Zima, K. Design and Build Procurement System—Contractor Selection. Arch. Civ. Eng. 2012, 58, 463–476. [Google Scholar] [CrossRef]
- Juszczyk, M.; Zima, K.; Lelek, W. Forecasting of Sports Fields Construction Costs Aided by Ensembles of Neural Networks. J. Civ. Eng. Manag. 2019, 25, 715–729. [Google Scholar] [CrossRef] [Green Version]
- Trach, R.; Trach, Y.; Lendo-Siwicka, M. Using ANN to Predict the Impact of Communication Factors on the Rework Cost in Construction Projects. Energies 2021, 14, 4376. [Google Scholar] [CrossRef]
- Drozd, W.; Leśniak, A. Ecological Wall Systems as an Element of Sustainable Development—Cost Issues. Sustainability 2018, 10, 2234. [Google Scholar] [CrossRef] [Green Version]
- Trach, R.; Lendo-Siwicka, M.; Pawluk, K.; Bilous, N. Assessment of the Effect of Integration Realisation in Construction Projects. Teh. Glas. 2019, 13, 254–259. [Google Scholar] [CrossRef]
- US EPA. Test Methods for Evaluating Solid Waste. In Physical/Chemical Methods; EPA: Cincinnati, OH, USA, 1986. [Google Scholar]
- Tolonen, E.-T.; Sarpola, A.; Hu, T.; Rämö, J.; Lassi, U. Acid Mine Drainage Treatment Using By-Products from Quicklime Manufacturing as Neutralization Chemicals. Chemosphere 2014, 117, 419–424. [Google Scholar] [CrossRef] [PubMed]
- Küsel, K.; Roth, U.; Trinkwalter, T.; Peiffer, S. Effect of PH on the Anaerobic Microbial Cycling of Sulfur in Mining-Impacted Freshwater Lake Sediments. Environ. Exp. Bot. 2001, 46, 213. [Google Scholar] [CrossRef]
- Trach, Y.; Melnychuk, V.; Melnychuk, G.; Mazur, Ł.; Podlasek, A.; Vaverková, M.; Koda, E. Using Local Mineral Materials for the Rehabilitation of the Ustya River—A Case Study. Desalination Water Treat. 2021, 232, 346–356. [Google Scholar] [CrossRef]
- Elkiran, G.; Nourani, V.; Abba, S.I. Multi-Step Ahead Modelling of River Water Quality Parameters Using Ensemble Artificial Intelligence-Based Approach. J. Hydrol. 2019, 577, 123962. [Google Scholar] [CrossRef]
- Najah, A.; El-Shafie, A.; Karim, O.A.; El-Shafie, A.H. Performance of ANFIS versus MLP-NN Dissolved Oxygen Prediction Models in Water Quality Monitoring. Environ. Sci. Pollut. Res. 2014, 21, 1658–1670. [Google Scholar] [CrossRef]
- Huang, M.; Zhang, T.; Ruan, J.; Chen, X. A New Efficient Hybrid Intelligent Model for Biodegradation Process of DMP with Fuzzy Wavelet Neural Networks. Sci. Rep. 2017, 7, 41239. [Google Scholar] [CrossRef] [Green Version]
- Hu, Z.; Zhang, Y.; Zhao, Y.; Xie, M.; Zhong, J.; Tu, Z.; Liu, J. A Water Quality Prediction Method Based on the Deep LSTM Network Considering Correlation in Smart Mariculture. Sensors 2019, 19, 1420. [Google Scholar] [CrossRef] [Green Version]
- Ding, Y.R.; Cai, Y.J.; Sun, P.D.; Chen, B. The Use of Combined Neural Networks and Genetic Algorithms for Prediction of River Water Quality. J. Appl. Res. Technol. 2014, 12, 493–499. [Google Scholar] [CrossRef]
- Yesilnacar, M.I.; Sahinkaya, E.; Naz, M.; Ozkaya, B. Neural Network Prediction of Nitrate in Groundwater of Harran Plain, Turkey. Environ. Geol. 2008, 56, 19–25. [Google Scholar] [CrossRef]
- Antanasijević, D.; Pocajt, V.; Povrenović, D.; Perić-Grujić, A.; Ristić, M. Modelling of Dissolved Oxygen Content Using Artificial Neural Networks: Danube River, North Serbia, Case Study. Environ. Sci. Pollut. Res. 2013, 20, 9006–9013. [Google Scholar] [CrossRef] [PubMed]
- Alqahtani, A.; Shah, M.I.; Aldrees, A.; Javed, M.F. Comparative Assessment of Individual and Ensemble Machine Learning Models for Efficient Analysis of River Water Quality. Sustainability 2022, 14, 1183. [Google Scholar] [CrossRef]
- Akıner, M.E.; Akıner, İ. Water Quality Analysis of Drinking Water Resource Lake Sapanca and Suggestions for the Solution of the Pollution Problem in the Context of Sustainable Environment Approach. Sustainability 2021, 13, 3917. [Google Scholar] [CrossRef]
- Shah, M.I.; Alaloul, W.S.; Alqahtani, A.; Aldrees, A.; Musarat, M.A.; Javed, M.F. Predictive Modeling Approach for Surface Water Quality: Development and Comparison of Machine Learning Models. Sustainability 2021, 13, 7515. [Google Scholar] [CrossRef]
- Kulisz, M.; Kujawska, J.; Przysucha, B.; Cel, W. Forecasting Water Quality Index in Groundwater Using Artificial Neural Network. Energies 2021, 14, 5875. [Google Scholar] [CrossRef]


| Indicator | Actual Value | MCL |
|---|---|---|
| Biochemical oxygen consumption in 5 days (BOD5), mgO/dm3 | 2.3 | 3 |
| Suspended substances (SS), mg/dm3 | 22 | 15 |
| Dissolved oxygen (DO), mgO2/dm3 | 8.5 | 4 |
| Sulfate ions (SO42−), mg/dm3 | 52 | 100 |
| Chloride ions (Cl−), mg/dm3 | 19 | 300 |
| Ammonium ions (NH3), mg/dm3 | 0.18 | 0.5 |
| Nitrate ions (NO3−), mg/dm3 | 0.11 | 40 |
| Nitrite ions (NO2−), mg/dm3 | 0.016 | 0.08 |
| Phosphate ions (PO43−), mg/dm3 | 0.046 | - |
| BOD5 | NH3 | NO2 | NO3 | WQI |
|---|---|---|---|---|
| low | low | middle | middle | fairly good |
| low | low | middle | high | satisfactory |
| low | middle | middle | middle | fairly bad |
| high | high | middle | low | bad |
| high | middle | middle | high | very bad |
| Parameters | Models | |||||||||||||||||
|---|---|---|---|---|---|---|---|---|---|---|---|---|---|---|---|---|---|---|
| ANN 1 | ANN 2 | ANN 3 | ANN 4 | ANN 5 | ANN 6 | |||||||||||||
| activator | Sigmoid | Sigmoid | ReLU | ReLU | softmax | softmax | ||||||||||||
| optimizer | Adam | SGD | Adam | SGD | Adam | SGD | ||||||||||||
| epochs | 20 | 50 | 100 | 20 | 50 | 100 | 20 | 50 | 100 | 20 | 50 | 100 | 20 | 50 | 100 | 20 | 50 | 100 |
| R2 | 0.872 | 0.919 | 0.944 | 0.830 | 0.896 | 0.937 | 0.396 | 0.553 | 0.348 | 0.355 | 0.302 | 0.398 | 0.898 | 0.933 | 0.964 | 0.833 | 0.911 | 0.916 |
| MAPE, % | 15.8 | 12.5 | 10.8 | 16.6 | 14.0 | 11.1 | 17.8 | 14.1 | 14.4 | 16.5 | 14.7 | 13.8 | 13.6 | 11.2 | 9.6 | 15.1 | 13.8 | 13.2 |
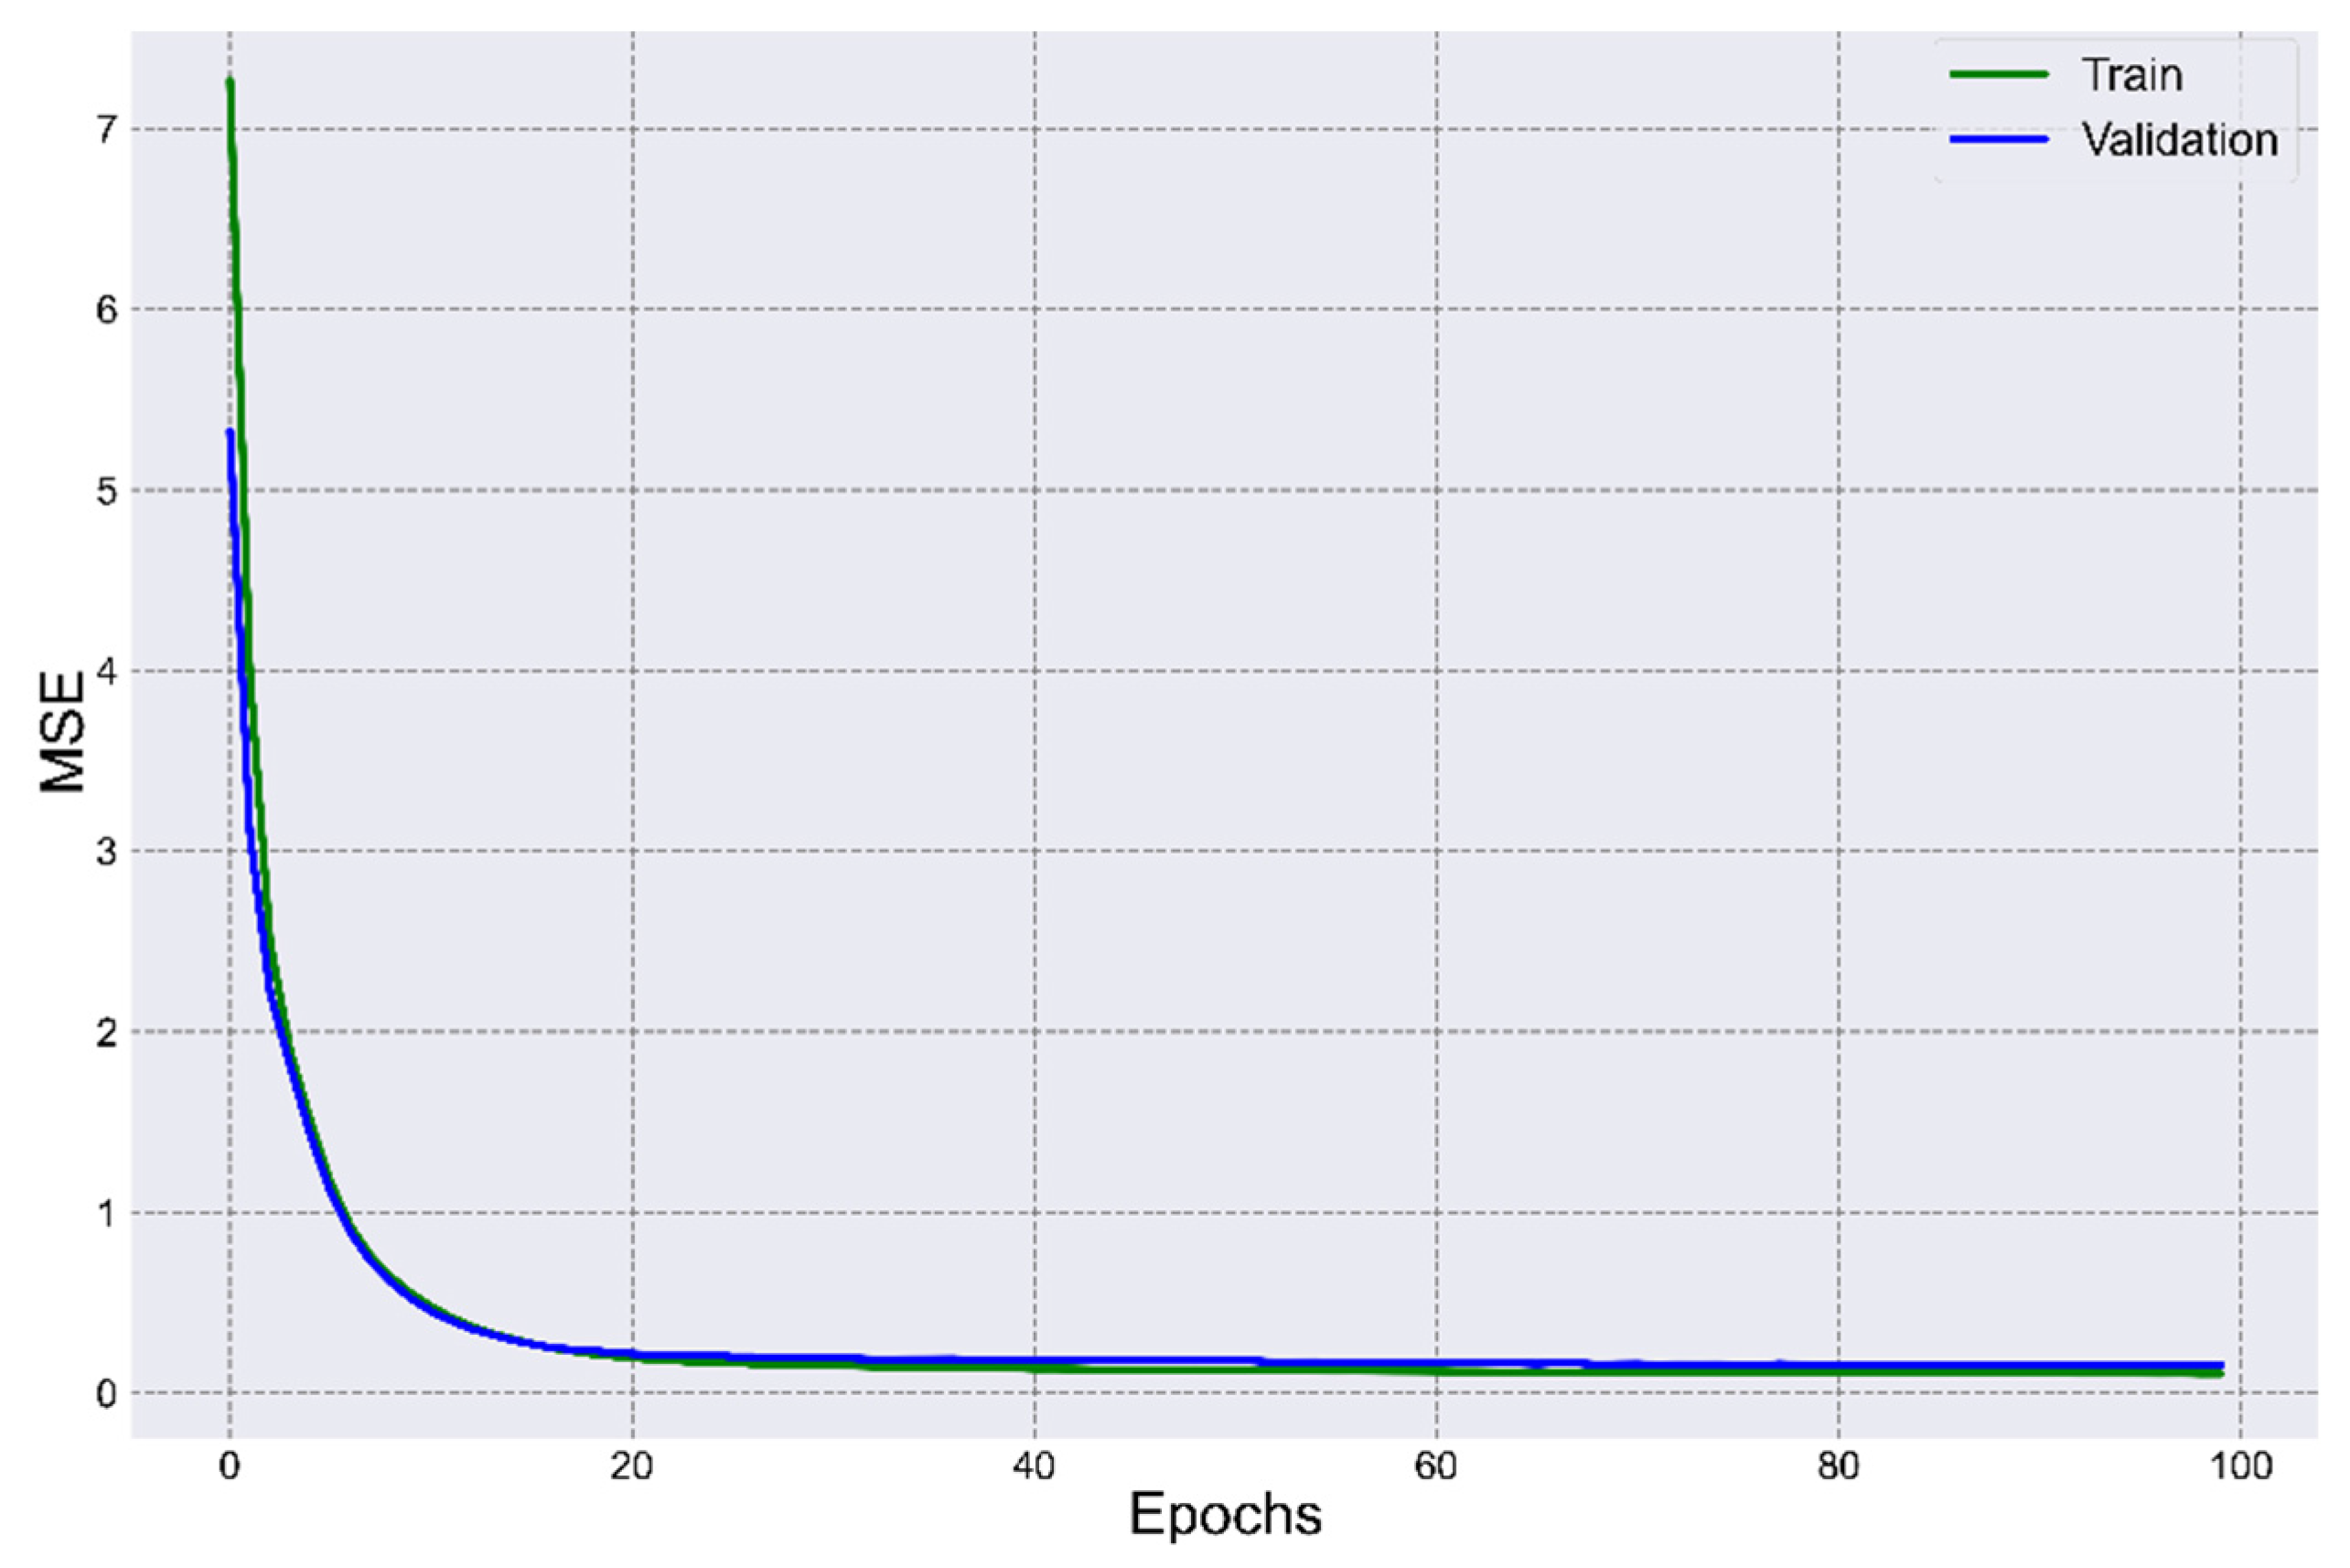
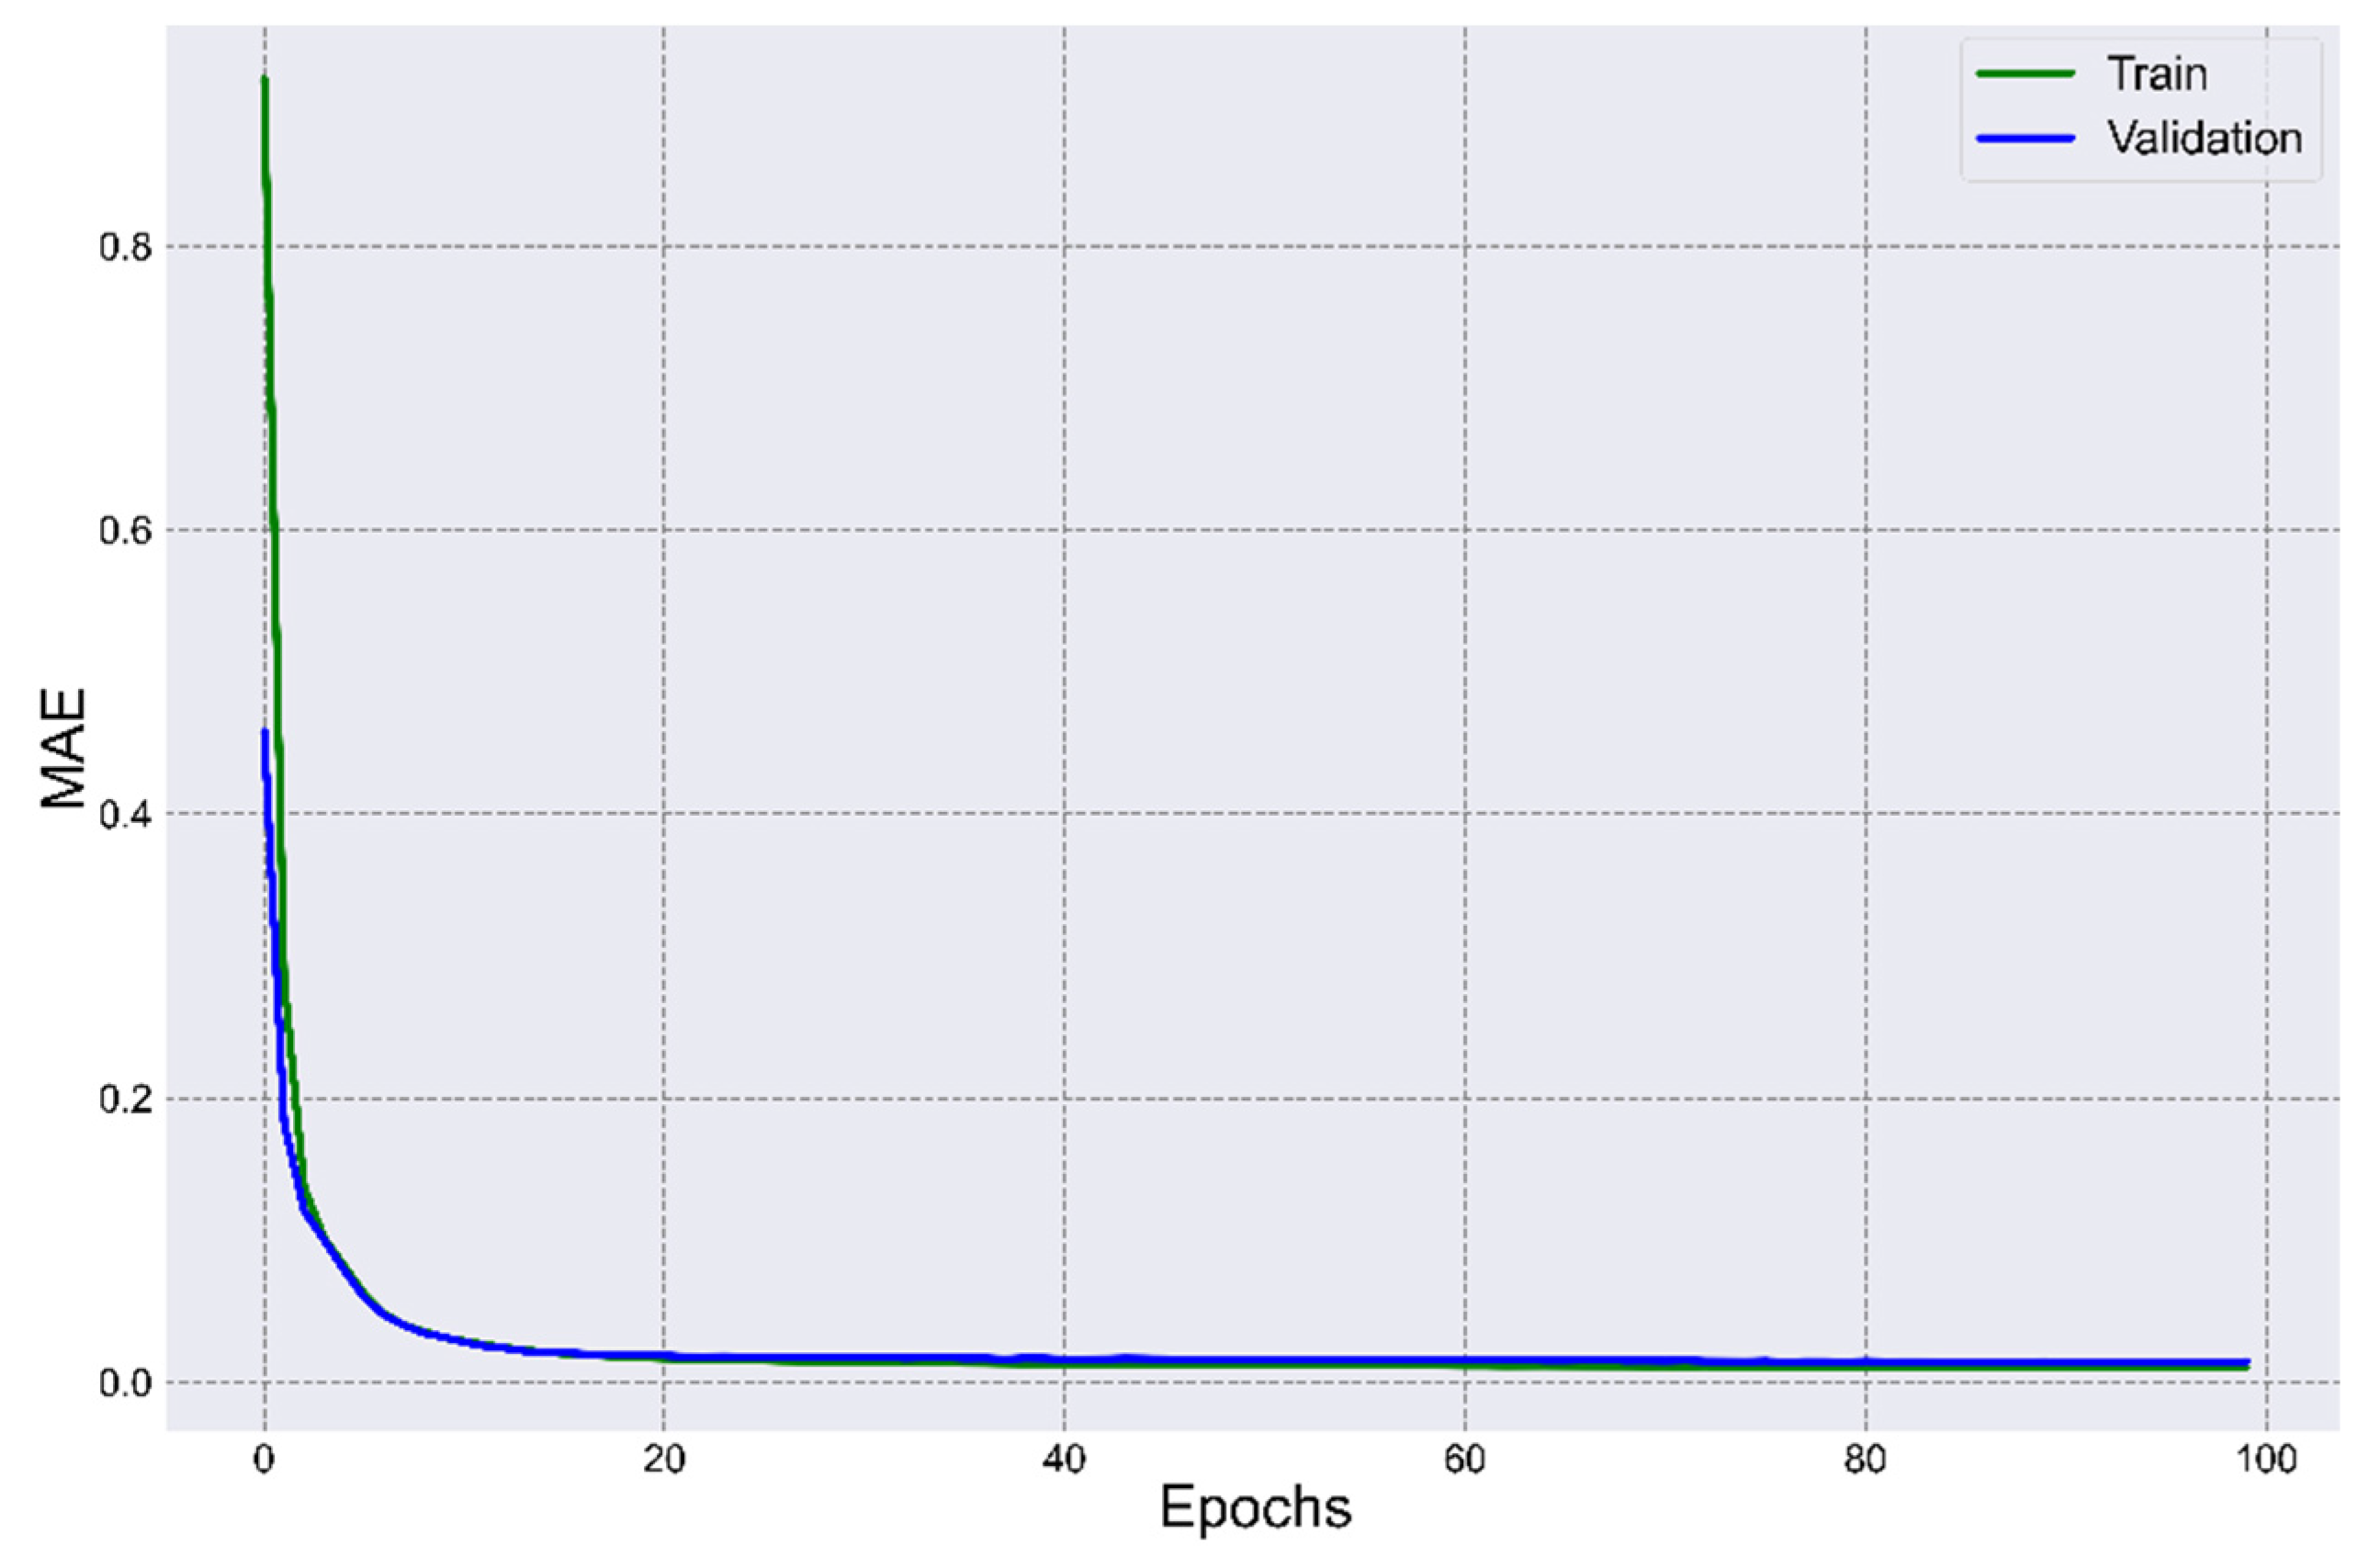
| Epochs | Training Set | Validation Set | ||
|---|---|---|---|---|
| MSE | MAE | MSE | MAE | |
| 1 | 7.2669 | 0.9170 | 5.3289 | 0.4579 |
| 2 | 3.9745 | 0.2824 | 3.0942 | 0.1824 |
| 3 | 2.4992 | 0.1372 | 2.2143 | 0.1204 |
| 4 | 1.8949 | 0.1013 | 1.8098 | 0.1000 |
| 5 | 1.5088 | 0.0817 | 1.4278 | 0.0788 |
| … | … | … | … | … |
| 94 | 0.1087 | 0.0106 | 0.1494 | 0.0138 |
| 95 | 0.1088 | 0.0106 | 0.1512 | 0.0140 |
| 96 | 0.1086 | 0.0106 | 0.1501 | 0.0140 |
| 97 | 0.1075 | 0.0105 | 0.1545 | 0.0144 |
| 98 | 0.1083 | 0.0107 | 0.1530 | 0.0140 |
| 99 | 0.1064 | 0.0105 | 0.1541 | 0.0136 |
| 100 | 0.0961 | 0.0104 | 0.1548 | 0.0146 |
Publisher’s Note: MDPI stays neutral with regard to jurisdictional claims in published maps and institutional affiliations. |
© 2022 by the authors. Licensee MDPI, Basel, Switzerland. This article is an open access article distributed under the terms and conditions of the Creative Commons Attribution (CC BY) license (https://creativecommons.org/licenses/by/4.0/).
Share and Cite
Trach, R.; Trach, Y.; Kiersnowska, A.; Markiewicz, A.; Lendo-Siwicka, M.; Rusakov, K. A Study of Assessment and Prediction of Water Quality Index Using Fuzzy Logic and ANN Models. Sustainability 2022, 14, 5656. https://doi.org/10.3390/su14095656
Trach R, Trach Y, Kiersnowska A, Markiewicz A, Lendo-Siwicka M, Rusakov K. A Study of Assessment and Prediction of Water Quality Index Using Fuzzy Logic and ANN Models. Sustainability. 2022; 14(9):5656. https://doi.org/10.3390/su14095656
Chicago/Turabian StyleTrach, Roman, Yuliia Trach, Agnieszka Kiersnowska, Anna Markiewicz, Marzena Lendo-Siwicka, and Konstantin Rusakov. 2022. "A Study of Assessment and Prediction of Water Quality Index Using Fuzzy Logic and ANN Models" Sustainability 14, no. 9: 5656. https://doi.org/10.3390/su14095656
APA StyleTrach, R., Trach, Y., Kiersnowska, A., Markiewicz, A., Lendo-Siwicka, M., & Rusakov, K. (2022). A Study of Assessment and Prediction of Water Quality Index Using Fuzzy Logic and ANN Models. Sustainability, 14(9), 5656. https://doi.org/10.3390/su14095656