Article

Photosynthesis, Yield and Quality of Soybean (Glycine max (L.) Merr.) under Different Soil-Tillage Systems

by
Jan Buczek
,
Dorota Bobrecka-Jamro
and
Marta Jańczak-Pieniążek
*
Department of Crop Production, University of Rzeszow, Zelwerowicza 4 St., 35-601 Rzeszow, Poland
*
Author to whom correspondence should be addressed.
Sustainability 2022, 14(9), 4903; https://doi.org/10.3390/su14094903
Submission received: 18 February 2022 / Revised: 14 April 2022 / Accepted: 18 April 2022 / Published: 19 April 2022
(This article belongs to the Special Issue Plant Nutrition, Plant-Soil Relationships and Sustainable Agriculture)

Abstract

:
Due to current climate changes and drought periods, it is recommended to cultivate soybean in no-plowing tillage systems. The conducted research is to contribute to a partial explanation of the course of photosynthesis processes in soybean plants, which may facilitate the decision making before sowing this species in a given tillage system. The aim of the study was to assess the dependence of photosynthesis on the yield and variable hydrothermal conditions of tillage systems, as well as their impact on the productivity and quality of soybean. A field experiment was carried out using soybean cv. Merlin, between 2017 and 2019 in Boguchwała, Poland. The plant tested was soybean cv. Merlin. The tillage systems—conventional (CT), reduced (RT) and no-tillage (NT)—were the experimental factors. The use of CT and RT influenced growth in leaf area index (LAI) and soil plant analysis development (SPAD) and improved the photosynthesis process, which increased the values of the maximal quantum yield of the photolysis system of the donor side of PSII (Fv/F0), and performance index of PS II (PI) and net photosynthetic rate (PN), stomatal conductance (gs) parameters, compared to NT. CT treatment increased the yield of soybean plants to significantly higher compared with NT treatment, and seeds treated with the CT treatment contained more protein. The content of fat and phosphorus (P) were significantly higher in the NT system and the content of potassium (K) from RT. In 2017, under drought conditions (the June–September period), the seed yield of NT was similar to the yield of CT and significantly higher than the yield of RT. The higher value of hydrothermal coefficients in 2019 resulted in an increase in photosynthesis parameters, seed yield as well as the content of fat and elements P and K.

1. Introduction

In Poland, the increased interest in the cultivation of soybeans results mainly from for higher requirements for vegetable protein in the feed industry, as a source of high-protein, low-fat and roasted soybean meal used in animal nutrition [1,2]. Due to the high nutritional value of soybeans, there is growing interest in this species from society looking for healthy food. Therefore, soybeans are grown not only in a conventional system but also in an organic system. Climatic conditions, especially temperature and rainfall, and pathogens, are factors that limit the yields of soybeans [3,4,5,6,7]. Therefore, the reduced-tillage (RT) or no-tillage (NT) systems not only increase the organic-carbon content in the soil and minimize the risk of soil erosion, but also improve the water storage and use capacity of the soil and reduce fluctuations in its temperature [1,8]. According to other studies [5,9,10,11], the cultivation of soybean in various tillage systems does not significantly affect the yield and quality characteristics (protein, fat), nor the mineral composition. The benefits of using no-tillage systems can be seen in seasons characterised by higher temperatures and less rainfall, which results in better water retention in the soil caused by less evaporation and changes in the water permeability of the soil [12,13]. NT can cause some nutrients (K, Zn) to accumulate in the topmost layers of to the soil in relation to the lower layers of the soil profile and, therefore, may be less available to crops. Studies conducted by other authors prove that conventional tillage (CT), in comparison with reduced tillage systems (RT, NT), affects a higher yield of soybeans and protein content, and mineral composition of seeds [5,14]. From the opposing point of view, Toliver et al. [15] demonstrate that, on loamy soil, the risk of decline in soybean yield at NT is reduced compared to CT on sandy soil. The studies by Farmaha et al. [3] show that the soybean yield in NT was lower by 0.29 t·ha−1 than in the strip-till system (ST), which combines the benefits of NT and CT. It is worth emphasizing that the long-term research conducted in Poland by Gawęda et al. [2] show a higher yield of soybean in CT compared to NT, especially in the years with high temperatures throughout the growing season and average rainfall throughout the seed-ripening period. Variable hydrothermal conditions in some regions of the country (Poland) to a large extent modify not only the yield but also the content of nutrients in soybean [16] and pea [17] seeds; thus, they eliminate the influence of agrotechnical factors. Soybean is a plant that is affected by environmental stresses, especially unfavourable temperatures and not enough rainfall [4,5]. In particular, cold temperatures are a factor that largely decides the productivity of this plant [18,19]. Therefore, measurements of physiological parameters were used to evaluate the influence of abiotic stress factors on light-dependent reactions, taking into account the effects of nitrogen deficiency [20,21], salt and heat stress [22,23], and herbicides used [22,24]. However, the research conducted so far does not assess the influence of tillage systems on physiological parameters, and there is little research on the mineral composition of soybeans. Observation of these research effects may contribute to a partial explanation of the influence of tillage systems on the photosynthesis rate and other physiological parameters, as well as the fluctuation in the mineral composition and the level of soybean yield.
The purpose of the research was to evaluate the result of tillage systems (CT, RT and NT) on yielding and seed quality as well as the physiological parameters of soybean under various hydrothermal conditions.

2. Materials and Methods

2.1. Experiment and Cultivation Management

The field experiment was conducted between 2017 and 2019. It was situated at Advisory Center in Boguchwała (49°59′ N, 21°56′ E), Podkarpackie province, Poland. The experiment was conducted in 3 replications in a randomised block design (8 × 100 m), divided into 3 split plots. The tested factor was tillage systems: conventional (CT), reduced tillage (RT), and direct seeding—no tillage (NT) (Table 1).
The breeder of Glycine max cv. Merlin was the Saatbau Poland Sp. z o.o, Środa Śląska, Poland. Before sowing, soybeans were treated using Fix Fertig technology. For starting fertilization with nitrogen, ammonium nitrate 34% was used, at a rate of 30 N kg·ha−1. Phosphorus (P: triple superphosphate 46% P2O5) and potassium (K: potassium salt 60% K2O) fertilizers were applied in the amount of 30 P kg·ha−1 and 55 K kg·ha−1. In all the years of research, soybeans were sown between April 25 and May 5, at a sowing density of 65 seeds.m2 with row spacing of g 30 cm, to a depth of 3–4 cm. Winter wheat was the previous crop. Dispersive Afalon 450 SC (linuron- 1.5 dm−3·ha−1, Adama Polska Sp. z o.o., Warszawa, Poland) was used for weed control. Mineral-fertilization and plant-protection products were used in the appropriate developmental stages of soybean, according to the BBCH scales [25].

2.2. Morpho-Physiological Measurements

Soil plant analysis development (SPAD), leaf area index (LAI), chlorophyll fluorescence, and gas exchange measurements were performed in the morning in the flowering phase (65 BBCH) of soybeans.

2.2.1. LAI and SPAD

Measurement of LAI was carried out using the LAI 2000 apparatus (LI-COR, Lincoln, NE, USA), by taking 1 measurement over the crop and 4 measurements inside the crop [26]. Measurements of SPAD were carried out with the use of apparatus SPAD-502 P Konica Minolta (Tokyo, Japan) on 20 randomly selected plants [27].

2.2.2. Chlorophyll Fluorescence

Chlorophyll a fluorescence measurements were performed using a portable chlorophyll fluorescence meter (Pocket PEA, Norfolk, United Kingdom). Soybean leaves were dark-adapted using leaf clips for 30 min [28]. Chlorophyll fluorescence measurements were performed on four randomly selected plants. The following parameters were analysed: the maximal quantum yield of photolysis system of the donor side (Fv/F0), the maximal quantum yield of PS II (Fv/Fm) and the performance index of PS II (PI).

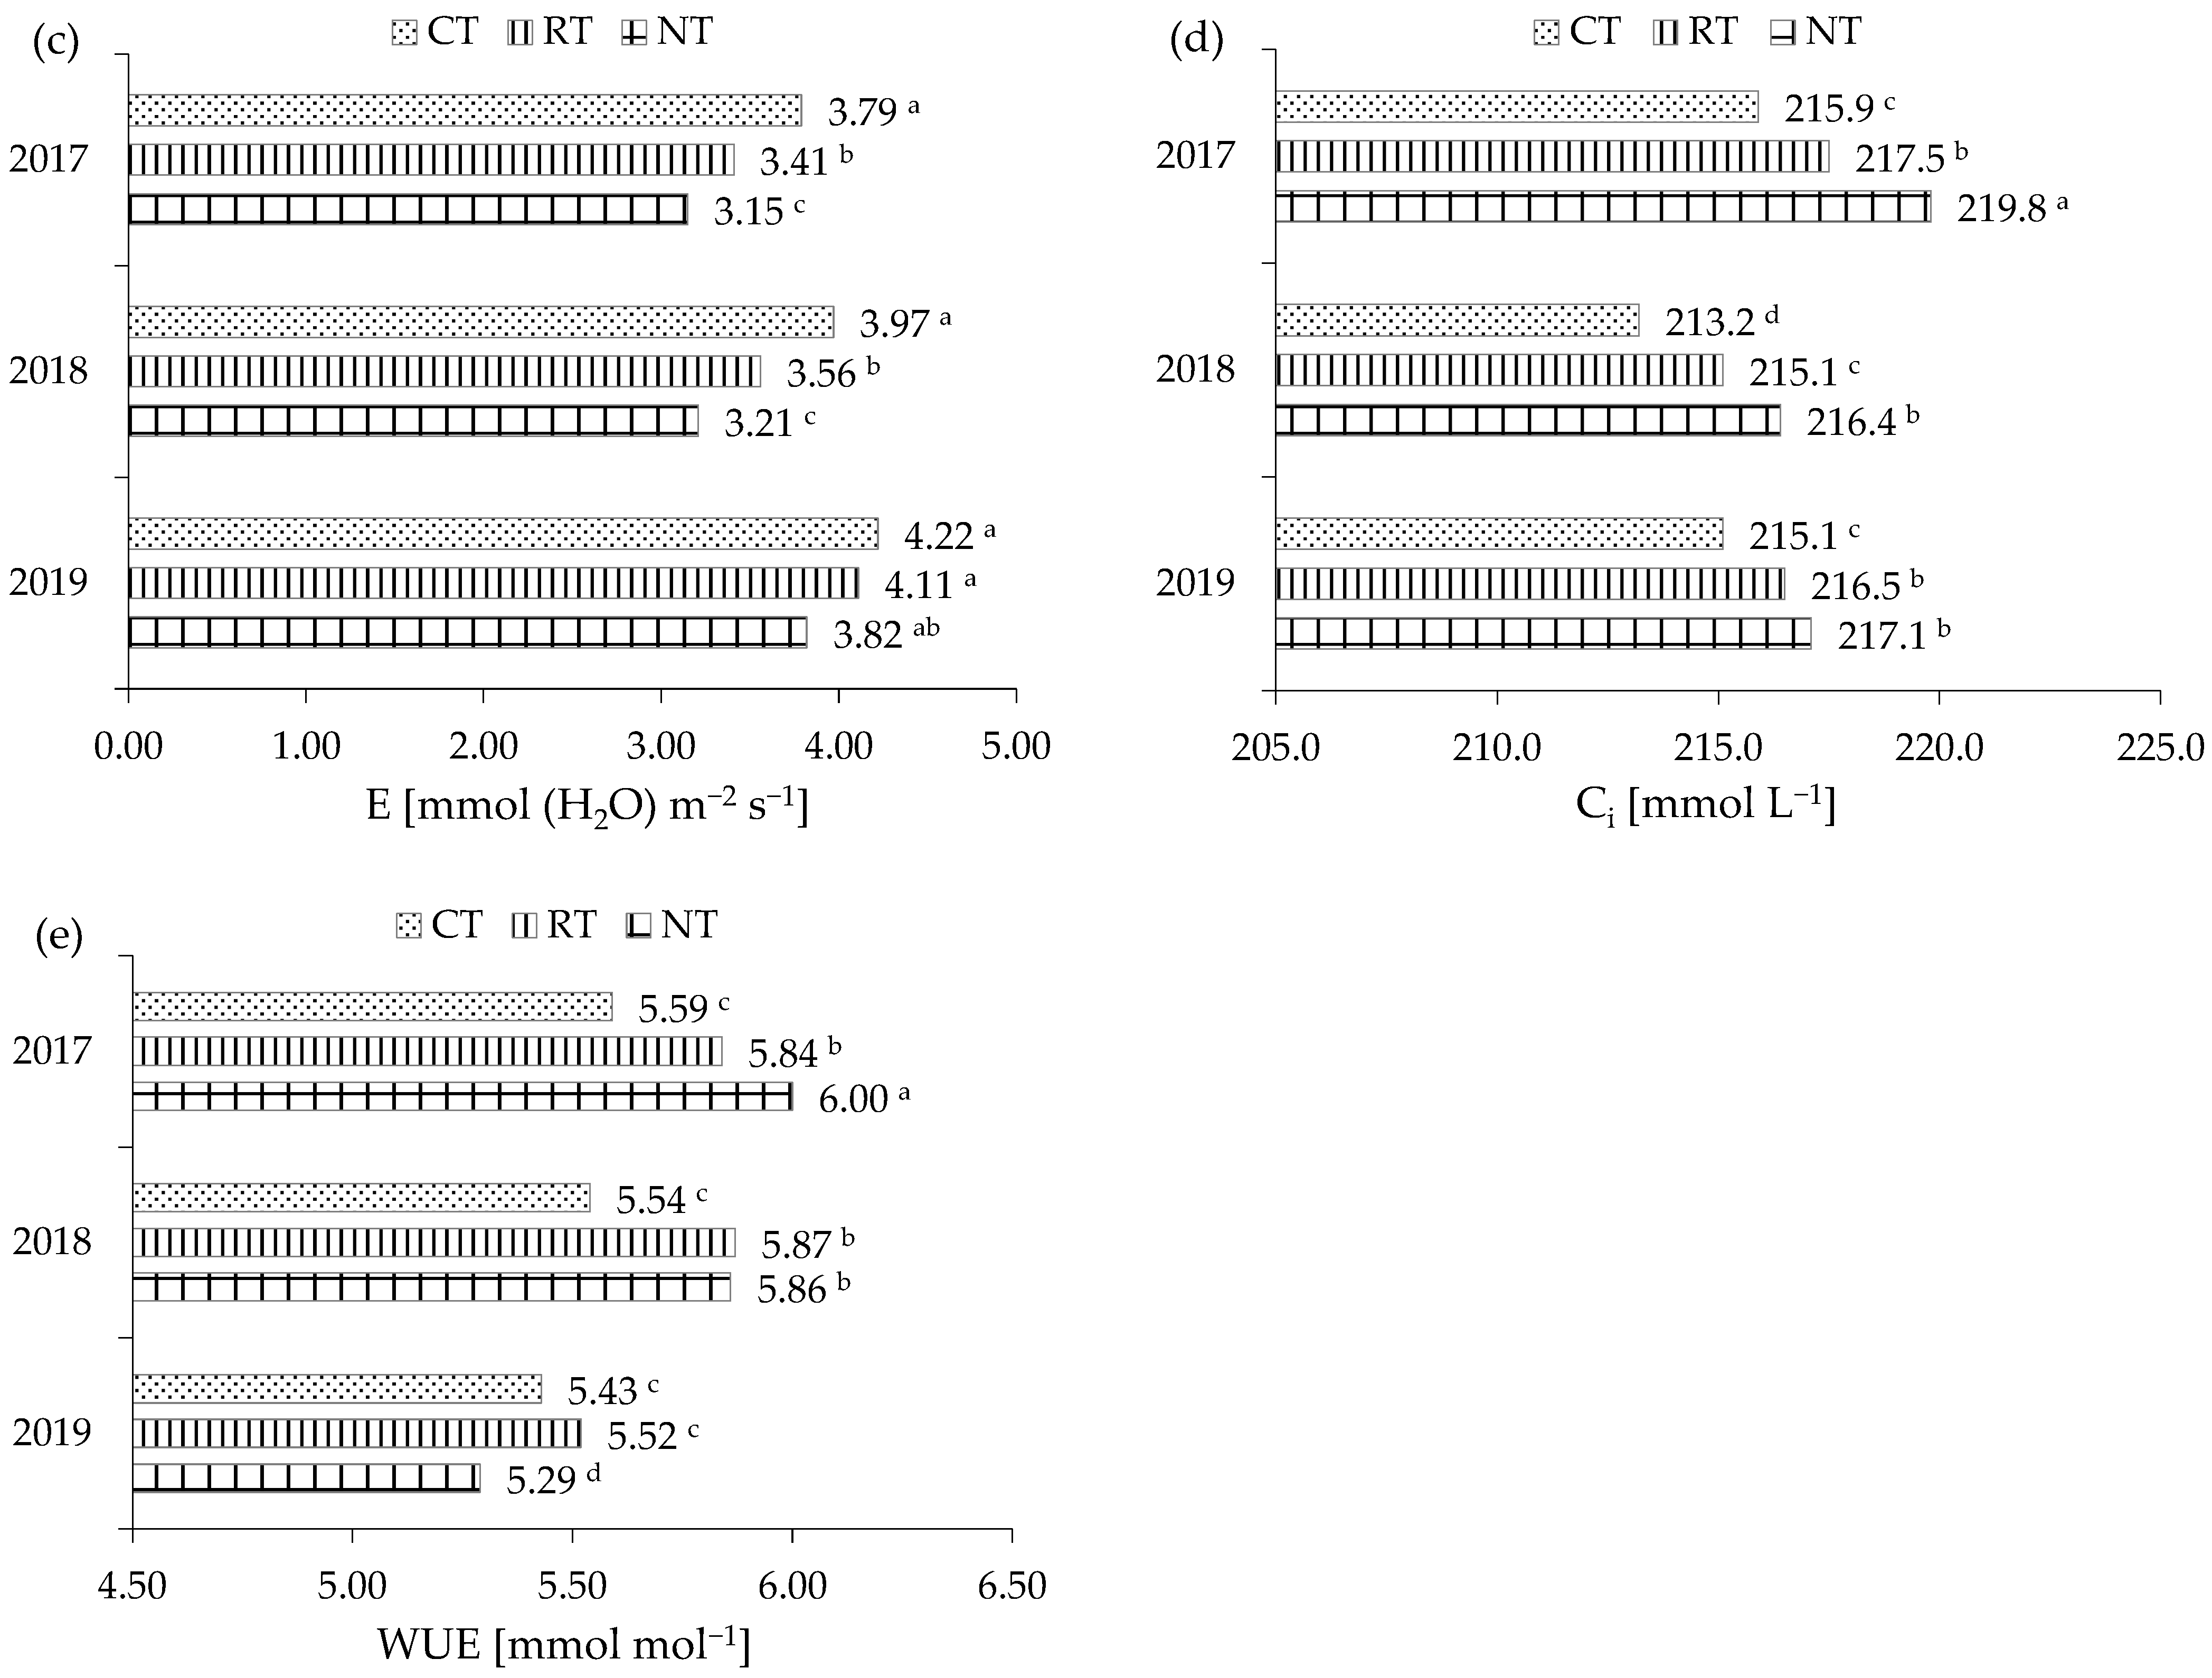
2.2.3. Gas Exchanges

Portable photosynthesis measurement system LCpro-SD (ADC BioScientific Ltd., Hoddesdon, UK) was used to perform gas-exchange measurements. The following parameters were analysed during the measurements: net CO2 assimilation (PN, μmol CO2 m−2 s−1), transpiration rate (E, mmol H2O m−2 s−1), stomatal conductance (gs, mmol H2O m−2 s−1) and intracellular CO2 concentration (Ci, μmol CO2 m−2 s−1). Water-use efficiency (WUE) was calculated as PN divided by E. Gas-exchange measurements were performed on four randomly selected plants. When taking measurements, the light intensity was 1500 mol m−2 s −1, and the leaf-chamber temperature was 28 °C [29,30].

2.3. Laboratory Analysis

The protein and fat content were determined by near-infrared spectroscopy (NIRS) using an MPA FT-NIR spectrometer (Bruker, Billerica, MA, USA). The MPA FT-NIR spectrometer was calibrated using appropriate standard files of known composition using referenced analytical methods. For the measurements, the infrared-light spectrum was used with wavelengths of 2.18 μm for protein and 2.31 and 2.33 μm for fat. The yield of these components were calculated from the product of the seed yield and the percentage of protein and fat. Seed yield per 1 ha was calculated, taking into account 15% moisture [31,32].
To determine macroelements and microelements, plant samples were mineralized in a 20:5:1 mixture of concentrated acids HNO3:HClO4:HS2O4. Determinations were carried out in an open system, in a Tecator heating block. The content of Ca, K, Mg, Zn, Mn, Cu, Fe in the mineralized samples was determined using the method of atomic-absorption spectroscopy (FAAS), with the Hitachi Z-2000 apparatus (Tokyo, Japan). The content of P was determined with colorimetry with the vanadium–molybdenum method, using a UV-VIS spectrophotometer (Shimadzu, Kyoto, Japan). For determination of Ca, Mg and K, an addition of lanthanum (La) was used (to a concentration of 0.1% in solution).

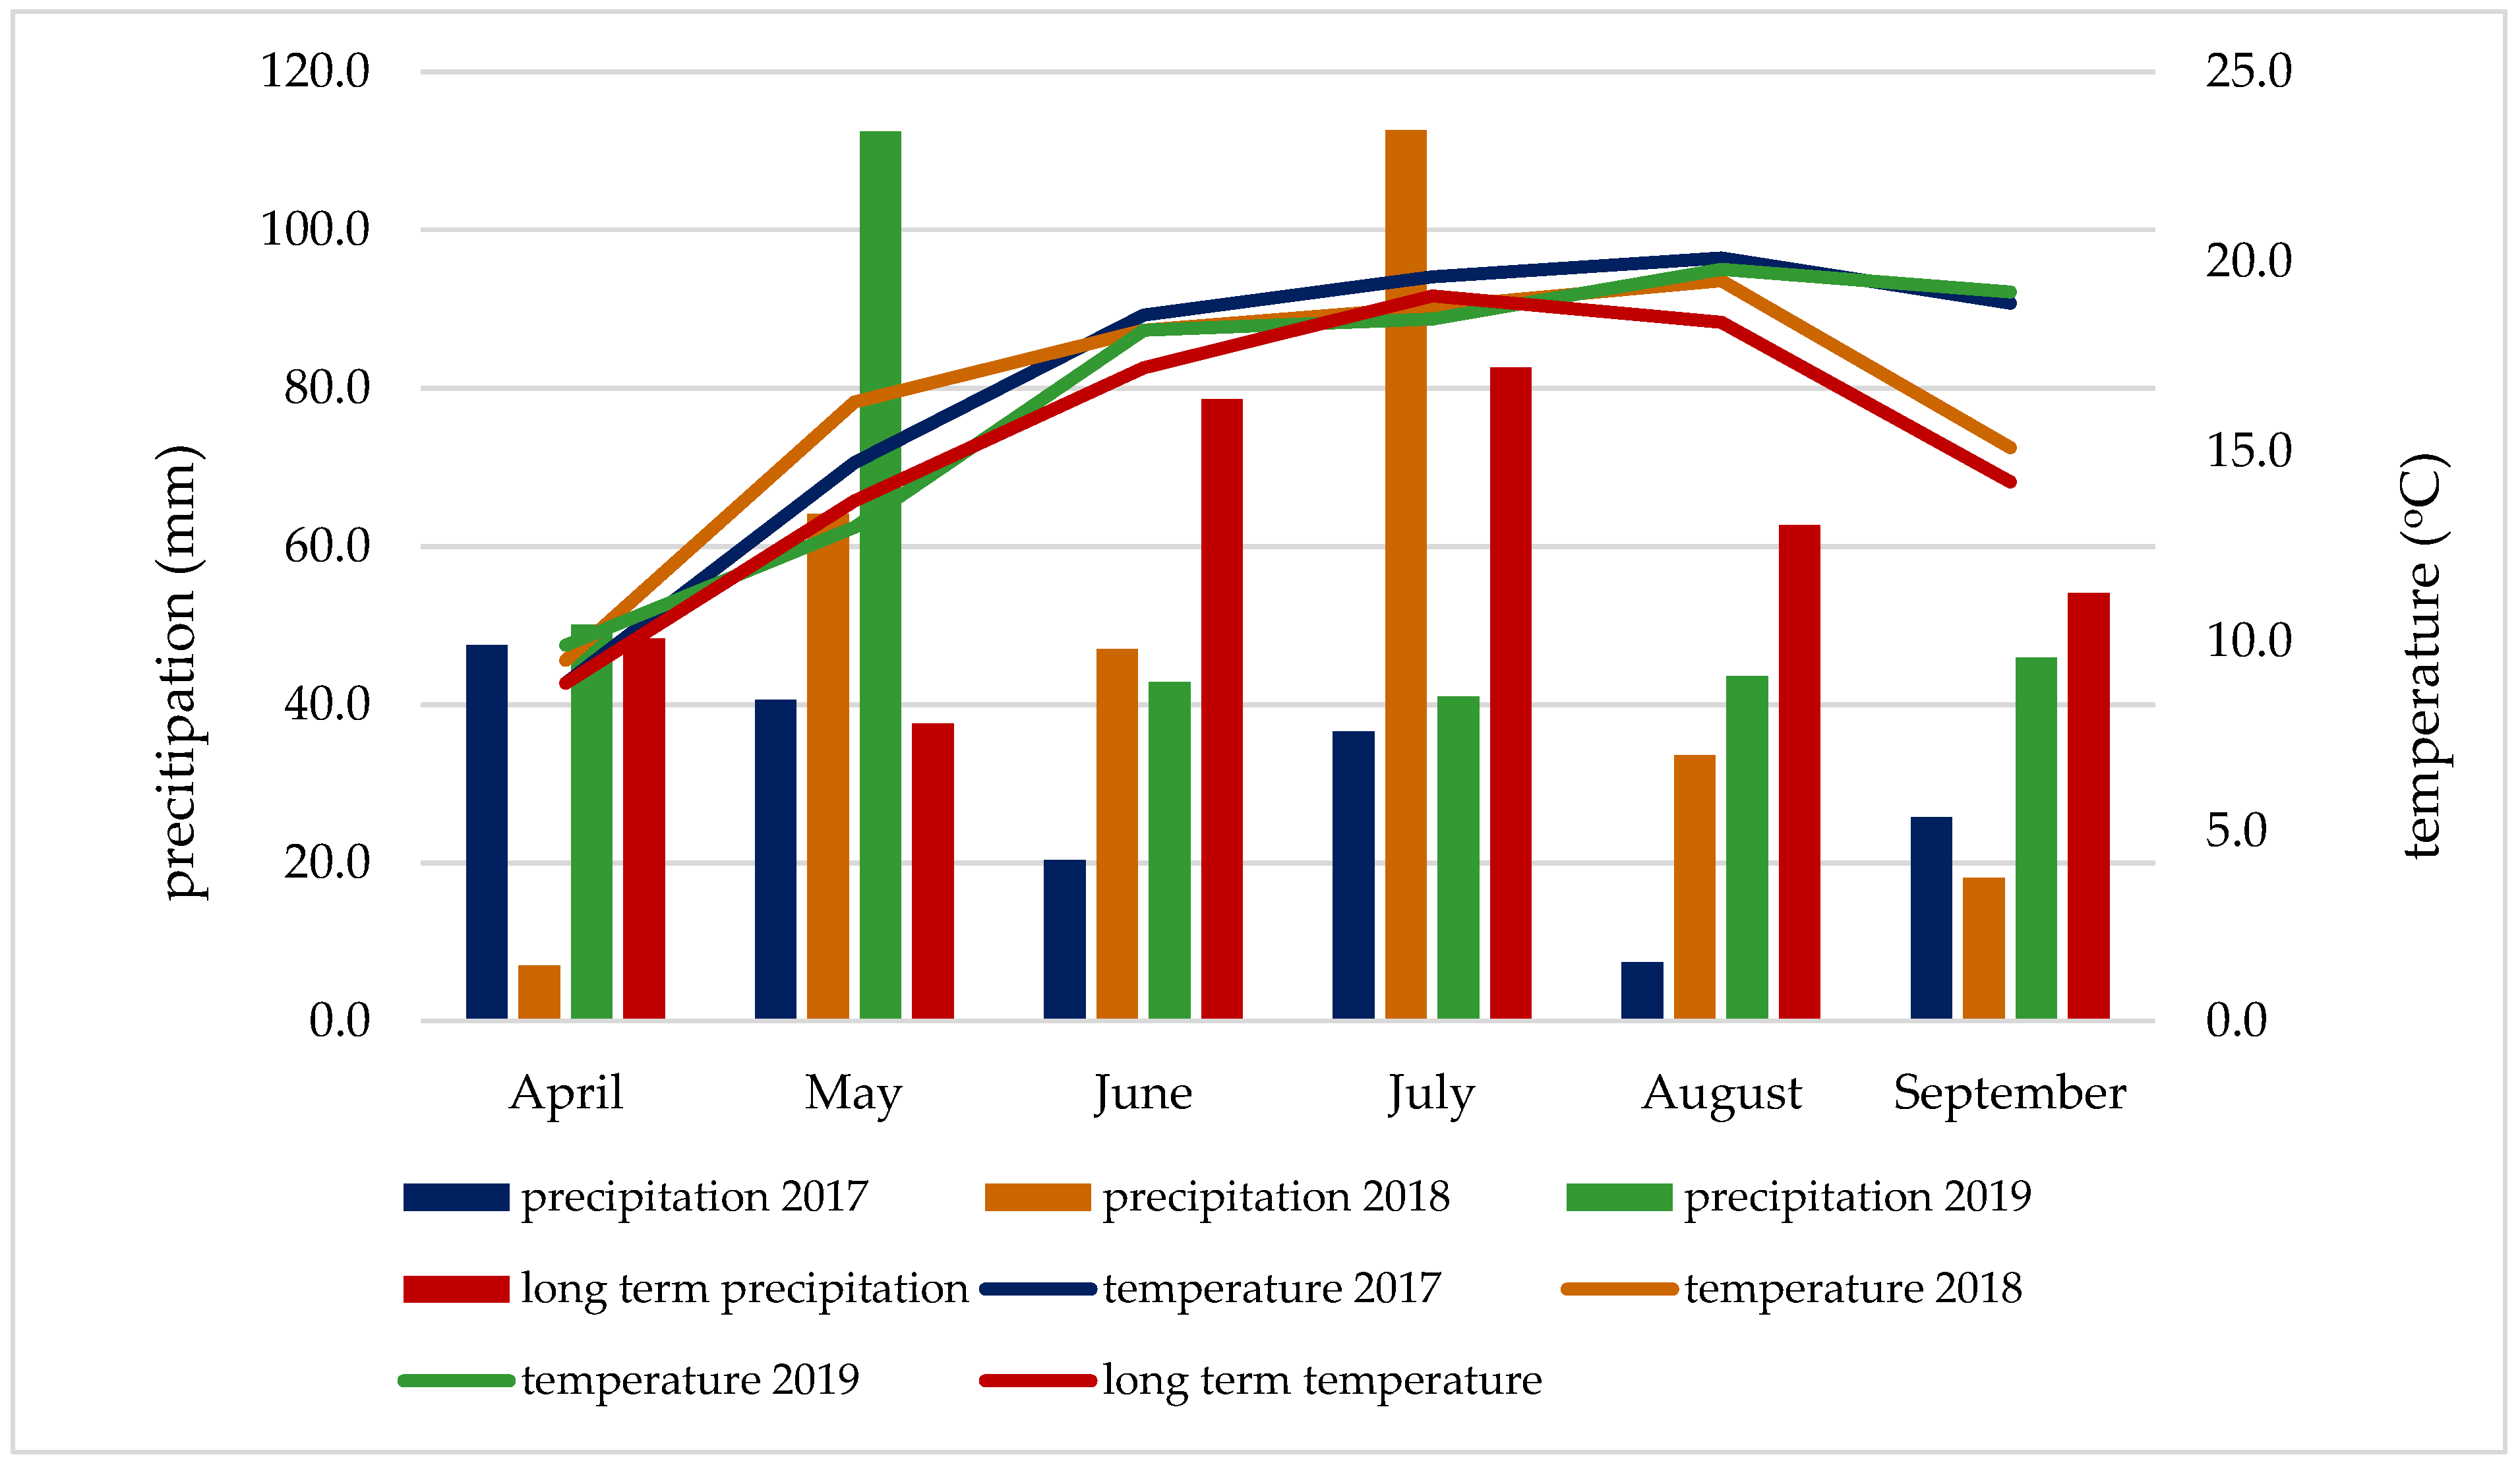
2.4. Soil and Meteorological Conditions

The experiment was founded in sandy-loam soil, Fluvic Cambisols (CMfv) according to the WRB FAO [33]. The soil was neutral, from 7.10 to 7.18 mol L−1 KCl. Corg content (with Tiurin’s method) was moderate (from 0.99 to 1.05%). The amount of N min (in 0.01 CaCl2 solution) varied from 54.1 to 64.5 kg·ha−1. The content of available P, K and Mg were very high or high and micronutrients were medium (Table 2).
The average air temperature in the years of the study was higher than the long-term average, with May in 2019 and September in 2018 being cooler (Figure 1). Each year, the rainfall was lower compared to the long-term total, and May 2019 and July 2018 were particularly rainy. The thermal and rainfall conditions in the spring–summer vegetation period in 2017 and 2018 can be classified as very dry (k = 0.6) and dry (k = 0.9), and, in 2019, as optimal (k = 1.3) (Table 3).

2.5. Statistical Analysis

The obtained results were subjected to an analysis of variance (ANOVA). Significant differences were analysed with Tukey’s (LSD—least significant difference) test (p = 0.05) using TIBCO Statistica 13.3 program (TIBCO Software Inc, Palo Alto, CA, USA).

3. Results and Discussion

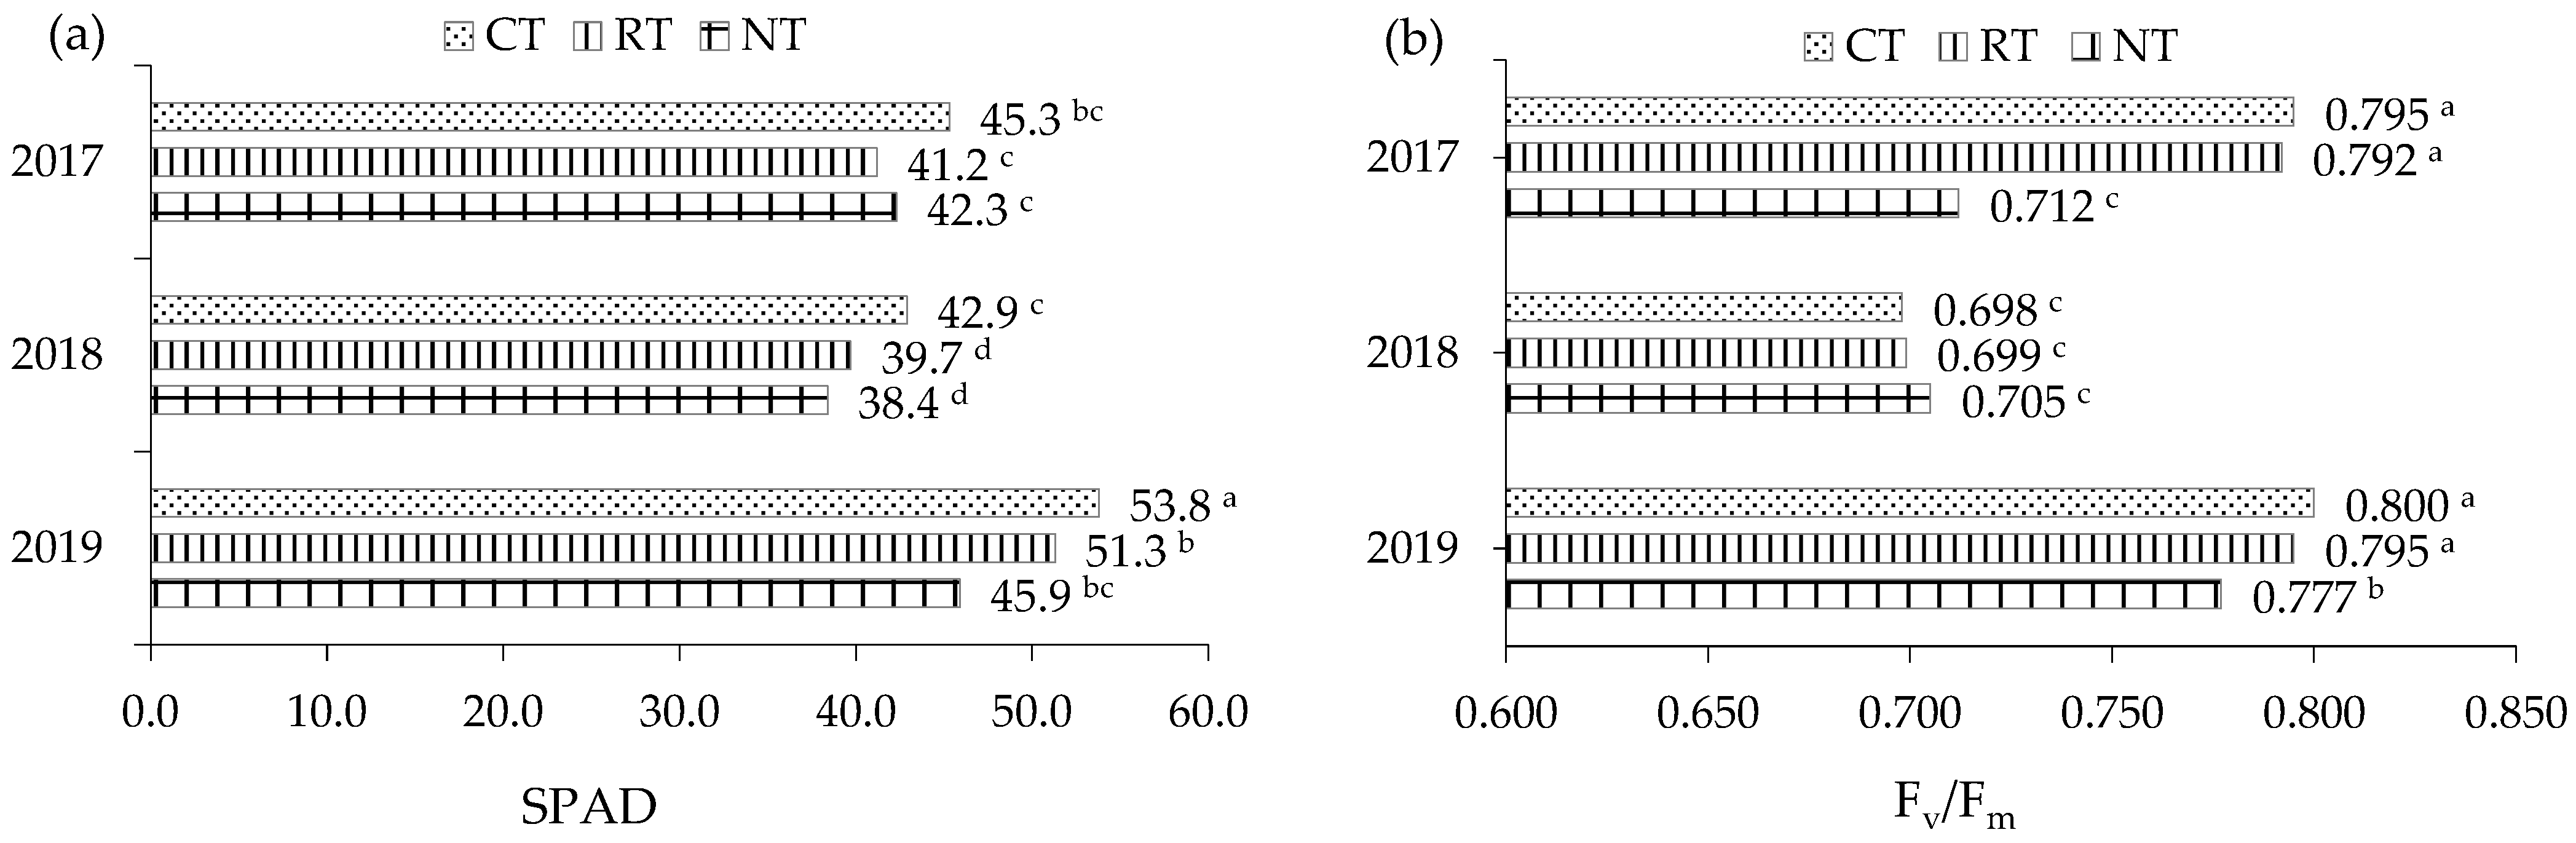
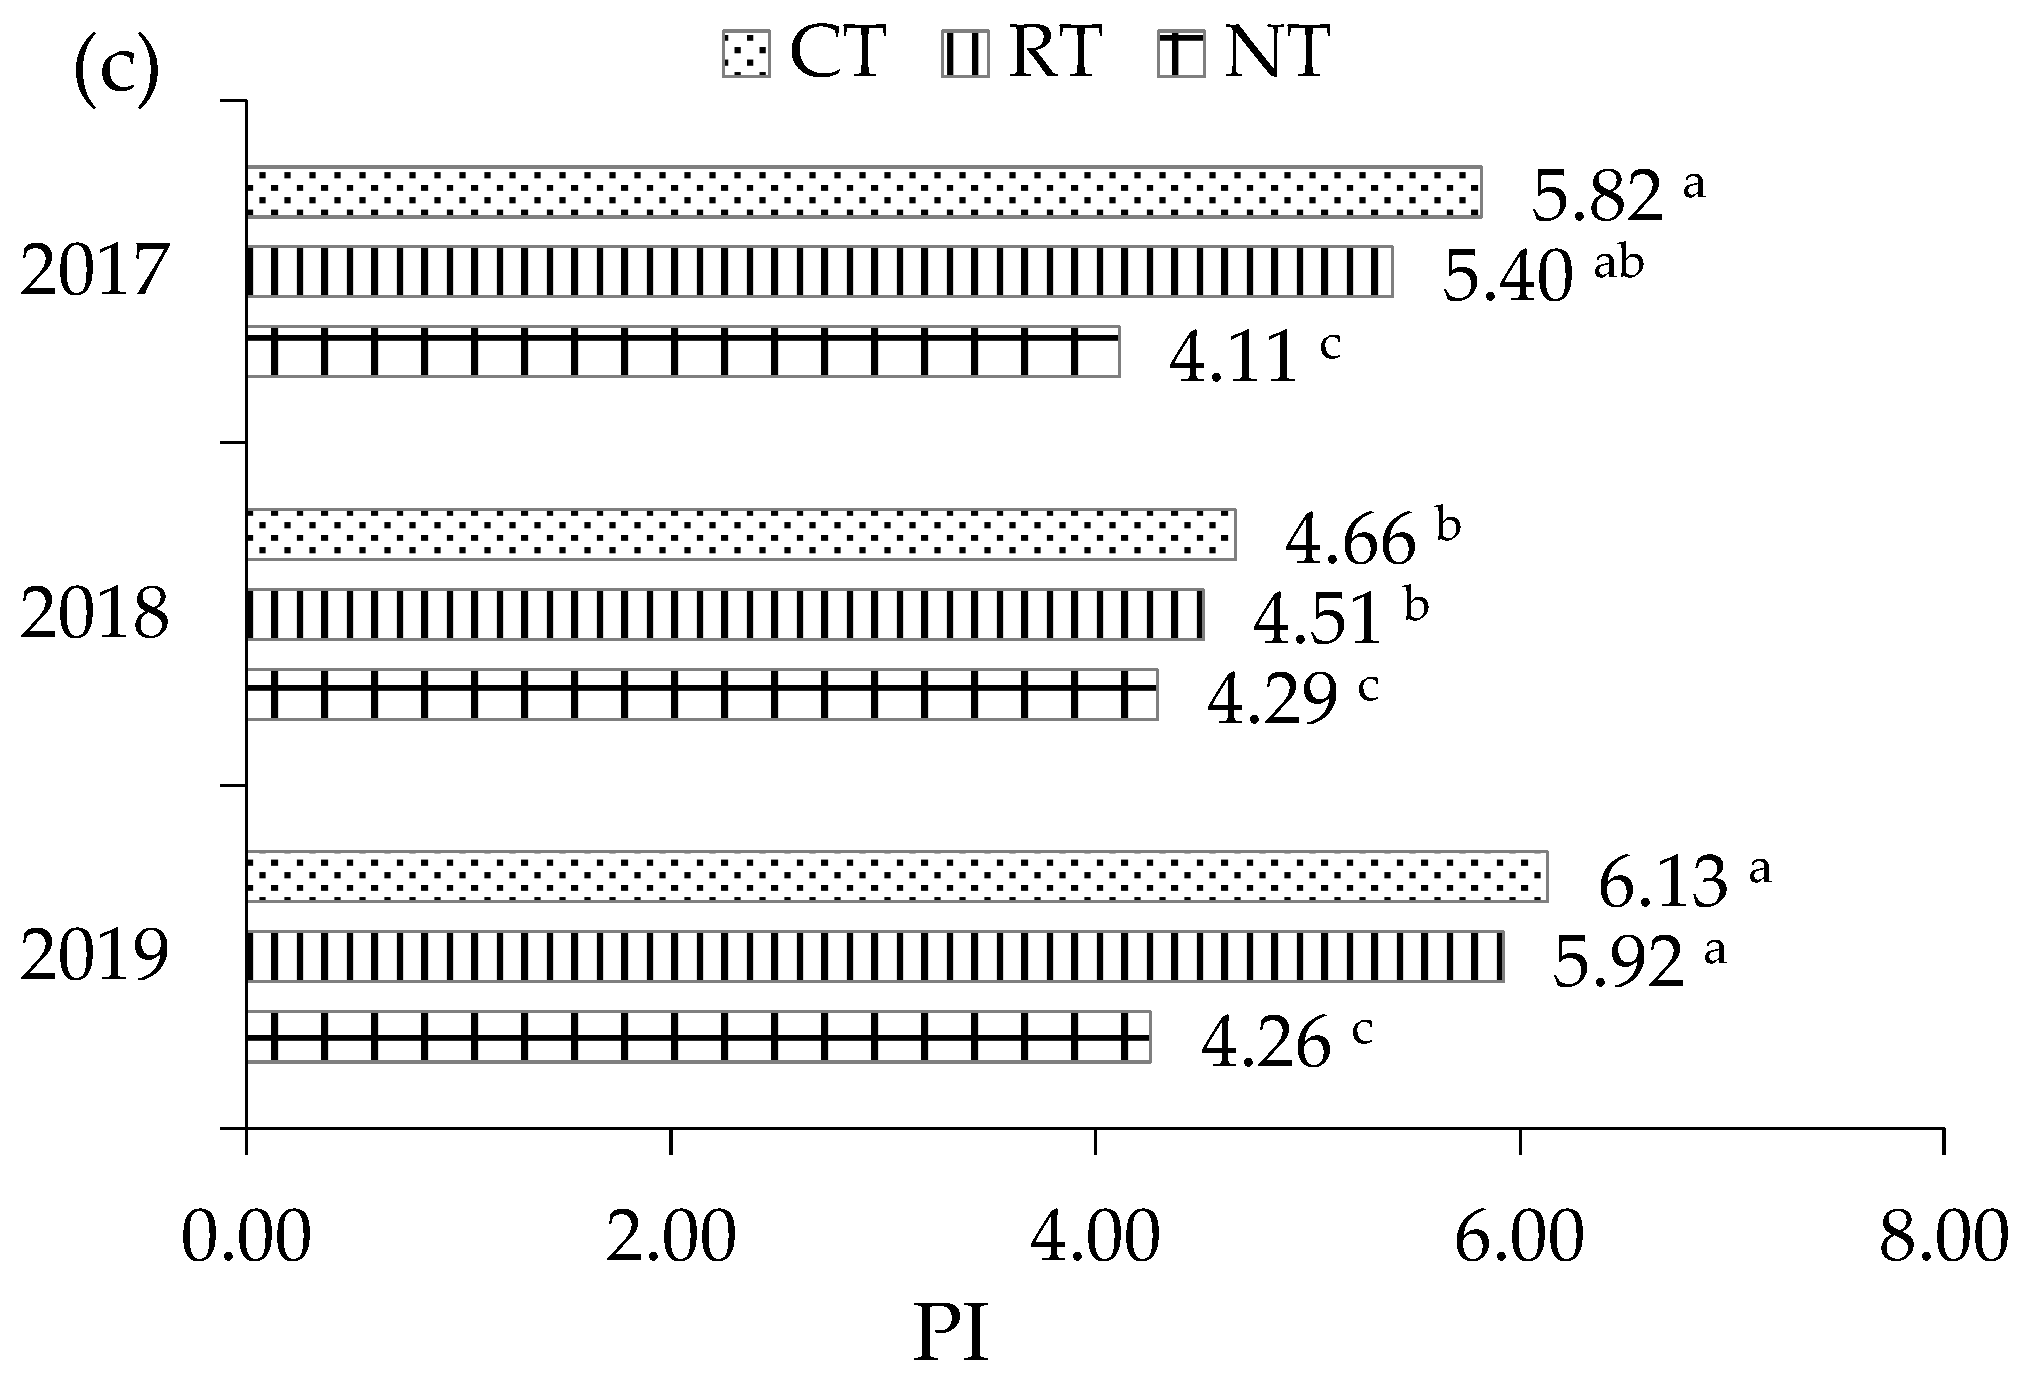
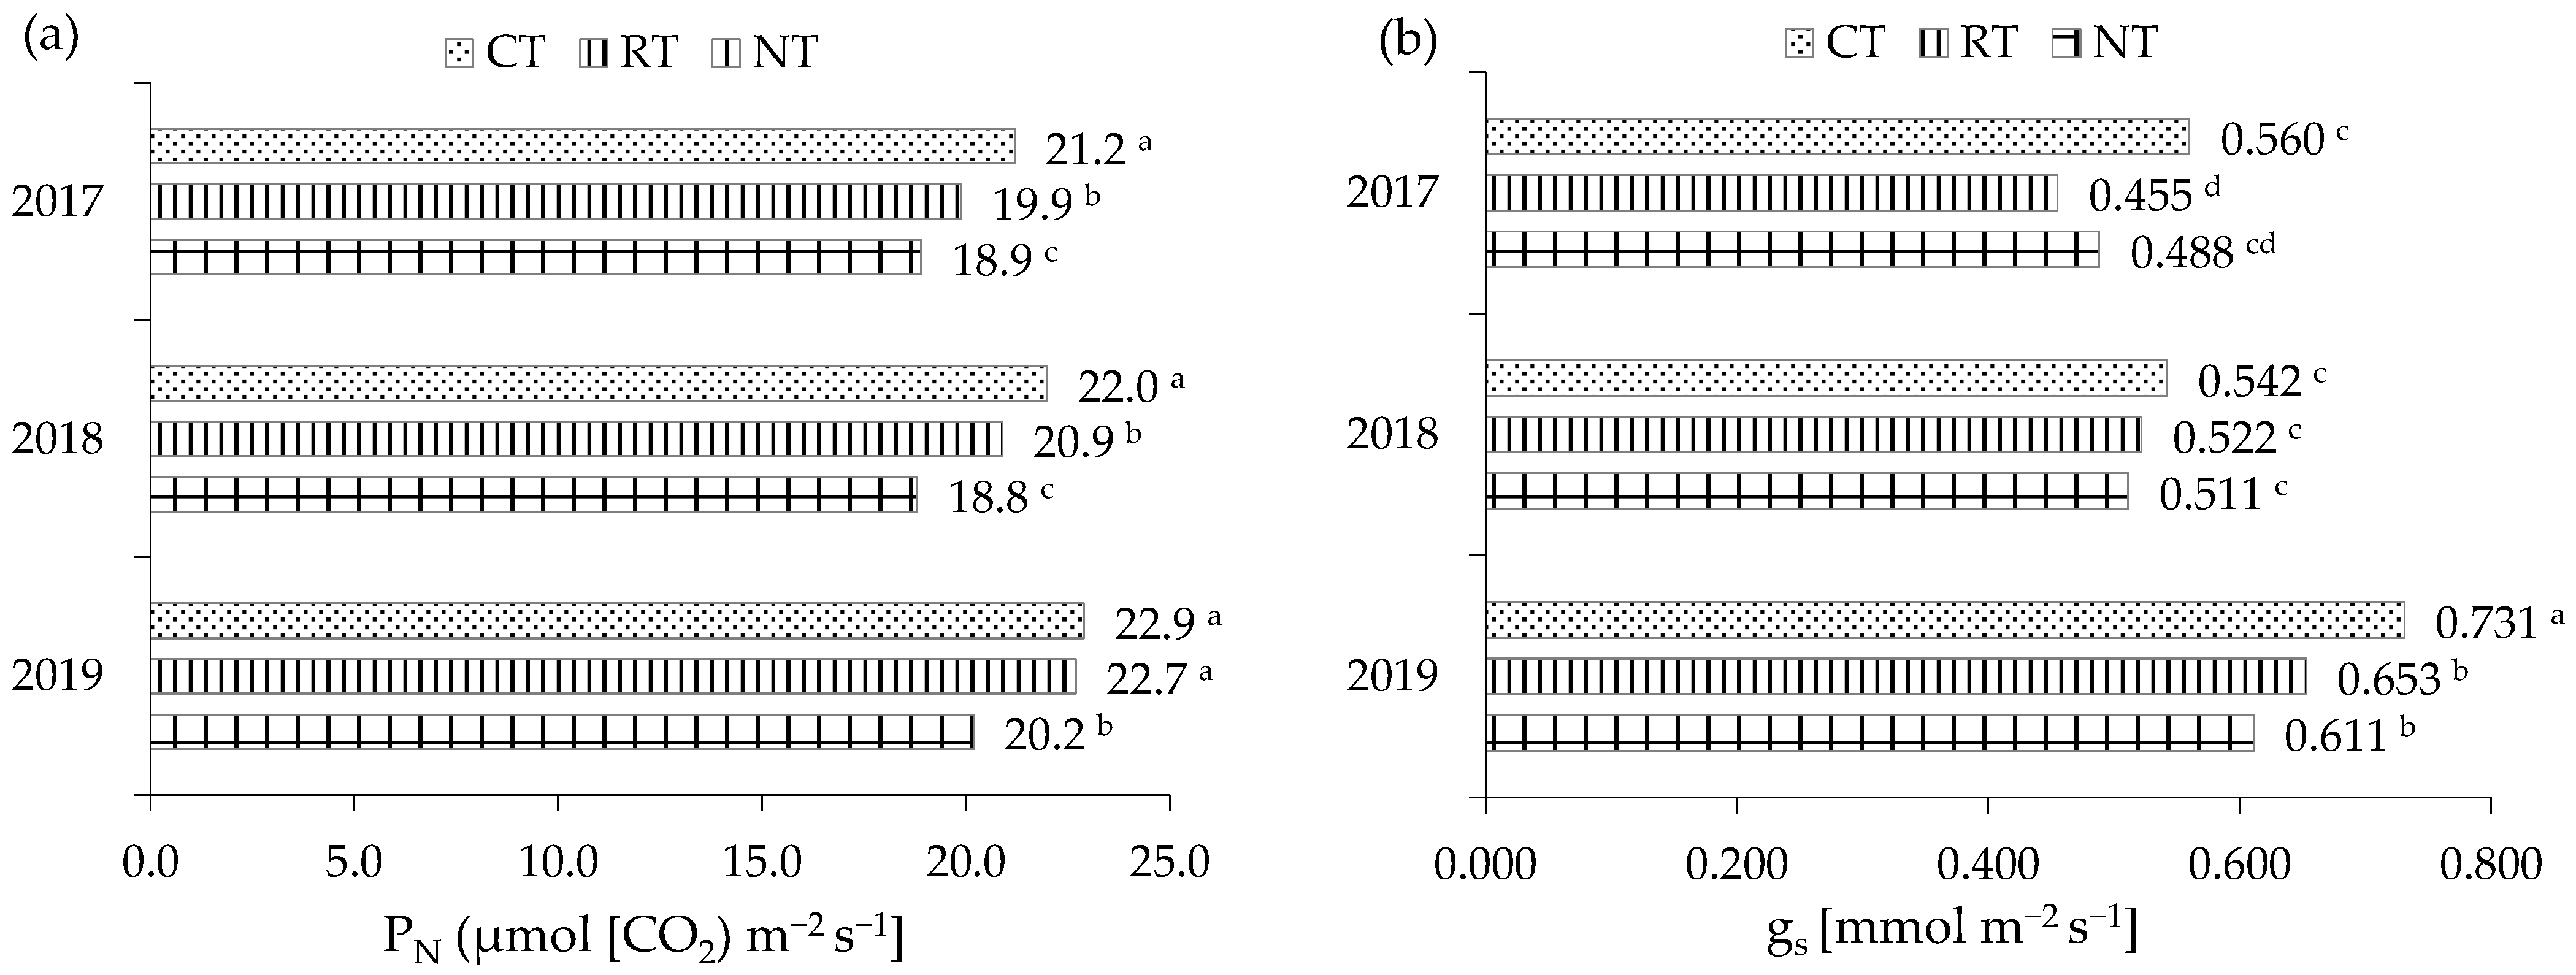
3.1. Physiological Parameters

Chlorophyll is one of the most important plant pigments, and its content significantly determines the photosynthesis process and influences chlorophyll fluorescence [35]. Measurement of chlorophyll content with the use of the SPAD chlorophyll meters is therefore an effective method of assessing the nutritional status of plants grown under various environmental conditions [36]. The leaf area index (LAI), which describes the ratio of the leaf area to the unit of soil area, is an important parameter presenting the growth and development rate of crops and determines the efficiency of the photosynthesis process. Therefore, this parameter is important in the assessment of the state of field growth and the yielding potential of crops [37]. The SPAD and LAI values’ indices reached significantly higher values in the CT system in comparison to RT and NT. The value of the SPAD index in CT was higher in comparison to RT and NT and amounted to 6.1 and 10.8%, respectively, and the LAI index 13.0 and 9.6%. However, no significant differences were found between RT and NT in the SPAD and LAI measurements. Research conducted by Houx et al. [1] showed that the better nutrition of soybean plants in CT, compared to RT and NT, resulted from a higher nutrient uptake, due to lower soil compaction. The studies of Tang et al. [38] indicated an increase in SPAD and LAI values in soybean in CT compared to NT by as much as 55.0 and 9.1%, with the cultivation of soybean in CT combining with drip irrigation technology (Table 4). The content of chlorophyll in soybean grown in various tillage systems is also influenced by the weather conditions during the experiment, which, similarly to the authors’ own research, was also demonstrated in the work of Sabo et al. [39].
According to Murchie and Lawson [40], chlorophyll a fluorescence is an important indicator of photosynthesis and provides information about the functioning of the photosynthetic apparatus in plants in response to changing environmental and agrotechnical conditions. Measurements of chlorophyll fluorescence can therefore be used to identify drought-tolerant plant genotypes that react otherwise under different cultivation conditions [41]. The use of CT and RT in the experiment stimulated the functioning of photosynthesis, which resulted in the obtained higher values of chlorophyll fluorescence parameters (Fv/F0 and PI) compared to NT. On the other hand, tillage systems did not significantly influence the values of the Fv/Fm index. Stronger stress in the dull soybean flowering phase (BBCH 65) resulted in significantly lower values of Fv/F0 and PI parameters in the case of cultivation in NT, as compared to RT and CT. Studies carried out by Hussain et al. [42] indicated that, under and without shading conditions, the value of the Fv/Fm is similar. On the other hand, research conducted by Khalid et al. [43], in pots, on soybean plants grown under of various shading conditions, indicated a lower value of the Fv/Fm parameter compared to the control.
In own research, soybean plants in the NT system produced leaves containing thinner palisade tissue, which resulted in a reduction in photosynthetic capacity, which reduced the provision of photosynthetic products, as pointed out by Gong et al. [20]. Gratani et al. [44] indicated that, under the conditions of different row spacing, the mutual cover of each other reduces the access to light for soybean plants and ultimately it reduces photosynthetic rate. The lowest values of LAI, SPAD (Figure 2a) as well as Fv/F0 (Figure 2b) and PI (Figure 2c) were obtained in 2017, when the growing season was very dry (k = 0.6). Under conditions of drought stress, soybean reacts with a smaller number of newly formed leaves with a smaller LAI area and a higher rate of their falling, and the Fv/Fm and PI parameters are reduced [41,45].
The analysis of gas-exchange parameters, apart from chlorophyll fluorescence, is also an important and non-invasive method of evaluating the course of the photosynthesis process [46] and it can be used in field studies of crops growing in variable tillage systems [47]. In drought conditions, the stomata are closed, which is the plant’s response to an insufficient amount of water in the soil. This process results in a reduction in the efficiency of photosynthesis as a result of the inhibition of carbon fixation in the Calvin–Benson cycle [48]. The highest values of PN, gs, and E were in the CT system, which may prove a more efficient gas exchange between the leaf and the environment in this tillage system. There were no statistically significant differences between the CT system and RT systems for the PN parameter. The decrease in PN in NT and RT to CT was 9.0 and 12.3%, respectively. In addition, the values of gs and E parameters for RT and NT systems did not differ statistically. Similarly, the research by Bojarszczuk [49] with Pisum sativum showed the lowest values (11.1 mmol CO2 m−2 s−1) of photosynthesis activity, and the decrease in PN values in the RT and NT systems compared to CT was 5.0 and 14.0%. Yao et al. [50] showed that the appropriate soil mulching and straw fertilization of soybean in the NT system compared to CT reduces the PN, E and WUE parameters (Table 5).
According to Lawlor [51], the intensity of parameters PN, gs, and E can be highly variable, which can be explained by different plant needs for photosynthesis products, depending on the development stage, variety, genetic properties of the plant and the external environment.
In our own research, the tillage systems were not differentiated by Ci parameter, but in NT was indicated the highest, 217.8 mmol CO2⋅m−2⋅s−1, and in CT the lowest, 214.7 mmol CO2 m−2⋅s−1. According to Liu et al. [52], a higher Ci value and reduction in PN in the NT system, compared to CT, may limit the access to substrates needed in the assimilation process, which affects the intensity of photosynthesis. In addition, Bojarszczuk [49] showed that, in the NT compared to the CT system, the decrease in PN in Pisum sativum leaves was associated with an increase in Ci, which consequently resulted in the closure of the stomata and decreased gs values, which was also proven in our own research with soybean.
In the CT system were indicated the lowest, by 3.8%, value of the WUE index compared to RT, and by 3.3% in the case of NT. There were no significant differences in WUE values between the RT and NT systems. Research by Bărdaş et al. [53] confirms the increase in WUE in soybean in the RT system compared to CT system, by as much as 37.0%, and this value depended on the variety and year of research. According to Lamptey et al. [54], the NT system increases the storage of water in the soil by reducing the negative effects associated with ploughing in the CT system, which include the destruction of the aggregate structure and the reduction in organic matter, which intensifies water loss. The higher values of WUE in the RT and NT systems than in CT prove a kind of compromise between CO2 uptake and H2O loss, i.e., effective water management by plants in NT, especially during a drought period [55]. In our own research, in the growing season of 2019, compared to 2018 and 2017, the gas-exchange parameters (PN, gs and E) were significantly higher (Figure 3a–d). In the extremely dry (k = 0.2) and dry (k = 0.6) years of 2017 and 2018, the WUE value was not statistically different in the RT and NT systems, and was significantly higher than in the CT system (Figure 3e). This proves that no-tillage crops (RT and NT) alleviate drought stress during the growing season of soybeans.

3.2. Protein and Fat Content
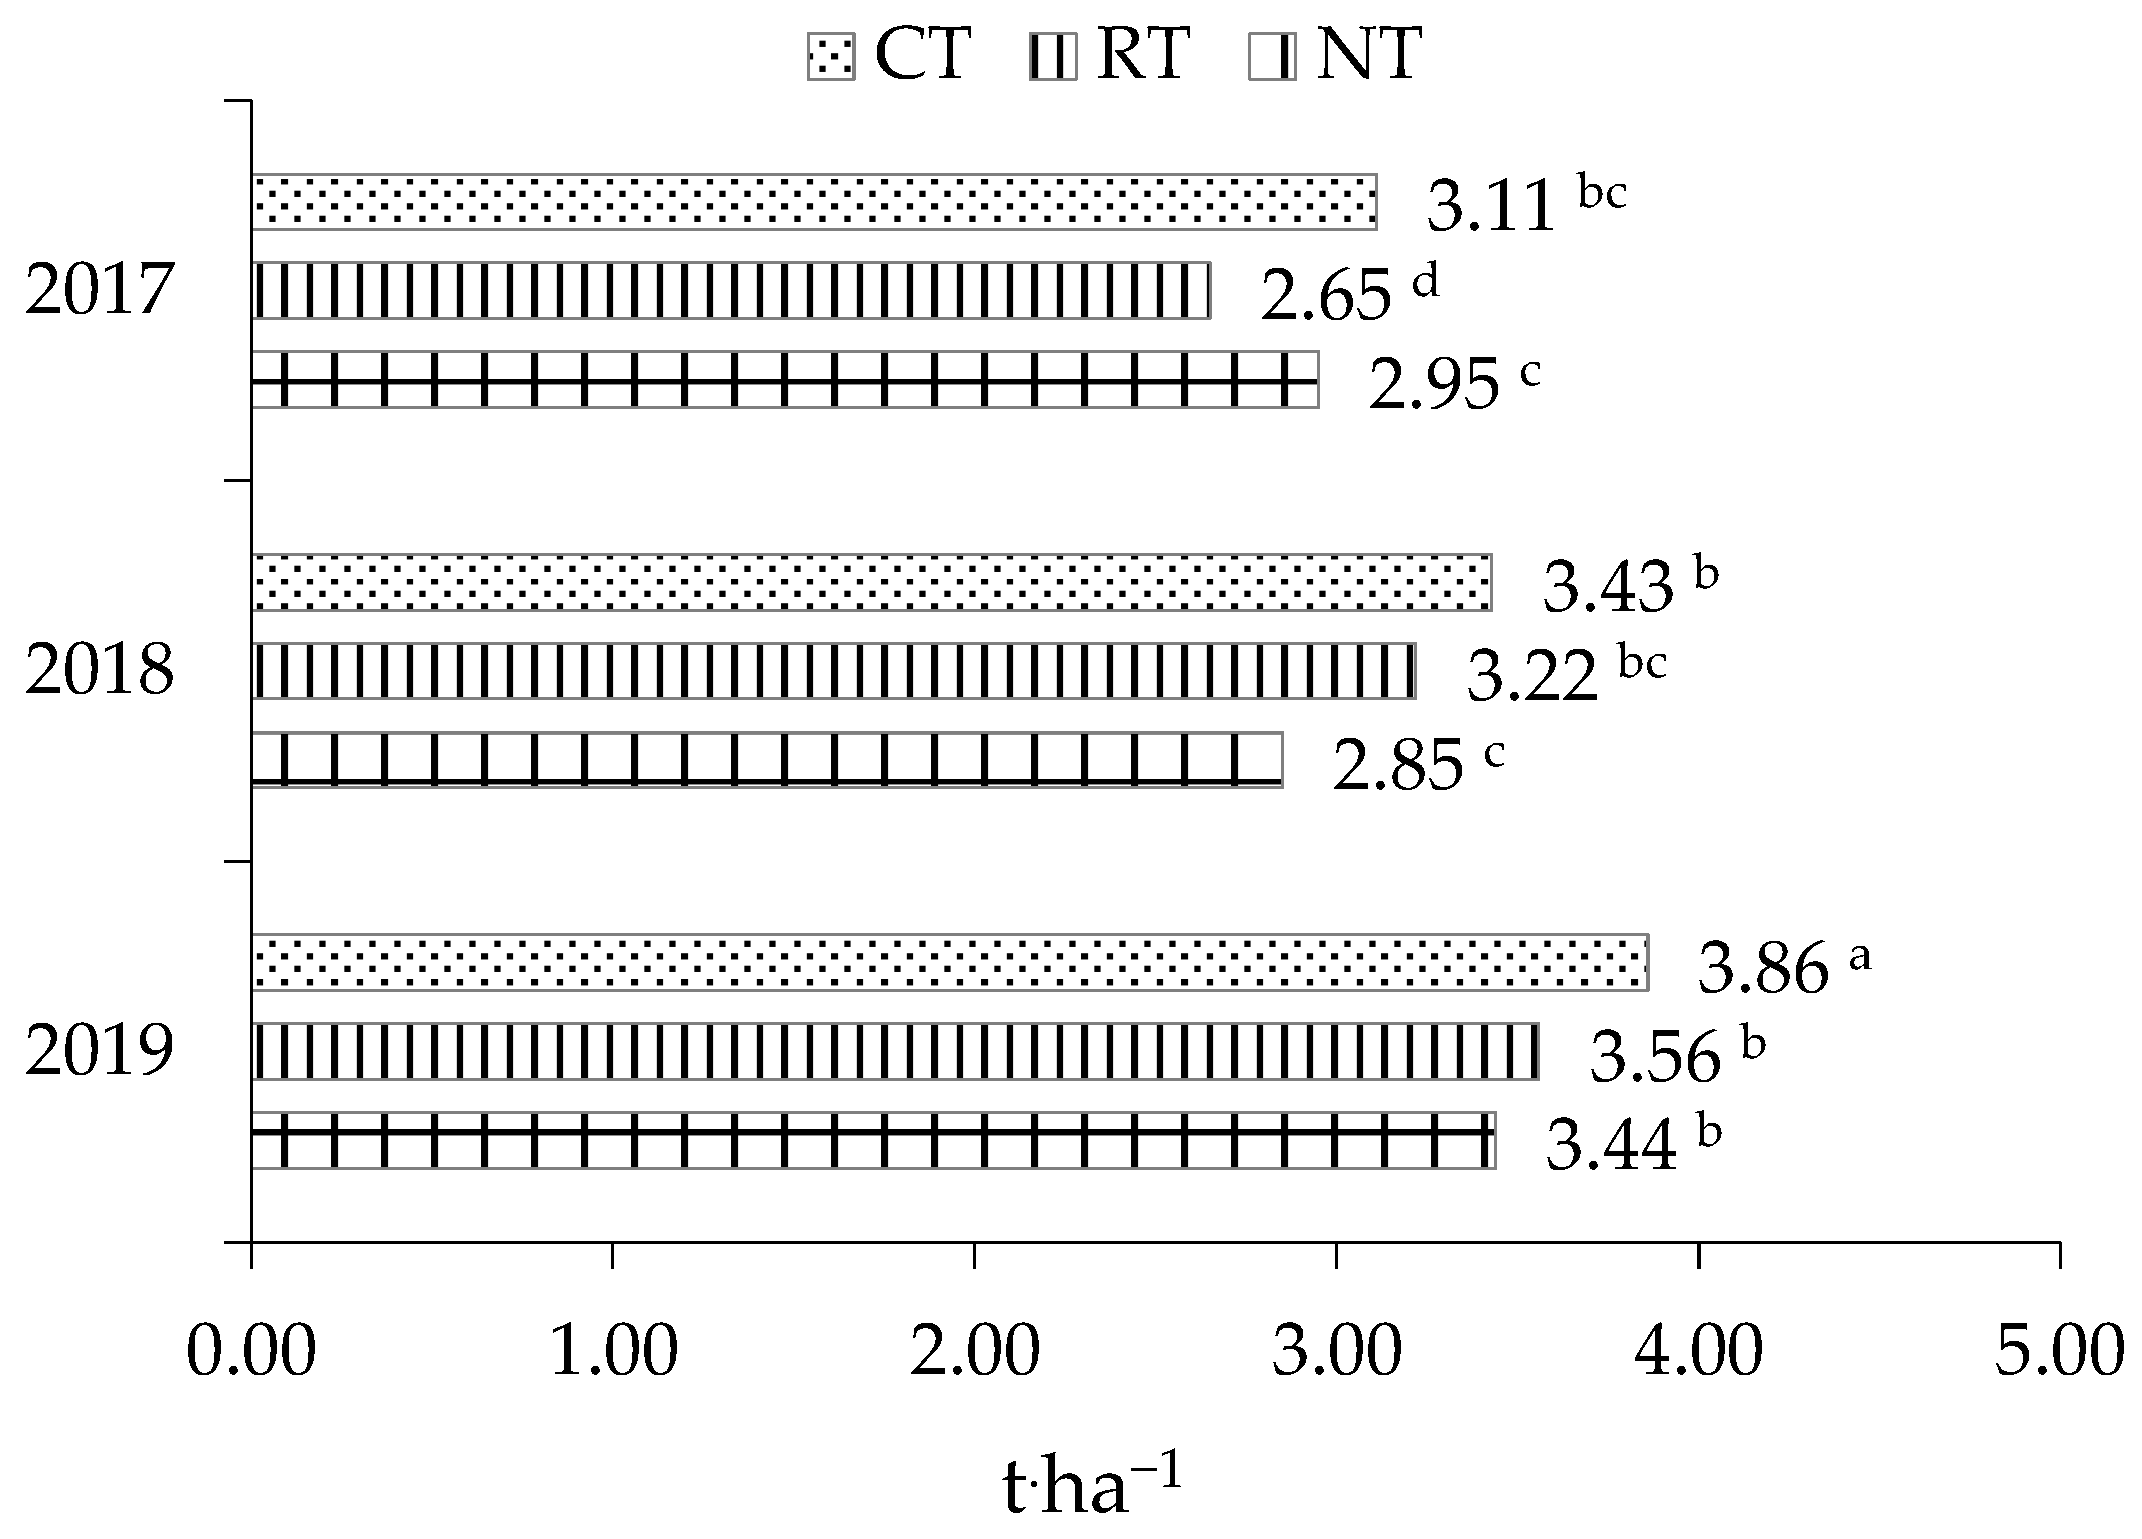
The protein and fat content of soybeans were influenced by the tillage systems. The use of CT and RT caused an increase in protein content in seeds by 4.4 and 5.5% compared to NT (Table 6).
The lowest protein content (32.6%) and the highest fat content (24.4%) were found in NT compared to CT and RT. In CT, protein yield was significantly higher than in NT. No significant differences were found in the protein yield between CT and RT and between RT and NT. Fat yield did not depend on tillage systems. Adamič and Leskovšek [9] achieved higher protein and fat content in soybeans in the CT and RT systems compared to NT system.
Research conducted by Gawęda et al. [2] showed a lower protein and higher fat content in soybean seeds in CT in relation to NT cultivated in monoculture. According to Szwejkowska [17], the protein content in legumes may be influenced by several factors, including cultivar, climatic conditions and management factors (e.g., nitrogen fertilization). Sobko et al. [10] and Popowič et al. [56] indicated that both the protein and fat content are mainly shaped by weather conditions in the years of the research, which was also confirmed by their own research. The accumulation of protein in the seeds was favoured by a higher average daily temperature and a shortage of precipitation in 2017, while the accumulation of fat was favoured by a lower average daily temperature and an increased amount of precipitation in 2019. The highest protein and fat yields were achieved in 2019.

3.3. Seed Yield

The yield of soybeans significantly depended on the tillage systems and years of research (Table 6). The highest yield was obtained in CT in compared to RT (by 4.5%) and the NT system (by 3.5%). Research conducted by Gawęda et al. [2] verified the increase in the yield of soybeans by 6.8% in the CT system compared to the NT system. Monsefi et al. [14] achieved a significantly lower value of soybean yields (up to 26.0%) in NT compared to CT, while Adamič and Leskovšek [9] achieved an average yield of 4.34 t·ha−1, which was similar in CT and RT.
The highest seed yield, 3.86 t·ha−1, was achieved in CT in 2019, when favourable thermal and precipitation conditions (k = 1.3) occurred throughout the period of pod formation and seed ripening. In 2018, the seed yield in CT was higher by 10.0% than in RT and by 13.0% than in NT. In 2017, when the period from June to September was extremely dry (k = 0.2) and dry (k = 0.6), the seed yield in CT and NT was similar and higher than in RT (Figure 4). In the case of 2017, where the period from June to September was extremely dry (k = 0.2) and dry (k = 0.6), the seed yield in CT and NT was similar and higher than in RT. According to Thiagalingam et al. [8], the higher seeds yields of soybean plants in NT can be achieved, in particular, in growing seasons characterised by lower rainfall and higher temperatures, which results in stable temperature conditions in the soil (0–15 cm layer) and better soybean emergence. Moreover, according to Fecák et al. [57], the reduction in the soybean yield in no-tillage systems (RT, NT) on heavy soils is caused by a reduction in water infiltration and nutrient absorption, and a lower soil temperature due to the soil being covered with post-harvest residues. Similar relationships were found in the research by Piper and Boote [5], where drought stress in the years of the research caused a significant reduction in soybean productivity, especially when, in the seed formation phase, the water deficit in the soil occurred.

3.4. Mineral Composition

Compared to the CT and NT, the soybean grown in RT contained more K. The differences in K content between RT and the other systems ranged from 3.2 to 3.4 g·kg−1 (Table 7). On the other hand, the NT system, compared to CT and RT, increased the P in seeds (1.6–1.8 g·kg−1). According to Rodrigues et al. [58], the absence of soil rotations in NT decreases the contact between the applied P and the soil colloids, and thus increases the availability of P to soybean plants. In addition, Fernández et al. [59] showed higher K absorption in the topsoil in NT, especially when there is periodic rainfall during the growing season. Farmaha et al. [3] reported that, in CT, excessive drying of the soil, in particular throughout the soybean ripening period, may decrease the absorption of P and K and reduce the content of these macronutrients in seeds.
In our own research, the mean Ca and Mg content were 0.8 and 2.2 g·kg−1 and were not influenced by the tillage systems. A comparable content of these elements for cv Merlin soybean was achieved by Biel et al. [16] in the organic and conventional systems, and a higher content was obtained by Szostak et al. [60], from 1.63 to 2.07 g·kg−1 Ca and from 3.20 to 3.60 g·kg−1 Mg, depending on the fertilisation dose of N. In the presented research, the content of Cu, Mn, and Zn in soybeans increased in CT > RT > NT, and Fe content decreased in NT < RT < CT. These dependencies were not statistically significant. In addition, Houx et al. [1], in soybean seeds cultivated in CT, found a significantly lower Fe content (by 7.7%), and a Zn content higher (by 5.5%) than in NT. The differences in the content of Cu and Mn between the CT and NT systems were insignificant. Biel et al. [16] showed a higher content of Mn and Cu in soybeans from the conventional than the organic system. Jarecki et al. [61], using a bacterial modifier in combination with a nitrogen dose and microelement fertilization, increased the content of Fe, and no changes in the content of Cu, Mn, and Zn in soybeans occurred. In our own conducted study, the mineral composition of soybeans was variable over the years of the experiment. In the very dry 2017 (k = 0.6) and dry 2018 (k = 0.9) years of experiment, significantly more Cu, Mn and Zn in seeds were stated [4]. In 2019 (k = 1.3), which was characterised by optimal thermal and precipitation conditions, a better accumulation of P and K in soybeans was observed, which was also observed by Houx et al. [1].

4. Conclusions

The decisive influences on the photosynthesis process and the yield and quality of soybean seeds had the variability of hydrothermal conditions in the research years and the tillage systems. More advantageous hydrothermal conditions in the research years resulted in a higher seed yield, and the better values of physiological parameters and the amount of protein in the CT system. In the NT and CT systems, with rainfall deficiencies, a similar seed yield was obtained; furthermore, the seeds contained more fat (in particular in NT), P and K. This study has presented that, in soybean cultivation, systems RT and NT may be a better option than CT, especially in regions exposed to unfavourable hydrothermal conditions during the vegetation season. The evaluation of the photosynthesis of soybean plants is, therefore, an indicator of the species’ response to various hydrothermal conditions. Moreover, the knowledge of these physiological parameters will make it easier for the producer (farmer) to decide on the choice of tillage system, but also the appropriate plant density, sowing amount, and row spacing of this species.

Author Contributions

Conceptualization, J.B. and M.J.-P.; methodology, J.B. and M.J.-P.; investigation, J.B. and M.J.-P.; writing—original draft preparation, J.B. and M.J.-P.; writing—review and editing, J.B., M.J.-P. and D.B.-J. All authors have read and agreed to the published version of the manuscript.

Funding

This study was made possible by a grant from the Polish Ministry of Agriculture and Rural Development, Project: Improving domestic sources of plant protein, their production, trading and use in animal feed, project No. HOR 3.6/2016–2020 and from financial resources of the Ministry of Education and Science to maintain the research potential of the University of Rzeszow (2022).

Institutional Review Board Statement

Not applicable.

Informed Consent Statement

Not applicable.

Data Availability Statement

Not applicable.

Conflicts of Interest

The authors declare no conflict of interest.

References

  1. Houx, J.H.; Wiebold, W.J.; Fritschi, F.B. Rotation and tillage affect soybean grain composition, yield, and nutrient removal. Field Crop Sci. 2014, 64, 12–21. [Google Scholar] [CrossRef]
  2. Gawęda, D.; Nowak, A.; Haliniarz, M.; Woźniak, A. Yield and economic effectiveness of soybean grown under different cropping systems. Int. J. Plant Prod. 2020, 14, 475–485. [Google Scholar] [CrossRef] [Green Version]
  3. Farmaha, S.B.; Fernández, G.F.; Nafziger, D.E. No-till and strip-till soybean Production with surface and subsurface phosphorus and potassium fertilization. Agron. J. 2011, 103, 1862–1869. [Google Scholar] [CrossRef]
  4. Samarah, N.; Mullen, R.; Cianzio, S. Size distribution and mineral nutrients of soybean seeds in response to drought stress. J. Plant Nutr. 2004, 27, 815–835. [Google Scholar] [CrossRef]
  5. Piper, E.L.; Boote, K.J. Temperature and cultivar effects on soybean seed oil and protein concentrations. J. Am. Oil Chem. Soc. 1999, 76, 1233–1242. [Google Scholar] [CrossRef]
  6. Wrather, J.A.; Koenning, S.R. Estimates of disease effects on soybean yields in the United States 2003 to 2005. J. Nematol. 2006, 38, 173–180. [Google Scholar] [PubMed]
  7. Wrather, J.A.; Shannon, G.; Balardin, R.; Carregal, R.; Escobar, R.; Gupta, K.G.; Ma, Z.; Morel, W.; Ploper, D.; Tenuta, A. Effect of diseases on soybean yield in the top eight producing countries in 2006. Plant Health Progress. 2010, 11, 29. [Google Scholar] [CrossRef] [Green Version]
  8. Thiagalingam, K.; Gould, N.; Watson, P. Effect of tillage on rainfed maize and soybean yield and the nitrogen fertilizer requirements for maize. Soil Tillage Res. 1991, 19, 47–54. [Google Scholar] [CrossRef]
  9. Adamič, S.; Leskovšek, R. Soybean (Glycine max (L.) Merr.) Growth yield and nodulation in the early transition period from conventional tillage to conservation and no-tillage systems. Agronomy 2021, 11, 2477. [Google Scholar] [CrossRef]
  10. Sobko, O.; Hartung, J.; Zikeli, S.; Claupein, W.; Gruber, S. Effect of sowing density on grain yield, protein and oil content and plant morphology of soybean (Glycine max L. Merrill). Plant Soil Environ. 2019, 65, 594–601. [Google Scholar] [CrossRef] [Green Version]
  11. Yu, Z.Y.; Shi, S.; Wang, S. A multi-agent model-based evolutionary model of port service value network and decision preferences. Sustainability 2022, 14, 3565. [Google Scholar] [CrossRef]
  12. De Vita, P.; Di Paolo, E.; Fecondo, G.; Di Fonzo, N.; Pisante, M. No-tillage and conventional tillage effects on durum wheat yield, grain quality and soil moisture content in southern Italy. Soil Tillage Res. 2007, 92, 69–78. [Google Scholar] [CrossRef]
  13. Hama, J.R.; Kolpin, W.D.; LeFevre, H.G.; Hubbard, E.L.; Powers, M.M.; Strobel, W.B. Exposure and transport of alkaloids and phytoestrogens from soybeans to agricultural soils and streams in the midwestern United States. Environ. Sci. Technol. 2021, 55, 11029–11039. [Google Scholar] [CrossRef] [PubMed]
  14. Monsefi, A.; Sharma, A.R.; Rang Zan, N.; Behera, U.K.; Das, T.K. Effect of tillage and residue management on productivity of soybean and physic–chemical properties of soil in soybean–wheat cropping system. Int. J. Plant Prod. 2014, 8, 429–440. [Google Scholar] [CrossRef]
  15. Toliver, D.K.; Toliver, J.A.; Larson, J.A.; Roberts, R.K.; English, B.C.; De La Torre Ugarte, D.G.; West, T.O. Effects of no-till on yields as influenced by crop and environmental factors. Agron. J. 2012, 104, 530–541. [Google Scholar] [CrossRef] [Green Version]
  16. Biel, W.; Gawęda, D.; Łysoń, E.; Hury, G. Effect of variety and agrotechnical factors on nutritive value of soybean seeds. Acta Agrophys. 2017, 24, 395–404. (In Polish) [Google Scholar]
  17. Szwejkowska, B. Effect of cultivation intensity on protein content and yields in field pea. Acta Sci. Pol. Agric. 2005, 4, 153–161. (In Polish) [Google Scholar]
  18. Vollmann, J.; Fritz, N.C.; Wagentristl, H.; Ruckenbauer, P. Environmental and genetic variation of soybean seed protein content under Central European growing conditions. J. Sci. Food Agric. 2000, 80, 1300–1306. [Google Scholar] [CrossRef]
  19. Ohnishi, S.; Miyoshi, T.; Shirai, S. Low temperature stress at different flower developmental stages affects pollen development, pollination, and pod set in soybean. Environ. Exp. Bot. 2010, 69, 56–62. [Google Scholar] [CrossRef]
  20. Gong, W.Z.; Jiang, C.D.; Wu, Y.S.; Chen, H.H.; Liu, W.Y.; Yang, W.Y. Tolerance vs. avoidance: Two strategies of soybean (Glycine max) seedlings in response to shade in intercropping. Photosynthetica 2015, 53, 259–268. [Google Scholar] [CrossRef]
  21. Huang, Z.A.; Jiang, D.A.; Yang, Y.; Sun, J.W.; Jin, S.H. Effects of nitrogen deficiency on gas exchange, chlorophyll fluorescence, and antioxidant enzymes in leaves of rice plants. Photosynthetica 2004, 42, 357–364. [Google Scholar] [CrossRef]
  22. Woo, N.S.; Badger, M.R.; Pogson, B.J.A. Rapid, non-invasive procedure for quantitative assessment of drought survival using chlorophyll fluorescence. Plant Methods 2008, 4, 27. [Google Scholar] [CrossRef] [PubMed] [Green Version]
  23. Zhou, R.; Hyldgaard, B.; Yu, X.Q.; Rosenqvist, E.; Ugarte, R.M.; Yu, S.X.; Wu, Z.; Ottosen, C.O.; Zhao, T. Phenotyping of faba beans (Vicia faba L.) under cold and heat stresses using chlorophyll fluorescence. Euphytica 2018, 214, 68. [Google Scholar] [CrossRef]
  24. Weber, F.J.; Kunz, C.; Peteinatos, G.G.; Santel, H.-J.; Gerhards, R. Utilization of chlorophyll fluorescence imaging technology to detect plant injury by herbicides in sugar beet and soybean. Weed Technol. 2017, 31, 523–535. [Google Scholar] [CrossRef]
  25. Meier, U. (Ed.) Growth Stages of Mono- and Dicotyledonous Plants. In BBCH Monograph, 2nd ed.; Federal Biological Research Centre for Agriculture and Forestry: Braunschweig, Germany, 2001; pp. 1–204. [Google Scholar]
  26. Hicks, S.; Lascano, R. Estimation of leaf area index for cotton canopies using the Li-Cor LAI 2000 plant canopy analyser. Agron. J. 1995, 87, 458–464. [Google Scholar] [CrossRef]
  27. Blackmer, T.M.; Schepers, J.S. Techniques for monitoring crop nitrogen status in corn. Commun. Soil Sci. Plant Anal. 1994, 25, 1791–1800. [Google Scholar] [CrossRef]
  28. Maxwell, K.; Johnson, G.N. Chlorophyll fluorescence—A practical guide. J. Exp. Bot. 2000, 51, 659–668. [Google Scholar] [CrossRef] [PubMed]
  29. Nobel, P.S. Physicochemical and Environmental Plant Physiology; Academic Press: Oxford, UK, 2009. [Google Scholar] [CrossRef]
  30. Kalaji, H.M.; Schansker, G.; Ladle, R.J.; Goltsev, V.; Bosa, K.; Allakhverdiev, S.I.; Brestic, M.; Bussotti, F.; Calatayud, A.; Dąbrowski, P.; et al. Frequently asked questions about in vivo chlorophyll fluorescence: Practical issues. Photosyn. Res. 2014, 122, 121–158. [Google Scholar] [CrossRef] [Green Version]
  31. AOAC. Official Methods of Analysis, 15th ed.; Association of Official Analytical Chemists: Arlington, VA, USA, 1990. [Google Scholar]
  32. Stuart, B.H. Infrared spectroscopy: Fundamentals and applications. In Analytical Techniques in the Sciences; Wiley: New York, NY, USA, 2004. [Google Scholar]
  33. Reference Base for Soil Resources 2014, Update 2015. In Word Soil Resources Reports No. 106; FAO: Rome, Italy, 2015; pp. 172–173. Available online: https://www.iuss.org/archived-content/archived-int-year-of-soils-2015/archived-working-groups-for-iys/working-group-world-reference-base-for-soil-resources-wrb/ (accessed on 4 February 2022).
  34. Skowera, B. Changes of hydrothermal conditions in the Polish area (1971–2010). Fragm. Agron. 2014, 31, 74–87. (In Polish) [Google Scholar]
  35. Peng, Y.; Gitelson, A.A. Remote estimation of gross primary productivity in soybean and maize based on total crop chlorophyll content. Remote Sens. Environ. 2012, 117, 440–448. [Google Scholar] [CrossRef]
  36. Xiong, D.; Chen, J.; Yu, T.; Gao, W.; Ling, X.; Li, Y.; Peng, S.; Huang, J. SPAD-based leaf nitrogen estimation is impacted by environmental factors and crop leaf characteristics. Sci. Rep. 2015, 5, 13389. [Google Scholar] [CrossRef] [PubMed] [Green Version]
  37. Chiozza, M.V.; Parmley, K.A.; Higgins, R.H.; Singh, A.K.; Miguez, F.E. Comparative prediction accuracy of hyperspectral bands for different soybean crop variables: From leaf area to seed composition. Field Crops Res. 2021, 271, 108260. [Google Scholar] [CrossRef]
  38. Tang, J.H.; Su, L.L.; Li, Y.J.; Xu, W.X.; Peng, J.L. Effects of different tillage methods on photosynthetic characteristics, dry matter production and economic benefit of double cropping soybean. Chin. J. Appl. Ecol. 2016, 27, 182–190. [Google Scholar]
  39. Sabo, M.; Jug, D.; Jug, I. Dynamic chloroplast pigments concentration in leaves of soybean (Glycine max [L.] Merr.) under reduced tillage. Arch. Agron. Soil Sci. 2005, 51, 291–297. [Google Scholar] [CrossRef]
  40. Murchie, H.E.; Lawson, T. Chlorophyll fluorescence analysis: A guide to good practice and understanding some new applications. J. Exp. Bot. 2013, 64, 3983–3998. [Google Scholar] [CrossRef] [PubMed] [Green Version]
  41. Badr, A.; Brüggemann, W. Special issue in honour of Prof. Reto, J. Strasser–Comparative analysis of drought stress response of maize genotypes using chlorophyll fluorescence measurements and leaf relative water content. Photosynthetica 2020, 58, 638–645. [Google Scholar] [CrossRef] [Green Version]
  42. Hussain, S.; Iqbal, N.; Brestic, M.; Raza, M.A.; Pang, T.; Langham, D.R.; Safdar, M.E.; Ahmeda, S.; Wena, B.; Gao, Y.; et al. Changes in morphology, chlorophyll fluorescence performance and Rubisco activity of soybean in response to foliar application of ionic titanium under normal light and shade environment. Sci. Total Environ. 2019, 658, 626–637. [Google Scholar] [CrossRef]
  43. Khalid, M.H.B.; Raza, M.A.; Yu, H.Q.; Sun, F.A.; Zhang, Y.Y.; Lu, F.Z.; Si, L.; Iqbal, N.; Khan, I.; Fu, F.L.; et al. Effect of shade treatments on morphology, photosynthetic and chlorophyll fluorescence characteristics of soybeans (Glycine max L. Merr.). Appl. Ecol. Environ. Res. 2019, 17, 2551–2569. [Google Scholar] [CrossRef]
  44. Gratani, L.; Catoni, R.; Pirone, G.; Frattaroli, R.A. Physiological and morphological leaf trait variations in two Apennine plant species in response to different altitudes. Photosynthetica 2012, 50, 15–23. [Google Scholar] [CrossRef]
  45. Gavili, E.; Moosavi, A.A.; Kamgar Haghighi, A.A. Does biochar mitigate the adverse effects of drought on the agronomic traits and yield components of soybean? Ind. Crop. Prod. 2019, 128, 445–454. [Google Scholar] [CrossRef]
  46. Savvides, A.M.; Fotopoulos, V. Two inexpensive and non-destructive techniques to correct for smaller-than-gasket leaf area in gas exchange measurements. Front. Plant Sci. 2018, 9, 548. [Google Scholar] [CrossRef] [PubMed] [Green Version]
  47. Buczek, J.; Migut, D.; Jańczak-Pieniązek, M. Effect of Soil Tillage Practice on Photosynthesis, Grain Yield and Quality of Hybrid Winter Wheat. Agriculture 2021, 11, 479. [Google Scholar] [CrossRef]
  48. Harrison, E.L.; Cubas, L.A.; Hepworth, J.E.G.C. The influence of stomatal morphology and distribution on photosynthetic gas exchange. Plant J. 2020, 101, 768–779. [Google Scholar] [CrossRef] [Green Version]
  49. Bojarszczuk, J. The influence of soil tillage system on changes in gas exchange parameters of Pisum sativum L. Agronomy 2021, 11, 1000. [Google Scholar] [CrossRef]
  50. Yao, X.; Li, C.; Li, S.; Zhu, Q.; Zhang, H.; Wang, H.; Yu, C.; St. Martin, K.S.; Xie, F. Effect of shade on leaf photosynthetic capacity, light-intercepting, electron transfer and energy distribution of soybeans. Plant Growth Regul. 2017, 83, 409–416. [Google Scholar] [CrossRef]
  51. Lawlor, D. Photosynthesis, productivity and environment. J. Exp. Bot. 1995, 46, 1449–1461. Available online: www.jstor.org/stable/23694991 (accessed on 1 February 2022). [CrossRef]
  52. Liu, F.L.; Christian, R.J.; Mathias, N.A. Drought stress effect on carbohydrate concentration in soybean leaves and pods during early reproductive development: Its implication in altering pod set. Field Crop. Res. 2004, 86, 1–13. [Google Scholar] [CrossRef]
  53. Bărdaş, M.; Chețan, F.; Şimon, A.; Deac, V.; Popa, A.; Oltean, V. Influence of classical and conservative tillage systems on physiological parameters and yield on soybean culture in the Transylvanian Plain. ProEnvironment 2019, 12, 208–215. [Google Scholar]
  54. Lamptey, S.; Li, L.; Xie, J.; Coulter, J.A. Tillage system affects soil water and photosynthesis of plastic-mulched maize on the semiarid Loess Plateau of China. Soil Tillage Res. 2020, 196, 104479. [Google Scholar] [CrossRef]
  55. Prior, S.S.; Runion, G.B.; Runion, B.G.; Rogers, H.H. Elevated atmospheric carbon dioxide effects on soybean and sorghum gas exchange in conventional and no-tillage systems. J. Environ. Qual. 2010, 39, 596–608. [Google Scholar] [CrossRef] [Green Version]
  56. Popović, V.; Vidić, M.; Jocković, D.; Ikanović, J.; Jaksic, S.; Cvijanoviv, G. Variability and correlations between yield components of soybean (Glycine max (L.) Merr.). Genetics 2012, 4, 33–45. [Google Scholar] [CrossRef]
  57. Fecák, P.; Šariková, D.; Cerný, I. Influence of tillage system and starting N fertilization on seed yield and quality of soybean Glycine max (L.) Merrill. Plant Soil Environ. 2010, 56, 105–110. [Google Scholar] [CrossRef] [Green Version]
  58. Rodrígues, J.L.; Gamero, C.; Fernándes, J.C.; Mirás-Avalos, J. Effects of different soil tillage systems and coverages on soybean crop in the Botucatu Region in Brazil. Span. J. Agric. Res. 2009, 7, 173. [Google Scholar] [CrossRef] [Green Version]
  59. Fernandez, F.G.; Brouder, M.S.; Volenec, J.J.; Beyrouty, A.C.; Hoyum, R. Root and shoot growth, seed composition, and yield components of no-till rainfed soybean under variable potassium. Plant Soil. 2009, 322, 125–138. [Google Scholar] [CrossRef]
  60. Szostak, B.; Głowacka, A.; Klebaniuk, R.; Kiełtyka-Dadasiewicz, A. Mineral composition of traditional non-GMO soybean cultivars in relation to nitrogen fertilization. Sci. World J. 2020, 2020, 9374564. [Google Scholar] [CrossRef]
  61. Jarecki, W.; Bobrecka-Jamro, D. Effect of fertilization with nitrogen and seed inoculation with nitragina on seed quality of soya bean (Glycine max (L) Merrill). Acta Sci. Pol. Agric. 2015, 14, 51–59. Available online: www.agricultura.acta.utp.edu.pl (accessed on 27 January 2022).
Figure 1. Weather conditions during the vegetation periods of 2017–2019.
Sustainability 14 04903 g001
Figure 2. (ac) Effect of tillage systems on SPAD and selected chlorophyll-fluorescence parameters. Means denoted by a different letter indicate significant differences according to ANOVA (followed by Tukey’s LSD test, p = 0.05). SPAD—soil plant analysis development, Fv/Fm—maximal quantum yield, PI—performance index of PS II, CT—conventional tillage; RT—reduced tillage; NT—no tillage.
Sustainability 14 04903 g002aSustainability 14 04903 g002b
Figure 3. (ae). Effect of tillage systems on selected gas-exchange parameters. Means denoted by a different letter indicate significant differences according to ANOVA (followed by Tukey’s LSD test, p = 0.05). PN—net CO2 assimilation, gs—stomatal conductance, E—transpiration rate, Ci—intracellular CO2 concentration, WUE—water-use efficiency. CT—conventional tillage; RT—reduced tillage; NT—no tillage.
Sustainability 14 04903 g003aSustainability 14 04903 g003b
Figure 4. Effect of tillage systems on seed yield. Means denoted by a different letter indicate significant differences according to ANOVA followed by Tukey’s LSD test, p = 0.0. CT—conventional tillage; RT—reduced tillage; NT—no tillage.
Sustainability 14 04903 g004
Table 1. Characteristics of the soil-tillage systems evaluated in this study.
Tillage SystemSoil Treatment
After-HarvestAutumnSpring
CTshallow plowing
(10–12 cm deep), harrowing
plowing
(25–30 cm deep)
combined tillage unit
(cultivator and string roller)
RTdisking (13–15 cm deep)combined tillage unit (cultivator and string roller)
NTglyphosate at dose
of 4.0 dm3 ha−1
no plowingsown directly into the stubble with a seeder with double disc coulters
CT—conventional tillage, RT—reduced tillage, NT—no-tillage.
Table 2. Results of soil analysis (0–60 m).
YearsPKMgFeZnMnCu
[mg kg−1]
2017203.0274.126.22277.013.8398.06.1
2018130.2181.051.22514.013.9252.16.3
201974.0251.255.72219.012.7262.86.8
P—phosphorus, K—potassium, Mg—magnesium, Fe—iron, Zn—zinc, Mn—manganese, Cu—copper. According to the methods: P, K—Egner–Riehm (0.04 mol/L C6H10CaO6); Mg—Schachtschabel (0.0125 mol/L CaCl2); Fe, Zn, Mn, Cu—Rinkis (1 mol/L HCl).
Table 3. Sielianinov’s hydrothermal index (k) in the spring–summer vegetation period.
YearMonthMean
AprilMayJuneJulyAugustSeptember
20171.25 rd1.00 d0.38 ed0.61 vd0.23 ed0.37 ed0.65 vd
20180.21 ed1.30 rd0.95 d1.87 rh0.65 vd0.36 ed0.89 d
20191.74 rh2.60 vh0.98 d0.68 vd0.85 d0.92 d1.30 rd
long term1.76 rh1.85 rh1.60 o1.58 o1.25 rd1.00 d1.51 o
Sielianinov’s index (k = (p × 10)/Σt), classification according to Skowera et al. [34]: ed/vd/d/rd–extremely dry/very dry/dry/rather dry, o—optimal, rh/h/vh/eh—rather humid/humid/very humid/extremely humid.
Table 4. Field measurements of the stand and selected chlorophyll-fluorescence indicators.
SpecificationSPADLAIFv/FmFv/F0PI
Tillage (T)
CT47.3 a5.62 a0.764 a3.44 a5.54 a
RT44.1 b4.89 b0.762 a3.37 a5.28 a
NT42.2 b5.08 b0.731a3.03 b4.22 b
Year (Y)
201740.3 b4.99 b0.766 a2.42 b4.49 b
201842.9 b5.19 ab0.701 a3.63 a5.11 b
201950.3 a5.41 a0.791 a3.79 a5.44 a
Mean44.55.200.7533.285.01
ANOVA
T*****ns**
Y**ns**
T × Y***nsns****
***, **, * and ‘ns’ indicate signifficant difference, p < 0.001, p < 0.01 and p < 0.05 and non-significant differences, respectively, according to the Tukey’s honestly significant difference (LSD) post hoc test. Different letters in columns indicate a statistical difference. SPAD—soil plant analysis development, LAI—leaf area index, Fv/Fm—maximal quantum yield of PS II, Fv/F0—maximal quantum yield of photolysis system of the donor site of PSII, PI—performance index of PS II, CT—conventional tillage; RT—reduced tillage; NT—no tillage.
Table 5. Selected gas-exchange indicators.
SpecificationPN
(μmol (CO2)
m−2 s−1)
gs
(mol (H2O)
m−2 s−1)
E
(mmol (H2O)
m−2 s−1)
Ci
(mmol L−1)
WUE
(mmol mol−1)
Tillage (T)
CT22.0 a0.611 a3.99 a214.7 a5.52 b
RT21.2 a0.543 b3.69 ab216.4 a5.74 a
NT19.3 b0.537 b3.39 b217.8 a5.71 a
Year (Y)
201720.0 b0.501 b3.45 b217.7 a5.81 a
201820.6 b0.525 b3.58 b216.2 a5.76 a
201921.9 a0.665 a4.05 a214.9 a5.41 b
Mean20.80.5643.69216.3 5.66
ANOVA
T***********
Y*****ns**
T × Y***********
***, **, * and ‘ns’ indicate signifficant difference p < 0.001, p < 0.01 and p < 0.05 and non-significant differences, respectively, according to the Tukey’s honestly significant difference (LSD) post hoc test. Different letters in columns indicate a statistical difference. PN—net CO2 assimilation, gs—stomatal conductance, E—transpiration rate, Ci—intracellular CO2 concentration, WUE—water-use efficiency, CT—conventional tillage; RT—reduced tillage; NT—no tillage.
Table 6. Selected seed-quality elements and yield.
SpecificationProtein Content
(% DM)
Protein Yield
(kg ha−1)
Fat Content
(% DM)
Fat Yield
(kg ha−1)
Seed Yield
(t ha−1)
Tillage (T)
CT34.1 a1179.0 a22.8 b794.0 a3.47 a
RT34.5 a1080.9 ab22.4 b705.6 a3.14 b
NT32.6 b998.8 b24.4 a755.3 a3.08 b
Year (Y)
201735.7 a1036.8 a22.1 c640.5 b2.90 c
201833.9 b1075.0 a23.4 b739.3 ab3.17 b
201931.6 c1146.8 a24.2 a875.1 a3.62 a
Mean33.71082.623.2751.63.23
ANOVA
T******ns***
Y***ns******
T × Ynsns**ns**
***, **, * and ‘ns’ indicate signifficant difference at p < 0.001, p < 0.01 and p < 0.05 and non-significant differences, respectively, according to the Tukey’s honestly significant difference (LSD) post hoc test. Different letters in columns indicate a statistical difference. CT—conventional tillage; RT—reduced tillage; NT—no tillage, DM—dry matter.
Table 7. The nutrient content of seeds.
SpecificationPKCaMgFeCuMnZn
[g kg−1 DM][mg kg−1 DM]
Tillage (T)
CT6.3 a15.0 b0.8 a2.0 a115.4 a20.9 a21.5 a52.1 a
RT6.5 b18.2 a1.0 a2.4 a114.9 a20.1 a20.4 a50.3 a
NT8.1 b14.8 b0.7 a2.1 a117.7 a19.8 a19.6 a49.9 a
Year (Y)
20176.4 b14.6 b0.6 a1.5 a114.3 a26.9 a24.3 a57.9 a
20187.0 b16.0 b0.8 a2.3 a117.4 a16.4 b20.4 b52.1 b
20197.5 a17.5 a1.0 a2.6 a116.2 a17.4 b16.8 c42.3 c
Mean7.016.00.82.1116.020.220.550.8
ANOVA
T****nsnsnsnsnsns
Y****nsnsns********
T × Ynsnsnsnsnsnsnsns
***, **, and ‘ns’ indicate signifficant difference ata p < 0.001, p < 0.01 and p < 0.05 and non-significant differences, respectively, according to the Tukey’s honestly significant difference (LSD) post hoc test. Different letters in columns indicate a statistical difference. P—phosphorus, K—potassium, Mg—magnesium, Fe—iron, Zn—zinc, Mn—manganese, Cu—copper, CT—conventional tillage; RT—reduced tillage; NT—no tillage, DM—dry matter.
Publisher’s Note: MDPI stays neutral with regard to jurisdictional claims in published maps and institutional affiliations.

