Article

The Impact of Environmental Uncertainty on Corporate Innovation: Evidence from Chinese Listed Companies

1
Big Data and Intelligent Decision Research Center, Hunan University of Science and Technology, Xiangtan 411201, China
2
School of Business, Hunan University of Science and Technology, Xiangtan 411201, China
3
School of Accounting, Hunan University of Technology and Business, Changsha 410205, China
*
Author to whom correspondence should be addressed.
Sustainability 2022, 14(9), 4902; https://doi.org/10.3390/su14094902
Submission received: 22 March 2022 / Revised: 17 April 2022 / Accepted: 18 April 2022 / Published: 19 April 2022

Abstract

:
Corporate innovation is an important topic in the academic community, but there are few studies on the impact of the micro operation environment on corporate innovation. Using the data of A-share listed companies in Shanghai and Shenzhen from 2009 to 2020, this paper examines the impact of environmental uncertainty on enterprise innovation from a micro perspective. The results show that there is an overall negative correlation between environmental uncertainty and corporate innovation. Companies facing a higher degree of environmental uncertainty are more cautious in their innovation investment. We also find that this negative correlation was more pronounced in companies with weaker risk-taking ability. Further research finds that financing constraints have a partial intermediary effect on the impact of environmental uncertainty on innovation, that is, environmental uncertainty can have a negative impact on innovation by increasing the financing constraints faced by corporations. Our research provides micro-level evidence for the impact of uncertainty on corporate innovation.

1. Introduction

It has become the consensus of all countries to accelerate scientific and technological innovation and improve the competitiveness of corporations and even countries. China, for example, is at a critical stage of accelerating the transformation of its economic development model, optimizing its economic structure and transforming its growth drivers. It is also at a crucial stage of overcoming the “middle-income trap”. In this context, China urgently needs to use innovation to lead development and boost economic transformation. Endogenous growth theory points out that the driving force of national economic growth mainly comes from investment in human capital, innovation. and knowledge [1]. The corporation is an important micro subject of innovation implementation. In the increasingly fierce market competition, technological innovation is an inevitable choice for corporations to maintain competitive advantages and achieve high-quality economic development. However, China is in the period of economic transformation, and corporate investment is facing extensive uncertainty. Since the global financial crisis in 2008, in response to the economic fluctuation, the government introduced a series of fiscal and monetary policies that frequently exacerbated the economic policy of uncertainty [2]. At the same time, under the trend of accelerating the adjustment of the industrial structure, the pressure of enterprises from competitors and market demand increased. In particular, the outbreak of COVID-19 in 2020 has increased the burden of survival and the transformation of many corporations, and a large number of corporations urgently need to solve the problems of the resumption of work and production and capital repayment [3]. All of these factors aggravate the uncertainty of the operation environment, and then seriously affect the investment decisions of corporations. Therefore, it is of great practical significance to understand the impact of uncertain factors on corporate innovation.
The existing literature shows that the uncertainty faced by corporations mainly comes from both the macro and micro levels, and the uncertainty at the macro level includes changes in economic policies and changes in national politics [4,5]; Uncertainties at the micro level mainly come from the micro operation environment, including cash flow fluctuation, stock price fluctuation, sales change and so on [6,7,8,9]. Scholars have done corresponding research on the impact of uncertainty on enterprise innovation. He et al. [2] used the economic policy uncertainty index compiled by Huang et al. [10] to find that economic policy uncertainty has a significant positive impact on corporate innovation. They also found that in the period of low environmental productivity, corporate innovation activities increased significantly, while in the period of high environmental productivity, corporate innovation activities decreased significantly. The EPU Index developed by Guan et al. [11] using Steven et al. [12] also found that EPUs increased corporate innovation input and innovation efficiency. Some scholars have also discussed the perspective of political uncertainty. Cao et al. [13] found that the mobility of provincial leaders will improve the innovation performance of corporations, and Pertuze et al. [14] also found that the unexpected departure of national leaders increases the value of patents, thus having a positive impact on innovation. It is worth pointing out that the aforementioned research only focuses on the macro-level, while the environmental uncertainty at the micro-level has not been paid attention to.
Govindarajan [15] argues that environmental uncertainty refers to the unpredictability of the behavior of customers, suppliers, competitors, and regulatory groups, which is essentially a micro category. Compared with the uncertainty at the macro-level, the environmental uncertainty at the micro-level is closer to the operating environment of the corporation, which can reflect the dynamic and complexity of the business environment. For example, when studying the impact of economic policy uncertainty on firm behavior, most of the above scholars use the same EPU index for individual firms, which means that the economic policies faced by all firms in the same year are determined, and this is often unrealistic. On the other hand, corporations are often able to respond dynamically when facing the uncertainty of micro environment, so it emphasizes so it emphasizes that we should discuss from the enterprise itself. In addition, some scholars pointed out that the fluctuation at the macro level will eventually be transmitted to the micro level [16]. Therefore, this paper follows the definition of environmental uncertainty by Govindarajan [15] and further explores the impact of environmental uncertainty on corporate innovation at the micro-level.
The available literature also focuses primarily on the impact of environmental uncertainty on physical capital investment and draws inconsistent conclusions. On the one hand, environmental uncertainty increases the difficulty of managers to process information, making it difficult for management to identify good investment projects, so when faced with high uncertainty, management is likely to adopt a “wait-and-see” attitude and choose to invest cautiously [17,18,19,20]. On the other hand, higher environmental uncertainty makes it more difficult for companies to monitor management behavior, which provides an opportunity for management to pursue private gains through inefficient investments [16], so uncertainty can lead to an increase in physical investment. But in theory, corporate innovation is more sensitive to environmental uncertainty than traditional physical capital investment. Corporate innovation has the characteristics of large investment amounts, long sustainability, high irreversibility, and high sunk costs will be incurred once innovation fails [21], so rising environmental uncertainty may lead companies to postpone innovation investment to reduce losses. In addition, rising environmental uncertainty has sent an unfavorable signal to the capital markets, leading to an increase in the cost of external financing for corporations [22], which in turn has harmed corporate innovation.
We chose Chinese-listed companies as research objects for the following reasons: First, technological innovation is considered to be the critical engine of economic growth. At present, China is in the critical period of economic transformation and China’s low-cost advantage in the world is gradually disappearing. The traditional growth model of the “investment driven economy” is no longer applicable, and economic growth is in urgent need of innovation and empowerment, and economic growth is in urgent need of innovation and empowerment. In this context, China proposes to “deeply implement the innovation driven development strategy”, emphasizing institutional innovation and accelerating endogenous development. Therefore, China’s listed companies are ideal research objects. Second, in recent years, the proportion of China’s R&D expenditure in GDP has gradually increased, and the number of patent applications ranked first in the world in 2019. However, China is still the largest developing country in the world, and its independent innovation ability still lags behind that of developed countries. Therefore, the discussion on the innovation of Chinese enterprises under environmental uncertainty can also provide some reference for the study of other developing countries. Third, most of the current research results on innovation come from developed economies such as the United States, but due to differences in social systems, the research conclusions may not be applicable to China. An important point is that China’s financial market is not yet mature, and there is “ownership discrimination” and “scale discrimination” in bank credit [23,24,25], which also provides an idea for us to study the heterogeneity of the impact of environmental uncertainty on corporations.
The contribution of this study is mainly reflected in the following aspects: First, it further discusses the impact of environmental uncertainty on corporate innovation. The existing literature mainly examines the impact of uncertainty at the macro level on corporate innovation [2,14], while at the micro level it mainly studies the impact of environmental uncertainty on real investment, but is less involved in the impact on firm innovation. Starting from a microscopic perspective, this paper explores the micro-mechanism of environmental uncertainty affecting corporate innovation, and enriches the understanding of environmental uncertainty and corporate innovation. Second, most of the existing theoretical achievements on uncertainty are based on the institutional background of developed countries. This paper takes Chinese listed companies as the research object and provides evidence from emerging markets on the impact and consequences of environmental uncertainty. Thirdly, this paper not only studies the direct impact of environmental uncertainty on corporate innovation, but also verifies that environmental uncertainty can affect innovation through indirect channels of financing constraints, which is a supplement to the research in related fields.
The arrangement of this paper is as follows: Section 2 presents the research hypothesis. Section 3 introduces the research design. Section 4 analyzes the empirical results, and Section 5 concludes the paper.

2. Literature Review and Hypothesis Development

As the cornerstone of the survival and development of the organization, the operation environment is an important factor affecting the decision-making behavior of the corporation. In China, which is in a transition period of its economic system, the market environment is becoming more and more complex, and it is more and more difficult to obtain information. The operation of enterprises is facing more extensive environmental uncertainty. Environmental uncertainty will mainly affect corporate innovation from the following aspects. First, environmental uncertainty reinforces management’s risk-averse motivations. High environmental uncertainty weakens the ability of managers to predict information, and it is difficult for managers to predict and judge the returns of innovative projects, so in order to avoid the risk of investment failure, managers are more inclined to take a “wait-and-see” attitude and choose to invest cautiously [17], thereby reducing the scale of investment. Moreover, corporate innovation depends on the stability of internal cash flow, and rising environmental uncertainty often leads to fluctuations in future earnings and cash flow [26,27], so the management will be more cautious when investing in innovation activities over the long cycle and with high uncertainty in order to reduce losses, resulting in the reduction of innovation investment.
Second, the real option theory holds that due to the irreversibility of the investment, the firm will weigh the profit difference between the current and future investments to make the optimal investment decisions, uncertainty increases the value of the waiting option, and the firm may postpone or reduce the current investment to avoid future losses [28]. Innovation activities usually have a long cycle and are more irreversible than capital investment, which leads to corporations facing high adjustment costs, so the value of waiting options is more important. In order to avoid the loss caused by the interruption of innovation activities, enterprises are more likely to reduce innovation investment in the face of environmental uncertainty.
In addition, the financing environment is also an important factor affecting corporate innovation activities. Environmental uncertainty increases the idiosyncratic risk of corporations [29], and external investors need to compensate for their risk with a higher capital premium [3], which leads to higher external financing costs for companies [28]. Liao [30] and Wang and Chen [31] find that environmental uncertainty raises the cost of equity capital and the cost of debt capital for corporations. Moreover, the rise in environmental uncertainty will also lead to serious information asymmetry problems, since in order to reduce the risk of default, commercial banks and other financial institutions usually reduce the supply scale of credit funds, which further weakens the financing ability of enterprises and intensifies the financing constraints of enterprises. The financing difficulties will also make enterprises more cautious in innovation investment. Based on the above analysis, we propose the following assumptions:
Hypothesis 1.
There is a negative correlation between environmental uncertainty and corporate innovation.
In addition, corporate innovation requires a large amount of capital investment and is often accompanied by a high risk of failure [32]. Therefore, whether an enterprise carries out innovation and how many resources are mobilized for innovation are also related to the corporation’s risk-taking ability [33]. When environmental uncertainty rises, corporations with strong risk-taking ability can still make full use of internal and external resources (such as the internal cash and bank enterprise relationship) to alleviate the problem of insufficient innovation investment, without excessive worry about the losses caused by innovation failure. Therefore, their sensitivity to environmental fluctuations is relatively low. However, when facing the risk of environmental uncertainty, corporations with weak risk-taking ability may not be able to ensure sufficient cash flow to promote R&D projects, which makes it easy to interrupt innovation activities and bring huge losses to the corporation. Thus, such corporations are more sensitive to environmental fluctuations and will be more cautious in corporate innovation. Through the above analysis, we believe that for corporations with different risk-taking ability, the impact of environmental uncertainty on corporate innovation is different, so we propose the following assumptions:
Hypothesis 2.
Compared with corporations with strong risk-taking ability, the negative correlation between environmental uncertainty and corporate innovation is more obvious in corporations with weaker risk-taking abilities.

3. Research Design

3.1. Sample Selection and Data Sources

This paper selects the data of A-share listed companies in the Shanghai and Shenzhen stock markets from 2009 to 2020 and adds the following processing to the data: (1) exclude the sample of financial companies; (2) eliminate the company samples subject to ST (companies that have suffered losses for two consecutive years and have been specially treated), * ST (companies that have suffered losses for two consecutive years and have been warned of delisting risks) and PT (companies suspended from listing) during the observation period; (3) exclude the sample of insolvent companies; (4) exclude the company samples with missing main variables. We then end up with 15,096 samples. The financial data required for the research comes from CSMAR (The China Stock Market & Accounting Research) database. In order to reduce the impact of outliers, we shrunk the tail of the 1% and 99% quantiles for all continuous variables at the company level.

3.2. Variable Definition and Description

3.2.1. Corporate Innovation (rd)

The existing literature mainly measures enterprise innovation from enterprise innovation investment and innovation output. This paper mainly focuses on the management’s response strategies and countermeasures in the face of environmental uncertainty. Therefore, we use the natural logarithm of R&D investment to represent corporate innovation. In addition, we also use the number of patent applications as an alternative variable for a robustness test.

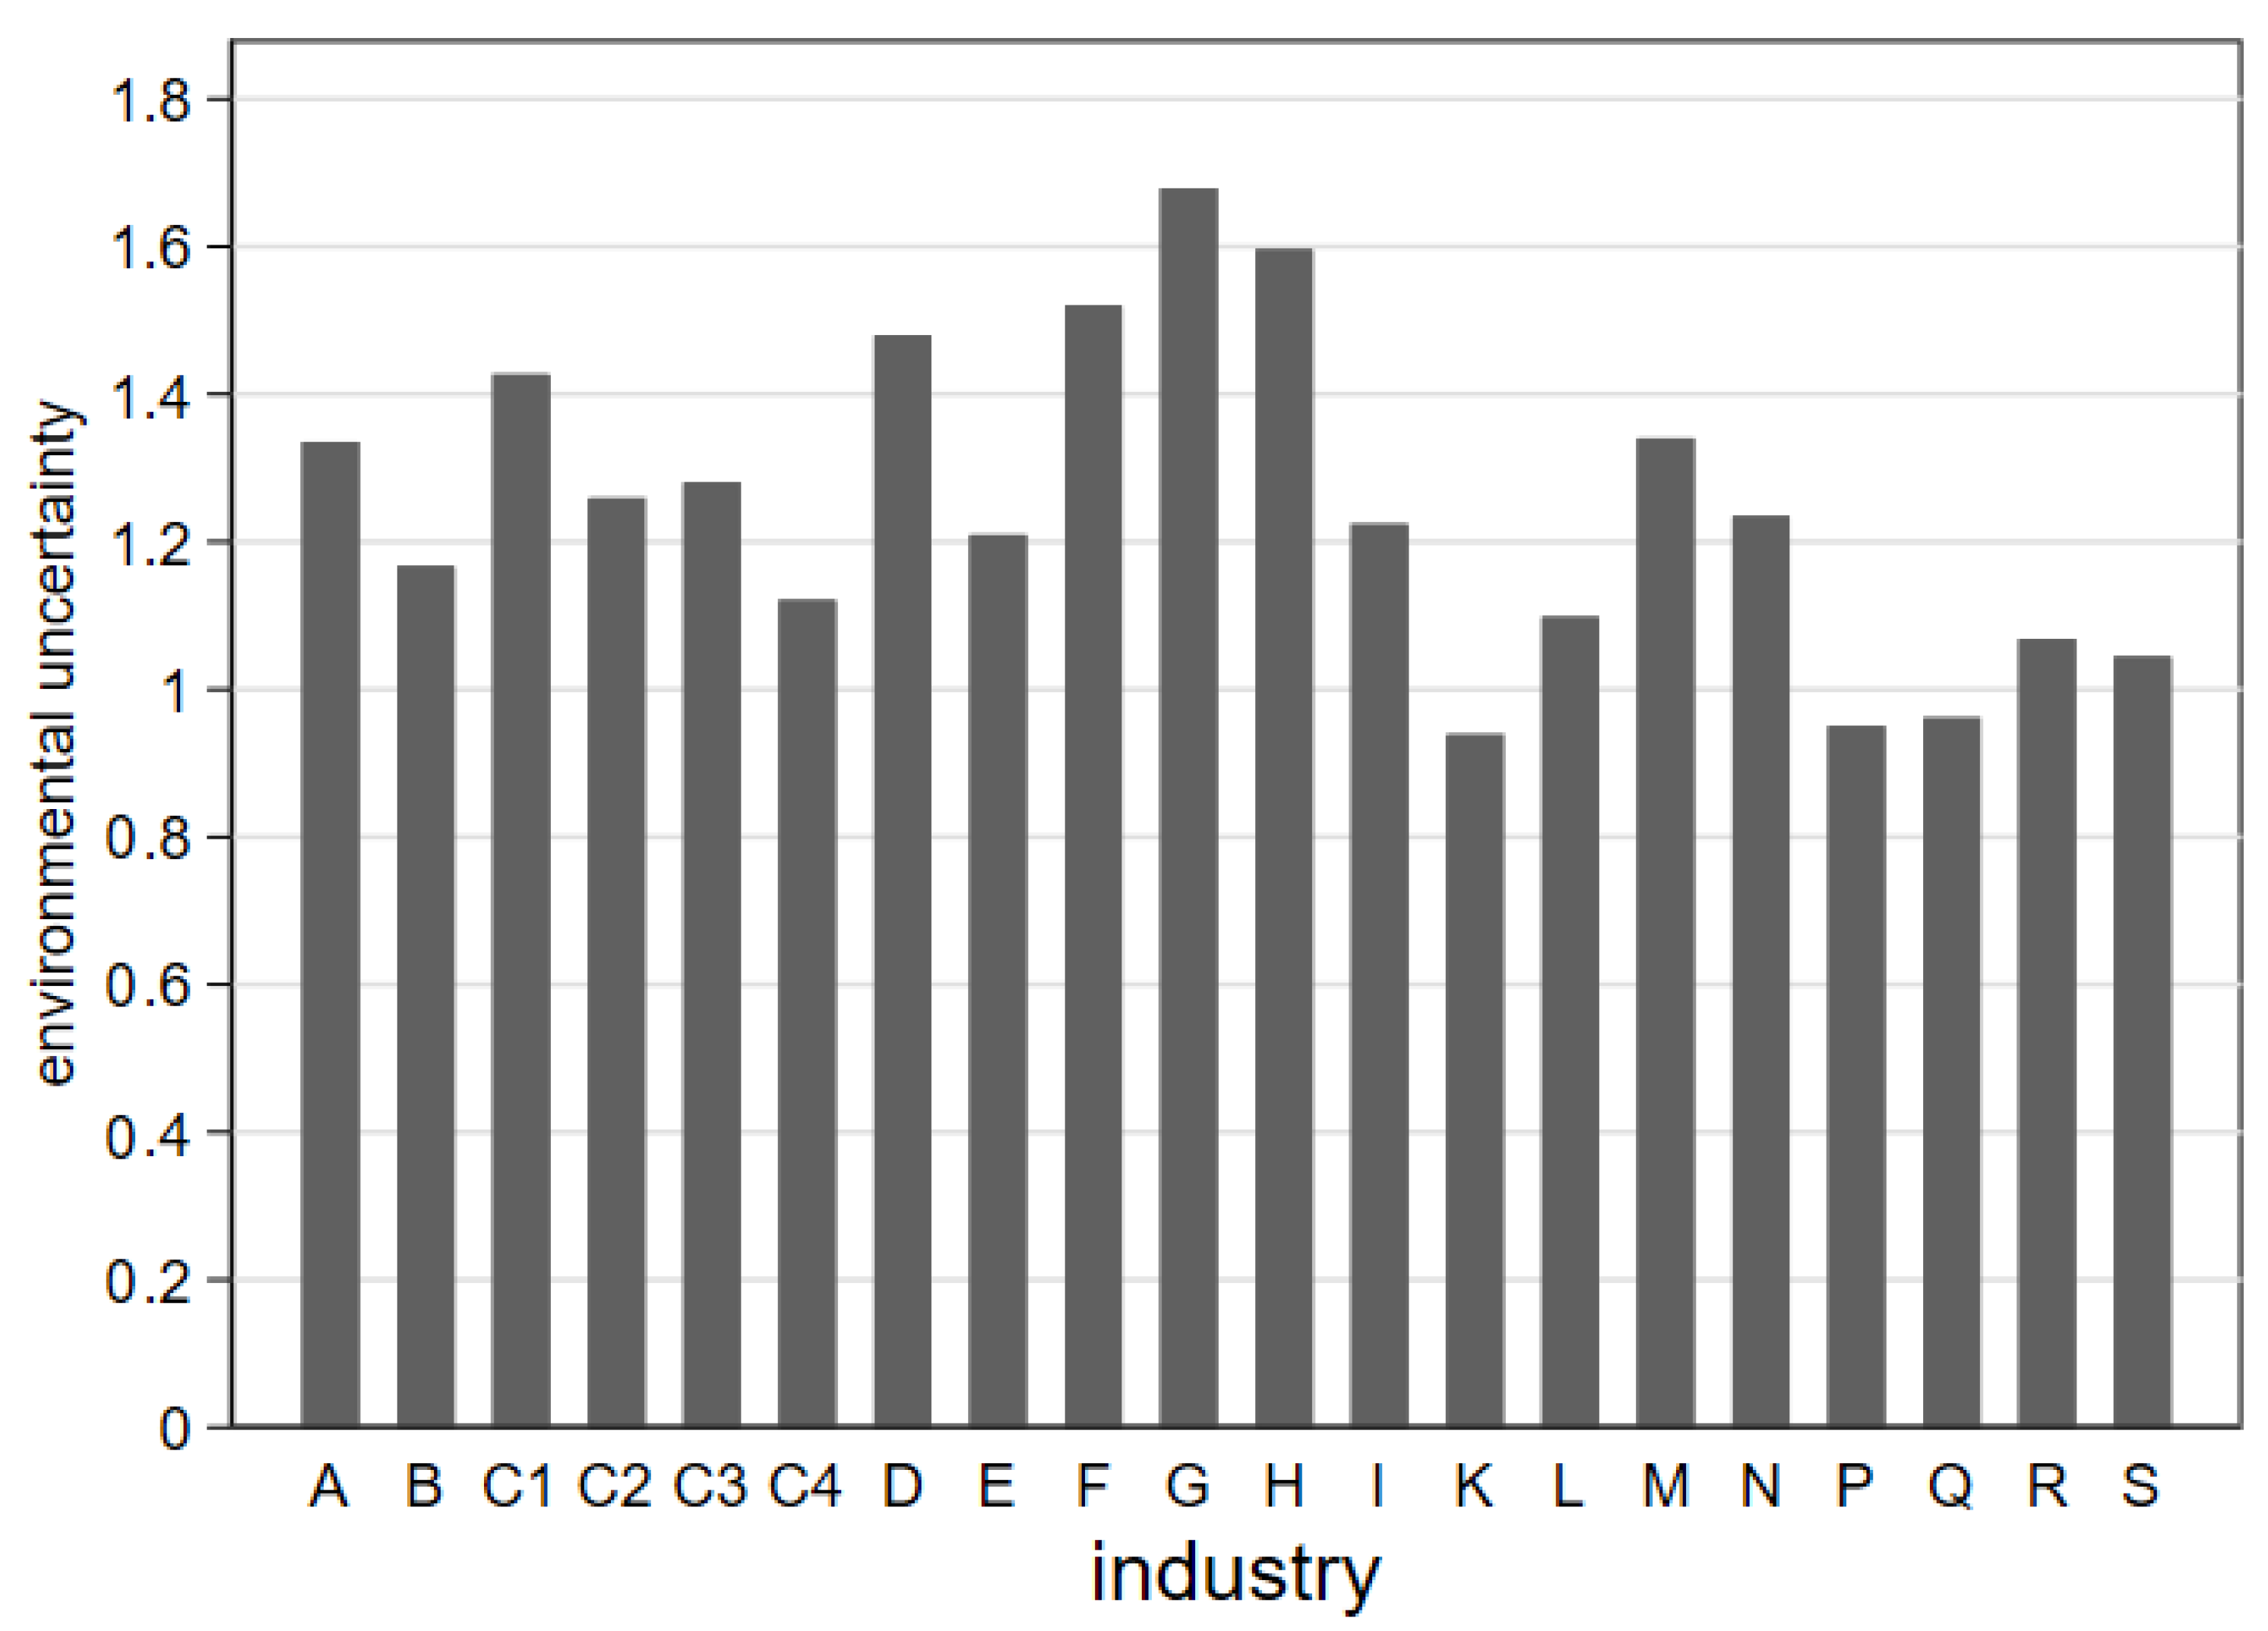
3.2.2. Environmental Uncertainty (eu)

At present, there are two main ways to measure environmental uncertainty in the existing literature. The first is to use subjective indicators. This kind of method regards environmental uncertainty as the perceived behavior of senior managers, and the measurement method is the amount of uncertainty perceived by managers, which is obtained through the method of survey questionnaire (such as a Likert scale), referring to Duncan [34] and Tan [35]. The second measurement method is to use objective indicators, such as sales revenue, EBIT, etc., with reference to Tosi et al. [36], and Ghosh and Olsen [26]. There are two main drawbacks in measuring environmental uncertainty through the questionnaire survey of managers: (1) The managers’ judgment is not objective enough and subjective randomness is relatively large, which may not truly reflect the environmental uncertainty of enterprises; (2) Due to the limitation of investable objects, this method is more suitable for small sample research, so its reliability is weak. In terms of objective indicators, since sales revenue is less affected by the company’s financing and investment decisions than EBIT, it is more suitable to measure the enterprise’s performance in the product market [16]. The fluctuation of sales revenue means the fluctuation of the market environment, which then reflects the uncertainty of the corporation’s operational environment. Bergh and Lawless [37] also argue that environmental uncertainty is rooted in changes in the external environment, which ultimately affects the level of corporate activities and leads to fluctuations in sales revenue.
Referring to the practices of Ghosh and Olsen [26], and Shen et al. [16], we use the fluctuation of the company’s sales revenue to measure the environmental uncertainty. Specifically, we first use the following ordinary least squares method to estimate the abnormal sales revenue of the company in the past five years:
S a l e = φ 0 + φ 1 Y e a r + ε
In model (1), Sale represents sales revenue, and Year represents the annual variable. If the observed value is in the past fourth year, then the value of Year is 1, and if the observed value is in the current year, then the value of Year is 5, and the residual error ε represents the abnormal sales revenue. Then, we calculate the standard deviation of the company’s abnormal sales revenue for the past five years and divide it by the average value of the sales revenue in the past five years to obtain the unadjusted sales revenue volatility. Finally, we take the median of the annual unadjusted sales revenue volatility of each industry as the industrial environmental uncertainty, and then divide the annual sales revenue volatility of the enterprise by the industrial environmental uncertainty so as to obtain the environmental uncertainty (eu) of each company after eliminating the impact of the industry.

3.2.3. Risk-Taking Ability

A company’s risk-taking ability reflects its ability to respond to unknown risks. There are currently two main ways to measure risk-taking ability: The first is based on the results obtained by a questionnaire survey [38], and the second is to use the relevant variables of company traits [33,39]. Considering the subjectivity of the questionnaire, we use the relevant variables of company characteristics to measure the risk-taking ability with reference to Rao and Xu [39] and Lou et al. [33]. Specifically, we use the following three indicators as proxy variables: property right nature, company scale, and profitability.
Firstly, in China, state-owned companies are often implicitly guaranteed by the government, with the convenience of having the advantage of debt financing [40,41]; state-owned companies usually have lower loan costs and more tax subsidies, which makes them have strong risk-taking ability. Therefore, even when environmental uncertainty leads to higher financing costs for companies, state-owned companies still have natural financing advantages. Therefore, compared with non-state-owned companies, state-owned companies are less sensitive to environmental fluctuations. We value state-owned companies to 1 and non-state-owned companies to 0.
Secondly, the operation and management of large-scale companies are often relatively perfect, and they often have a stronger ability to disperse risks in the face of uncertain factors. Walls and Dyer [42] argue that large-scale companies can diversify their risks through diversified portfolios so as to reduce the adverse effects of price fluctuations and political risks. This practice confirms the logic of “don’t put all of your eggs in the same basket”. It also shows that large-scale companies often have a strong dynamic adjustment ability to deal with potential uncertain factors. Therefore, compared with small-scale enterprises, large-scale enterprises have higher risk-taking ability. We divide this by the median of the natural logarithm of total assets in the same year. Large scale enterprises are those higher than the median, and the value is 1. Those below the median are small-scale enterprises, with a value of 0.
In addition, companies with higher profitability will perform better in terms of increasing income and saving funds, and will also perform better in stabilizing cash flow. Therefore, they have stronger risk-taking ability and are less sensitive to environmental fluctuations. On the contrary, companies with low profitability may have greater operational risks and the possibility of acquisition increases. Therefore, in order to prevent the further expansion of losses, the management often postpones or rejects high-risk projects in the face of high environmental uncertainty, which makes enterprises with weak profitability more sensitive to environmental changes. We calculate the average of roa in the past three years by a company as the adjusted roa, and those above the annual median are high-profitability corporations with a value of 1, while those below the annual median are low-profitability corporations with a value of 0.

3.2.4. Control Variables

Referring to existing studies, we set the following control variables: Profitability (roa), Growth (grow), Corporate leverage ratio (lev), Capital intensity (fixed), Investment opportunity (tobinq), Company scale (size), Ownership concentration (shrcr1), Board size (board), and Proportion of independent directors (indep). In addition, annual and industry effects are controlled. The specific description of variables is shown in Table 1.

3.3. Model Specification

We constructed the following multiple regression model to verify the above hypothesis:
r d = α 0 + α 1 e u + α 2 r o a + α 3 g r o w + α 4 l e v + α 5 f i x e d + α 6 t o b i n q + α 7 s i z e + α 8 s h r c r 1 + α 9 b o a r d + α 10 i n d e p + α j i n d u s t r y + α k y e a r + ε
In model (2), according to Hypothesis 1, we predict α1 < 0, indicating that environmental uncertainty has a negative impact on corporate innovation. At the same time, we conduct a grouping regression according to Hypothesis 2. We expect that the absolute value of α1 in the high risk-taking ability group is less than the absolute value of α1 in the low risk-taking ability group, which indicates that the impact of environmental uncertainty on corporate innovation is more obvious in enterprises with low profitability.

4. Analysis of Empirical Results

4.1. Descriptive Analysis

According to the above calculation method, we report the environmental uncertainty index and the average value of R&D investment in various industries in Figure 1 and Figure 2.
As can be seen from Figure 1, the industries greatly affected by environmental uncertainty are railway transportation, storage and postal (G), accommodation and catering (H), wholesale and retail (F), electricity, heat, gas and water production and supply (D), and food, textile and leather manufacturing (C1). Sectors less affected by environmental uncertainty are real estate (K), education (P) and health and social work (Q). As can be seen from Figure 2, R&D investment varies significantly by industry. Industries with high R&D investment are construction (E), information transmission, software and information technology services (I), and non-metal, metal and mechanical equipment manufacturing (C3). The sector with low R&D spending was accommodation and catering (H).
Table 2 reports descriptive statistics for the main variables. The mean value of eu is 1.284, the median is 0.953, and the standard deviation is 1.281, indicating that the degree of environmental uncertainty faced by different individuals varied greatly, and this index is distributed in a right-biased way. The standard deviation of rd is 1.623, indicating that R&D investment varies greatly among different individuals. The mean value and median value of roa are 0.032, indicating that the overall profitability of the company is good. The mean value and median value of lev are 0.442 and 0.439, respectively, indicating that the overall debt ratio of the corporation is at a reasonable level. No outliers are found in other variables.

4.2. Correlation Analysis

Table 3 reports the Pearson correlation coefficients of all variables. On the whole, the correlation coefficient between variables is small, indicating that the existence of multicollinearity in the regression model is less likely. The coefficient of eu and rd is −0.091, which is significant at least at the 1% level, indicating that the higher the degree of environmental uncertainty is, the lower the innovation input is when the influence of other factors is not taken into account. Hypothesis 1 is preliminarily satisfied. In addition, this paper divided the samples into 10 groups according to eu from small to large, and the changes of the mean rd of each group are shown in Figure 3. It can be seen that environmental uncertainty is negatively correlated with innovation input on the whole. As the degree of environmental uncertainty increases, corporate innovation input decreases, which also conforms to the expected results of Hypothesis 1.

4.3. Analysis of Basic Regression Results

4.3.1. The Impact of Environmental Uncertainty on Corporate Innovation

Table 4 reports the regression results of environmental uncertainty and corporate innovation. Column (1) does not control for year and industry effects, and column (2) controls for year and industry effects. We find that after controlling for the relevant variables, the regression coefficient between environmental uncertainty and corporate innovation is −0.1088, which is significant at the level of 1%. In terms of economic significance, every time eu increases by one unit, rd decreases by about 10.88 percentage points. This result supports the prediction of Hypothesis 1 that environmental uncertainty will have a negative impact on corporate innovation. With the increase of environmental uncertainty, it is more difficult for corporations to predict the return of innovation investment in the future. In addition, external financing becomes more difficult. In order to reduce possible losses, management will choose prudent investment and then reduce the level of innovation investment. In column (2), roa, grow, tobinq and size are significantly positively correlated with rd, indicating that strong profitability, high growth, good investment opportunities and large company scale can promote corporate innovation. lev, fixed and shrcrl are significantly negatively correlated with rd, indicating that high debt ratio, high fixed asset ratio and high equity concentration are not conducive to corporate innovation. These conclusions are basically consistent with the results of the existing literature.
In addition, we also study the impact of different degrees of environmental uncertainty on innovation, and reported the results in columns (3) and (4). We rank eu from small to large, and define the last 25 percentile of eu as high environmental uncertainty and the first 25 percentile as low environmental uncertainty. The results of grouping regression showed that there is a significant negative correlation between eu and rd in the high environmental uncertainty group, while the coefficient of eu and rd is negative but not significant in the low environmental uncertainty group. The above results show that corporations facing higher environmental uncertainty are more likely to reduce or delay innovation investment.

4.3.2. Heterogeneity Analysis

Table 5 reports the regression results of environmental uncertainty and corporate innovation based on companies with different risk-taking abilities. Columns (1) and (2) distinguish different property rights, columns (3) and (4) distinguish different company sizes, and columns (5) and (6) distinguish different profitability. We can see that the impact of environmental uncertainty on corporate innovation is different in different groups. In the property right group, the eu coefficient of state-owned companies is −0.1046, which is significant at the level of 1%, and that of non-state-owned listed companies is −0.1235, which is also significant at the level of 1%, indicating that environmental uncertainty has a significant negative impact on both state-owned and non-state-owned listed companies. However, the negative impact is even greater for non-state-owned listed companies with low risk-taking ability. In the company size group, small corporations are more sensitive to environmental changes due to their weak dynamic adjustment ability, which leads to a negative effect of environmental uncertainty on the innovation of small companies. Similarly, in the profitability group, environmental uncertainty also has a negative impact on the innovation of enterprises with different profitability, but corporations with low profitability have weak risk-taking ability. The above results support Hypothesis 2, that is, that negative correlation between environmental uncertainty and corporate innovation is more obvious in corporations with weaker risk-taking abilities.

4.4. Further Discussion: The Mediating Effect of Financing Constraints

The previous analysis shows that environmental uncertainty can make it more difficult for management to forecast the return on investment; in order to reduce losses, management tends to reduce or postpone investment in innovation. On the other hand, we should also pay attention to the idiosyncratic risk that may be generated by environmental uncertainty; the research of Hua and Xu [29] shows that environmental uncertainty will lead to the rise of cash flow fluctuation and the decline in the quality of accounting information, which will positively promote the idiosyncratic risk of the company. When idiosyncratic risks exist, investors need to compensate for their risk with a higher capital premium, resulting in an increase in the cost of external financing for corporations [28]. Moreover, the information asymmetry caused by environmental uncertainty will lead financial institutions to be more cautious in lending. In order to reduce risk exposure, bank loans will be reduced [43]. Financing difficulties also inhibit the improvement of the corporate innovation level. Therefore, we infer that environmental uncertainty will not only directly inhibit innovation but also indirectly inhibit innovation by exacerbating the degree of financing constraints faced by corporations. In order to test the path of “environmental uncertainty—financing constraints—corporate innovation”, we set up the following intermediary effect model with reference to the method of Baron and Kenny [44]:
r d = α 0 + α 1 e u + α i c o n t r o l + α j i n d u s t r y + α k y e a r + ε
k z = β 0 + β 1 e u + β i c o n t r o l + β j i n d u s t r y + β k y e a r + ε
r d = γ 0 + γ 1 e u + γ 2 k z + γ i c o n t r o l + γ j i n d u s t r y + γ k y e a r + ε  
Model (3) represents the regression of dependent variable rd to independent variable eu, model (4) represents the regression of mediator variable kz to independent variable eu, and Model (5) represents the simultaneous regression of dependent variable rd to both the independent variable eu and the mediation variable kz.
As for the financing constraint (kz), we draw on the ideas of Kaplan and Zingales [45] to construct the kz index based on five factors such as operating net cash flow, cash dividends, cash holdings, degree of debt, and growth, and take it as a proxy variable of financing constraints. The specific steps are as follows:
Firstly, we classify the whole sample in each year according to operating cash flow/total assets at the beginning of the period (cfit/assetit−1), cash dividend/total assets at the beginning of the period (divit/assetit−1), cash holdings/total assets at the beginning of the period (cashit/assetit−1), asset liability ratio (levit) and tobinq (qit). If cfit/assetit−1 is lower than the median, then kz1 is 1; otherwise, kz1 is 0. If divit/assetit−1 is lower than the median, then kz2 = 1; otherwise, kz2 = 0. If cashit/assetit−1 is lower than the median, then kz3 = 1; otherwise, kz3 = 0; If lev it is lower than the median, then kz4 = 1, otherwise, kz4 = 1; If qit is lower than the median, then kz5 = 1, otherwise, kz5 = 0.
Secondly, we calculate the kz index, let kz = kz1 + kz2 + kz3 + kz4 + kz5.
Next, we construct the model (6) and use ordered logistic regression for model (6), and then we regress kz index as the dependent variable to estimate the regression coefficient of each variable.
Finally, we use the estimation results of model (6) to calculate the KZ index of each company every year. The larger the kz is, the higher the financing constraints the company is subject to.
k z i t = α 1 ( c f i t / a s s e t i t 1 ) + α 2 ( d i v i t / a s s e t i t 1 ) + α 3 ( c a s h i t / a s s e t i t 1 ) + α 4 ( l e v i t ) + α 5 ( q i t )
Table 6 reports the regression results of financing constraints as a mediator variable. The eu regression coefficient in column (1) is significantly negative at the 1% level, indicating that environmental uncertainty has a significant negative impact on corporate innovation. The regression coefficient of eu in column (2) is 0.0789, which is significant at the statistical level of 1%, indicating that the increase of environmental uncertainty will aggravate the financing constraints faced by corporations. In column (3), the regression coefficient of eu is −0.1048, which is significant at the 1% level. The regression coefficient of kz is −0.0503, which is also significant at the level of 1%, indicating that financing constraints play a partial intermediary role in the impact of environmental uncertainty on corporate innovation. When environmental uncertainty increases, corporations face higher financing constraints, and financing difficulties significantly reduce the level of corporate innovation. The above results prove that financing constraints are an important factor affecting enterprise innovation. In order to enhance the credibility of the mediation effect, the Sobel test and Bootstrap test are also used in this paper, and we find that the conclusions remain unchanged.

4.5. Robustness Test

4.5.1. Endogeneity Test

In this paper, instrumental variables are used to mitigate the endogeneity problems that may arise from the study, and generalized moment estimation (IV-GMM) is used to estimate the relevant models. We use the following two instrumental variables: (1) one and two lag periods of environmental uncertainty (eu); (2) (environmental uncertainty minus the mean of environmental uncertainty) to the third power, namely (eu-eu_mean)^3. The clever nature of this method is that effective instrumental variables can be constructed without external factors [46]. The regression results are shown in Table 7. After controlling for endogeneity, there is still a negative correlation between environmental uncertainty and corporate innovation, indicating that the conclusion is robust.

4.5.2. Change the Sample Interval

Manufacturing is the foundation of the nation, and it should be the subject of innovation, so we kept the manufacturing sample for further analysis. Considering the impact of special environments on innovation, such as the financial crisis and COVID-19, samples from 2009, 2010 and 2020 were excluded from further examination. The regression results are shown in columns (1) and (2) of Table 8. We find that the main conclusions remain unchanged, thus demonstrating the robustness of the conclusions.

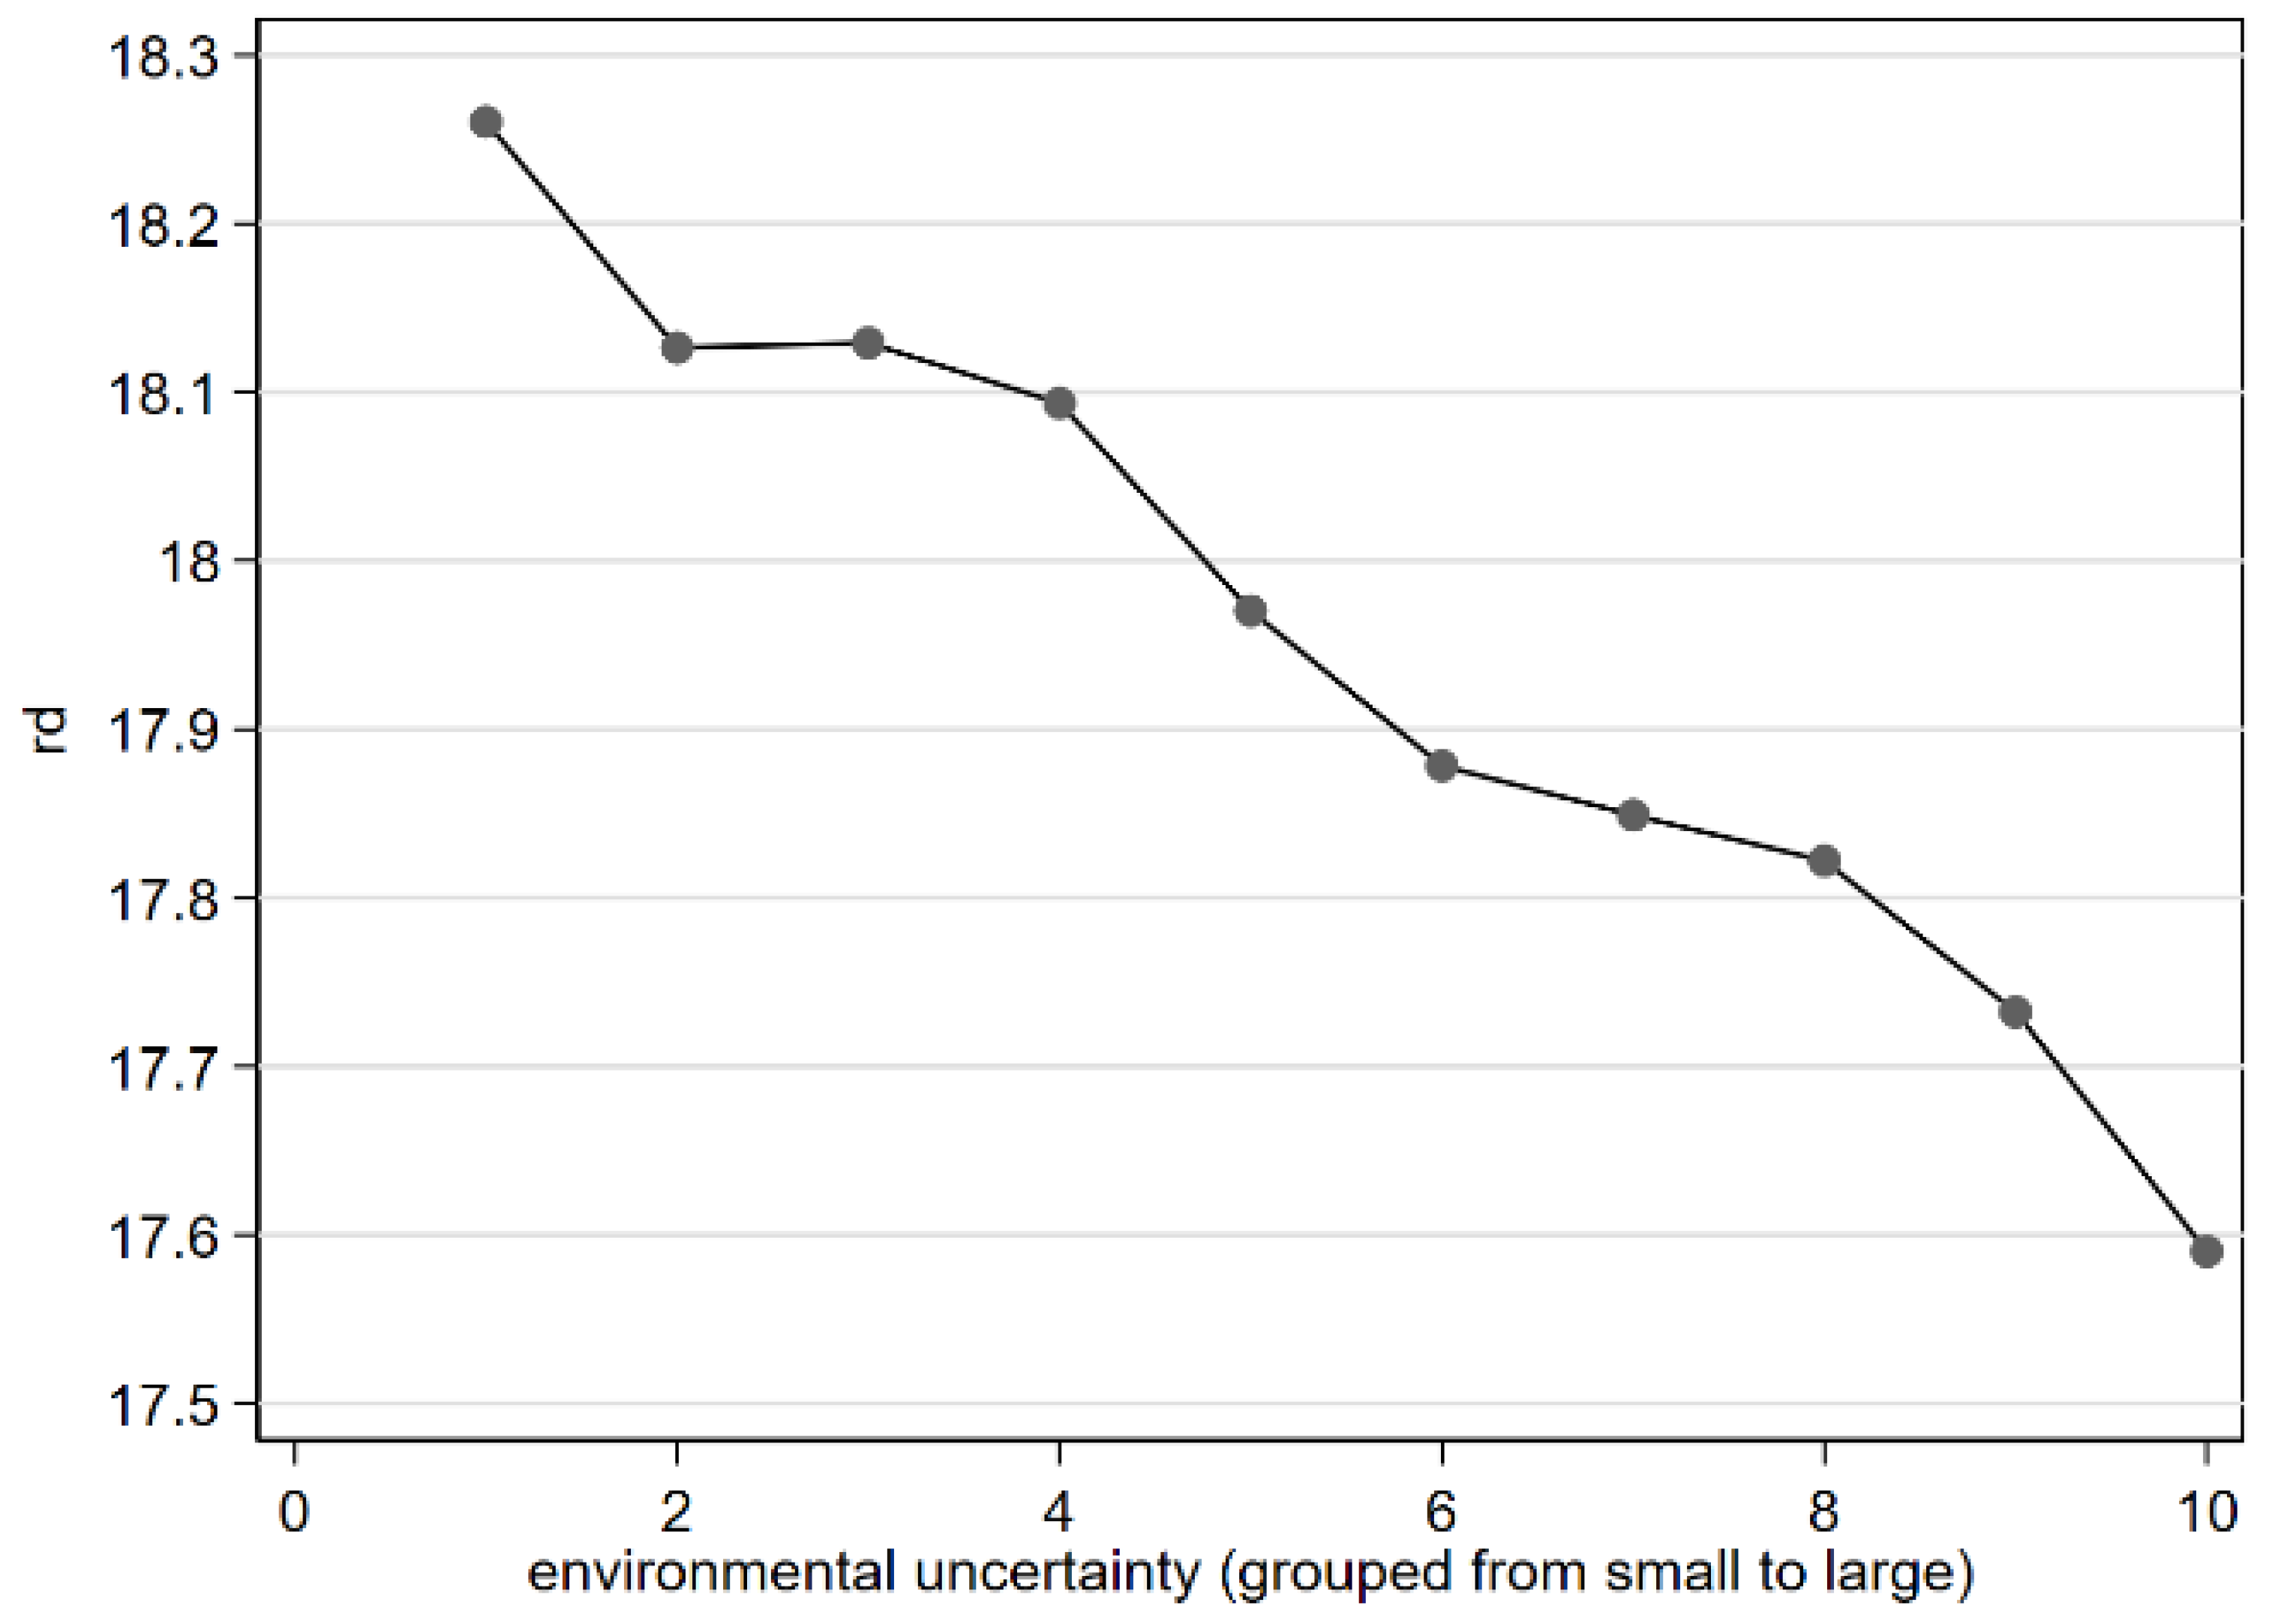
4.5.3. Test Nonlinearity

Considering that there is a nonlinear relationship between environmental uncertainty and corporate innovation which affects the research conclusion, we include the quadratic term (eu2) of environmental uncertainty (eu) in model (2). The regression result is shown in column (3) of Table 8. We find that the coefficient of EU is still significantly negative, while the coefficient of Eu2 is significantly positive. We calculated the extreme point of EU according to the formula and find that there are only 29 samples on the right of the extreme point, indicating that the vast majority (99.8%) of samples are still on the left of the extreme point. Therefore, there is no U-shaped relationship between the two. In addition, we also conducted the “Utest” test and found no U-shaped relationship between the two.

4.5.4. Replace Corporate Innovation Indicators

In the previous study, we measured corporate innovation by the natural logarithm of R&D investment, and below we replace this indicator with the intensity of R&D investment (rd_1), which is measured by the proportion of R&D investment in total assets. In addition, we also use the number of patent applications of corporations in that year to measure corporate innovation. We use four patent indicators: patent 1 indicates the total number of invention patents, utility models and design patents plus the natural logarithm of 1; patent 2 indicates the total number of applications for invention patents, utility models and design patents plus the natural logarithm of 1, but the weight of the three patents is taken according to 3:2:1; patent 3 indicates the number of invention patent applications plus the natural logarithm of 1; patent 4 represents the total number of applications filed for utility model and design patents plus the natural logarithm of 1. Considering the lag of patent variables, we will lag the independent variables and other control variables behind the number of patent applications when expressing corporate innovation in terms of the number of patent applications. The regression results for the substitution variables are shown in column 8 (4) of Table 8 and Table 9, and we find that the conclusions have not changed.

5. Conclusions and Implications

In today’s world, innovation has become a decisive force for economic and social development and the key to the survival and development of companies. However, due to their large investment amounts, long durations and high adjustment costs, innovative activities are very vulnerable to the influence of the external environment. With the reform of China’s economic system, the increase in the degree of opening up to the outside world and the intensification of market competition, corporate operations are facing wider environmental uncertainties, and corporation management is facing a wider range of uncertain factors. Based on the data of China’s A-share listed companies from 2009 to 2020, this paper empirically examines the impact of micro environmental uncertainty on corporate innovation and analyzes the differences in the role of environmental uncertainty under different risk-taking ability.
The test results of this paper indicate that there is a negative correlation between environmental uncertainty and corporate innovation. When facing environmental uncertainty, corporations tend to reduce innovation investment in order to avoid future losses. Corporations with higher environmental uncertainty are more cautious about innovation, which is in line with the risk aversion motivation of management and the relevant interpretation of real option theory. We also find that the impact of environmental uncertainty varies among corporations with different characteristics. Compared with corporations with strong risk-taking ability, the negative correlation between environmental uncertainty and corporate innovation is more obvious in corporations with weak risk-taking ability. Finally, we also verify that environmental uncertainty will indirectly affect enterprise innovation by increasing financing constraints.
This paper helps to understand how environmental uncertainty at the micro-level affects corporate innovation. Based on the existing research on the impact of the macro-level on corporate innovation, this paper starts from a micro perspective and draws a conclusion different from the existing literature. Many studies have shown that uncertainty at the macro level drives innovation [2,11,47,48]; however, our research shows that microenvironmental uncertainty inhibits firm innovation, so this paper enriches the literature on the external environmental impact of firm behavior. At the same time, with certain empirical references and evidence support, this paper provides some practical and policy implications.
First, this paper finds that in the face of environmental uncertainty, corporations tend to give up innovation investment to reduce losses, so the government and other relevant departments should promote the integration of digitalization and marketization, strive to create a fair and just atmosphere of technological innovation, strengthen the protection of corporate intellectual property rights, and give them confidence and motivation for innovation. In addition, China’s “difficult financing” and “expensive financing” problems are becoming more and more prominent, which has a greater negative impact on corporate innovation, so the government should promote the establishment of multi-level, multi-dimensional financing channels, promote the rational allocation of resources and improve the ability and level of financial services in the real economy. In addition, relevant departments should increase support for small and medium-sized enterprises and private enterprises, such as reducing the tax burden and increasing subsidies so as to reduce the adverse impact of credit discrimination and enhance their dynamic adjustment ability.
Secondly, for companies, they should enhance their ability to resist risks and effectively adapt to changes in the external environment. This paper finds that environmental uncertainty will exacerbate the financing constraints faced by corporations, so corporations need to make more rational use of existing funds and ensure stable cash flows to prevent the sudden interruption of innovation activities. At the same time, corporations should pay attention to the grasp of market information. Changes in the external environment often lead to changes in market demand, so corporations should effectively identify the information beneficial to themselves, formulate more active strategies to deal with environmental changes, and turn the possible damage caused by environmental uncertainty into opportunities.
Although this paper has some theoretical contributions, there are still certain limitations. First, it is very difficult to accurately measure corporate innovation, although this paper uses corporate innovation input and the number of patent applications to represent corporate innovation, it is still impossible to comprehensively measure the innovation level of a company, which needs further study. Second, when studying the impact of environmental uncertainty on corporate innovation, this paper does not consider factors at the level of managers’ traits, such as managers’ ability and managers’ risk preferences. For example, Zhang et al. [49] find that managers’ risk preference can alleviate the adverse impact of cash flow uncertainty on corporate innovation, so it can be further expanded in this regard in future research.

Author Contributions

M.D.: Conceptualization, Revised the manuscript, Approved the final manuscript; X.F.: Data curation, Validation, Formal analysis, Writing—original draft; Z.T.: Revised the sentence of the whole thesis and translated it from Chinese to English; W.L.: Project administration, Funding acquisition. All authors have read and agreed to the published version of the manuscript.

Funding

This study is supported by the National Social Science Foundation of China (20BGL201), and Hunan Provincial Natural Science Foundation of China (2021JJ30281).

Institutional Review Board Statement

Not applicable.

Informed Consent Statement

Not applicable.

Data Availability Statement

Not applicable.

Acknowledgments

The authors declare that they have no known competing financial interests or personal relationships that could have appeared to influence the work reported in this paper. All remaining errors are on our own.

Conflicts of Interest

The authors declare no conflict of interest.

References

  1. Romer, P. The origins of endogenous growth. J. Econ. Perspect. 1994, 8, 3–22. [Google Scholar] [CrossRef] [Green Version]
  2. He, F.; Ma, Y.; Zhang, X. How does economic policy uncertainty affect corporate Innovation?—Evidence from China listed companies. Int. Rev. Econ. Financ. 2020, 67, 225–239. [Google Scholar] [CrossRef]
  3. Li, K.; Xia, B.; Chen, Y.; Ding, N.; Wang, J. Environmental uncertainty, financing constraints and corporate investment: Evidence from China. Pac.-Basin Financ. J. 2021, 70, 3–22. [Google Scholar] [CrossRef]
  4. Baker, S.R.; Bloom, N.; Davis, S.J. Measuring economic policy uncertainty. Q. J. Econ. 2016, 131, 1593–1636. [Google Scholar] [CrossRef]
  5. Julio, B.; Yook, Y. Political uncertainty and corporate investment cycles. J. Financ. 2012, 67, 45–83. [Google Scholar] [CrossRef]
  6. Boyle, G.W.; Guthrie, G.A. Investment, uncertainty and liquidity. J. Financ. 2003, 58, 2143–2166. [Google Scholar] [CrossRef] [Green Version]
  7. Minton, B.A.; Schrand, C. The impact of cash flow volatility on discretionary investment and the costs of debt and equity financing. J. Financ. Econ. 1999, 54, 423–460. [Google Scholar] [CrossRef] [Green Version]
  8. Liu, B.; Li, Z.; Wang, H.; Yang, J. Cash flow uncertainty and corporate innovation. Econ. Res. J. 2017, 3, 166–180. (In Chinese) [Google Scholar]
  9. Gilchrist, S.; Sim, J.W.; Zakrajek, E. Uncertainty, financial frictions, and investment dynamics. J. Financ. Econ. Discuss. Ser. 2014, 69, 1–58. [Google Scholar] [CrossRef]
  10. Huang, Y.; Luk, P. Measuring economic policy uncertainty in China. China Econ. Rev. 2020, 59, 101367. [Google Scholar] [CrossRef]
  11. Guan, J.; Xu, H.; Huo, D.; Hua, Y.; Wang, Y. Economic policy uncertainty and corporate innovation: Evidence from China. Pac.-Basin Financ. J. 2021, 67, 101542. [Google Scholar] [CrossRef]
  12. Steven, J.; Davis, D.Q.; Sheng, X.G. Economic Policy Uncertainty in China since 1949. Mainland Newspapers, 2019. Available online: https://stevenjdavis.com/s/EPU-in-China-View-from-Mainland-Newspapers-August-2019.pdf(accessed on 15 December 2021).
  13. Cao, Y.; Chen, Y.; Zhang, Y. Political uncertainty, innovation-driven strategy, and corporate R&D. Res. Int. Bus. Financ. 2022, 60, 101612. [Google Scholar] [CrossRef]
  14. Pertuze, J.A.; Reyes, T.; Vassolo, R.S.; Olivares, N. Political uncertainty and innovation: The relative effects of national leaders’ education levels and regime systems on firm-level patent applications. Res. Policy 2019, 48, 103808. [Google Scholar] [CrossRef]
  15. Govindarajan, V.J. Appropriateness of accounting data in performance evaluation: An empirical examination of environmental uncertainty as an intervening variable. Account. Organ. Soc. 1984, 9, 125–135. [Google Scholar] [CrossRef]
  16. Shen, H.; Yu, P.; Wu, L. State ownership, environmental uncertainty and investment efficiency. Econ. Res. J. 2012, 7, 113–126. (In Chinese) [Google Scholar]
  17. Bloom, N.; Stephen, B.; John, V.R. Uncertainty and investment dynamics. J. Rev. Econ. Stud. 2007, 74, 391–415. [Google Scholar] [CrossRef] [Green Version]
  18. Wang, Y.; Chen, C.R.; Huang, Y.S. Economic policy uncertainty and corporate investment: Evidence from China. Pac.-Basin Financ. J. 2014, 26, 227–243. [Google Scholar] [CrossRef]
  19. Kim, H.; Kung, H. The asset redeployability channel: How uncertainty affects corporate investment. J. Rev. Financ. Stud. 2017, 30, 245–280. [Google Scholar] [CrossRef]
  20. Chen, X.; Le, C.H.A.; Shan, Y.; Taylor, S. Australian policy uncertainty and corporate investment. Pac.-Basin Financ. J. 2020, 61, 101341. [Google Scholar] [CrossRef]
  21. Hall, B. The financing of research and development. Oxf. Rev. Econ. Policy 2002, 18, 35–51. [Google Scholar] [CrossRef]
  22. P’astor, Ľ.; Veronesi, P. Political uncertainty and risk premia. J. Financ. Econ. 2013, 110, 520–545. [Google Scholar] [CrossRef] [Green Version]
  23. Allen, F.; Qian, J.; Qian, M.J. Law, finance, and economic growth in China. J. Financ. Econ. 2005, 77, 57–116. [Google Scholar] [CrossRef] [Green Version]
  24. Gordon, R.; Li, W. Government as a discriminating monopolist in the financial market: The case of China. J. Public Econ. 2003, 87, 283–312. [Google Scholar] [CrossRef] [Green Version]
  25. Lee, C.; Wang, C.; Ho, S. Financial innovation and bank growth: The role of institutional environments. N. Am. J. Econ. Financ. 2020, 53, 101195. [Google Scholar] [CrossRef]
  26. Ghosh, D.; Olsen, L. Environmental uncertainty and managers’ use of discretionary accruals. Account. Organ. Soc. 2009, 34, 188–205. [Google Scholar] [CrossRef]
  27. Phan, H.V.; Nguyen, N.H.; Nguyen, H.T.; Hegde, S. Policy uncertainty and firm cash holdings. J. Bus. Res. 2019, 95, 71–82. [Google Scholar] [CrossRef]
  28. Gulen, H.; Ion, M. Policy uncertainty and corporate investment. Rev. Financ. Stud. 2016, 29, 523–564. [Google Scholar] [CrossRef]
  29. Hua, F.; Xu, F. How does environmental uncertainty affect corporate idiosyncratic risk—An intermediary effect test based on cash flow fluctuation and accounting information quality. Nankai Bus. Rev. 2018, 21, 122–133. (In Chinese) [Google Scholar]
  30. Liao, Y. Environmental uncertainty, diversification and cost of equity capital. J. Financ. Theory Pract. 2015, 1, 78–83. (In Chinese) [Google Scholar]
  31. Wang, H.; Chen, X. Corporate governance, environmental uncertainty and debt capital cost. J. Nanjing Audit Univ. 2016, 5, 66–74. (In Chinese) [Google Scholar]
  32. Manso, G. Motivating innovation. J. Financ. 2011, 66, 1823–1860. [Google Scholar] [CrossRef] [Green Version]
  33. Lou, Z.; Chen, S.; Yin, W.; Zhang, C.; Yu, X. Economic policy uncertainty and corporate innovation: Evidence from a risk-taking perspective. Int. Rev. Econ. Financ. 2022, 77, 78–96. [Google Scholar] [CrossRef]
  34. Duncan, R.B. Characteristics of organizational environments and perceived environmental uncertainty. Admin. Sci. Q. 1972, 17, 313–327. [Google Scholar] [CrossRef] [Green Version]
  35. Tan, J. Innovation and risk-taking in a Transitional Economy: A comparative study of Chinese managers and entrepreneurs. J. Bus. Ventur. 2001, 16, 359–376. [Google Scholar] [CrossRef]
  36. Tosi, H.; Aldag, R.; Storey, R. On the measurement of the environment: An assessment of the lawrence and lorsch environmental uncertainty subscale. Adm. Sci. 1973, 18, 27–36. [Google Scholar] [CrossRef]
  37. Bergh, D.D.; Lawless, M.W. Portfolio restructuring and limits to hierarchical governance: The effects of environmen-tal uncertainty and diversification strategy. Organ. Sci. 1998, 9, 87–102. [Google Scholar] [CrossRef]
  38. Mishra, R.; Mishra, O.N. Prioritising dimensions of entrepreneurial orientation for supply chain flexibility development in an uncertain environment. J. Manuf. Technol. Manag. 2019, 30, 483–505. [Google Scholar] [CrossRef]
  39. Rao, P.; Xu, Z. Does economic policy uncertainty affect corporate executive change? Man World 2017, 1, 45–157. (In Chinese) [Google Scholar]
  40. Chang, C.; Chen, X.; Liao, G. What are the reliably important determinants of capital structure in China? Pac.-Basin Financ. J. 2014, 30, 87–113. [Google Scholar] [CrossRef]
  41. Lu, Z.; He, J.; Dou, H. Whose leverage is more excessed, State-owned or non-state-owned enterprises? Econ. Res. J. 2015, 12, 54–67. (In Chinese) [Google Scholar]
  42. Walls, M.R.; Dyer, J.S. Risk propensity and firm performance: A study of the petroleum exploration industry. Manag. Sci. 1996, 42, 1004–1021. [Google Scholar] [CrossRef]
  43. Talavera, O.; Tsapin, A.; Zholud, O. Macroeconomic uncertainty and Bank lending: The case of Ukraine. J. Econ. Syst. 2012, 46, 279–293. [Google Scholar] [CrossRef] [Green Version]
  44. Baron, R.M.; Kenny, D.A. The moderator-mediator variable distinction in social psychological research: Conceptual, strategic, and statistical considerations. J. Personal. Soc. Psychol. 1986, 51, 1173–1182. [Google Scholar] [CrossRef]
  45. Kaplan, S.N.; Zingales, L. Do investment-cash flow sensitivities provide useful measures of financing constraints? Q. J. Econ. 1997, 112, 169–215. [Google Scholar] [CrossRef] [Green Version]
  46. Lewbel, A. Constructing instruments for regressions with measurement error when no additional data are available. Econometrica 1997, 65, 1201–1213. [Google Scholar] [CrossRef]
  47. Tajaddini, R.; Gholipour, H.F. Economic policy uncertainty, R&D expenditures and innovation outputs. J. Econ. Stud. 2021, 48, 413–427. [Google Scholar] [CrossRef]
  48. Shen, H.; Hou, F. Trade policy uncertainty and corporate innovation evidence from Chinese listed firms in new energy vehicle industry. Energy Econ. 2021, 97, 105217. [Google Scholar] [CrossRef]
  49. Zhang, C.; Sun, Y.; Lu, X. Cash flow uncertainty, managers’ risk preference and corporate innovation. J. Zhongnan Univ. Econ. Law 2019, 6, 71–81. (In Chinese) [Google Scholar]
Figure 1. Average value of environmental uncertainty in various industries. A: agriculture, forestry, animal husbandry and fisheries. B: mining. C1: food, beverage, textile, leather manufacturing. C2: wood furniture, chemical raw materials, and pharmaceutical manufacturing. C3: metal, nonmetal, machinery and equipment manufacturing. C4: other manufacturing. D: electricity, heat, gas and water production and supply industries. E: construction. F: wholesale and retail. G: transportation, warehousing and postal service. H: accommodation and catering. I: information transmission, software and information technology services. K: real estate. L: leasing and business services. M: scientific research and technology services. N: water conservancy, environment and public facilities management. P: education. Q: health and social work. R: culture, sports and recreation. S: comprehensive.
Sustainability 14 04902 g001
Figure 2. Average R&D spending by industry. See Figure 1 for industry classification names.
Sustainability 14 04902 g002
Figure 3. Environmental uncertainty and corporate innovation.
Sustainability 14 04902 g003
Table 1. Variable definitions.
VariablesSymbolDescription
Corporate innovationrdThe natural logarithm of firm R&D spending
Environmental uncertaintyeuFor the fluctuation of corporation sales revenue, see the model for the specific calculation method (1)
ProfitabilityroaNet profit/Total assets
Corporate growthgrowGrowth rate of operating income, current year operating income/same period last year operating income
Corporate leverage ratiolevTotal liabilities/Total assets
Capital intensityfixedFixed assets ratio, fixed assets to total assets
Investment opportunitiestobinqMarket value/Total assets
Company scalesizeThe natural logarithm of a firm’s total assets at the end
Ownership concentrationshrcr1Shareholding ratio of the largest shareholder
Board sizeboardThe natural log of the number of board members
Proportion of independent directorsindepNumber of independent directors/number of directors
Table 2. Descriptive statistics.
VariableObs.MeanStd. Dev.MinMedianMax
rd15,09617.951.62313.19218.01122.04
eu15,0961.2841.2810.0100.95323.62
roa15,0960.0320.065−0.2850.0320.197
grow15,0960.1500.377−0.4930.0922.370
lev15,0960.4420.1940.0680.4390.869
fixed15,0960.2220.1530.0050.1920.677
tobinq15,0962.0711.2940.8451.6578.137
size15,09622.4571.25320.12222.21926.337
shrcr115,0960.3350.1430.0900.3120.729
indep15,0960.3750.0540.3330.3330.571
board15,0962.1400.1971.6092.1972.708
Table 3. Correlation coefficient matrix between variables.
rdeuroagrowlevfixedtobinqsizeshrcr1indepboard
rd1
eu−0.091 ***1
roa0.131 ***−0.088 ***1
grow0.047 ***0.435 ***0.236 ***1
lev0.117 ***0.041 ***−0.306 ***0.014 *1
fixed−0.080 ***−0.038 ***−0.056 ***−0.064 ***0.088 ***1
tobinq−0.140 ***−0.01200.208 ***0.044 ***−0.352 ***−0.125 ***1
size0.497 ***−0.014 *0.063 ***0.043 ***0.481 ***0.086 ***−0.438 ***1
shrcr10.062 ***0.0090.118 ***−0.0030.116 ***0.122 ***−0.067 ***0.269 ***1
indep0.043 ***−0.017 **−0.020 **−0.018 **−0.006−0.038 ***0.035 ***0.035 ***0.047 ***1
board0.056 ***−0.036 ***0.035 ***−0.0050.160 ***0.147 ***−0.132 ***0.244 ***0.058 ***−0.515 ***1
Note: This table reports the correlation coefficients between variables. ***, **, * represent the significance level of 1%, 5%, and 10% respectively.
Table 4. Environmental uncertainty and corporate innovation.
(1)
Full Sample
(2)
Full Sample
(3)
High eu
(4)
Low eu
rdrdrdrd
eu−0.1288 ***−0.1088 ***−0.0568 ***−0.1528
(−11.4358)(−10.5367)(−3.7152)(−1.1460)
roa0.7005 ***1.5276 ***0.8322 ***2.3660 ***
(3.6494)(8.3534)(2.8180)(5.7890)
grow0.2180 ***0.2038 ***0.1529 ***1.0516 ***
(5.8768)(6.3107)(4.0353)(5.2910)
lev−1.0221 ***−0.5370 ***−0.4996 ***−0.4763 ***
(−13.8103)(−8.0060)(−3.9083)(−3.2425)
fixed−1.0359 ***−0.5045 ***−0.4976 ***−0.5122 ***
(−11.6247)(−6.4248)(−3.0507)(−3.1803)
tobinq0.0663 ***0.0496 ***0.02720.0458 ***
(7.3352)(5.6923)(1.3981)(2.8548)
size0.7974 ***0.8387 ***0.8289 ***0.8039 ***
(61.2848)(75.6083)(36.3822)(36.3281)
shrcrl−0.8200 ***−0.1623 **0.2159−0.1108
(−9.5596)(−2.3898)(1.4873)(−0.9306)
indep−0.34610.0194−1.0896 **0.3228
(−1.3776)(0.0948)(−2.3247)(0.9232)
board−0.4838 ***−0.0842−0.4143 ***0.2430 **
(−6.4769)(−1.3414)(−3.0962)(2.0981)
_cons2.1326 ***−2.2677 ***−1.1682 *−3.0147 ***
(6.5042)(−7.5747)(−1.9352)(−5.1441)
IndustryNoYesYesYes
YearNoYesYesYes
r2_a0.29860.53140.46440.6074
N150961509637743774
Note: This table shows the regression results of environmental uncertainty and corporate innovation. Column (1) does not control for industry and year effects, and column (2) does. Columns (3) and (4) are the regression results of the high and low environmental uncertainty group and corporate innovation, respectively. Control variables include roa (Profitability), grow (Growth), lev (Corporate leverage ratio), fixed (Capital intensity), tobinq (Investment opportunity), size (Company scale), shrcr1 (Ownership concentration), board (Board size), indep (Proportion of independent directors). The t-values in brackets adopt robust standard error, ***, ** and * represent significance levels of 1%, 5% and 10%, respectively.
Table 5. Results of heterogeneity analysis.
(1) State-Owned(2) Non State-Owned(3) Large Scale(4) Small Scale(5) High Profitability(6) Low Profitability
rdrdrdrdrdrd
eu−0.1046 ***−0.1235 ***−0.0997 ***−0.1191 ***−0.0887 ***−0.1087 ***
(−6.2379)(−10.0907)(−6.2455)(−8.8815)(−8.1544)(−9.1431)
roa1.8904 ***1.1391 ***1.7198 ***1.1454 ***1.1101 ***0.5381 **
(4.7607)(5.7320)(5.0273)(5.6101)(4.8425)(2.0764)
grow0.1950 ***0.2122 ***0.1952 ***0.2048 ***0.1916 ***0.2376 ***
(3.6803)(5.3090)(3.9395)(5.0086)(4.7837)(5.7701)
lev−0.7658 ***−0.3983 ***−0.7673 ***−0.3352 ***0.2267 ***−0.5995 ***
(−6.9041)(−4.8163)(−6.9631)(−4.0296)(2.5884)(−6.5141)
fixed−0.7372 ***−0.0245−0.3990 ***−0.5084 ***−0.3487 ***−0.2922 ***
(−6.1041)(−0.2537)(−3.6365)(−4.6136)(−3.6603)(−2.8585)
tobin0.00120.0828 ***0.1165 ***0.0318 ***0.0673 ***0.0007
(0.0757)(8.2762)(6.9039)(3.0992)(6.6513)(0.0445)
size0.8268 ***0.8710 ***0.8119 ***0.9181 ***0.8028 ***0.8108 ***
(47.9600)(60.0903)(42.3463)(37.3910)(59.8440)(50.4107)
shrcr10.0267−0.1375 *0.1689 *−0.4815 ***−0.2388 ***−0.1257
(0.2323)(−1.6543)(1.7303)(−5.5436)(−2.8480)(−1.1891)
indep0.13600.39070.17740.2280−0.02460.4613
(0.4290)(1.5053)(0.6033)(0.8650)(−0.0949)(1.5563)
board−0.12960.1805 **−0.1631 *0.0121−0.0305−0.0793
(−1.3290)(2.2818)(−1.8109)(0.1543)(−0.4182)(−0.9039)
_cons−1.7673 ***−3.9557 ***−2.3374 ***−3.9096 ***−1.7033 ***−1.9717 ***
(−4.0876)(−9.3529)(−4.8723)(−6.7960)(−4.8658)(−4.9036)
IndustryYesYesYesYesYesYes
YearYesYesYesYesYesYes
r2_a0.57920.50800.51170.40910.55700.5203
N629787997545755175467550
Note: This table shows the results of heterogeneity regression for the effects of environmental uncertainty. Columns (1) and (2) represent property heterogeneity, columns (3) and (4) represent the heterogeneity of business size, and columns (5) and (6) represent heterogeneity of profitability. Control variables include roa (Profitability), grow (Growth), lev (Corporate leverage ratio), fixed (Capital intensity), tobinq (Investment opportunity), size (Company scale), shrcr1 (Ownership concentration), board (Board size), indep (Proportion of independent directors). The t-values in parentheses use robust standard errors, with ***, **, and * representing the significance levels of 1%, 5%, and 10%, respectively.
Table 6. Mediating effect of financing constraints.
(1) (2)(3)
rdkzrd
eu−0.1088 ***0.0798 ***−0.1048 ***
(−10.5367)(6.5151)(−10.2109)
kz −0.0503 ***
(−7.7809)
roa1.5276 ***−11.7026 ***0.9394 ***
(8.3534)(−38.5334)(4.7492)
grow0.2038 ***−0.2288 ***0.1923 ***
(6.3107)(−4.7984)(5.9608)
lev−0.5370 ***5.9079 ***−0.2400 ***
(−8.0060)(67.5686)(−3.1635)
fixed−0.5045 ***0.5639 ***−0.4762 ***
(−6.4248)(6.6753)(−6.0516)
tobinq0.0496 ***0.2017 ***0.0598 ***
(5.6923)(13.6632)(6.8856)
size0.8387 ***−0.2364 ***0.8269 ***
(75.6083)(−16.6555)(73.6675)
shrcr1−0.1623 **−0.7924 ***−0.2021 ***
(−2.3898)(−8.9956)(−2.9657)
indep0.01940.5466 **0.0468
(0.0948)(2.1145)(0.2297)
board−0.0842−0.1133−0.0899
(−1.3414)(−1.4987)(−1.4334)
_cons−2.2677 ***2.1873 ***−2.1577 ***
(−7.5747)(6.0237)(−7.2040)
IndustryYesYesYes
YearYesYesYes
r2_a0.53140.53100.5334
N150961509615096
Note: This table shows the test results of the mediating effect of financing constraint as a mediating variable. Column (1) represents the regression result of corporate innovation on environmental uncertainty; column (2) represents the regression result of financing constraint on environmental uncertainty, and column (3) represents the regression result of corporate innovation on environmental uncertainty and financing constraint. Control variables include roa (Profitability), grow (Growth), lev (Corporate leverage ratio), fixed (Capital intensity), tobinq (Investment opportunity), size (Company scale), shrcr1 (Ownership concentration), board (Board size), indep (Proportion of independent directors). The t-values in parentheses use robust standard errors, with ***, ** representing the significance levels of 1% and 5% respectively.
Table 7. Results of the endogenous test.
(1) IV: l.eu l2.eu(2) IV: (eu-eu_mean)^3
rdrd
eu−0.1539 ***−0.0422 **
(−9.7036)(−2.4876)
roa0.8542 ***1.8184 ***
(4.2711)(10.0114)
grow0.3099 ***0.0898 **
(7.5332)(2.3313)
lev−0.4882 ***−0.5314 ***
(−6.6052)(−8.4878)
fixed−0.2722 ***−0.4672 ***
(−3.2877)(−6.6113)
tobinq0.0611 ***0.0505 ***
(5.8060)(5.7669)
size0.8619 ***0.8401 ***
(71.3388)(80.9256)
shrcr1−0.1476 *−0.1885 ***
(−1.8220)(−2.7566)
indep−0.25940.0712
(−1.1130)(0.3548)
board−0.1561 **−0.0686
(−2.3229)(−1.1831)
_cons−1.3026 ***−2.4381 ***
(−4.2689)(−9.0974)
IndustryYesYes
YearYesYes
r2_a0.55540.5293
N940615096
Note: This table reports the endogeneity test results of environmental uncertainty and corporate innovation. The instrumental variables in column (1) are l.eu and l2.eu, and the instrumental variables in column (2) are (eu-eu_mean)^3. Control variables include roa (Profitability), grow (Growth), lev (Corporate leverage ratio), fixed (Capital intensity), tobinq (Investment opportunity), size (Company scale), shrcr1 (Ownership concentration), board (Board size), indep (Proportion of independent directors). The t-values in brackets adopt robust standard error, ***, ** and * represent significance levels of 1%, 5%, and 10%, respectively.
Table 8. Results of changing the sample interval, testing nonlinear relationship and replacing the explanatory variable.
(1)(2)(3)(4)
rdrdrdrd_1
eu−0.1395 ***−0.1103 ***−0.1725 ***−0.1396 ***
(−12.2073)(−9.5640)(−10.8257)(−12.0824)
eu2 0.0077 ***
(4.1526)
roa1.6960 ***1.7295 ***1.4484 ***2.3075 ***
(8.1958)(8.2794)(7.9235)(8.1399)
grow0.2700 ***0.1964 ***0.1960 ***0.2043 ***
(7.2198)(5.5036)(6.1127)(5.2142)
lev−0.4581 ***−0.5380 ***−0.5374 ***−0.1790 **
(−6.2062)(−7.2115)(−8.0213)(−2.0546)
fixed−0.4688 ***−0.4819 ***−0.5154 ***−0.7957 ***
(−5.5987)(−5.5012)(−6.5639)(−8.9158)
tobin0.0296 ***0.0334 ***0.0498 ***0.2084 ***
(3.1211)(3.2672)(5.7359)(12.6477)
size0.8899 ***0.8238 ***0.8378 ***−0.0754 ***
(73.6202)(63.4994)(75.6264)(−5.0941)
shrcr1−0.0107−0.1034−0.1684 **−0.2008 **
(−0.1489)(−1.3614)(−2.4817)(−2.2924)
indep0.04280.0065−0.00090.3596
(0.1975)(0.0285)(−0.0046)(1.3398)
board−0.1822 ***−0.1137−0.0920−0.0940
(−2.7251)(−1.6220)(−1.4690)(−1.1240)
_cons−2.6925 ***−1.5434 ***−2.1527 ***1.6915 ***
(−8.5889)(−4.7288)(−7.1817)(4.6244)
IndustryYesYesYesYes
YearYesYesYesYes
r2_a0.55680.51450.53250.3202
N10781122221509615096
Note: This table reports test results for altering sample intervals, testing for nonlinear relationships, and replacing explanatory variables. Column (1) only retains the manufacturing sample, column (2) excludes the samples of 2009, 2010, 2020, (3) eu2 is the second term of eu, column (4) rd_1 indicates the proportion of R&D investment in total assets to measure corporate innovation. Control variables include roa (Profitability), grow (Growth), lev (Corporate leverage ratio), fixed (Capital intensity), tobinq (Investment opportunity), size (Company scale), shrcr1 (Ownership concentration), board (Board size), indep (Proportion of independent directors). The t-values in parentheses use robust standard errors, with ***, ** representing the significance levels of 1% and 5% respectively.
Table 9. Results of replacing the explanatory variable (Measuring corporate innovation by the number of patent applications).
(1)(2)(3)(4)
patent 1patent 2patent 3patent 4
L.eu−0.1193 ***−0.1348 ***−0.1017 ***−0.1004 ***
(−9.4345)(−9.2191)(−8.6389)(−8.4620)
L.roa1.8817 ***1.9549 ***1.2334 ***1.8517 ***
(7.5207)(6.7852)(5.3665)(7.5466)
L.grow0.2373 ***0.2773 ***0.2178 ***0.1962 ***
(5.8867)(5.9609)(5.7555)(5.1064)
L.lev−0.0173−0.0603−0.1767 **0.1843 **
(−0.2042)(−0.6256)(−2.2218)(2.2091)
L.fixed−1.1145 ***−1.2121 ***−1.0956 ***−0.8516 ***
(−11.6627)(−11.1505)(−12.2763)(−9.0612)
L.tobin0.00770.00350.0508 ***−0.0249 **
(0.6301)(0.2506)(4.4170)(−2.0612)
L.size0.5537 ***0.5970 ***0.5772 ***0.4649 ***
(38.6018)(37.1524)(41.3068)(32.7929)
L.shrcr1−0.4416 ***−0.5654 ***−0.4712 ***−0.2320 **
(−4.7689)(−5.3667)(−5.3115)(−2.5538)
L.indep0.38200.5244 *0.6527 **0.0922
(1.4333)(1.7545)(2.5216)(0.3420)
L.board0.2178 ***0.2941 ***0.2449 ***0.1327 *
(2.8166)(3.3636)(3.2595)(1.7382)
_cons−11.0873 ***−11.7513 ***−12.3437 ***−9.4680 ***
(−31.2076)(−29.4521)(−35.6377)(−26.9073)
IndustryYesYesYesYes
YearYesYesYesYes
r2_a0.37320.35590.33360.3813
N11896118961189611896
Note: This table reports the test results of alternative explanatory variables in which corporate innovation is measured by the number of patent applications. Column (1) represents the total number of applications for the three patents, column (2) represents the total number of applications for the three patents, but the weight of the three patents is taken as 3:2:1, column (3) represents the number of applications for invention patents, and column (4) represents the number of applications for utility model and design patents. Control variables include roa (Profitability), grow (Growth), lev (Corporate leverage ratio), fixed (Capital intensity), tobinq (Investment opportunity), size (Company scale), shrcr1 (Ownership concentration), board (Board size), and indep (Proportion of independent directors). The t-values in parentheses use robust standard errors, with ***, **, and * represent the significance levels of 1%, 5%, and 10%, respectively.
Publisher’s Note: MDPI stays neutral with regard to jurisdictional claims in published maps and institutional affiliations.

