Abstract
Organic fertilization is a promising strategy to decrease N mineralization rates and high N losses via leaching and denitrification, thus synchronizing N application with N uptake for crops. A 230-day experiment with olive plants was realized under greenhouse conditions to compare urea and biogas digestate (BD) application on the growth, nutrient uptake, and physiological performance of Olea europaea L. plants. The following treatments were applied: (i) UREA, (ii) UREA + DCD (nitrification inhibitor), (iii) BD, (iv) BD + DCD, (v) acidified BD, (vi) acidified BD + DCD, (vii) CONTROL (typical native Marl soil type, without fertilizer application). Under BD application, significantly higher levels of organic matter, Olsen P, and exchangeable K compared to UREA were found. Significantly lower main shoot length and total plant biomass were recorded in the CONTROL soil compared to BD. Foliar N was lower in the ACID.BD and ACID.BD + DCD treatments, while leaf P was lower in UREA. The highest PSII activity was recorded in UREA + DCD, while the highest photosynthetic rate and intercellular CO2 concentration were determined in UREA. It is expected that these data will constitute a first comparative approach between urea and BD application in olive plants, which should be carefully considered, towards boosting sustainable fertilization in the frame of circular economy strategy.
1. Introduction
Olea europaea L. is the most important fruit tree crop of the Mediterranean basin. Despite its economic and ecological importance for the Mediterranean countries, many aspects on tree crop physiology and the field factors influencing olive productivity (e.g., temperature, as well as fertilization and irrigation) still remain unknown. For example, only very few published studies [1] exist with regard to the influence of fertilization on olive trees’ nutrition, physiology, and yields. In addition, according to our knowledge, only Chatzistathis et al. (2020) [2] performed a comparative study between organic (manure application) and inorganic fertilization (controlled release fertilizer) on the growth, nutrient uptake, and physiology of Olea europaea L. plants.
Although N is the most important nutrient in fertilization programs [3,4] and especially for the nutrition of olive trees (it contributes to creation of new vegetation, flowering) [5], less than 20% of the applied N to orchards seems to be recovered by fruit trees. Thus, over-fertilization with N is a reality in many cases, causing losses via denitrification, volatilization, and leaching. Due to this low N recovery by tree crops, N losses from the orchards cause negative environmental impacts [4]. According to Fernandez-Escobar et al. (1994) [6], N fertilizer is applied annually to olive orchards in Spain, at rates reaching up to 350 kg/ha. This amount of N may satisfy olive trees’ demands for several years [7]. Thus, within the main targets of modern oleiculture is how to decrease high N fertilization inputs and losses without having negative impact on olive orchards’ yields and productivity. The negative environmental impact of excess N application may be alleviated by organic N application (since the low mineralization rate of organic N may decrease N losses). According to Geng et al. (2021) [8], adopting composted organic fertilizer mixtures (e.g., composted cattle manure) with microbial inoculants (e.g., Trichoderma spp.) could be a win-win practice to mitigate gaseous N losses (lower N2O emissions) and simultaneously improve crop yields. Biogas digestate (BD) is within the most important organic soil amendments that could also be used as bio-fertilizer for crops [9]; there are published data supporting that BD application decreases N losses via denitrification [10], while other researchers found that N2O and N2 fluxes were higher and more variable than after mineral N application [11]. Apart from the differences in nitrous oxide emissions between organic and inorganic N fertilization, differences in N2O emissions were also found between different inorganic N forms; according to Castellano-Hinojosa et al. (2020) [12], the highest N2O emission was produced by the soil treated with urea, followed by the soils treated with ammonium and nitrate. Thus, it is clear that with the appropriate N forms (e.g., urea) for crop fertilization and with the choice of suitable nitrification inhibitors (e.g., DMPP or double inhibitors, like NBPT and DMPSA, or with a combination of nitrification inhibitors with urease inhibitors) [13,14,15,16], its losses via denitrification and leaching may be decreased [14,15] and Ν utilization efficiency (NUE) for crops may be increased. According to Corrochano-Monsalve et al. (2021) [14], a conventional tillage system fertilized with urea and double nitrification inhibitors (NBPT and DMPSA) showed the lowest global warming potential (to similar levels to those of the unfertilized treatment).
The fact that most of the studies for N losses from fertilization via denitrification (nitrous oxide emissions) were focused on annual crops, like Solanum lycopersicum, Phaseolus vulgaris, and Zea mays L. [12,17], creates a great gap in our knowledge towards decreasing N losses via N2O emissions and ameliorating plant N uptake and use efficiency in tree orchards. According to Chaddy et al. (2019) [18], in order to improve understanding of N2O mitigation strategies, further studies should consider plant N uptake on N2O emissions, since the synchronization of N fertilization with plant N demand seems to be the key for mitigating N2O emissions [17]. In addition, similar studies (like the present one) in perennial crops, such as Olea europaea L., have not been performed and they obtain high significance due to the shift of olive orchards’ management from traditional (low input) to intensive (high input) management of olive hedgerows (super high-density systems) [19]. According to our knowledge, only Centeno et al. (2017) [13] studied the effects of N fertilization and nitrification inhibitor on the vegetative growth, production, and oil quality in ‘Arbequina’ and ‘Picual’ orchards. In addition, Fernandez-Escobar et al. (2004) [4] studied the effects of traditional (conventional) and slow-release N fertilizers on the growth of olive nursery plants and N losses by leaching. The novelty of our work is focused on the fact that, according to our knowledge, this is the first study (realized in large, 50 L pots) investigating the effects of the application of different N origins (BD application or urea), with or without nitrification inhibitor, on the growth, nutrition, NUE and physiology of olive plants.
Thus, the aim of our study was to investigate the effects of urea and BD (applied either independently or in combination with the nitrification inhibitor dycyanodiamide-DCD) on soil fertility, as well as on the growth, foliar nutrition, total plant nutrient content, performance of photosystem II, photosynthetic rate, stomatal conductance, and intercellular CO2 concentration of olive plants (cv. ‘Koroneiki’). ‘Koroneiki’ was chosen for investigation, since it is the most important olive cultivar for high quality olive oil production frequently used in the hyper-intensive olive management systems of hedgerows (receiving high N fertilization inputs).
2. Materials and Methods
2.1. Plant Material, Biogas Digestate Characteristics, and Treatments
Olive plants (one-year olive rooted cuttings, coming from a commercial nursery, approximately 1 m in height), after randomization (based on their initial height), they were transplanted into 50 L pots (each one containing 20 kg soil) and were divided into 7 similar groups. The plants were grown for 230 days (from the 7th of November until the 25th of June) inside an experimental greenhouse (under natural light conditions, with minimum, maximum and average temperature of 10, 32 and 25 °C, respectively, while the relative humidity was ranged from 60 to 78%) of the Department of Forestry and Natural Environment, in the Aristotle University of Thessaloniki. The following 7 treatments (coinciding into one of the 7 groups mentioned above) were applied, with the rate of 261 mL/pot UREA or BD (corresponding to an application of 1402 mg N/pot, either in BD or UREA form): (a) plants fertilized with urea, (b) plants fertilized with urea with supplementary application of the nitrification inhibitor DCD (2.42 g), (c) plants fertilized with the organic material (bio-fertilizer) biogas digestate (BD), (d) plants fertilized with BD with supplementary application of DCD (2.42 g), (e) plants fertilized with acidified BD (pH adjusted to 6.3 from 7.8, with addition of 0.8 mL H2SO4/100 mL BD), (f) plants fertilized with acidified BD with supplementary application of DCD (2.42 g), and (g) plants grown on a Marl native soil type that receives no fertilization (CONTROL). The dose of 261 mL/pot corresponds to an addition of 150 kg N/ha, which is the typical N dose in olive groves. All the fertilizer additions were applied once at the beginning of the experiment. During the whole experimental period, all the plants were irrigated with an automated spray irrigation system with 200 mm of high quality water to achieve soil moisture in approximately 70% of the water holding capacity. In each of the 7 treatments, 5 plant-replicates were included; thus, the total number of experimental plants was 35.
Biogas digestate (BD), used as bio-fertilizer, was a nonfiltered liquid substrate that contained both liquid and solid fractions (generated during anaerobic processes) of domestic animal (cow) origin and all the concentrations of toxic metals (lead, arsenic, nickel, chromium) were below the detectable limits. More specifically, BD had the following nutrient content: N: 0.55% D.W., P: 0.16% D.W. and K: 0.30% D.W., Ca: 2.24% D.W., Mg: 0.58% D.W., Fe: 3.7% D.W., Mn: 512 mg kg−1 D.W., Zn: 500 mg kg−1 D.W., and Cu approximately 200 mg kg−1 D.W. These nutrient concentrations were determined according to standard international protocols existing for vegetal tissue nutrients and metals’ concentrations (such as Kjeldahl for N and ICP for the other nutrients and metals, which are described in detail in the Section 2.4).
2.2. Soil Sampling and Lab Analyses
A typical native Marl soil type was chosen as a substrate for olive plants’ growth from the region of Epanomi, Thessaloniki, Central Macedonia (northern Greece). This soil type was chosen because is one of the 3 main soil types for olive culture in the region of Thessaloniki and Chalkidiki, Central Macedonia [20]. Soil sampling was performed from the upper 60 cm, since most of the active olive trees’ root system exists [5]. Ten soil sub-samples were randomly selected, collected and afterwards mixed (before filling pots and performing soil analyses) to achieve homogenization [2]. After mixing, the unified (homogenized) soil sample was transferred to the experimental greenhouse to fill the 50 L pots.
The unified (homogenized) soil sample was dried inside the greenhouse and the stones were removed; afterwards, it was sieved to pass a 10-mesh screen and was transferred to lab for chemical analyses; its main properties are presented in the Table 1. Lab analyses included pH, particle size analysis, organic matter, % CaCO3, NO3-N, available P, exchangeable cations (Ca, Mg and K) and micronutrients (Fe, Mn, Zn and Cu). The above-mentioned parameters were determined as follows: pH in a soil-distilled water paste (1:1) [21], particle size analysis according to the Bouyoucos method [22], organic matter with potassium dichromate (K2Cr2O7) [23], NO3-N concentration according to the VCl3/Griess method [24], while available P was determined with the Olsen method [25]. Finally, the exchangeable cations were determined with the ammonium acetate (CH3COONH4) method [26] and micronutrients’ concentrations after the extraction of 10 g soil with DTPA, pH 7.3 [27]. The concentrations of Ca, Mg, K, Fe, Mn, Zn, and Cu were determined by ICP (OPTIMA 2100 DV, Optical Emission Spectrometer, Perkin Elmer, Waltham, MA, USA) [28].

Table 1.
Initial (before the beginning of the experiment) fertility of the soil substrate.
2.3. Plant Growth Data
During experimentation (from day 0, i.e., in the beginning of the experiment until the end of it-day 230), the main shoot elongation (cm/day) of all the olive plants was measured. In addition, at the end of the experimental period, apart from the main shoot length, the following plant growth parameters were determined: weight of basal and apical leaves, weight of basal and apical stems, weight of root system and the ratio shoot/root. More specifically, the main shoot of each experimental plant was divided into two equal parts (i.e., the basal and apical shoot), and afterwards root, leaves, and stems of each part were separated from each other; before being washed, the fresh weights (F.W.) of the root, stem, and leaves were measured. By adding the F.W. of all the plant parts, the total plant F.W. was calculated. After all the plant tissues were carefully washed (once with tap and twice with distilled water), they were dried at 75 °C, for 48 h. Then, the dry weights (D.W.) of all the parts (root, basal, and apical leaves; basal and apical stems) were determined. By adding the D.W. of all the plant parts, the total plant D.W. was calculated. Finally, the ratios between the shoot (i.e., leaves + stem) and root were determined, both on the F.W. and D.W. basis.
2.4. Tissue Nutrient Analyses, Total Plant Nutrient Content, and N Use Efficiency (NUE)
At the end of the experimental period, after the plants were harvested and the tissues were separated, washed, and dried, they were ground to a fine powder to pass a 30-mesh screen. A portion of 0.5 g. of the fine powder of each sample was dry-ashed in a muffle furnace at 515 °C for 5 h. Then, the ash was dissolved with 3 mL of 6 N HCl, diluted with double distilled water up to 50 mL, and the concentrations of P, K, Ca, Mg, Fe, Mn, Zn, and Cu were determined by ICP (Perkin Elmer- Optical Emission Spectrometer, OPTIMA 2100 DV) [28].
A 0.25 g portion of sample powder was used for N determination. Nitrogen was determined by the Kjeldahl method [29]. Macronutrient (N, P, K, Ca and Mg) concentrations were expressed in % D.W., while those of micronutrients (Fe, Mn, Zn and Cu) were expressed in mg kg−1 D.W. Multiplying the concentration of each nutrient (μg or mg g−1 D.W.) found in each plant part by the D.W. of the corresponding part, the content (absolute quantity) of each nutrient contained in each plant part at the end of this experiment was calculated. Through the addition of the nutrient contents of different plant parts, the total nutrient content (mg or g) per plant, and thus the total nutrient uptake per plant, was computed. Finally, N use efficiency (NUE) was defined as the amount of total biomass (d.w.) produced per unit of N [30].
2.5. Chlorophyll Fluorescence and Gas Exchange Measurements
In the middle (February), as well as at the end of the experimental period (June), the chlorophyll fluorescence parameters Fv/Fm and Performance Index (PI) were determined. Particularly, the ratio Fv/Fm shows the maximum quantum yield of photosystem II (PSII) (F0: minimum fluorescence, Fm: maximum fluorescence, Fv = Fm − F0: variable fluorescence) and PI reflects the functionality of both photosystems I and II and provides quantitative information on the current state of plant performance under stress conditions [31]. These parameters were determined in the youngest, fully expanded, mature (taken their final size) leaves from the upper part of the main shoot of plants using the PAM-2000 fluorometer (Heinz Walz GmbH, Effeltrich, Germany), after preconditioning the leaves in the dark for 20 min [32].
For the gas exchange measurements (i.e., photosynthetic rate, stomatal conductance, and intercellular CO2 concentration), the LCPRO portable gas exchange measuring system (ADC Bioscientific Ltd., Hoddesdon, UK) was used. The measurements were performed in the youngest, mature, fully expanded leaves from the upper part of the main shoot. Measurements were performed both in the middle (February) and at the end of the experiment (June) from 10:00 to 12:00 a.m. at natural, full light intensity.
2.6. Statistical Analysis
The experimental design consisted of a 7 × 1 completely randomized factorial, with 7 fertilization treatments and 1 olive cultivar. In each of the seven treatments, five plants-replicates (one per pot) were included (the total number of the experimental plants was 7 × 5 = 35). The data were statistically analyzed by the SPSS statistical program (ONE-WAY ANOVA); particularly, for the comparison of the mean values among the treatments, the Duncan’s multiple range test for p ≤ 0.05 was used. The data for plant physiology measurements (chlorophyll fluorescence parameters, photosynthetic rate, stomatal conductance, and intercellular CO2 concentration) were statistically analyzed by TWO-WAY ANOVA, and for the comparison of the mean values among the treatments and the time of measurements (February or June), the Tukey’s test for p ≤ 0.05, was used.
3. Results
3.1. Soil Fertility
Table 1 shows the results of initial soil fertility (i.e., the parameters describing the fertility of soil substrate before the beginning of the experiment, i.e., before application of urea or biogas digestate-BD). As it is clear from Table 1, texture of the original soil was sandy-clay-loam (SCL), pH was slightly above 7 (7.26), organic matter content was relatively poor (1.32%), NO3-N concentration was approximately 15 mg kg−1, while extractable-according to Olsen method- P was poor (6.5 mg kg−1) (Table 1). Exchangeable cations’ concentrations (those of K, Ca and Mg) were within the normal levels of sufficiency, while from the micronutrients, only Fe concentration was insufficient (approximately 3.4 mg kg−1); in contrast, those of Mn, Zn, and Cu were sufficient (approximately 9.3, 1.0, and 0.7 mg kg−1, respectively) (Table 1).
With regard to final soil fertility (i.e., the parameters describing the fertility of soil mixtures at the end of the experiment), Table 2 concludes that pH did not significantly differ among the treatments. In contrast, organic matter content was significantly higher in the BD and BD + DCD treatments (>1.7%) compared to UREA and CONTROL (approximately 1.3%) (Table 2). The highest concentrations of NO3-N were determined in UREA and BD (>13 mg kg−1), which were significantly higher to those found in the ACID BD + DCD and CONTROL. Olsen P was 3–5 times lower in the UREA treatments (UREA, UREA + DCD) and control (about 4.5–5.5 mg kg−1) compared to the organic treatments (BD, BD + DCD, ACID. BD, ACID. BD + DCD) (approximately 15.5–28 mg kg−1) (Table 2). From the exchangeable cations (K, Ca and Mg), only K concentrations were significantly different among the treatments; more specifically, exchangeable K was significantly higher in the ACID. BD and ACID. BD + DCD, compared to the CONTROL, UREA, UREA + DCD and BD treatments (Table 2). From the micronutrients (Fe, Mn, Zn, Cu and B), only Zn, Cu, and B concentrations were found to be significantly higher in the organic treatments BD, BD + DCD, and ACID. BD, compared to the UREA, UREA + DCD, and CONTROL (Table 2).
Table 2.
Final (at the end of the experiment) fertility of the soil mixtures.
3.2. Plant Growth (Main Shoot Length, Plant Tissue Weights, and Total Plant Biomass)
For many growth parameters, significantly lower values were recorded in the control plants compared to other treatments; the ratio shoot/root was significantly lower in the ACID. BD and CONTROL plants (Table 3). The elongation rate showed significant fluctuations among the treatments and time period (Table 4 and Table 5). However, at the end of the experiment, significant differences were found in the main shoot length only between (i) the BD and (ii) the ACID. BD + DCD and CONTROL; all other differences were insignificant (Figure 1). Finally, the d.w. of the total plant biomass was significantly lower in the CONTROL plants, compared to those treated with BD, ACID. BD, BD + DCD, and ACID. BD + DCD (Figure 2).
Table 3.
Plant growth parameters (weight of leaves, stems, and root, as well as values of the ratio shoot/root) among the treatments, at the end of the experiment.
Table 4.
Elongation rate (cm/day) of the main shoot among the treatments for the period from Day 0 to Day 117.
Table 5.
Elongation rate (cm/day) of the main shoot among the treatments for the period from Day 123 to Day 230.
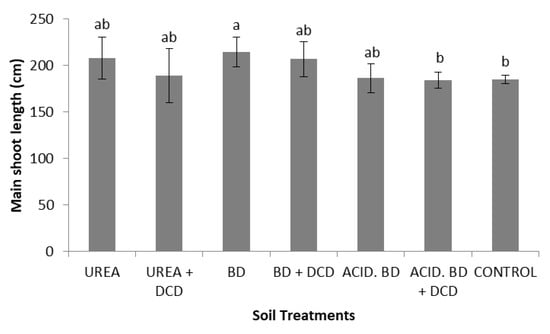
Figure 1.
Main shoot length, among the treatments, at the end of the experiment (Day 230). The different letters on the bars (standard deviation values) symbolize statistically significant differences among the treatments according to Duncan’s multiple range test for p ≤ 0.05.
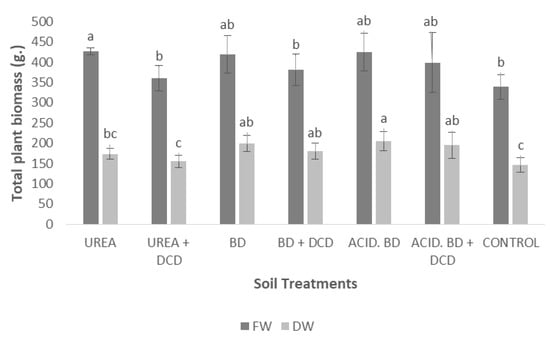
Figure 2.
Total plant biomass among the treatments at the end of the experiment (Day 230). The different letters on the bars (standard deviation values) symbolize statistically significant differences among the treatments, according to Duncan’s multiple range test, for p ≤ 0.05. (FW = Fresh Weight; DW = Dry Weight).
3.3. Foliar Nutrition, Total Plant Nutrient Content and N Use Efficiency (NUE)
The highest foliar N (>2% D.W., both in the basal and apical leaves) concentrations were found in the UREA + DCD treatment; in contrast, the lowest leaf N levels were determined in the ACID.BD, ACID.BD + DCD, and CONTROL plants; with regard to the other macronutrients (P, K, Ca and Mg), only in the case of P, in the basal leaves, was found significantly lower concentration (0.08% D.W.) in UREA, compared to the BD + DCD treatment (0.12% D.W.) (Table 6). Regarding micronutrients, significantly lower foliar Mn (for apical leaves) were found in the ACID.BD and ACID.BD + DCD treatments. For Zn, significantly lower foliar levels (both for basal and apical leaves) were found in BD + DCD. Significantly higher leaf Cu concentrations (both in basal and apical leaves) were determined in the UREA + DCD, compared to the organic treatments and CONTROL (Table 7).
Table 6.
Foliar macronutrient concentrations among the treatments at the end of the experiment.
Table 7.
Foliar micronutrient concentrations among the treatments at the end of the experiment.
The highest total plant N content (approximately 2.5 g) was found in the UREA treatment; significant differences in N content were determined between: (i) UREA and (ii) BD + DCD, ACID.BD, ACID.BD + DCD, and CONTROL plants (Figure 3A). In contrast, the highest P content was found in the BD + DCD, ACID.BD, and ACID.BD + DCD treatments, compared to the UREA, UREA + DCD, and CONTROL plants (Figure 3B). With regard to K content, significant differences were determined only between: (i) the treatments ACID.BD and ACID.BD + DCD and (ii) the UREA + DCD and CONTROL plants (Figure 3C). Finally, with regard to total plant Ca and Mg contents, significant differences were recorded only between UREA and CONTROL, and between the (i) ACID.BD and (ii) UREA + DCD, BD + DCD and CONTROL plants, respectively (Figure 3D,E).
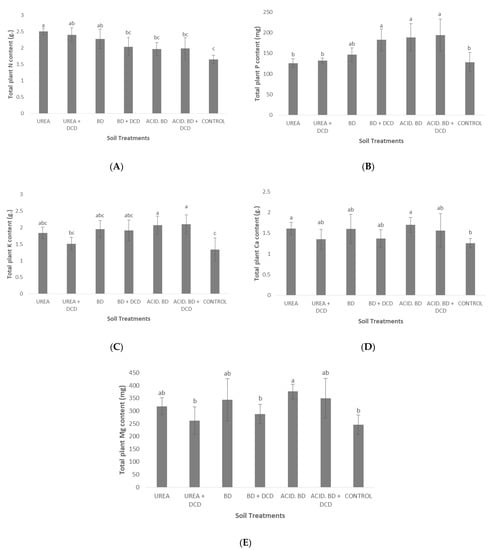
Figure 3.
Total plant N (A), P (B), K (C), Ca (D), and Mg (E) content among the treatments. The different letters on the bars (standard deviation values) symbolize statistically significant differences among the treatments according to Duncan’s multiple range test for p ≤ 0.05.
Similarly, significantly higher Fe content was recorded in the BD, ACID.BD, and ACID.BD + DCD treatments compared to UREA + DCD and CONTROL (Figure 4A). Significantly higher Zn content was found in the ACID.BD + DCD compared to UREA, UREA + DCD, BD, BD + DCD, and CONTROL (Figure 4C), while the lowest Cu contents were determined in the BD, BD + DCD, and ACID.BD treated plants (which were significantly lower to those found in the UREA + DCD and ACID.BD + DCD) (Figure 4D).
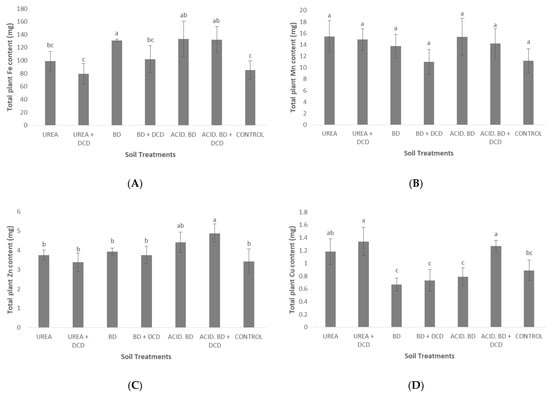
Figure 4.
Total plant Fe (A), Mn (B), Zn (C) and Cu (D) content among the treatments. The different letters on the bars (standard deviation values) symbolize statistically significant differences among the treatments according to Duncan’s multiple range test for p ≤ 0.05.
Finally, the average values for NUE among the treatments were the following: 69.23 in UREA, 64.67 in UREA + DCD, 89.32 in BD, 89.37 in BD + DCD, 103.81 in the ACID. BD, 97.95 in ACID. BD + DCD, and 88.11 in the control plants. From the above average values for NUE, it should be pointed out that significantly higher values were recorded in ACID. BD and ACID. BD + DCD compared to UREA and UREA + DCD treatments (data not-shown).
3.4. Photosystem II Activity (Fv/Fm and Performance Index-PI)
Figure 5 describes the photosystem II activity (as expressed by the parameters Fv/Fm and Performance Index—PI). The highest (and significantly higher) value of the ratio Fv/Fm was found at the end of the experimental period (June) in the UREA + DCD, compared to the other treatments (Figure 5A). Similar to Fv/Fm, the Performance Index (PI) was significantly higher in the UREA + DCD in June compared to all the other treatments, both in the middle (February) and at the end of the experiment (June). The lowest PI value was recorded in the CONTROL plants in June, compared to the other treatments (Figure 5B).
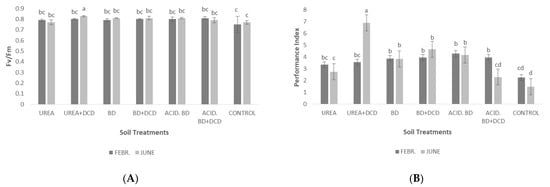
Figure 5.
Photosystem II activity, as expressed by the chlorophyll fluorescence parameters Fv/Fm (A) and performance index—PI (B) among the treatments in the middle (February) and at the end of the experiment (June). The different letters on the bars (standard deviation values) symbolize statistically significant differences among the treatments and time of measurements (February or June) according to Tukey’s test for p ≤ 0.05.
3.5. Photosynthetic Rate, Stomatal Conductance, Transpiration Rate, and Intercellular CO2 Concentration
The highest photosynthetic rate in February was recorded in the UREA treatment; this value (approximately 11 μmol CO2 m−2 s−1) was significantly higher to those determined in the UREA + DCD and BD treatments for the same period (Figure 6A). In June, significant differences were found only between the UREA and UREA + DCD treatments. Generally, significantly higher photosynthetic rates were recorded in February, than in June (Figure 6A). In contrast, stomatal conductance, in most treatments, was significantly lower in February, than in June (Figure 6B). Intercellular CO2 concentration in February was significantly higher in UREA compared to most of the other treatments; in contrast, for the same treatment in June, the lowest intercellular CO2 concentration was recorded compared to all the other treatments (Figure 6C).
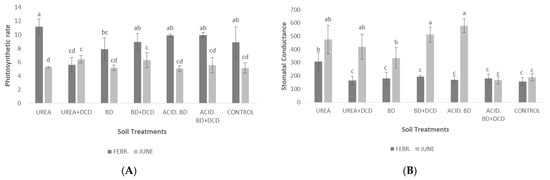
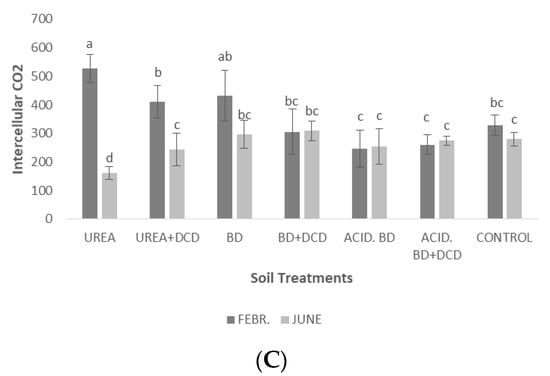
Figure 6.
Photosynthetic rate (μmol CO2 m−2 s−1) (A), stomatal conductance (mmol m−2 s−1) (B) and intercellular CO2 (μmol CO2 mol air−1) (C) among the treatments in the middle (February) and at the end of the experiment (June). The different letters on the bars (standard deviation values) symbolize statistically significant differences among the treatments and time of measurements (February or June) according to Tukey’s test for p ≤ 0.05.
4. Discussion
Final pH (after the end of the experiment) was 0.8–1 unit higher, compared to the initial pH (before the beginning of the experiment) after BD and UREA application. Manure application increases soil pH and salt accumulation; thus, the risk of soil salinization is increased by the continuous application of animal manure [33]. The fact that organic matter was higher in the BD applications compared to the UREA treatment and CONTROL (Table 2), is ascribed to the organic C input after BD addition. These data agree with those of Chatzistathis et al. (2020) [2], who found that, after cow and goat manure application, soil organic matter was significantly higher in the organic treatments (3.49–3.91% d.w.) compared to the control soil (1.55% d.w.). The lowest NO3-N concentration determined in the CONTROL soil (4.85 mg kg−1 d.w.) (Table 1 and Table 2), which may be ascribed to the fact that in the CONTROL soil no N input was received, while in the UREA and BD treatments N inputs, were applied. In the BD and acidified BD treatments, the fact that higher P, K, Zn, and Cu concentration were recorded compared to UREA and CONTROL (Table 2), should be ascribed to the fact that BD contains approximately 0.16% d.w. P, 0.30% d.w. K, 500 mg/kg d.w. Zn, and approximately 200 mg/kg d.w. Cu (described in the Section 2.1), while UREA contains only N (its type is 46-0-0).
The fact that insignificant differences in the main shoot length were recorded: (i) between UREA and BD (or even higher total plant biomass was determined in ACID. BD compared to UREA) (Figure 1)), together with: (ii) the significantly lower total plant biomass (in a d.w. basis) recorded in the CONTROL compared to all the BD treatments (Figure 2), means that BD application was likely the most beneficial strategy to support plant growth; thus, it needs more attention as organic fertilizer on the part of olive growers for further use under field conditions to sustain high crop yields and enhance the sustainable fertilization management of olive groves. In addition, within its advantageous aspects of application should be included the significantly higher NUE values in the ACID. BD treatments compared to UREA and UREA + DCD (data not-shown). However, in order to include a more thorough approach of the advantages of BD application (in the frame of circular economy) on the enhancement of sustainable fertilization management, long-term field studies are needed in the near future.
The fact that the highest leaf N (for both basal and apical leaves) concentrations were found in the UREA + DCD treatment (approximately 2.20 and 2.40% dw, respectively) (Table 6) probably means that the addition of DCD in urea restricted N losses via denitrification, volatilization, and leaching and improved N uptake. One of the most problematic issues in modern agriculture is the high quantity of ammonia being released, resulting in a partial loss of the N, which is contained in urea fertilizers [34]; according to the same authors, the best results were obtained with the use of the urease inhibitor NBPT, which can decrease ammonia emissions from urea fertilizers by 30–70% [34]. Corrochano-Monsalve et al. (2021) [14] found that application of urea with double inhibitor diminished N losses in the form of NH3 volatilization by more than 50% compared to single urea application, while the co-application of biochar and ammonium sulphate, with the nitrification inhibitor DMPP, increased N uptake up to 34% and N use efficiency up to 13.7% [35]. Centeno et al. (2017) [13], who studied the effects of N fertilization and nitrification inhibitors on vegetative growth, production, and olive oil quality of ‘Arbequina’ hedgerow and ‘Picual’ vase-trained orchards, found that the effect of nitrification inhibitor (DMPP) on olive growth or production was not consistent, and N fertilization was not always necessary, since, when leaf N was higher than 2% d.w., fruit d.w., oil content, and oil phenolic content were reduced. Although no direct comparisons of our data to those of Centeno et al. (2017) [13] can be done (due to the different conditions-field vs. large pot experimentation- of the two studies), it is clear that in the UREA treatments (especially in the UREA + DCD treatment) foliar N levels exceeded 2%. The optimum N levels from mature non-fruiting olive leaves from the middle of annual vegetation should vary from 1.6% to 1.8% d.w. [5].
The lowest P concentration in basal leaves (0.08% d.w.) and the lowest total P content were found in UREA (Table 6, Figure 3) and this is probably ascribed to the lack of P in urea (46-0-0). The differences among the treatments in content for the other nutrients (K, Ca, Mg, and micronutrients) may be ascribed either to the differences in nutrient uptake or to the differences in biomass production (or to both of them). Similar differences in total plant nutrient content among the inorganic/organic fertilization treatments (ascribed either to differences in nutrient uptake or to differences in total plant dry weight) were also found in the study of Chatzistathis et al. (2020) [2]. With regard to micronutrients, it is interesting to note that the highest foliar Cu concentrations were recorded in UREA + DCD and UREA (Table 6), despite the fact that the lowest soil Cu availability occurred in these two treatments (Table 2). This may be ascribed to a possible synergistic effect between Cu and Zn in uptake by olive plants (since similar behavior was also observed for soil and foliar Zn-Table 2 and Table 6). The kind of interaction effect (synergistic or antagonistic) between divalent cations (e.g., Zn2+ and Cu2+) is highly dependent on plant species and/or genotypes [36]; in contrast to our results, other researchers found inhibitory or no effects from influence between Zn2+ and Cu2+ for other plant species [37].
Photosystem II activity (as expressed by the parameters Fv/Fm and Performance Index—PI) was significantly higher in the UREA + DCD treatment in June (Figure 5). These findings may be ascribed to the highest foliar Mn concentrations (63 and 52 mg/kg for basal and apical leaves, respectively) determined in UREA + DCD (Table 6). Manganese is mainly involved in photosystem II activity [38] and foliar Mn levels varying from 50 to 150 mg/kg in the youngest mature olives leaves are the optimum ones for PSII activity [5]. In February, the maximum photosynthetic rate was recorded in UREA (Figure 6A); this was ascribed to the significantly higher stomata opening recorded in this treatment (Figure 6B). In June, significantly higher photosynthetic rates occurred in UREA + DCD and BD + DCD, compared to UREA (Figure 6A); however, high stomatal conductance values in June were recorded not only in UREA + DCD and BD + DCD, but also in UREA and ACID.BD treatments (Figure 6B). This could likely be ascribed to the differences in CO2 efficiency (photosynthetic rate/intercellular CO2) among the treatments, i.e., in some cases, although high stomata openings were recorded, the lower CO2 efficiency might lead to lower photosynthetic rates.
5. Conclusions
From all the data presented in this study, it is clear that BD application improved soil properties (organic matter, Olsen P, exchangeable K, and DTPA extractable Cu) compared to UREA, which proves its beneficial role as soil amendment. Regarding the influence of N treatment and nitrification inhibitor on N uptake, it was found that the highest foliar N was determined in the UREA + DCD and the lowest leaf N levels were found in the ACID.BD and ACID.BD + DCD treatments compared to the other ones, something which probably shows the lower N mineralization rate and uptake under these two treatments. In the case of UREA + DCD, the higher leaf N concentration may be ascribed to the possible effect of the nitrification inhibitor on the decrease of N losses via leaching and denitrification, thus causing the increase of N uptake by the olive plants. However, further research, including N losses via denitrification and leaching, should be realized in the near future to test this hypothesis. For the other nutrients, the lowest total plant contents were recorded in the CONTROL soil, which is mainly ascribed to the lowest total plant biomass, rather than to lower nutrient uptake. Significantly higher NUE values were found in ACID. BD and ACID. BD + DCD compared to the UREA treatments (UREA, UREA + DCD), which shows that the optimum treatments for NUE were those of ACID. BD. Finally, the highest PSII efficiency at the end of the experiment in the UREA + DCD treatment is likely owed to the optimum foliar Mn levels determined in this treatment. It is expected that the above data will constitute a first step towards a comparative approach between UREA and BD application in super-intensive olive groves, with the aim to decrease high (often unnecessary) N fertilization rates and boost sustainable nutrient management in the frame of circular economy strategy. However, long-term field studies are needed in the near future to obtain stable conclusions.
Author Contributions
Conceptualization: T.C. and V.A.T.; methodology: T.C., V.A.T. and A.P.; validation: T.C. and V.A.T.; formal analysis: T.C.; investigation: T.C., V.A.T. and A.P.; data curation: T.C. and A.G.; writing—original draft: T.C.; writing—review and editing: T.C. and V.A.T.; visualization: T.C.; supervision, project administration: T.C.; software: V.A.T. and A.G.; resources: A.P. and A.G. All authors have read and agreed to the published version of the manuscript.
Funding
This research received no external funding.
Data Availability Statement
The data presented in this study are available on request from the corresponding author (T.C.). The data are not publicly available due to privacy reasons.
Conflicts of Interest
The authors declare no conflict of interest.
References
- Roussos, P.A.; Gasparatos, D.; Kechrologou, K.; Katsenos, P.; Bouchagier, P. Impact of organic fertilization on soil properties, plant physiology and yield in two newly planted olive (Olea europaea L.) cultivars under Mediterranean conditions. Sci. Hortic. 2017, 220, 11–19. [Google Scholar] [CrossRef]
- Chatzistathis, T.; Papadakis, I.E.; Papaioannou, A.; Chatzissavvidis, C.; Giannakoula, A. Comparative study effects between manure application and a controlled-release fertilizer on the growth, nutrient uptake, photosystem II activity and photosynthetic rate of Olea europaea L. (cv. ‘Koroneiki’). Sci. Hortic. 2020, 264, 109176. [Google Scholar] [CrossRef]
- Miller, R.J.; Smith, R.B. Nitrogen balance in the southern San Joaquin Valley. J. Environ. Qual. 1976, 5, 274–278. [Google Scholar] [CrossRef]
- Fernandez-Escobar, R.; Benlloch, M.; Herrera, E.; Garcia-Novelo, J.M. Effect of traditional and slow-release N fertilizers on growth of olive nursery plants and N losses by leaching. Sci. Hortic. 2004, 101, 39–49. [Google Scholar] [CrossRef]
- Therios, I. Olives. Crop Production Science in Horticulture; C.A.B. International: Cambridge, MA, USA, 2009. [Google Scholar]
- Fernandez-Escobar, R.; Garcia Barragan, T.; Benlloch, M. Estado nutritivo de las plantaciones de olivar en la provincia de Granada. ITEA 1994, 90, 39–49. [Google Scholar]
- Fernandez-Escobar, R.; Marin, L. Nitrogen fertilization in olive orchards. Acta Hort. 1999, 474, 333–335. [Google Scholar] [CrossRef]
- Geng, Y.; Wang, J.; Sun, Z.; Ji, C.; Huang, M.; Zhang, Y.; Xu, P.; Li, S.; Pawlett, M.; Zou, J. Soil N-oxide emissions decrease from intensive greenhouse vegetable fields by substituting synthetic N fertilizer with organic and bio-organic fertilizers. Geoderma 2021, 383, 114730. [Google Scholar] [CrossRef]
- Koszel, M.; Lorencowicz, E. Agricultural use of biogas digestate as a replacement fertilizers. Agric. Agric. Sci. Proc. 2015, 7, 119–124. [Google Scholar] [CrossRef] [Green Version]
- Kesenheimer, K.; Augustin, J.; Hegewald, H.; Köbke, S.; Dittert, K.; Räbiger, T.; Suárez Quiñones, T.; Prochnow, A.; Hartung, J.; Fuß, R.; et al. Nitrification inhibitors reduce N2O emissions induced by application of biogas digestate to oilseed rape. Nutr. Cycl. Agroecos. 2021, 120, 99–118. [Google Scholar] [CrossRef]
- Buchen-Tschiskale, C.; Hagemann, U.; Augustin, J. Soil incubation study showed biogas digestate to cause higher and more variable short-term N2O and N2 fluxes than mineral-N. J. Plant Nutr. Soil Sci. 2020, 183, 208–219. [Google Scholar] [CrossRef] [Green Version]
- Castellano-Hinojosa, A.; Gonzalez-Lopez, J.; Bedmar, E.J. Effect of N fertilization on nitrous oxide emission and the abundance of microbial nitrifiers and denitrifiers in the bulk and rhizosphere soil of Solanum lycopersicum and Phaseolus vulgaris. Plant Soil 2020, 451, 107–120. [Google Scholar] [CrossRef]
- Centeno, A.; Garcia, J.M.; Gomez-del-Campo, M. Effects of N fertilization and nitrification inhibitor product on vegetative growth, production and oil quality in ‘Arbequina’ hedgerow and ‘Picual’ vase-trained orchards. Gracas y Aceites 2017, 68, e215. [Google Scholar] [CrossRef] [Green Version]
- Corrochano-Monsalve, M.; Bozal-Leorri, A.; Sanchez, C.; Gonzalez-Murua, C.; Estavillo, J.M. Joint application of urease and nitrification inhibitors to diminish gaseous nitrogen losses under different tillage systems. J. Clean. Prod. 2021, 289, 125701. [Google Scholar] [CrossRef]
- Souza, E.F.C.; Rosen, C.J.; Venterea, R.T. Co-application of DMPSA and NBPT with urea mitigates both nitrous oxide emissions and nitrate leaching during irrigated potato production. Environ. Pollut. 2021, 284, 117124. [Google Scholar] [CrossRef]
- Tao, R.; Li, J.; Hu, B.; Shah, J.A.; Chu, G. A 2-year study of the impact of reduced nitrogen application combined with double inhibitors on soil N transformation and wheat productivity under drip irrigation. J. Sci. Food Agric. 2021, 101, 1772–1781. [Google Scholar] [CrossRef]
- Ferrari-Machado, P.V.; Neufeld, K.; Brown, S.E.; Voroney, P.R.; Bruulsema, T.W.; Wagner-Riddle, C. High temporal resolution nitrous oxide fluxes from corn (Zea mays L.) in response to the combined use of nitrification and urease inhibitors. Agric. Ecosys. Environ. 2020, 300, 106996. [Google Scholar] [CrossRef]
- Chaddy, A.; Melling, L.; Ishikura, K.; Hatano, R. Soil N2O emissions under different N rates in an oil palm plantation on tropical peatland. Agriculture 2019, 9, 213. [Google Scholar] [CrossRef] [Green Version]
- Maris, S.C.; Teira-Esmatges, M.R.; Arbones, A.; Rufat, J. Effect of irrigation, nitrogen application, and a nitrification inhibitor on nitrous oxide, carbon dioxide and methane emissions from an olive (Olea europaea L.) orchard. Sci. Total Environ. 2015, 538, 966–978. [Google Scholar] [CrossRef]
- Chatzistathis, T.; Therios, I.; Alifragis, D.; Dimassi, K. Effect of sampling time and soil type on Mn, Fe, Zn, Ca, Mg, K and P concentrations of olive (Olea europaea L., cv. ‘Koroneiki’) leaves. Sci. Hortic. 2010, 126, 291–296. [Google Scholar] [CrossRef]
- McLean, E. Soil pH and lime requirement. In Methods of Soil Analysis, Part 2: Chemical and Microbiological Properties; Page, A.L., Miller, R.H., Keeney, D.R., Eds.; Agronomy Monograph, ASA, SSSA: Madison, WI, USA, 1982; pp. 199–224. [Google Scholar]
- Gee, G.; Bauder, J. Particle-size analysis. In Methods of Soil Analysis, Part 1: Physical and Mineralogical Methods; Klute, A., Ed.; ASA, SSSA: Madison, WI, USA, 1986; pp. 383–411. [Google Scholar]
- Nelson, D.W.; Sommers, L.E. Total carbon, organic carbon and organic matter. In Methods of Soil Analysis, Part 2: Chemical and Microbiological Properties; Page, A.L., Miller, R.H., Keeney, D.R., Eds.; Agronomy Monograph, ASA, SSSA: Madison, WI, USA, 1982; pp. 539–547. [Google Scholar]
- Hood-Nowotny, R.; Umana, N.H.-N.; Inselbacher, E.; Oswald-Lachouani, P.; Wanek, W. Alternative Methods for Measuring Inorganic, Organic, and Total Dissolved Nitrogen. Soil Sci. Soc. Am. J. 2010, 74, 1018–1027. [Google Scholar] [CrossRef]
- Olsen, S.; Sommers, L. Phosphorus. In Methods of Soil Analysis, Part 2: Chemical and Microbiological Properties; Page, A.L., Miller, R.H., Keeney, D.R., Eds.; Agronomy Monograph, ASA, SSSA: Madison, WI, USA, 1982; pp. 403–430. [Google Scholar]
- Thomas, G.W. Exchangeable cations methods of soil analysis. In Methods of Soil Analysis, Part 2: Chemical and Microbiological Properties; Page, A.L., Miller, R.H., Keeney, D.R., Eds.; Agronomy Monograph, ASA, SSSA: Madison, WI, USA, 1982; pp. 159–166. [Google Scholar]
- Lindsay, W.L.; Norvell, W.A. Development of a DTPA soil test for zinc, iron, manganese, and copper. Soil Sci. Soc. Am. J. 1978, 42, 421–428. [Google Scholar] [CrossRef]
- Hansen, T.H.; De Bang, T.C.; Laursen, K.H.; Pedas, P.; Husted, S.; Schjoerring, J.K. Multielement plant tissue analysis using ICP spectrometry. In Plant Mineral Nutrients. Methods in Molecular Biology (Methods and Protocols); Maathuis, F., Ed.; Humana Press: Totowa, NJ, 2013; Volume 953. [Google Scholar] [CrossRef]
- Chapman, H.D.; Pratt, P.F. Methods of Analysis for Soils, Plants and Waters; Division of Agricultural Sciences, University of California: Riverside, CA, USA, 1961; p. 309. [Google Scholar]
- Chapin, F.S.; Van Cleve, K. Approaches to studying nutrient uptake, use and loss in plants. In Plant Physiological Ecology-Field Methods and Instrumentation; Pearcy, R.W., Ehleringer, J.R., Mooney, H.A., Rundel, P.W., Eds.; Springer: New York, NY, USA, 1991; pp. 185–207. [Google Scholar]
- Strasser, R.J.; Tsimilli-Michael, M.; Srivastava, A. Analysis of the chlorophyll a fluorescence transient. In Chlorophyll a Fluorescence: A Signature of Photosynthesis; Papageorgiou, G., Govindjee, G., Eds.; Springer: Dordrecht, The Netherlands, 2004; pp. 321–362. [Google Scholar]
- Schreiber, U.; Schliwa, U.; Bilger, W. Continuous recording of photochemical and non-photochemical chlorophyll fluorescence quenching with a new type of modulation fluorometer. Photosynth. Res. 1986, 10, 51–62. [Google Scholar] [CrossRef] [PubMed]
- Alifragis, D. Soil: Genesis—Properties—Classification; Aibazis Publications: Thessaloniki, Greece, 2008; p. 582. (In Greek) [Google Scholar]
- Klimczyk, Μ.; Siczek, A.; Schimmelpfennig, L. Improving the efficiency of urea-based fertilization leading to reduction in ammonia emission. Sci. Total Environ. 2021, 771, 145483. [Google Scholar] [CrossRef] [PubMed]
- Hailegnaw, N.S.; Mercl, F.; Kulhanek, M.; Szakova, J.; Tlustos, P. Co-application of high temperature biochar with 3,4-dimethylpyrazol e-phosphate treated ammonium sulphate improves nitrogen use efficiency in maize. Sci. Rep. 2021, 11, 5711. [Google Scholar] [CrossRef] [PubMed]
- Chatzistathis, T. Micronutrient Deficiency in Soils and Plants; Bentham Science Publishers: Sharjah, United Arab Emirates, 2014. [Google Scholar]
- Gong, B.; He, E.; Qiu, H.; Van Gestel, C.A.M.; Romeiro-Freire, A.; Zhao, L.; Xu, X.; Cao, X. Interactions of arsenic, copper and zinc in soil-plant system: Partition, uptake and phytotoxicity. Sci. Total Environ. 2020, 745, 140926. [Google Scholar] [CrossRef]
- Chatzistathis, T.; Therios, I. How soil nutrient availability influences plant biomass and how biomass stimulation alleviates heavy metal toxicity in soils: The cases of nutrient use efficient genotypes and phytoremediators, respectively. In Biomass Now-Cultivation and Utilization; Matovic, D.M., Ed.; IntechOpen: Rijeka, Croatia, 2013; pp. 427–448. ISBN 978-953-51-1106-1. [Google Scholar]
Publisher’s Note: MDPI stays neutral with regard to jurisdictional claims in published maps and institutional affiliations. |
© 2022 by the authors. Licensee MDPI, Basel, Switzerland. This article is an open access article distributed under the terms and conditions of the Creative Commons Attribution (CC BY) license (https://creativecommons.org/licenses/by/4.0/).