1. Introduction
Climate change is an important issue for the 21st century and agriculture contributes to the release of 10–14% of greenhouse gas and 95% of ammonia emissions [
1]. One of the most important factors that contribute to greenhouse gas emissions is the use of inputs, such as nitrogen (N) fertilizers. Additionally, excessive use of fertilizers can lead to pollution of surface and ground water [
2]. Moreover, there is a significant cost due to the pollution from nitrogen fertilizers that are used in modern agriculture, which can reach up to 320 billion euros. Therefore, it is important to reduce the use of fertilizers and at the same time to use the inputs more sustainably [
3].
Nitrogen is one of the most important nutrients for crop production, especially for maize production. It affects leaf area development, maintenance, and dry matter production [
4]. In addition, N fertilization affects leaf chlorophyll content and is used to determine the N status of the plant [
5]. Moreover, maize dry matter (DM) production increases linearly with N application and also maize silage quality up to 200 kg N ha
−1 [
6]. However, higher N rates can lead to a significant increase in residual NO
3-N concentrations and to underground water contamination. Therefore, there is a need to minimize NO
3-N leaching and at the same time to maintain or improve crop yield. Timing of N application and form of N can be an adequate strategy to ensure N availability when crops need it and minimize N losses.
In addition, the increase in fossil fuel prices led to the increase in fertilizer cost and also the inputs that are used in crop production have risen as one of the most important issues. There is also a great interest in identifying sustainable management combinations of N forms, type of fertilizers, time of application, and N amendments that could result in more efficient use of N. Alternative forms of fertilizers such as manures (liquid manure, farmyard manures, composts, and green manures) can be used as sources of plant nutrients and at the same time increase N use efficiency and crop yield [
7,
8,
9,
10]. Manures can increase the seasonal soil N mineralization available to the crops [
11,
12,
13]. However, manures also have disadvantages, such as odor, high fly breeding potential, possible transfer of pathogens and weeds, NO
3-N leaching, methane emission that contribute to the greenhouse gases, increase of soil salinity, etc. [
11,
12,
13].
Modern agriculture depends on utilizing large amounts of energy from fossil fuels and there is a need to reduce the inputs and maintain the productivity in high levels and the sustainable management in order to reduce the negative effect of the excessive inputs on climate change. According to others [
14,
15,
16,
17,
18], fertilizers have the highest energy equivalent in maize production, up to 51% of the energy that is required, while electricity accounts for 20%, and fossil fuels for 23% of the total energy. In addition, the ratio of outputs/inputs is 0.76 in maize production and this ratio indicates that the inputs are not used efficiently.
Furthermore, the agricultural sector is the major contributor of greenhouse gas (GHG) emissions, which are related to direct losses of soil organic carbon (SOC) and nitrogen in forms of CH
4, CO
2, and N
2O globally [
15,
16]. Improper farming operations will release substantial amounts of GHGs, thereby increasing the carbon footprint that ultimately leads to climate change [
17]. Considering that the inputs with high carbon footprint are the fertilizers, fuel, and machinery, producers should implement practices to reduce their effects [
17]. According to other researchers [
15,
16,
17,
18], the GHGs emissions released from maize production increased from 3633.7 kg CO
2-eq ha
−1 in 2004 to 4043.3 kg CO
2-eq ha
−1. Fertilizer application, soil N
2O emission, and irrigation contributed more than 85% of total GHGs emissions. The reduction of GHGs emissions from agricultural practices is a quite complex and multifaceted challenge. In addition, the actions to reduce GHG emissions are limited and most of them are strongly connected to management practices. The effect of agriculture on GHGs emissions can be reduced by using sustainable practices such as crop rotation, reduced or no tillage, use of renewable energy sources, organic cultivation and integrated crop management, reduction of nitrogen fertilizers, and use of alternative organic N fertilization [
19,
20,
21].
Nitrogen fertilization of maize is one of the most important management practices that affects the growth and the yield of the crop [
13,
22,
23,
24,
25]. However, there is limited published work about the effects of application of cattle manure and green manure compared with the inorganic fertilizer and the effect of the different forms of N application on maize growth and development. In addition, any crop practice such as the application of cattle manure and green manure should be evaluated for its suitability in the cropping system before its adoption by the farmers. The objective of the present study was to evaluate the different types of fertilizers on the growth and yield of maize and also on the energy and carbon footprint of the crop.
2. Materials and Methods
2.1. Experimental Site
The experiment was conducted in a commercial field in the area of Thessaloniki, (40°34′11.4″ N 22°59′16.0″ E, 30 m), in North Greece for two years 2019 (Y1) and 2020 (Y2). The soil type was clay loam with pH 7.8 (1:2 water), EC
se 0.67 dSm
−1, and contained organic matter of 23 g·kg
−1, Ν-ΝO
3 23.8 mg·kg
−1, P (Olsen) 29.6 mg·kg
−1, and exchangeable K 800 mg·kg
−1. The weather conditions were recorded daily with an automated weather station, which was located on site, and they are referred to as monthly mean value data for both years (
Table 1).
2.2. Experimental Design
The experimental design that was used was a completely randomized block design with four replications. The following treatments were used: (1) no fertilization (control), (2) green manure with common vetch (GM), (3) conventional fertilizer (CF) with application of NP (12-20-0) fertilizer and urea (46-0-0) in an amount of N 310 kg Nha
−1 and 40 kg P
2O
5 ha
−1, (4) slow-release fertilizer (SRF) with application of ΝΡ (16-20-0) and SRF Stabil N-M 40-0-0+14SO
3 (with a urease inhibitor) in an amount of 310 kg N ha
−1 and 40 kg P
2O
5 ha
−1 respectively, and (5) application of cattle manure (CM) in an amount equal to that of the conventional fertilizing in N and quantity of 20 Mg ha
−1 (
Table A1,
Appendix A). The chemical properties of manure were as follows: pH 7.8, organic matter 383.8 g·kg
−1, N 16.9 g·kg
−1, P 680 mg·kg
−1, and K 2500 mg·kg
−1. The manure was incorporated with a tandem harrow disc to a depth of 12–15 cm within 15 days before sowing.
Two maize hybrids which are widely used in Greece, Pioneer 1291 (H1) (FAO 700) and Dekalb 6777 (H2) (FAO 700), were used in the study. Common vetch (Vicia sativa L.) was sown and used as a green manure crop in both growing seasons. The common vetch cultivar that was used was “Marianna” at a seeding rate of 150 kg·ha−1 and it was incorporated into the soil 15 days before the sowing of maize. The sowing of maize was conducted on 4 April 2019 and on 8 May 2020 with a four-row pneumatic seeding machine, at a seeding rate of 80,000 plants/ha. The experimental area that was used was 2.300 m2, and each plot was 5.6 m × 20 m, covering an area of 112 m2. The emergence of the maize plants was reported on the 17 April 2019 during the first year and on the 26 May 2020 during the second year, while harvest took place on the 10 August 2019 and on the 14 September 2020 for 2019 and 2020, respectively. All agricultural activities were recorded including the working time of the agricultural tractor and the fuel consumption.
2.3. Crop Management
The experimental area was irrigated with overhead sprinklers with a 400 mm total amount of water. First irrigation took place within the first week after maize sowing for all years. Weed control was achieved with Terbuthylazine 594 g ai ha−1, Mesotrione 126 g ai ha−1, and Nicosulfuron 116 g ai ha−1. Additional mechanical weeding was performed to control escaped weeds in both years. No other pesticides were used.
There were eight rows in each plot and representative plants were used from the two center rows of each plot and were measured for the physiological and morphological characteristics and the silage yield. Representative plants are considered plants in full growth, with healthy and uninfected leaves, with full exposure to sunlight and plants in the same growth stage. Furthermore, the energy equivalent and the carbon footprint were calculated. The measurements of the morphological and physiological characteristics occurred during the months June–August, for both years, the first one at the stage of anthesis (GS1) and the second one 20 days later (GS2). More specifically, the following measurements were conducted:
2.4. Morphological Characteristics
2.4.1. Plant Height
Plant height was determined with a measuring tape in five plants, which were in the central rows of each plot for both growth stages.
2.4.2. Leaf Area Index
The LAI was determined by using the AccuPAR, LP–80 (Decagon Devices, Inc., NE Hopkins Ct, Pullman, U.S.). The device comprises an external sensor, a microprocessor, and a data recorder. The sensors record the photosynthetically active radiation, in the 400 to 700 nm waveband, in units of micromoles per meter squared per second (µmol·m−2·s−1). The measurements took place during the hours between 11 a.m.–1 p.m. During this time three measurements were conducted within the canopy. The mean value of these measurements was used as the value of LAI.
2.5. Physiological Characteristics
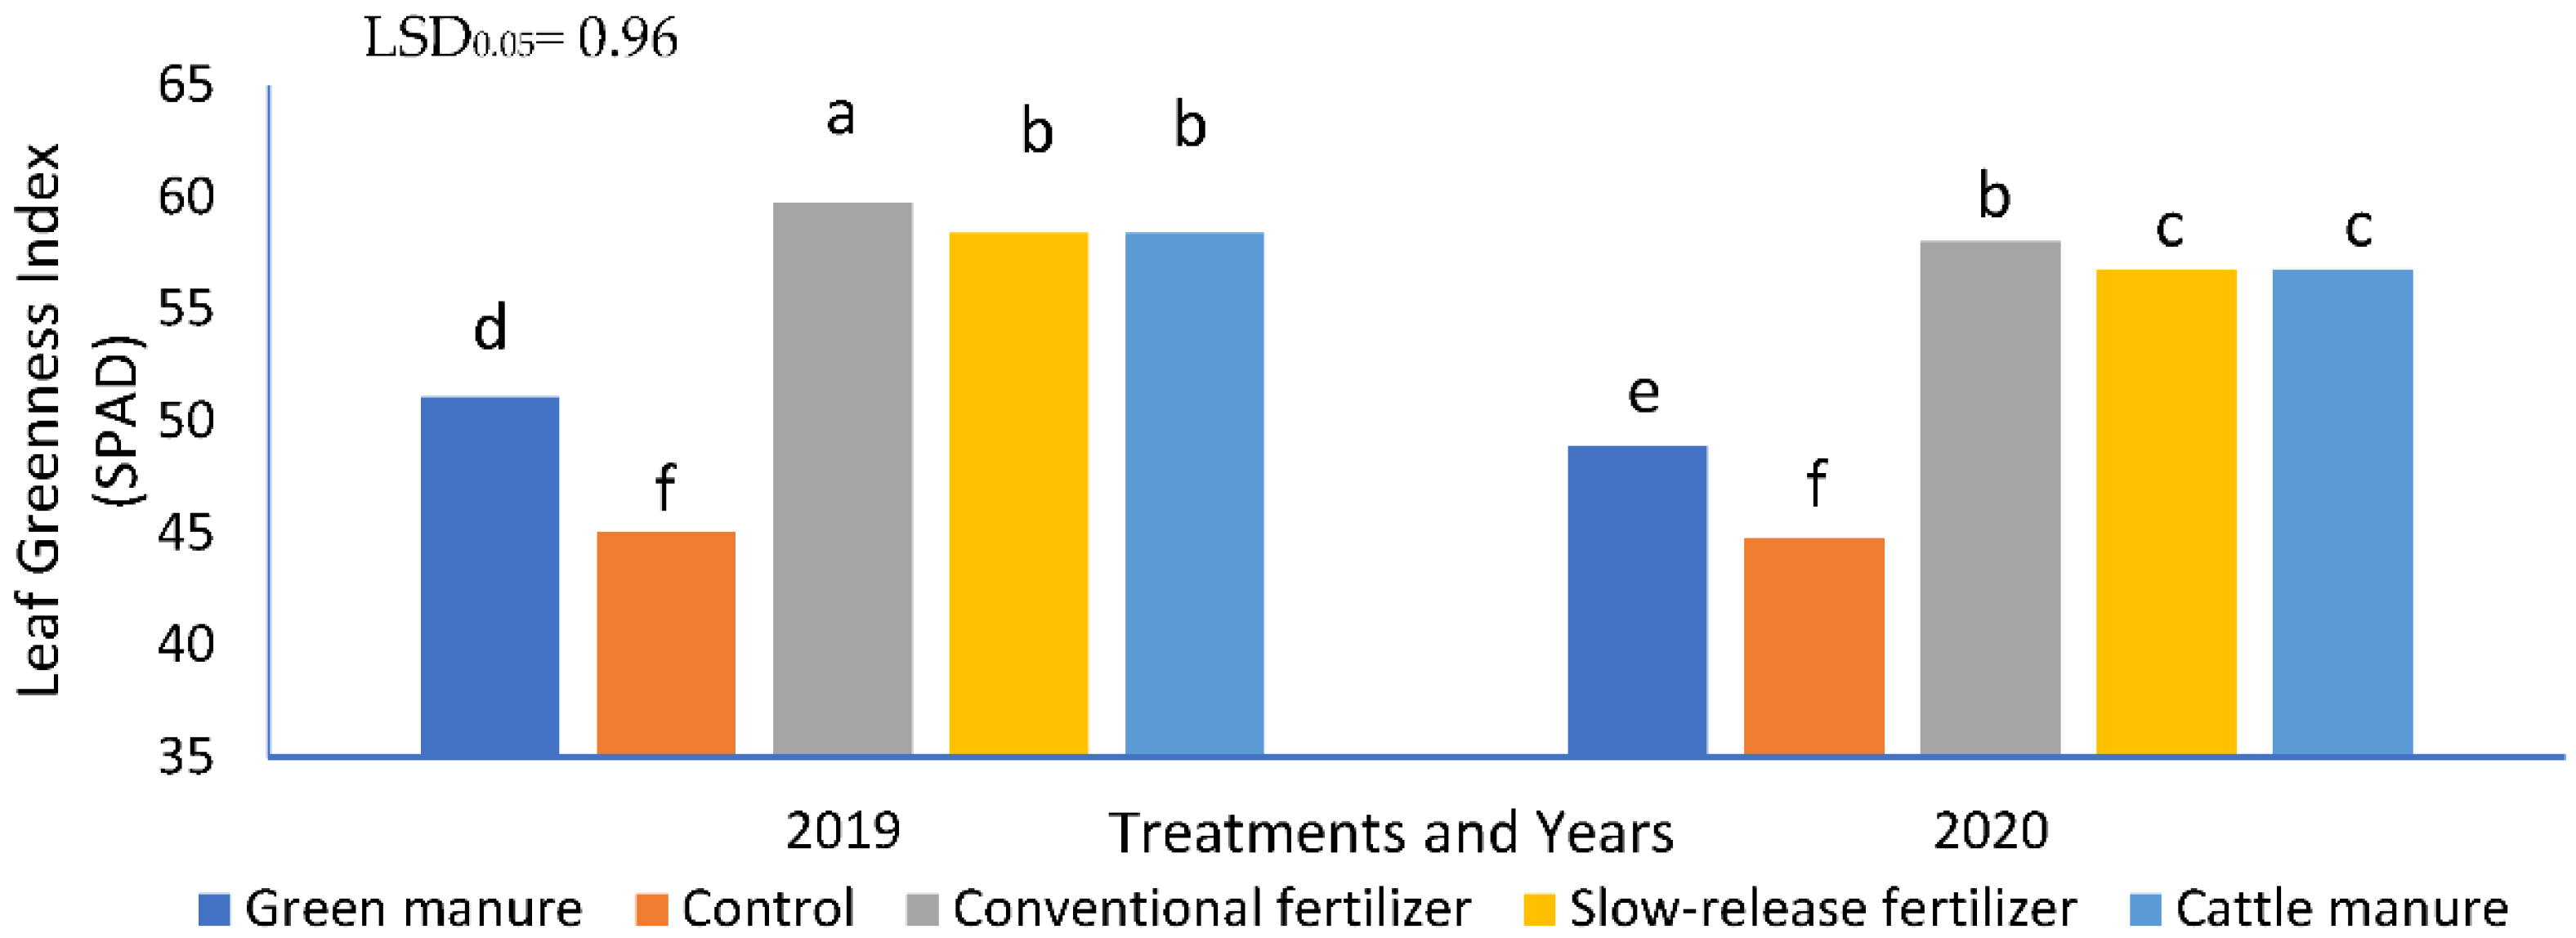
Leaf Greenness Index (SPAD Index)
The leaf greenness index was measured using the portable device SPAD-502 (Minolta Co Ltd., Osaka, Japan) [
26]. This meter determines the intensity of the green color on the leaves on a plant, according to the light absorbance in two wavelengths (650 and 940 nm). The measurements were taken from 16 plants of the main rows of each plot. The measurements were taken in the middle from the leaf of the main cob [
27].
2.6. Energy Equivalent
Agricultural practices should take into consideration energy efficiency, so that a low input management can be implemented and the environmental effects can be reduced [
28]. The energy approach is based on the conversion of all production factors, and even of every cultivation product, into energy units.
Table 2 shows the energy equivalents that are used in agricultural production. The amount of input in this study was calculated per hectare and these data were multiplied by the coefficient of the energy equivalent. The energy equivalents were conveyed in megajoules (MJ). To determine the output/input ratio [
1] and the efficiency of the energy used [
2] while producing maize, the following formulas were used [
14].
2.7. Carbon Footprint
In the present study carbon (C) emissions were calculated by taking into account the C emissions that are derived directly from crop management practices, materials, and machinery inputs. The total sum of the maize C footprint of the growing season was calculated by using the following formula [
34]:
where IR is the input ratio and CE is the coefficient of greenhouse gas emissions for each input (kg CO
2-eq kg
−1) (
Table 3).
2.8. Statistical Analysis
Data for height, LAI, and SPAD were analyzed according to a 2 × 5 × 2 × 2 experiment based on the Randomized Complete Block Design. The experiment involved four factors, in a split-split-split plot arrangement [
39,
40], with four replications (blocks) per combined treatment: the “year”, the “fertilizer treatment”, the “maize hybrid”, and the “growth stage”. The two years were considered as the main plots, the five fertilizer treatments were the sub-plots, the two maize hybrids were the sub-sub plots, and, finally, the two growth stages were considered as the sub-sub-sub plots. Data for energy output/input ratio, energy efficiency, and silage yield were analyzed according to a 2 × 5 × 2 experiment based on the Randomized Complete Block Design. The experiment involved three factors, in a split-split plot arrangement [
39,
40], with four replications (blocks) per combined treatment: the “year”, the “fertilizer treatment”, and the “maize hybrid”. The two years were considered as the main plots, the five fertilizer treatments were the sub-plots, the two maize hybrids were the sub-sub plots. In all cases, data were analyzed within the methodological frame of Mixed Linear Models with the ANOVA method [
39,
40]. The ANOVA method was used mainly for computing the correct standard errors of the differences between mean values of treatments’ combinations. Mean values were compared using the “protected” Least Significant Difference (LSD) criterion. The combined analysis over the two growing seasons facilitated the calculation of a common LSD value for conducting all interesting comparisons between treatments’ combinations means. In all hypothesis testing procedures, the significance level was predetermined at
a = 0.05 (
p ≤ 0.05). Statistical analyses were accomplished with the IBM SPSS v.26.0 statistical software.
5. Conclusions
Maize is a crop species that requires high amount of nutrients due to the high production of dry matter and grain yield. One of the most important factors that contribute to an increase in the dry matter production is fertilization. In the present study, which was conducted in a commercial field in the area of Thessaloniki, it was found that fertilization affects the morphological and physiological characteristics of maize plants. The mineral fertilizers and cattle manure increased the plant height, LAI, and SPAD index compared with the use of green manure and the control treatment. It was found that the highest percentage of energy input in maize cultivation is because of the use of fertilizers, diesels, and machinery. Consequently, application of slow release fertilizers and cattle manure can improve all the characteristics that were studied and perform similarly to conventional fertilizers, which means that they can be used as alternatives for fertilization. This study provides new information regarding the effect of N application on maize phenology, growth, and development, which affects the productivity of the crop. Therefore, they can be used by the farmers in Mediterranean areas as they maintain or improve crop yield. It is important that the production rate can maintained and that the environmental cost is decreased with the use of appropriate fertilizers.


 ,
, 
