Article

Nutritional Characterization and Novel Use of “Copafam” Bean (Phaseolus coccineus L.) for the Sustainable Development of Mountains Areas

1
Centre of Applied Studies for the Sustainable Management and Protection of Mountain Areas-CRC Ge.S.Di.Mont., Università degli Studi di Milano, 25048 Edolo, Italy
2
Department of Food, Environmental and Nutritional Sciences (DeFENS), Università degli Studi di Milano, 20133 Milan, Italy
3
Department of Agricultural and Environmental Sciences-Production, Landscape and Agroenergy-DiSAA, Università degli Studi di Milano, 20133 Milan, Italy
*
Author to whom correspondence should be addressed.
Sustainability 2022, 14(20), 13409; https://doi.org/10.3390/su142013409
Submission received: 21 September 2022 / Revised: 12 October 2022 / Accepted: 14 October 2022 / Published: 18 October 2022
(This article belongs to the Special Issue Sustainable Development in Mountain Areas)

Abstract

:
Agrobiodiversity conservation includes strategies and actions to be taken to prevent landrace loss, a worldwide problem. Landraces are local varieties that have agricultural, cultural, and historical value but most of these are not studied yet. This research aimed to study the nutritional and phytochemical characteristics of the “Copafam” bean. In addition, the sensory properties and consumers’ hedonic ratings in a model food formulation (biscuits) made by this landrace have been examined. The results show that “Copafam” had a high dietary fiber content (34.83 ± 2.48 g/100 g dw) and it resulted in a great source of secondary metabolites as polyphenols (121.36 ± 5.31 mg GAE/g dw), flavonoids (6.51 ± 0.17 mg/kg dw), and anthocyanins (28.11 ± 0.16 mg Cy3 G/kg dw), having remarkable antioxidant activity too. Biscuits made from “Copafam” bean flour were characterized by a darker color and crunchy texture, and it was considered acceptable by consumers. All these characteristics make it a resource of great interest for innovative forms of consumption like fortified foods. This research showed that landraces can represent a great resource for an innovative food industry aiming to preserve agrobiodiversity and promote the sustainable development of mountain areas.

1. Introduction

Today there are important processes underway in European mountains: from one side, the process of abandonment by population, from the other side, the newcomers’ arrival. These sociocultural processes are concurrent and often in correlation with the loss of biodiversity and agrobiodiversity [1], determined also by environmental issues such as climate change [2]. Agriculture is often seen as a fundamental business for the recovery of abandoned land and the start of a recovery process of marginal areas and the connected biodiversity and agrobiodiversity [3,4].
Plant agrobiodiversity includes wild relatives, landraces, and modern cultivars [5]. Landraces are dynamic populations of cultivated plants that have a historical origin and distinct identity and lack formal crop improvement, as well as often being genetically diverse, locally adapted, and associated with traditional farming systems [6]. Landraces are genetic resources for crop improvement programs [7,8] and a source of food diversity [9].
They are a priceless heritage, however, are undergoing losses worldwide. Landraces adapted to the environment and climate changes can represent a valuable resource for innovative low-input agricultural systems [2,10].
Considering the increasingly important impacts of climate change and the fast changes in the socio-economic contexts on food production and demand, genetic resources are becoming even more important: United Nations (UN) Organization estimates that the growth of food demand, linked to the increase in population (a world population of 10 billion people expected for 2050), will result in the doubling of food production globally [11,12].
In this context, the last century saw the loss of 75% of global agrobiodiversity and today most of the food worldwide is produced by about 10 plant species, as estimated by the Food and Agriculture Organization (FAO) of the United Nations [13,14]. To overcome this issue, European Union (EU) started to act to preserve agrobiodiversity. This resulted in the drawing up of international strategies such as the EU Biodiversity Strategy 2020 [15] and the 2030 Agenda for Sustainable Development [12].
Sustainable policies on food production must be adopted, including improving yields of agricultural land, encouraging forms of circular economy, and adopting more sustainable food models [16].
The integration of biodiversity conservation into key policies for agriculture and forestry plays a major role in Europe’s biodiversity, in fact, the EU adopted the European Register of Conservation Varieties, which represents one of the most modern instruments for in situ conservation of landraces [17]. The decline of genetic diversity, as well as the need of promoting and facilitating the use of traditional crop varieties, have been confirmed also in the 2030 EU agenda. The UE states that by 2030 it is necessary to invert the trend of genetic erosion in agriculture by, for example, the conservation and use of traditional breeds and cultivars [18].
The European Union countries are acting to tackle this problem by following European guidelines. In this context, Italy is rich in agrobiodiversity though most of the landraces are not studied yet, leading to the necessity to make efforts in acquiring knowledge [19,20,21,22].
Landraces are mainly found in hilly and sub-mountain areas (150–800 m a.s.l.) and among the most numerous families there are Fabaceae, together with Poaceae and Solanaceae, able to grow in a wide altitudinal range (from sea level to over 1000 m a.s.l.) [23].
The species/cultivars of Fabaceae family (legumes) are one of the most important crops in the world since they represent one of the main food and income sources in developing countries as well as in marginal areas. Among them, the genus Phaseolus includes more than one hundred species cultivated worldwide [24,25,26]. To promote sustainable vegetable protein production from higher plants (for example, legumes) the application of innovative technologies could be strategic to ensure sufficient, safe, and healthy food for a growing population [27]. Dry beans are an important source of protein, vitamins, minerals, and carbohydrates with a low-fat content; they contain also prebiotics such as fructooligosacchartides (FOS) and are an important source of dietary fiber [25,26,28]. In addition, beans contribute to preventing and controlling some chronic and degenerative diseases like obesity, diabetes, and numerous types of cancer. They contain a wide range of polyphenols compounds, including flavonoids, tannins, anthocyanins, and phenolic acids such as p-cumaric, ferulic, and cinnamic acid [26,29,30]. Beans are primarily consumed as a dry seed but also as green pods or ground; in fact, bean flour is an option for improving the nutritional quality of food (enriching them with protein and fiber) [30,31].
Among the Italian beans, “Copafam” is a cultivar of runner bean (P. coccineus L.) that can be grown only in mountain areas [32]. their edible pods and seeds are larger and more colored than those of common beans (P. vulgaris L.) [32]. “Copafam” is a traditional cultivar of historical importance and it is now at risk of extinction due to the depopulation and abandonment of mountain areas, and it is today cultivated by just a few farmers [22].
Giupponi and co-workers [32] studied this landrace from the agronomic point of view, however, important nutritional and phytochemical features have not been explored. Moreover, the possibility of developing innovative foods with its flour and the subsequent consumer responses to these new products were not evaluated. The addition of such ingredients in a food matrix leads to several changes in sensory properties [33,34,35] potentially influencing consumer hedonic responses, which need to be deeply investigated to ensure future success in the market.
The aim of this study was to investigate if this landrace has distinctive nutritional and phytochemical characteristics from other more common and commercial bean varieties as: Borlotto and Cannellino (P. vulgaris) and Bianco di Spagna (P. coccineus) (Figure 1). Additionally, to explore if “Copafam” could be used to produce innovative and unique goods, the impact of using bean flour on the sensory properties and consumer hedonic ratings in a model food formulation (biscuits) was investigated. The working hypothesis was to evaluate if “Copafam” could be interesting for starting up unique high-quality agri-food chains of low environmental impact that could be strategic for smart, sustainable, and inclusive growth of mountain territories.

2. Materials and Methods

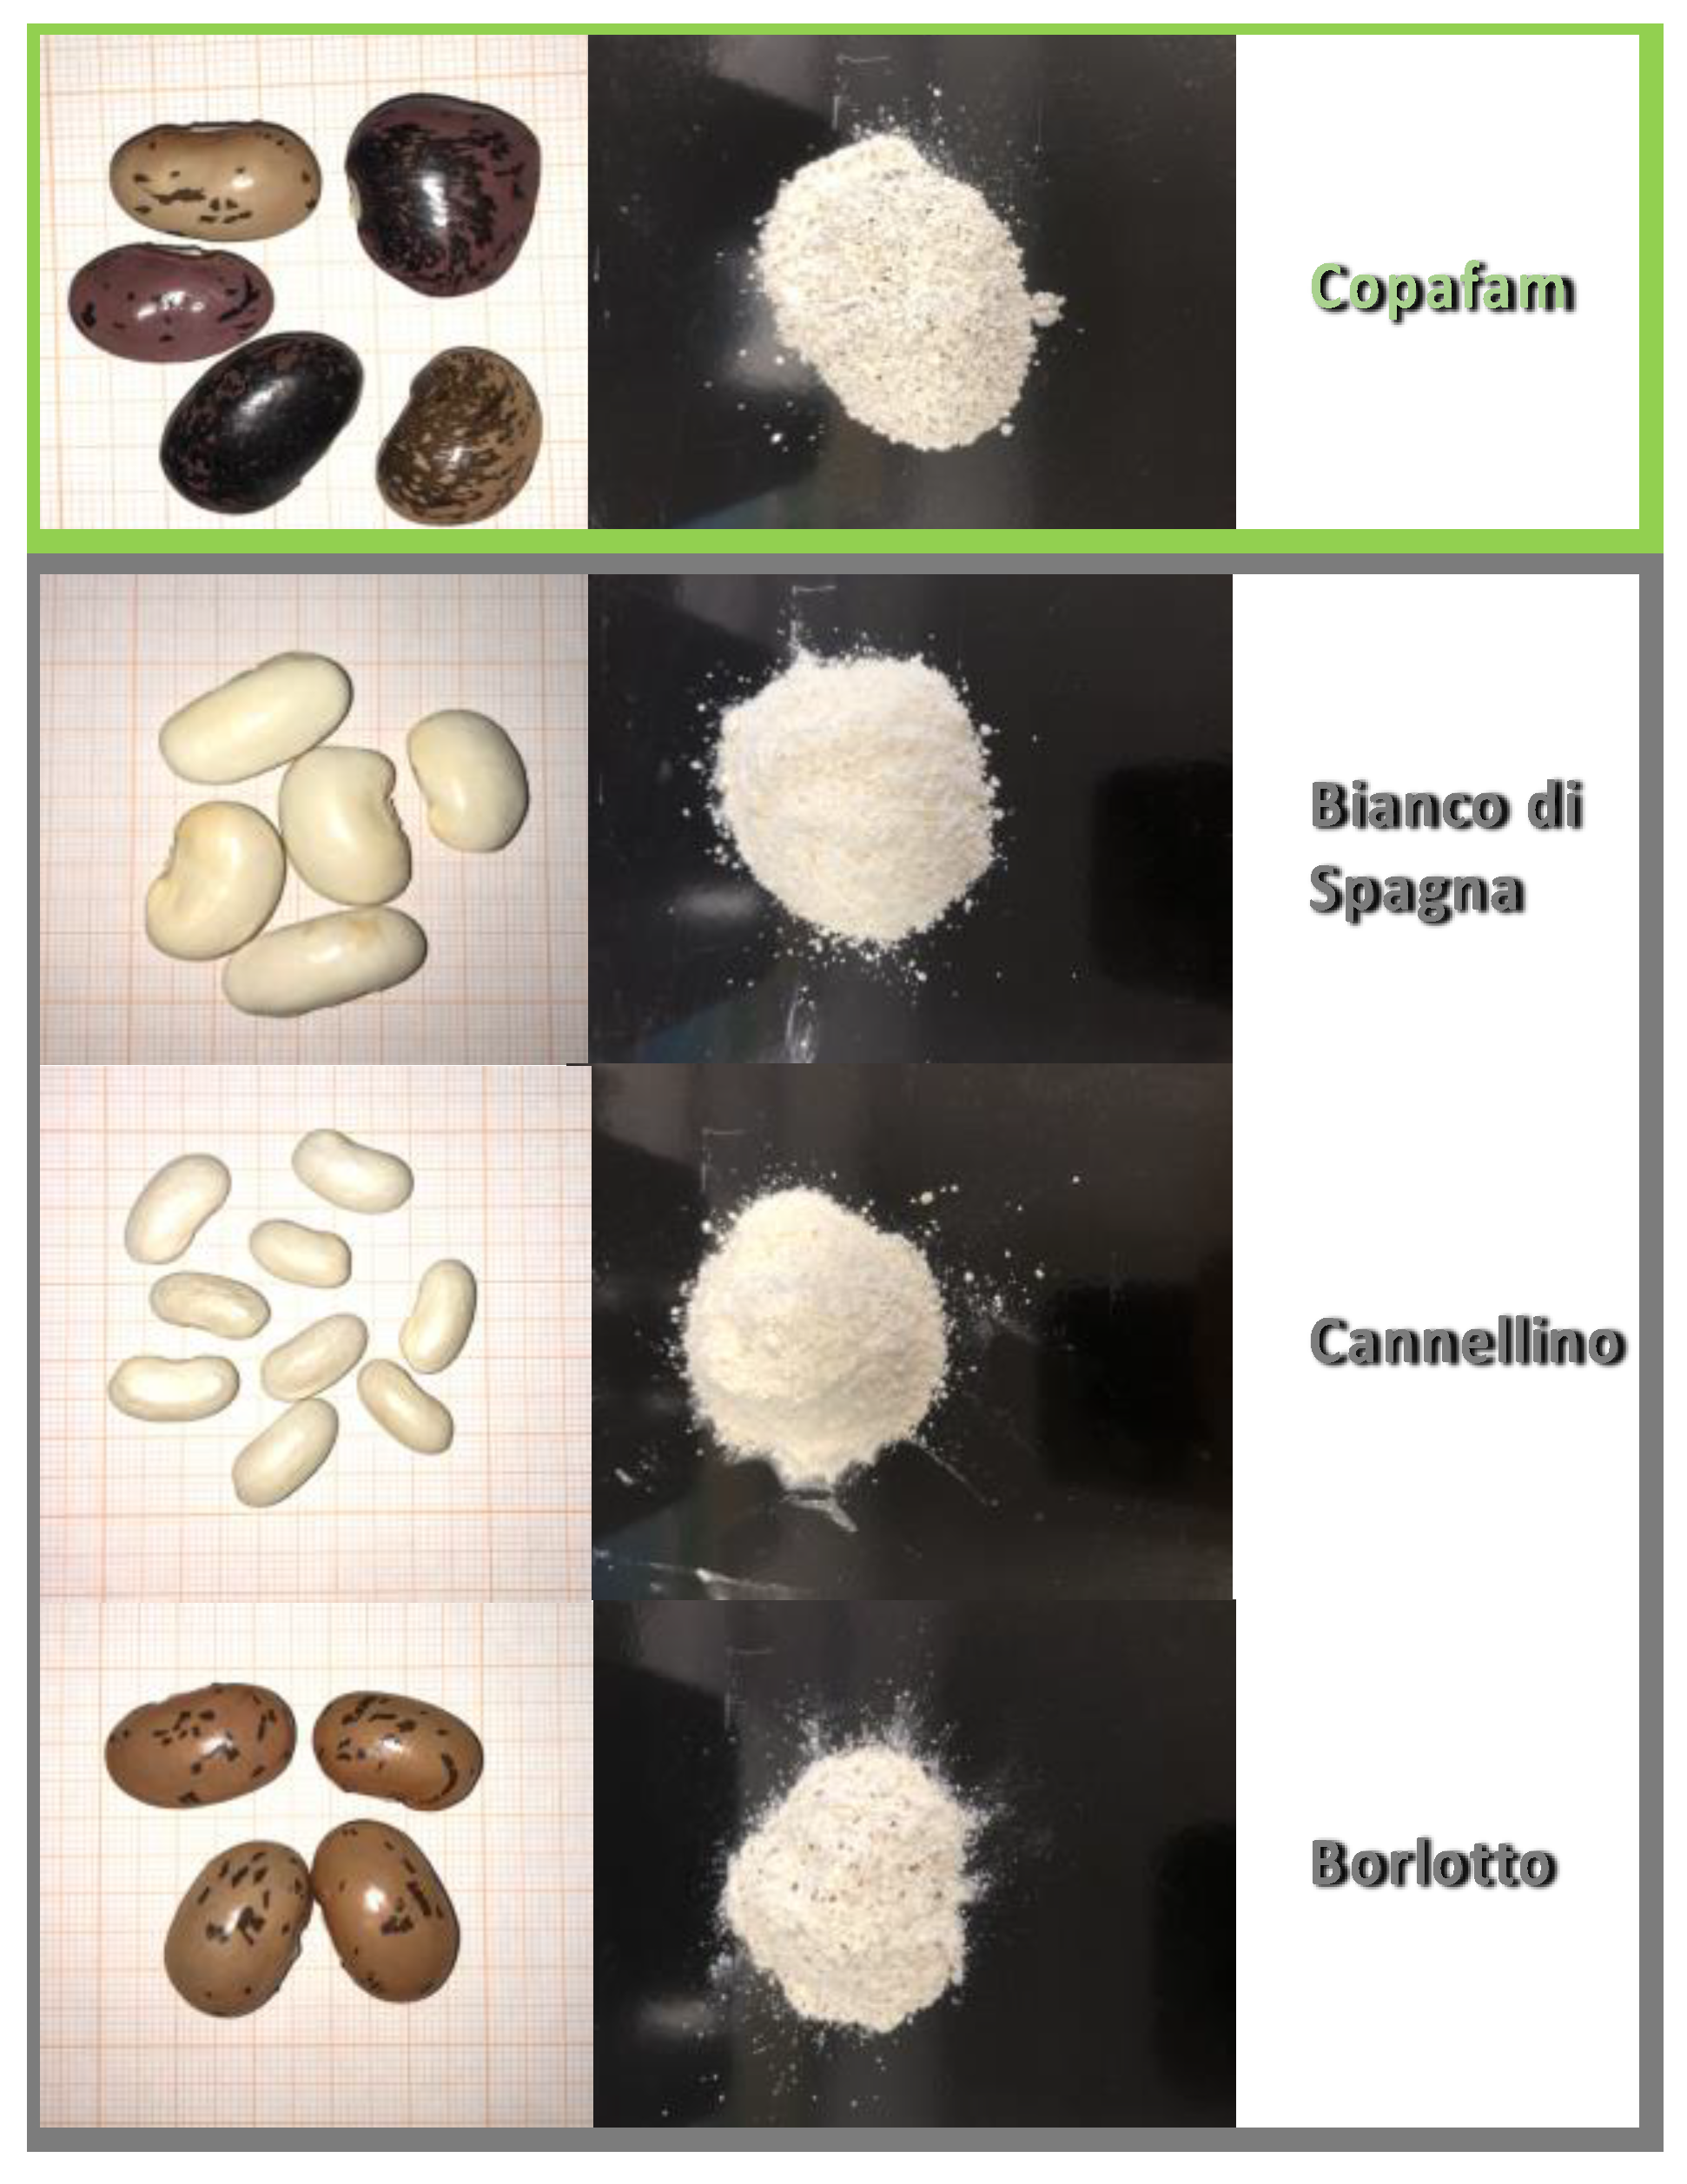
2.1. Plant Materials

“Copafam” beans were cultivated and collected in licensed agricultural fields directly from farmers of Camonica Valley (Brescia Province, Northern Italy) in 2021. Three commercial beans (Bianco di Spagna, Cannellino, and Borlotto) were included as a comparison; these beans were bought at a local market. Bean whole flours were obtained by finely grinding the seeds with a commercial blender (IKA A10 basic, Werke GmbH & Co. KG, Staufen, Germany). All plant material was collected complying with national and international mandatory regulations.

2.2. Phytochemical Composition

2.2.1. Extraction

The sample extraction was performed according to the procedure reported by Alcázar-Valle [25]. Briefly, 10 g bean flour (dry weight) + 100 mL of acetone solvent mixture (acetone, water and acetic acid, 70:29:0.5 v/v/v) overnight. Then the extracts were centrifuged a 4000 rpm for 15 min (Hermle z300, HERMLE Labortechnik GmbH, Wehingen, Germany), washed with the solvent mixture once and the supernatant was retained. Finally, the extract was concentrated using a rotary evaporator at 45 °C (LABOROTA 4000eco, Heidolph Instruments GmbH & Co., Schwabach, Germany).
The moisture content of the bean flour was determined by oven-drying method at 105 °C according to the AOAC method n° 945.40 [36]. Total nitrogen content was analyzed by the Kjeldahl procedure [36]; the conversion factor used to transform nitrogen into protein was 6.25. Ash content was determined by incineration at 550 °C in a microwave muffle AACC Method [37] (ZE muffle furnace, Ettore Pasquali s.rl., Milano, Italy). Total lipid content was determined by the AOAC [36] procedure. Five grams of flour were extracted in 30 mL chloroform/methanol (2:1, v/v) with agitation at 0 °C three times. The extract was vacuum filtered through filter paper on a Büchner funnel. This filtrate was dried in a rotary evaporator at 35 °C. The residue was dissolved in 10 mL of chloroform/methanol (2:1, v/v) after the addition of 2 mL of KCL 0.75%, mixed vigorously, and put in a separatory funnel attending the phase separation. The chloroform layer was removed, dried over anhydrous Na2SO4, filtered, and concentrated by a rotary vacuum evaporator at 35 °C. The extracted lipids were weighed to determine the lipid content.
The determination of total starch content, dietary fiber, and RSO (Raffinose-Series Oligosaccharides) was performed using the Megazyme assay kit (K-TSTA-100A, K-RAFGL, respectively) following the manufacturer’s instructions.

2.2.2. Extraction for HPLC

The sample extraction was performed according to Rodríguez Madrera [26]. Briefly, 1.5 g of bean flour was extracted with 30 mL ethanol 46% (0.1 formic acid) overnight. After extraction, the solids were separated by centrifugation and the supernatant was dried in a rotary vacuum evaporator at 50 °C and reconstituted with 2 mL of methanol 20% (0.1 formic acid).

2.2.3. Basic Hydrolysis

Basic hydrolysis was performed following the procedure reported by Lin [30]. Briefly, 1 mL of extract was dried and dissolved in 0.3 mL of NaOH 4 N and magnetically stirred for 18 h at room temperature. 0.15 HCL 12 N and 0.55 mL of methanol were added. The solution was filtered through a 0.2 µm pore size membrane filter prior to chromatographic analysis.
The High-Performance Liquid Chromatography (HPLC) system used was an LC Agilent series 1200 (Waldbronn, Germany) consisting of a degasser, a quaternary gradient pump, an auto-sampler, and a MWD detector (Waldbronn, Germany). A Luna® C18 (150 × 4.6 mm) column (Phenomenex, Santa Clara, CA, USA) at 25 °C was used for the chromatographic separation and 10 µL of samples were used for injections. The run time was 50 min, with no post-run time. Solvent (A) was HCOOH 0.1% while solvent (B) was acetonitrile; a constant flow rate of 0.8 mL/min was used. The gradient used was: 0 min 95% A, 5 min 95% A, 10 min 85% A, 40 min 60% A, 42 min 5% A, 45 min 5% A, 50 min 95% A, and the absorbance wavelength was set at 310 nm.
Individual stock solutions of each standard were prepared using absolute ethanol and stored at −20 °C. The working standard mixture solutions were made by diluting the appropriate amount of each stock standard solution to obtain 5 calibration levels (the range concentration of p-cumaric and sinap acid was 2.5–100 mg/mL while the range concentration of ferulic acid was 5–500 mg/mL). The retention times of all the standards were confirmed by individual standard injections. A fortification of random samples was used to check further the retention factors. A standard mixture to check the retention times was injected each working day. LOD (0.5 µg/mL) and LOQ (1 µg/mL) was calculated according S/N ratio 3 and 10, respectively.

2.2.4. Antioxidant Activity

The antioxidant activity was evaluated by 2,2-diphenyl-1-picrylhydrazyl (DPPH) method reported by Brand-Williams [38]. Here, 0.3 mL of bean extracts were mixed with 2.7 mL of a DPPH solution 6 × 10⁻⁵ M. This mixture and a DPPH blank were incubated for 30 min in the dark at room temperature. After this time, the absorbance was measured with a UV/Vis spectrophotometer at 517 nm (Varian Cary 50 scan, Agilent, 5301 Stevens Creek Blvd, Santa Clara, CA, USA). The antioxidant activity was calculated as the percentage of RSA (radical scavenging activity) using the formula RSA = [(AB−AA)/AB] × 100, where AB is the absorbance of the DPPH solution and AA is the absorbance of the sample solution.

2.2.5. Polyphenols Content

Folin-Ciocalteu spectrophotometric method was used to analyze total polyphenols [39]. Quantification was performed with gallic acid (mg GAE/g dw) as follows: 0.2 mL of extract was mixed with 0.2 mL of folin reagent and 3 mL of distilled water. Then 0.75 mL of sodium carbonate was added. The mixture was incubated for 8 min at room temperature. Finally, 0.85 mL of distilled water was added, followed a homogenization and incubation in the dark for 2 h at room temperature. The absorbance was measured at 765 nm.

2.2.6. Flavonoids

The determination of total flavonoids was performed by an aluminum chloride test [25]. Quantification was expressed as quercetin equivalents per kg of bean flour (mg QE/kg dw) by mixing 0.05 mL of extract, 0.7 mL of distilled water and 0.25 mL of AlCl3 (133 mg of AlCl3 and 400 mg of sodium acetate in 100 mL of methanol/water/acid acetic (140:50:10, v/v/v)). The absorbance was measured at 415 nm.

2.2.7. Anthocyanins

The anthocyanins analysis was performed following the procedure reported by Abdel-Aal [40]: 3 g of bean flour was mixed in 24 mL ethanol (0.15% HCL 0.1 N). The mixture was shaken for 30 min and centrifuged for 15 min. The supernatant was poured into a 50 mL volumetric flask and made up to volume. The solution was filtered and absorbance was measured at 535 nm against a reagent (solvent) blank. Quantification was expressed as cyanidin 3-glucoside equivalents per kg of bean flour (mg Cy3 G/kg dw).

2.2.8. TIA

Trypsin inhibitor activity (TIA) was performed following the ISO 14902:2001 [41] assay. Briefly, 62.5 mg of bean flour was dissolved in 1.25 mL of extraction buffer (500 mM NaCl + NaOH 10 mM; ratio 1:20) and subsequently centrifuged for 10 min at 13,000 rpm; the supernatant was recovered.
In a water bath at 37 °C, 20 µL of extract, 100 µL of L-BAPA solution (Benzoyl-l-arginine-p-nitroanilide), and 40 µL of distilled water were mixed in a test tube. This was followed by adding 20 µL of trypsin working solution to start the colorimetric reaction. After 10 min, 20 µL of 5.6 M acetic acid was added to stop the reaction. The L-BAPA solution was prepared by diluting 3.2 mg of L-BAPA into 50 µL of DMSO 1%; the volume was adjusted to 5 mL with the working buffer (Tris 50 mM + CaCl2 5 mM pH 8.2). The reaction mixture (total 200 µL) was measured for absorbance at 415 nm by spectrophotometer; the result was expressed in mg/g dw of the sample. For a reference reading, water was used instead of the extract. A sample blank and a reagent blank were also prepared and measured. The inhibition percentage of the sample extract solution was calculated as followed:
I = [(At − Abt) − (As − Abs)/(At − Abt)] × 100
where I is the inhibition percentage, At is the absorbance of the solution with trypsin only, Abt is the absorbance of the blank trypsin only, As is the absorbance of the solution with the sample, and Abs is the absorbance of the blank sample.
The trypsin inhibitor activity is calculated as followed:
TIA = (I × mt × ds)/(100 × ms)
where mt is the mass of trypsin used in the assay, in milligrams, ds is the dilution factors of the sample, and ms is the mass of the test sample used for the assay.

2.2.9. Phytic Acid

The content of phytic acid was determined using the Megazyme assay kit (K-PHYT, Megazyme International Ireland Ltd., Wicklow, Ireland). The results were expressed as mg of phytic acid per g of bean flour.

2.2.10. Statistical Analysis

Data were analyzed using one-way ANOVA with the Tukey post-hoc test. The assumptions of homogeneity of variances and normality of group data were verified using the Levene and Shapiro–Wilk’s tests, respectively. The data were expressed as mean ± standard deviation (SD) and differences were considered statistically significant when p < 0.05. The samples were ordered using principal component analysis (PCA) performed by Statgraphics 5.1 (STCC Inc.; Rockville, MD, USA). Hierarchical clustering heatmap and dendrogram were performed on nutritional and phytochemical trades.

2.3. Consumer Study

2.3.1. Participants

A total of 80 subjects (40% men; mean age: 39 ± 15 years) were recruited among the students and employees of the Centre of Applied Studies in the Sustainable Management of the Mountain Environment (Ge.S.Di.Mont.) of the University of Milan and among the population of the neighboring municipalities. Only subjects who like legumes and biscuits, not suffering from food intolerances and allergies were involved. This study was approved by the Ethics Committee of the University of Milan ad was conducted in compliance with the principles laid down in the Declaration of Helsinki. All participants signed a written informed consent to be involved in the study.

2.3.2. Samples

A biscuit control sample (ST) was developed with the following ingredients: 250 g type 1 wheat flour, 85 g brown sugar, 85 g butter, 20 g of eggs, 4 g baking powder, 50 g water, 2 g of baking soda, and 1 g common salt. In addition to the control, other six experimental samples were prepared by replacing wheat flour with 25% and 50% of borlotto flour (Bor25 and Bor50), cannellino flour (Can25 and Can50), and copafam flour (Cop25 and Cop50), respectively. The biscuit samples were baked at 180 °C for 15 min. All samples were prepared by a local bakery “Forneria Pasticceria Salvetti” (Malonno, BS, Italy).

2.3.3. Liking Assessment and Sensory Descriptive Evaluation

Subjects were asked to taste the biscuits and to express their liking using a 10 cm visual analog scale (VAS) anchored by the extremes “extremely disliked” (rated 0) and “extremely liked” (rated 10). Prior to tasting, instructions about the use of the scale were provided to the participants.
In order to obtain a sensory description of the samples, a focus group was preliminarily performed involving 20 untrained subjects to define the appropriate attributes in terms of appearance, odor, taste, flavor, and texture [42]. Secondly, an open discussion was conducted, and the experimenters selected only the most mentioned sensory attributes (frequency of selection at least 40%) to avoid synonyms [43]. Finally, the check-all-that-apply (CATA) questionnaire consisted of a list of 26 sensory attributes: 5 for the appearance (light color, dark color, patchy, uniform, and speckled), 5 for the odor (strong, mild, toasted, legume, and butter), 4 for the taste (sweet, bitter, sour and salty), 6 for the flavor (strong, mild, toasted, legume and butter), and 7 for the texture (sticky, moist, dry, crunchy, crumbly, floury and grainy). The “to assessor” list order allocation scheme was applied to randomize attributes’ order [44]. The 80 subjects involved in the experimental session were then asked to select from the list of 26 terms the best ones describing each sample.

2.3.4. Food Neophobia Evaluation

The validated Italian version of the food neophobia questionnaire [45] was applied to investigate the level of reluctance to try and eat unfamiliar foods. The questionnaire consists of 10 statements evaluated using a seven-point Likert scale ranging from “I strongly disagree” (score 1) to “I strongly agree” (score 7). The food neophobia level was calculated, after reversing the negatively worded statements, as a sum of the responses yielding a range of 10–70. Higher scores reflected higher food neophobia levels.

2.3.5. Experimental Procedure

Subjects attended one session and were asked to refrain from consuming anything but water for 2 h before the test. Samples were provided to the participants in plastic plates labeled with three-digit codes in a serving portion of approximately 30 g. Water was available for rinsing the palate between the samples. For each sample, subjects had to evaluate their overall liking and perform a sensory descriptive analysis by means of the check-all-that-apply (CATA) methodology. After testing the first four samples, subjects had to complete the questionnaires. The entire session took approximately 30 min.

2.3.6. Data Analysis

ANOVA model was performed on overall liking scores considering samples (ST, Bor25, Bor50, Can25, Can50, Cop25, and Cop 50) as factor. When a significant difference (p < 0.05) was found, Tukey’s HSD test was performed as a multiple comparison test.
Cochran’s Q test was applied to identify which sensory attributes were discriminating among samples comparing the frequency of mention for each term of the CATA questionnaire. The relationship between samples and sensory attributes was evaluated by means of correspondence analysis (CA).
The internal consistency reliability of the food neophobia scale was evaluated by means of Cronbach’s alpha. To investigate the relationship between food neophobic traits and biscuit liking, subjects were categorized (based on the 25th and 75th percentiles) according to their neophobia scores into the following three groups: Neophilic (score < 19); Neutral (20 ≤ score ≤ 33); Neophobic (scores > 33). ANOVA model was performed on liking data considering food neophobia traits as a factor.
All analyses were performed using IBMSPSS Statistics for Windows, Version 24 (IBMCorp., Armonk, NY, USA) and XLSTAT (Version 2019.2.2, Addinsoft., Boston, MA, USA).

3. Results

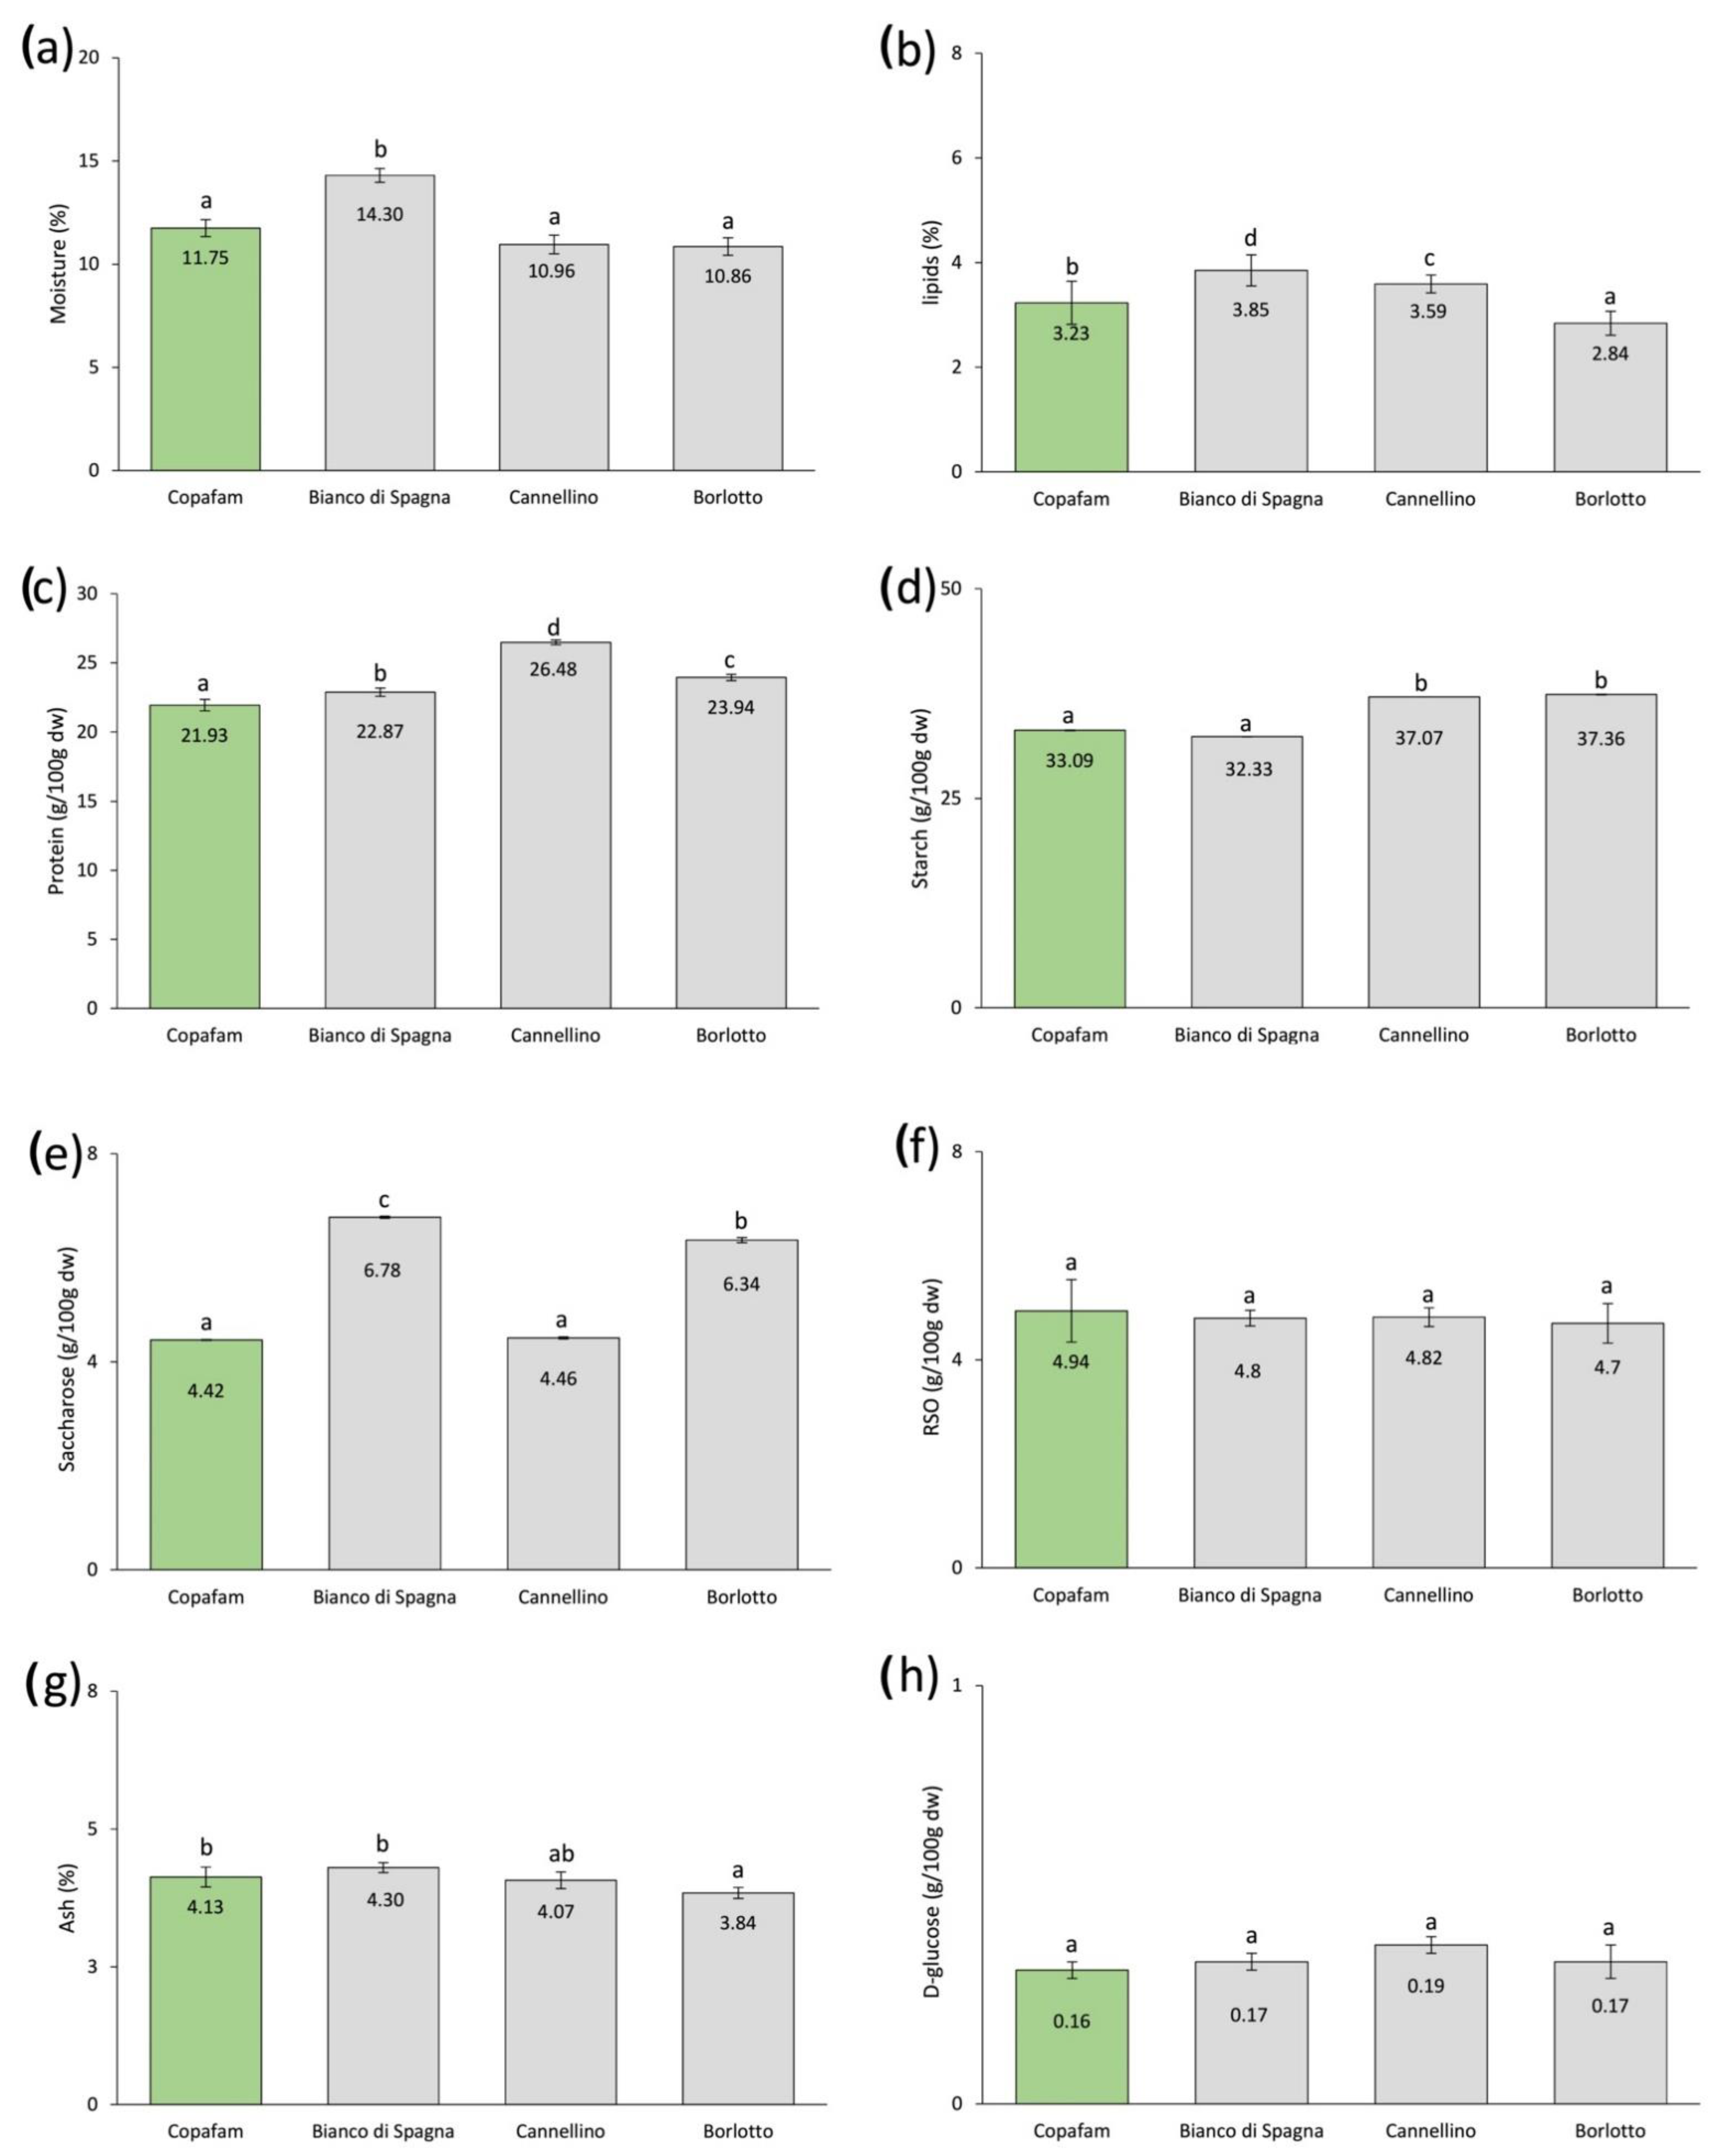
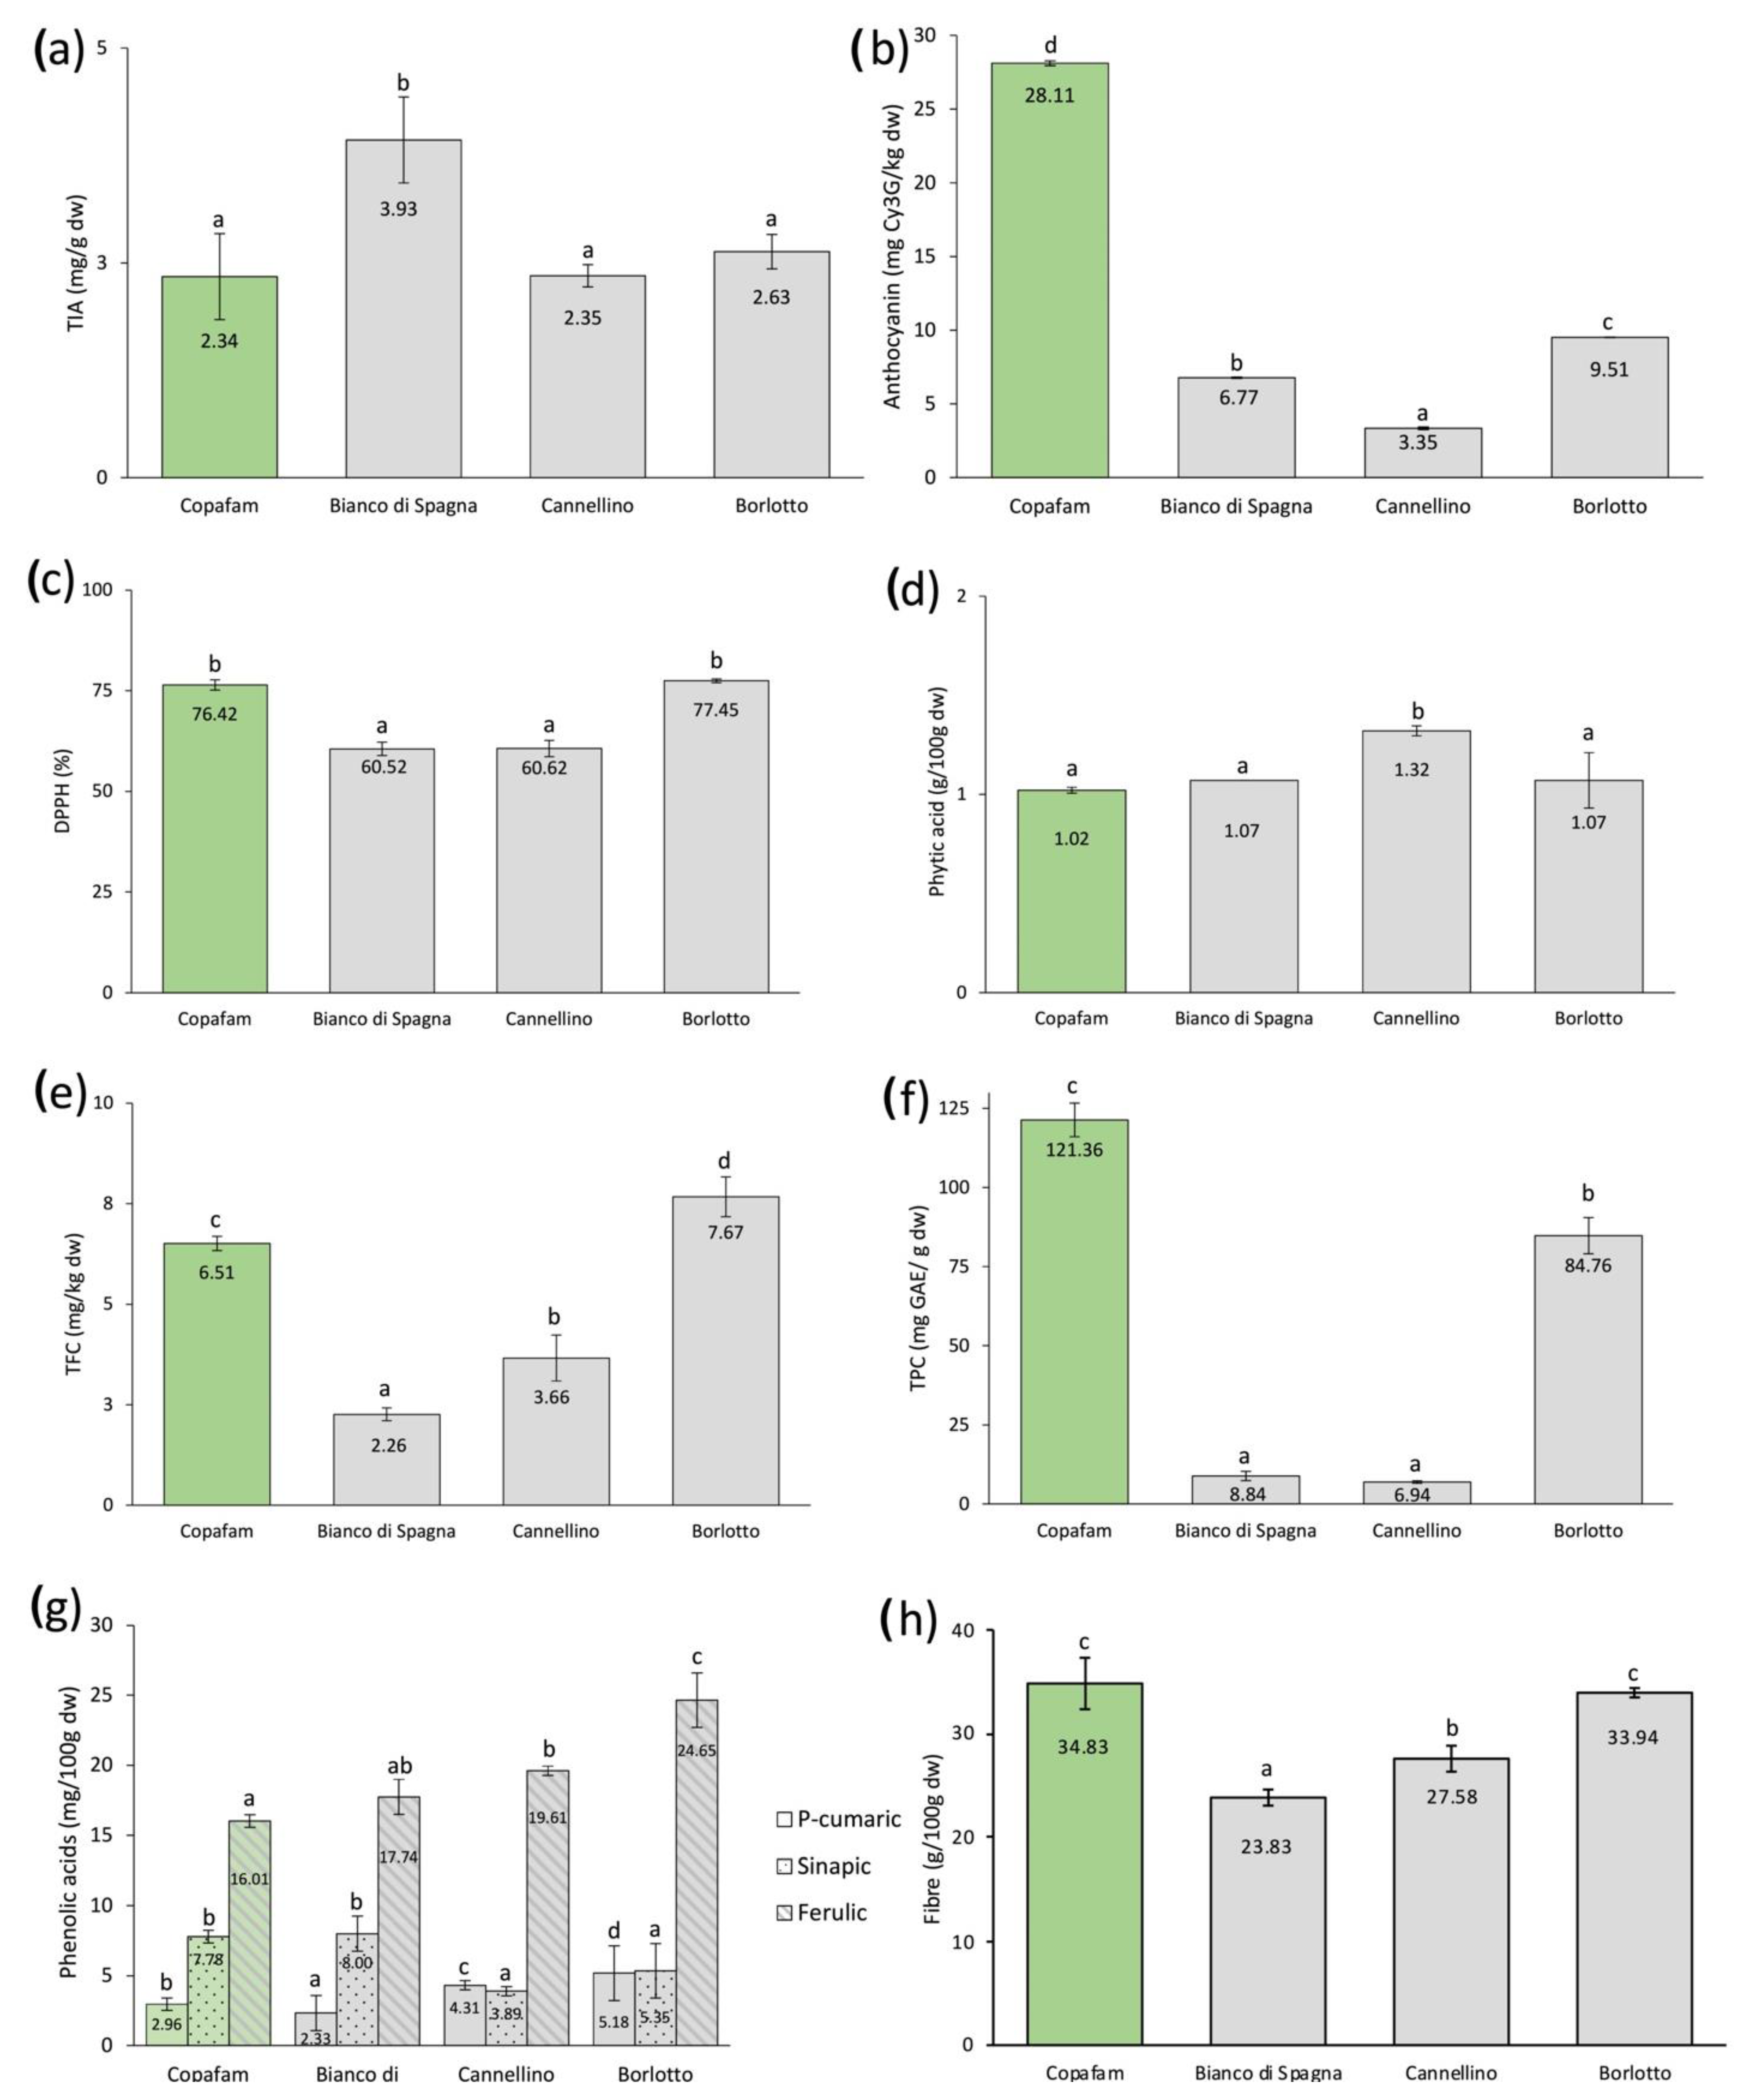
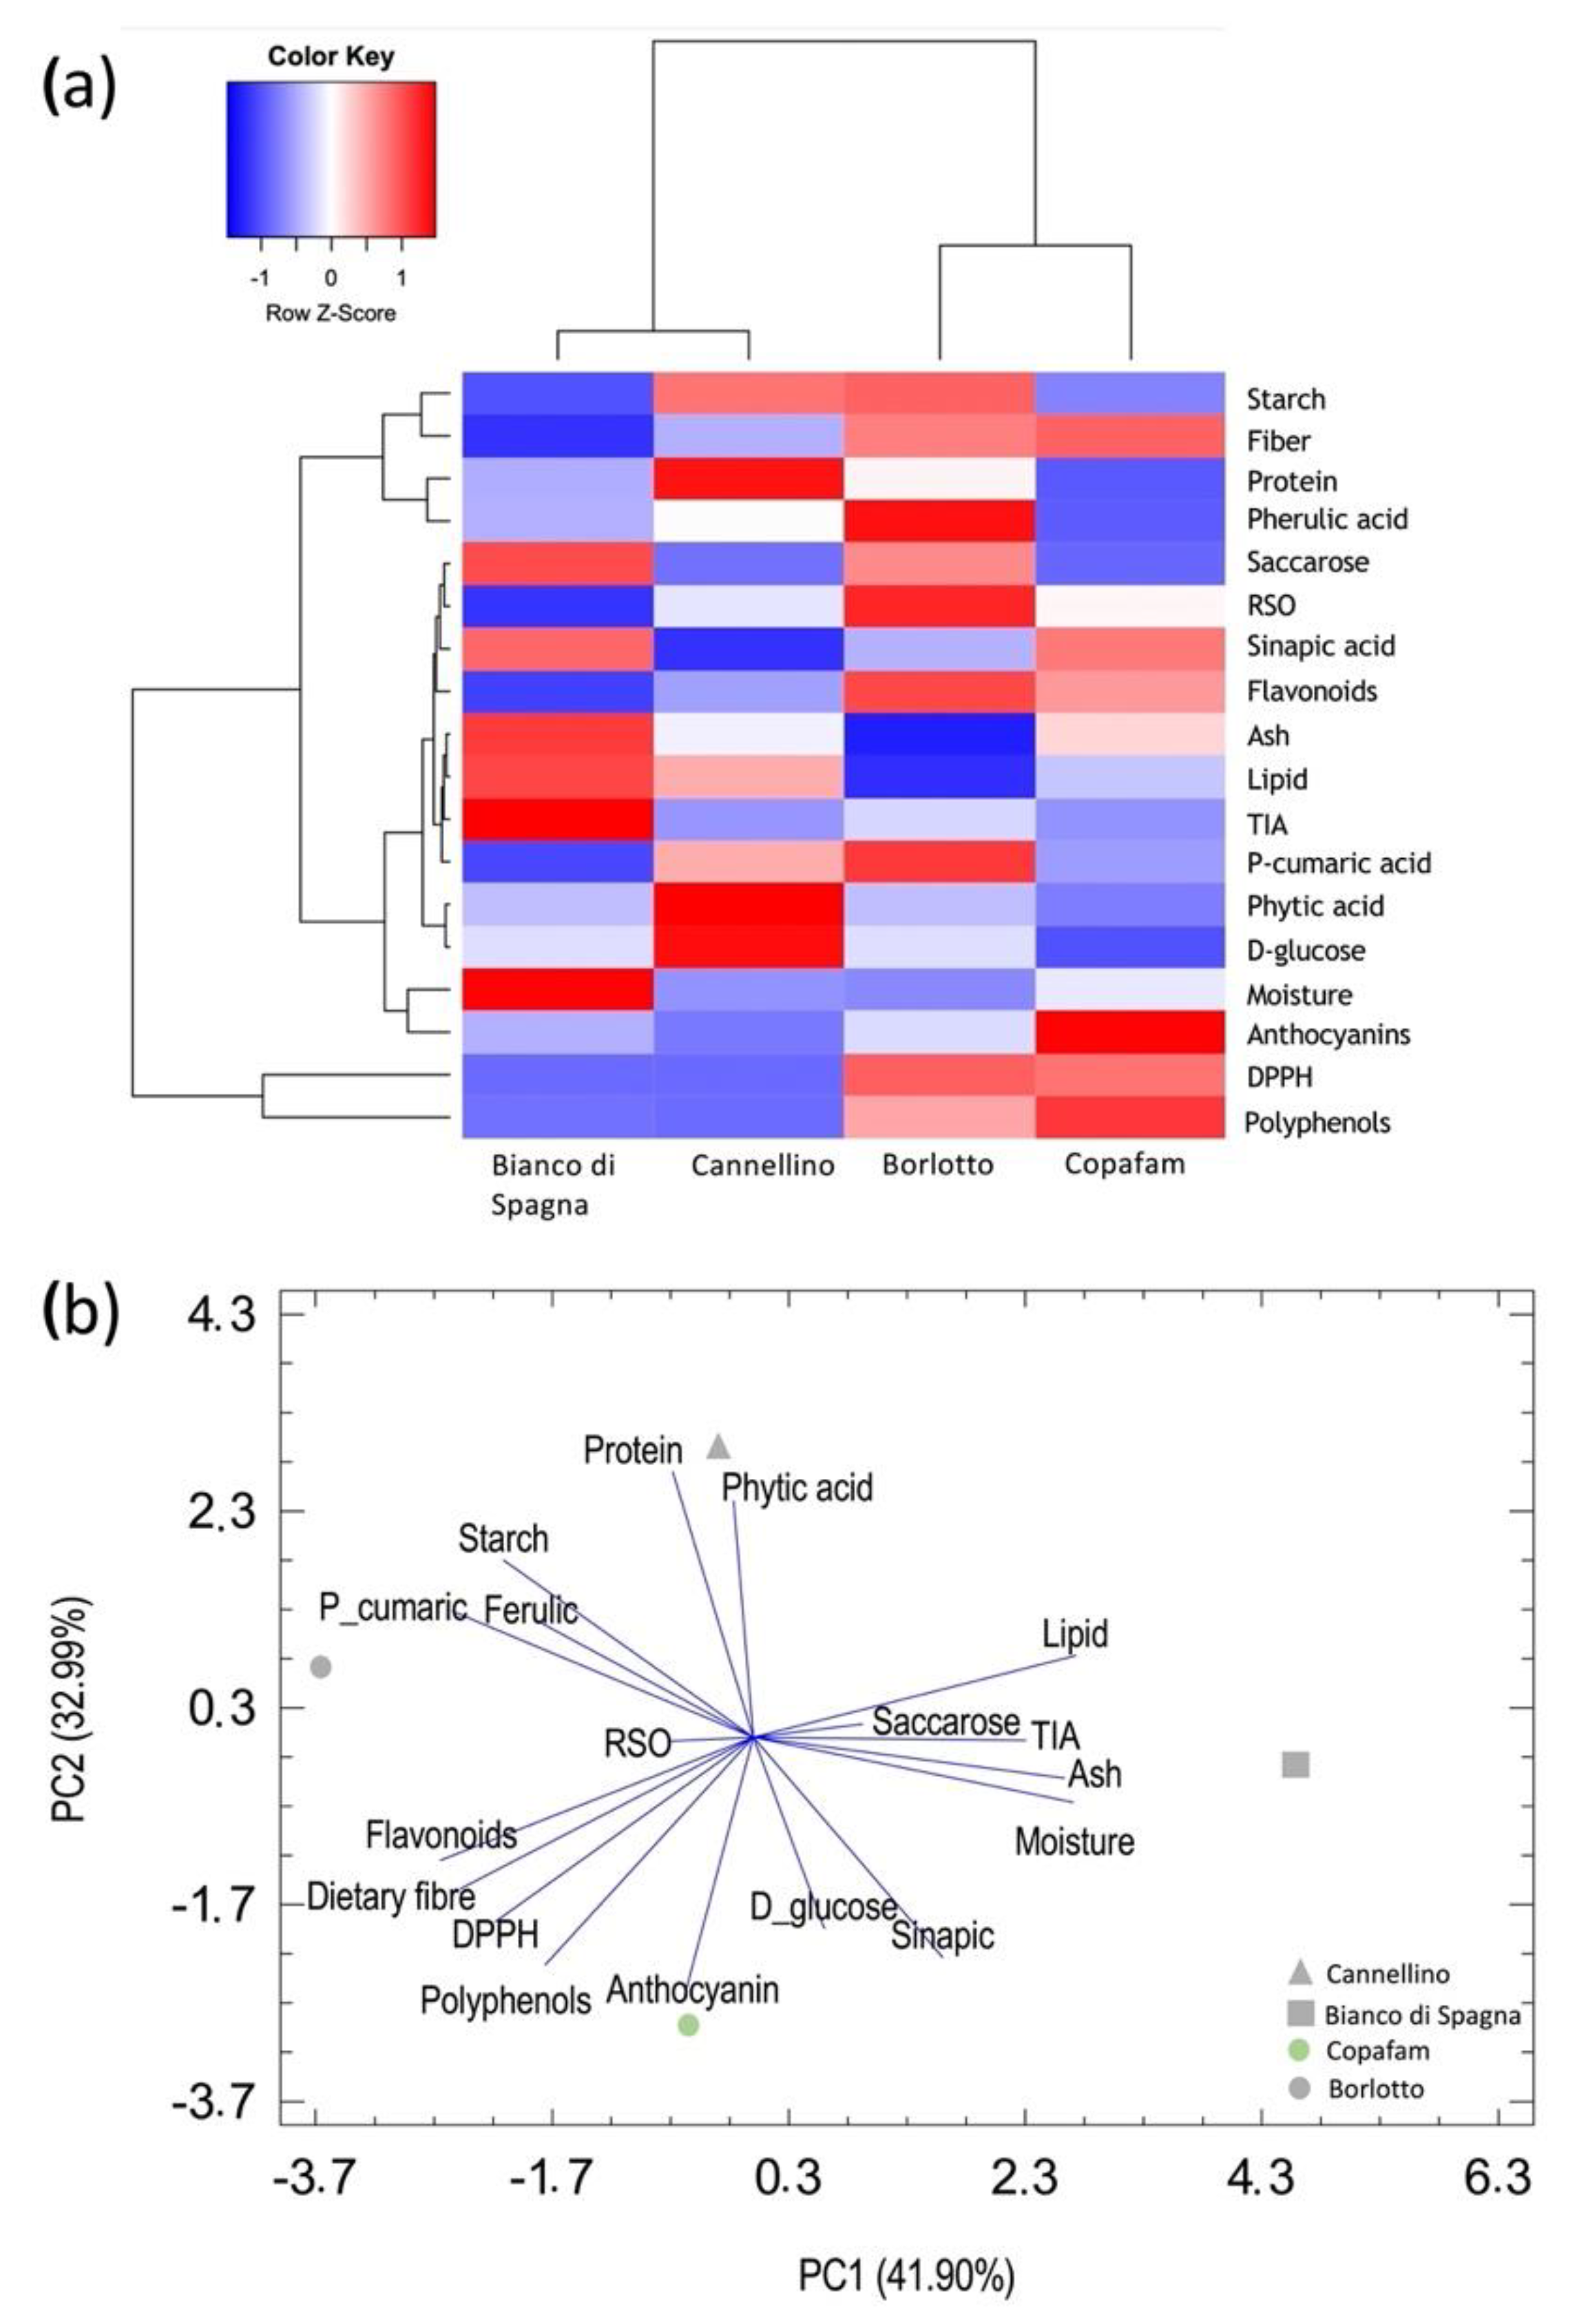
3.1. Nutritional and Phytochemicals Composition
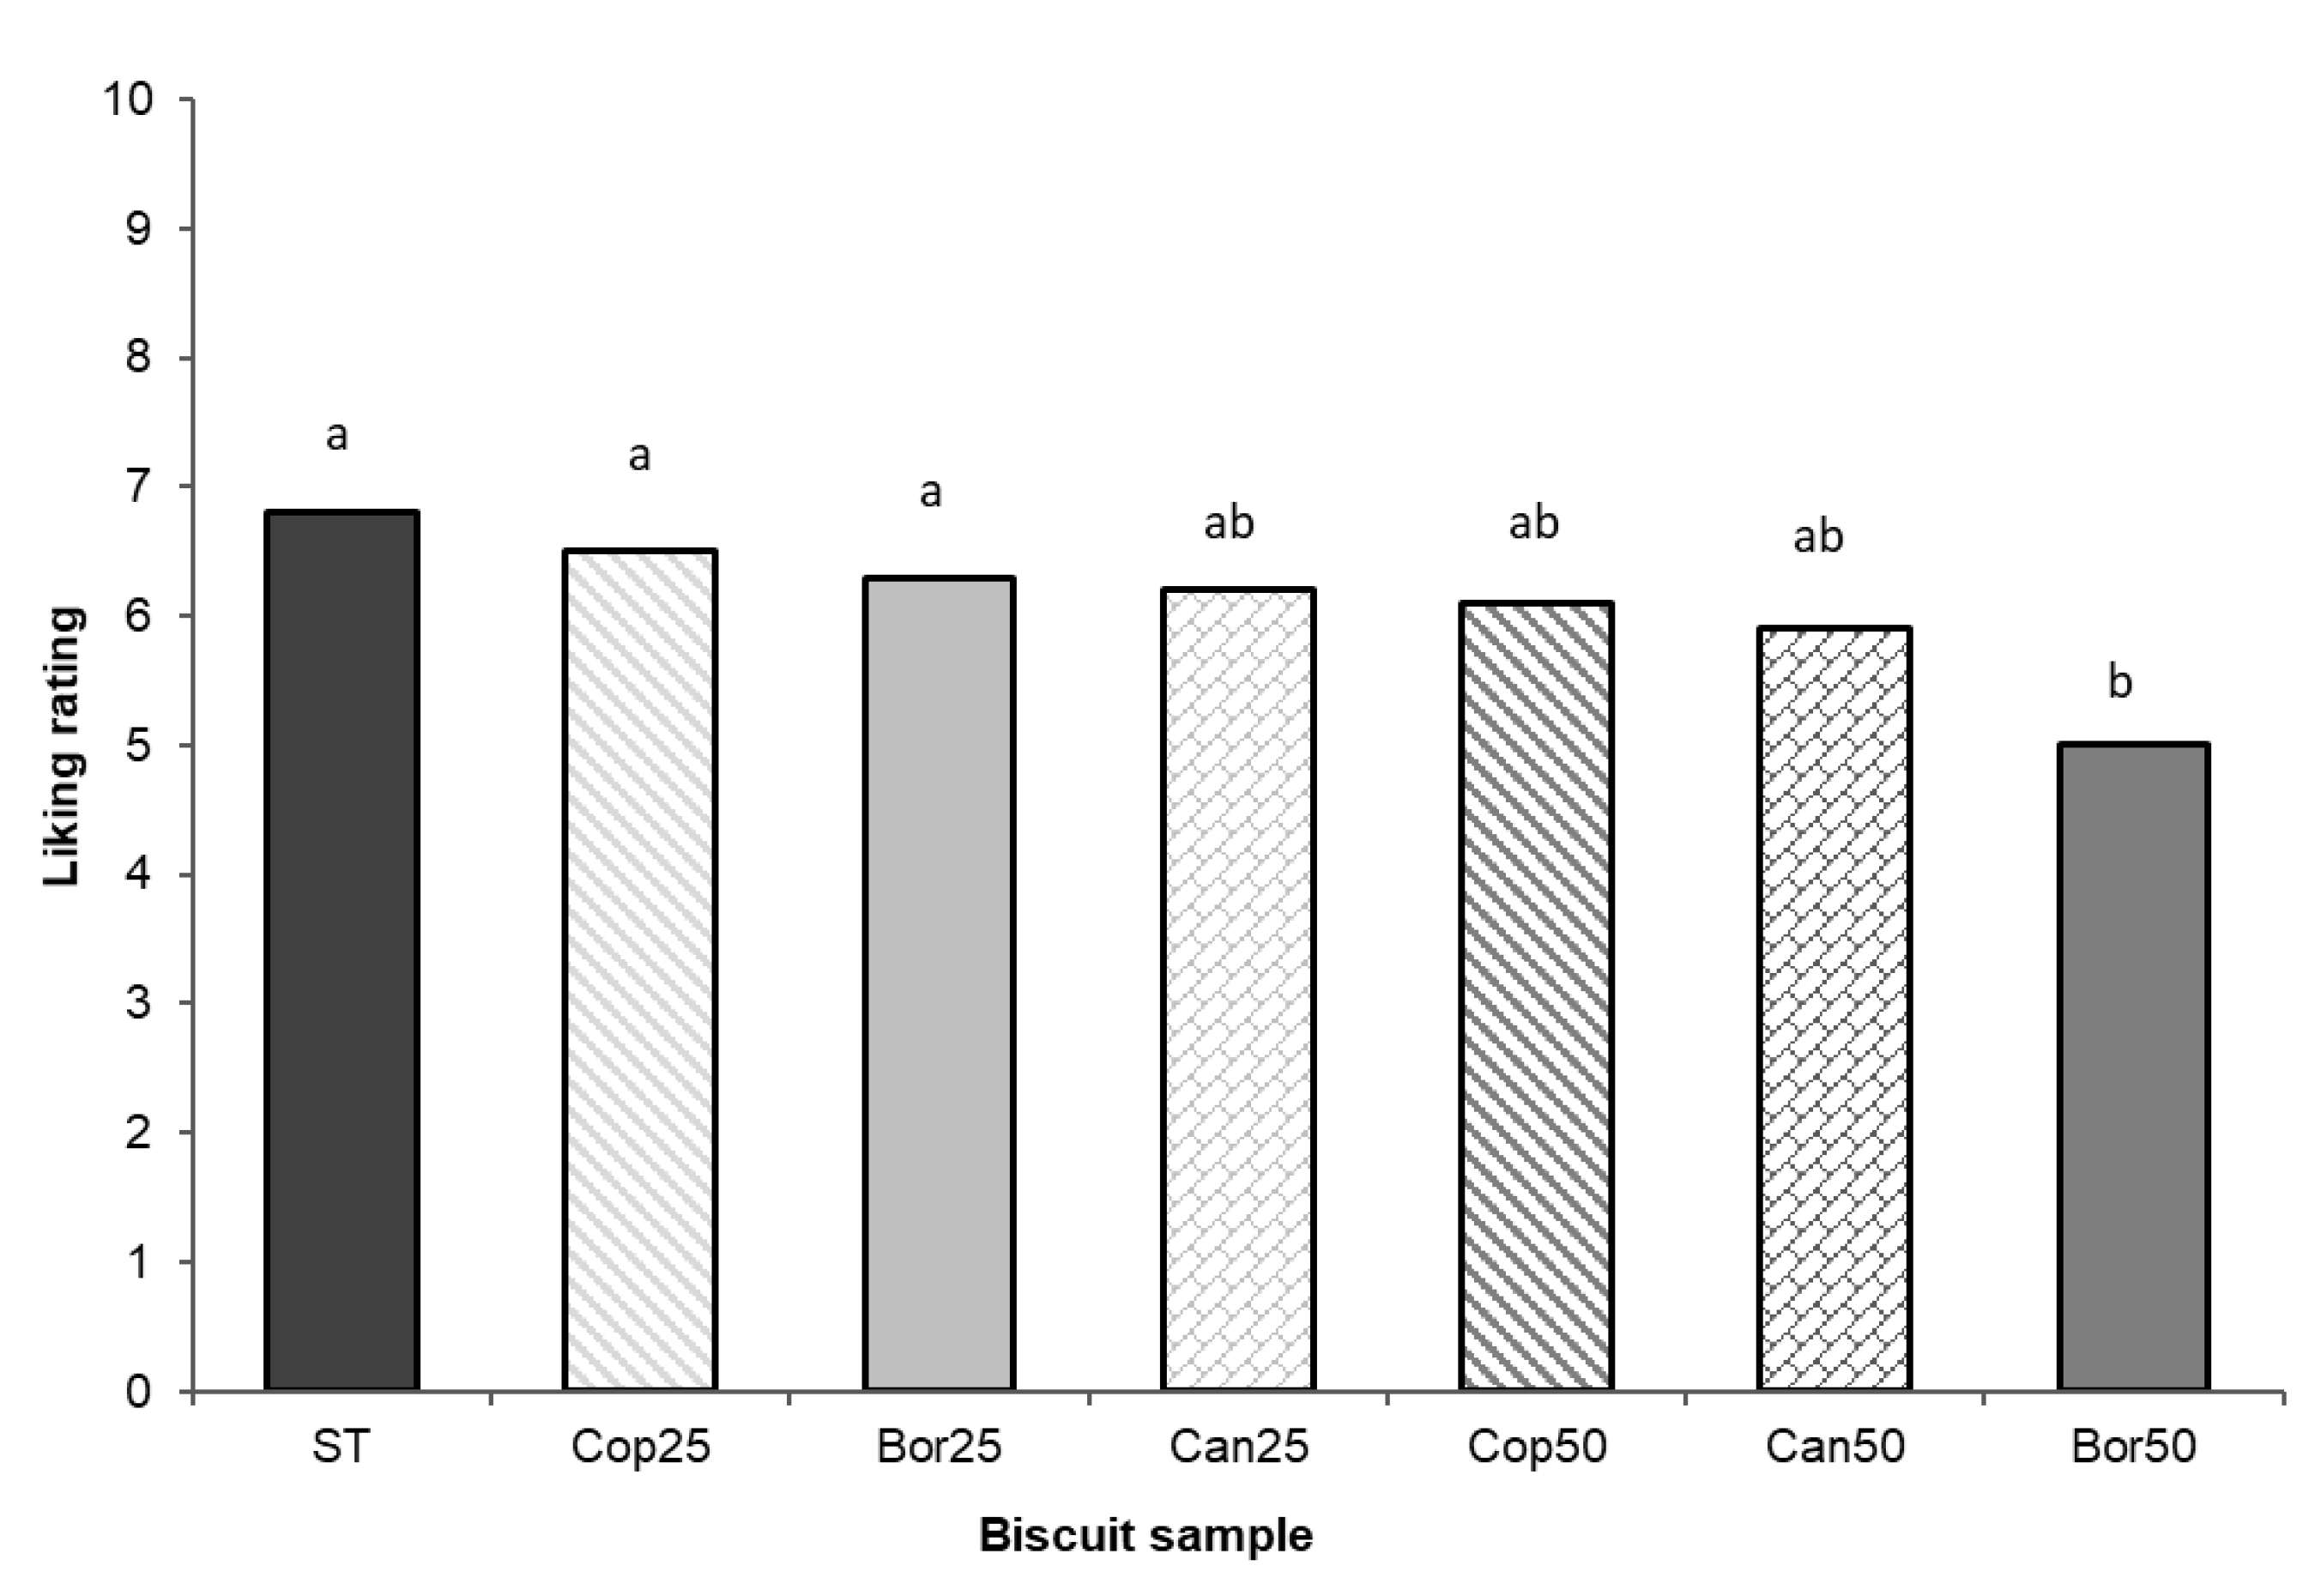
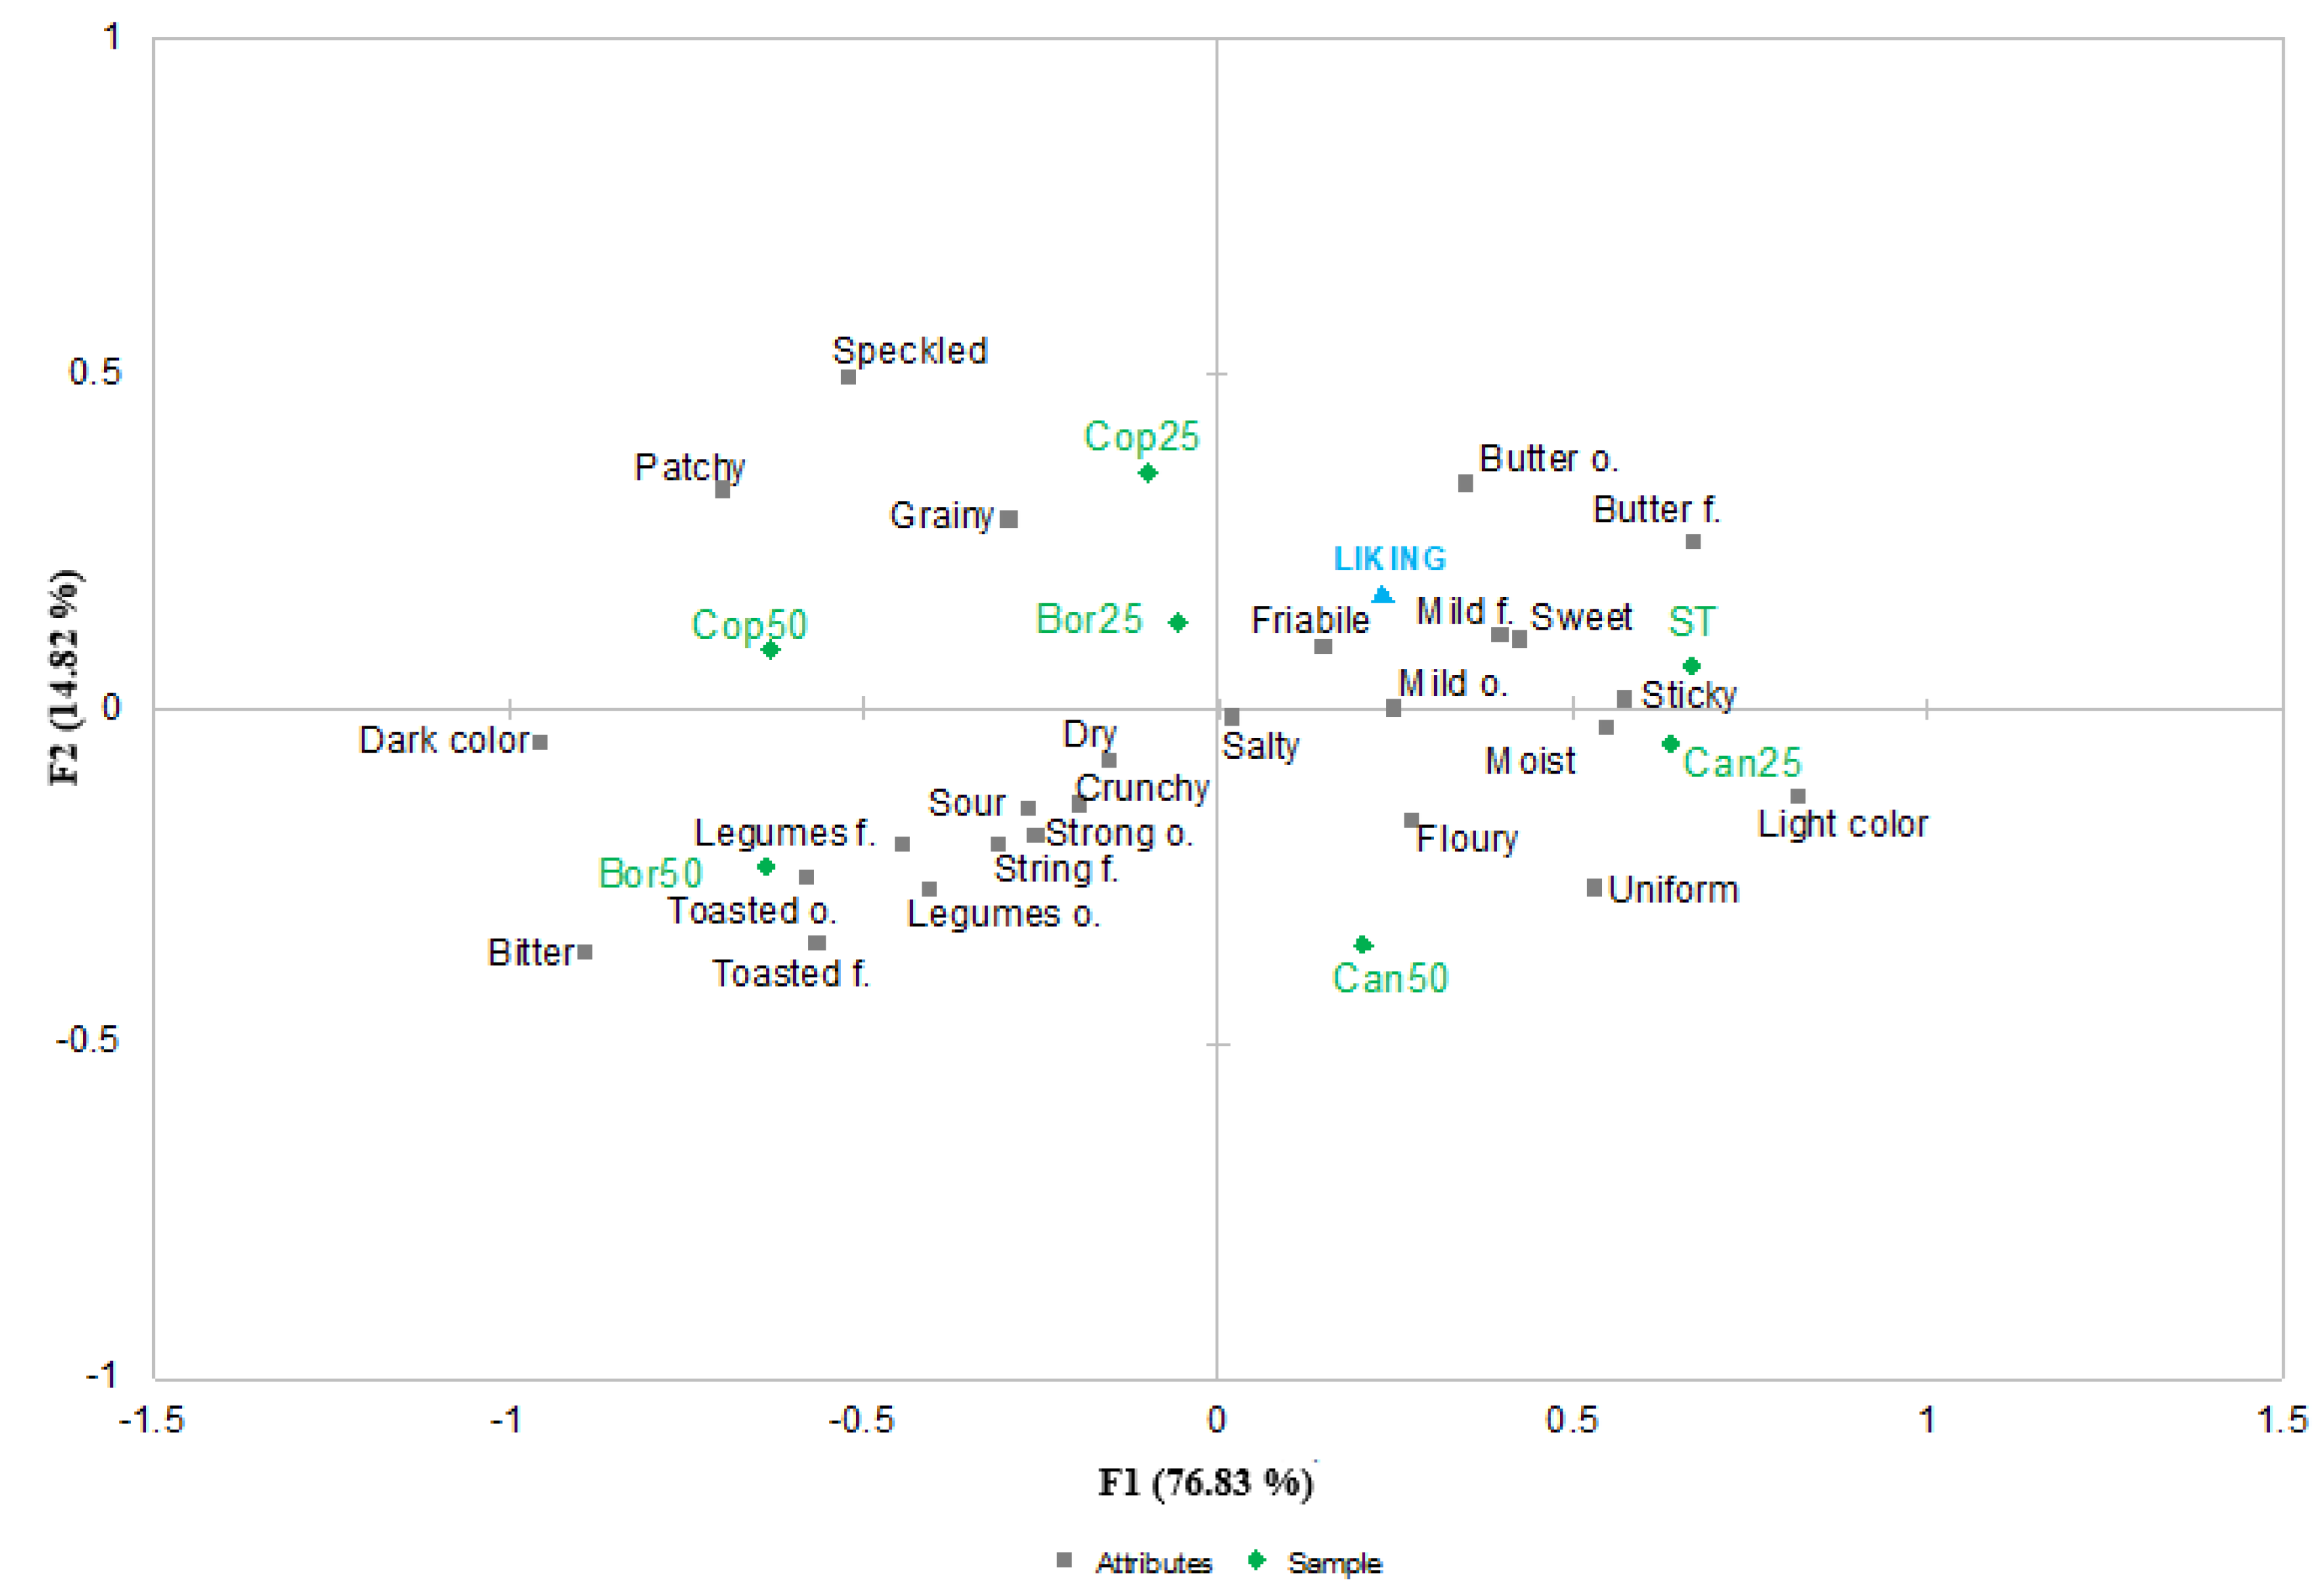
The nutritional composition (moisture, lipids, ash, protein, starch, RSO, d-glucose, and saccharose) of the different beans cultivars is presented in Figure 2 and the phytochemical characteristics (anthocyanins, dietary fiber, phenolic acids, DPPH, total flavonoid content, (TFC), total phenol content (TPC), Trypsin inhibitor activity (TIA), and phytic acid) are presented in Figure 3. The moisture level was quite homogeneous among all samples (Figure 2a). The protein content (Figure 2c) was the lowest in “Copafam” (21.93 ± 0.41 g/100 g dw; p < 0.05; Appendix A) and, in general, samples of P. vulgaris (Borlotto, cannellino) showed a high content of this macronutrient compared to those of P. coccineus (Bianco di Spagna, “Copafam”). “Copafam”, Bianco di Spagna and Cannellino had similar ash contents (over 4%) while Borlotto bean (3.84 ± 0.1%) had the lowest (Figure 2g). “Copafam” and Borlotto had a lower lipid content compared with the two other varieties (3.23 ± 0.15% and 2.83 ± 0.04%, respectively. Figure 2b) and showed on the contrary the highest content in dietary fiber (Figure 3h, 34.83 ± 2.48 and 33.94 ± 0.45 g/100 g dw, respectively). “Copafam” and Cannellino had similar saccharose content (4.42 ± 0.01 and 4.46 ± 0.03 g/100 g dw, respectively. Figure 2e), the lowest among the four samples. The starch level was lower in samples belonging to the P. coccineus genus (Figure 2d), while glucose and RSO (Raffinose-Series Oligosaccharides) content was similar among all samples (Figure 2f).
“Copafam” resulted as the best source of polyphenols (121.36 ± 5.31 mg GAE/g dw, Figure 3f) as well as of anthocyanins (28.11 ± 0.16 mg Cy3 G/kg dw, Figure 3b); this landrace and Borlotto bean showed a high level of flavonoids (6.51 ± 0.17 and 7.67 ± 0.5 mg /kg dw, respectively. Figure 3e) and great antioxidant activity too (76.42 ± 1.27 and 77.4 5 ± 0.48%, respectively. Figure 3c). Phytic acid and TIA (antinutrients) were similar for all samples but “Copafam” had the lowest level of tiamin inhibition activity (Figure 3a) and of phytic acid (2.34 ± 0.7 mg/g dw; 1.02 ± 0.01 g /100 g dw, respectively. Figure 3d).
High-Performance Liquid Chromatography (HPLC) analysis of hydrolyzed bean extracts showed similar chromatogram profiles, and the hydroxycinnamic acid constituted the main phenolic compound of all the beans considered (Figure 3g). The samples of P. coccineus revealed a high sinapic acid content and a lower content of ferulic and p-cumaric acid; “Copafam” sample showed the lowest level (16.01 ± 0.45 mg/100 dw) of ferulic acid.
The results of the nutritional and phytochemical analysis were confirmed by heat map (Figure 4a) and Principal Components Analysis (PCA) biplot (Figure 4b). The heat-map (Figure 4a) reflected the differences between the “Copafam” sample and the other ones in terms of a high total phenol content, anthocyanins, fiber, and antioxidant activity and low content of protein, sugar, and antinutrient levels. All samples were well separated and “Copafam” samples were located in the bottom left part of the PCA biplot (Figure 4b), where antioxidant activity, polyphenols, anthocyanin content, and dietary fiber were positioned.

3.2. Consumer Study

The frequency table of terms checked by consumers to describe biscuit samples is reported in Table 1.
Cochran’s Q test revealed significant differences in 23 out of 26 terms. The sensory attributes that were not useful in order to discriminate samples were: sour, salty, and moist. Biscuit samples were then generally characterized by low sour and salty tastes as well as low moist texture. The samples with “Copafam” were characterized by a darker color and an uneven appearance compared to the control, probably due to the punctuation detected on the surface of the samples. From an olfactory point of view, consumers identified a mild odor only for the sample with 25% “Copafam”, while the 50% sample was found to be more intense compared to biscuit samples without legume flour; Cop25 was mainly described by a butter odor, whereas the samples at 50% were characterized by legume and toasted odors. Both samples were found to be crunchy, crumbly, grainy, and dry.
A significant sample effect (F = 5.39; p < 0.001) was found on liking scores (Figure 5). All samples were considered acceptable by the consumers except for the biscuit with 50% of Borlotto flour which obtained the lowest score (5.0 ± 0.2). The control sample without legume flour obtained the highest liking score (6.8 ± 0.2) and obtained a comparable score to Cop25 (6.5 ± 0.1) and Bor25 (6.3 ± 0.2). These three formulations were in turn comparable with Can25 (6.2 ± 0.2), Can50 (5.9 ± 0.2), and Cop50 (6.1 ± 0.2).
A biplot of the samples based on sensory descriptive analysis was obtained by means of correspondence analysis (CA) (Figure 6). The CA performed on the total frequency of participants’ counts for each attribute resulted in two dimensions accounting for 91.65% of the variance of data. As shown in Figure 6, samples appear to be separated in the plan according to the type of legume.
The liking is positioned close to the control sample (ST) and on the upper side of the map where samples with increasing amounts of “Copafam” flour, as well as the biscuit with 25% of Borlotto flour, are positioned. The sensory attributes that were mainly related to the positive hedonic responses were: sweet, mild odor/flavor, butter odor/flavor, and crumbly texture. The sample Bor50 obtained the lowest liking score and was characterized by the terms bitter, legume odor/flavor, and toasted odor/flavor. Cronbach’s alpha test revealed satisfactory internal consistency on food neophobia scale (alpha = 0.78). The mean food neophobia value for the population involved was 26.46 ± 9.7. ANOVA results revealed no significant effect of food neophobia level on hedonic ratings.
Key: ST, biscuit with 100% type 1 wheat flour; Bor25, biscuit with 25% of borlotto flour; Bor50, biscuit with 50% of borlotto flour; Can25, biscuit with 25% of cannellino flour; Can50, biscuit with 50% of cannellino flour; Cop25, biscuit with 25% of “Copafam” flour; Cop50, biscuit with 50% of “Copafam” flour.

4. Discussion

This research suggested that the variability among species is greater than the variability between varieties of the same species, in accordance with previous findings [46]. The present results revealed that “Copafam” beans differ from commercial beans in the nutritional and phytochemical composition as well as in the consumer study findings. In fact, the amount of protein was higher in beans belonging to P. vulgaris (Borlotto and Cannellino) species while “Copafam” (Figure 2c) showed the lowest content. However, all samples had more than 20% protein content leading beans to be considered a good source of this macronutrient and a possible alternative to red meat, the current principal source of proteins in consumers’ diets. Globally, red meat consumption is higher than other protein sources like legumes, fish, poultry, and eggs, despite the well-documented health benefits of legume consumption [47].
The content of lipids was similar among all cultivars considered; the level ranged from 3.19% to 4.49% and “Copafam” was the one with low fat content (Figure 2b). According to Yoshida [48], the colored beans showed the lowest mean values of lipid content. Further, in previous research works, it was found that the principal fatty acids in beans are unsaturated and polyunsaturated, which are important compounds to improve human health [48,49]. Modest lipid and sugar levels (Figure 2e,h) represent the right conditions for maintaining a healthy diet [50]. A WHO guideline recommends people reduce their daily intake of free sugars (such as glucose, fructose, and sucrose) to less than 10% of their total energy intake in order to improve health benefits [51,52]. In fact, WHO estimated that by 2025, approximately 167 million people will become overweight or obese, therefore they suggested restricting high-fat food consumption [53].
The “Copafam” bean showed the highest fiber content (Figure 3h). Dietary fiber, besides reducing blood and cholesterol levels, induces the proliferation of beneficial microbes in the gut (prebiotic properties) and short-chain fatty acids (SCFAs) precursors throughout the fermentation process [28,47]. Alcázar-Valle [25] found in P.coccineus a high percentage of fiber and lower protein content compared to P. vulgaris which presented a higher percentage of protein levels, coherently with the findings of our research and the previous results [32].
The results about the seeds’ antioxidant properties showed that the “Copafam” variety is characterized by a high DPPH scavenging activity (Figure 3c). This antioxidant action could be directly related to the phenolic compounds profile. Indeed, “Copafam” was the richest in anthocyanin and polyphenol content (Figure 3b and Figure 3f, respectively). Specifically, all the beans examined in this study contain similar hydroxycinnamic acid derivatives as their main phenolic component (Figure 3g). The samples of P. coccineus contained higher sinapic acid levels while P.vulgaris samples were abundantly composed of ferulic and p-cumaric acid. These results are concurrent with previous findings by Lin [30] and Madrera [28], which reported that hydroxycinnamic acid derivatives constituted the main phenolic components of beans upon alkaline treatment. The bioactive compounds (TPC, TFC, anthocyanin, and antioxidant activity) identified in the beans are associated with nutraceutical proprieties and biological activity in reducing the risk of obesity, chronic diseases, diabetes, and regulation of metabolism [25,28,30].
Moreover, “Copafam” showed the lowest content of phytic acid and a minor trypsin inhibitor activity. A high antinutrient level represents an important nutritional issue since the presence of TIA decreases protein digestibility and a high level of phytic acid, for example, reduces the availability of some essential nutrients like minerals, such as K, Fe, and Zn, and amino acids [25,26,27,28,29,30,31].
Due to its nutritional and phytochemical composition, “Copafam” could be considered a good source of protein and of bioactive and functional components; it should be argued that consumers are paying more and more attention to nutritional aspects, and in view of this, the agri-food sector could use “Copafam”. In this context, the results obtained by sensory evaluation revealed that the experimental biscuit samples with added bean flour were well accepted by the consumers. In particular, biscuits with “Copafam” flour were found to be comparable to the control sample. It should be considered that the positive hedonic responses to these new food formulations are not so obvious; indeed, the addition of legume flour in a food matrix could negatively modify sensory properties [33,34]. Consumers’ food choices and habits are then mainly driven by food preferences and, even if the enrichment in functional compounds adds value to the consumer [54], they are not really inclined to compromise on their diet [55]. Indeed, perceptual factors of a food—namely the characteristics perceived by our senses—still remain the more relevant in defining eating behavior [56,57].
The sensory descriptive analyses revealed that the specific attributes mainly responsible for the low acceptance of the sample with half of the wheat flour substituted with borlotto flour were associated with visual flavor aspects. Indeed, when the legume flavor became too intense and the color shifted from light to dark, consumers seemed to be less satisfied. Previous studies have been performed investigating the amount that could possibly be used to substitute flour with different percentages of legume flour. It has been suggested, for example, that formulations with up to 40% of pulse flours can be used to prepare snacks, such as crackers, without negatively affect their sensory quality [58], whereas other authors depicted a decrease in acceptability scores already at lower concentration [59]. Recently, legume flours from chickpea and green pea were successfully used to enrich a new rice-based snack [35]. According to the present results, positive hedonic responses to the addition of bean flour have been highlighted in cookies [60] as well as in other bakery products, such as tortillas [61], suggesting the real possibility of investing resources in promoting the use of these flours in the development of new products.
Unexpectedly, a significant effect of food neophobia level on liking scores was not revealed, whereas previous research works showed different hedonic responses to new food formulations according to this behavioral variable. Indeed, it is well established that food-neophobic subjects are more diffident in trying novel foods compared to neophilic ones, who tend to have a wide and varied diet [35,62]. These contrasting results could be explained by the type of food products use as the model (biscuit) and the ingredient added (legume flour), which could be perceived as familiar by the consumers involved.
Following the definition of Camacho Villa [6], landraces differ from conventional commercial varieties in terms of lacking formal crop improvement, being locally adapted, and being suitable for low-input traditional farming systems. Agriculture is considered one of the most important drivers of climate change, since innovation bought by the Green Revolution has completely modified the sustainability of processes, leading to an irreversible tendency at adopting conventional and intensive practices. This process is even more important in fragile territories of natural importance as mountains, where a high-input agricultural model (with the introduction of a high amount of input in terms of nutrition, health, and management costs) cannot be applied [2,10]. Landraces are less demanding in environmental and nutritional factors and can adapt to withstand the “typical” conditions (cold, heat, drought, soils, and “poor” foods) of the marginal areas and to organic agriculture [63].
Unfortunately, during the last century, the progressive substitution of landraces with modern varieties led to a dramatic reduction of crop diversity all over the world [2]. In addition, most of these traditional varieties are often found in mountain and hilly areas [23,64] and often they do not have clear origins or known morphometric and phytochemical characteristics, making their enhancement and conservation very difficult. This lack of information, in addition to preventing the conservation of agrobiodiversity, does not even allow the study and enhancement of landraces that could be particularly interesting for starting up unique high-quality agri-food chains of low environmental impact that could be strategic for smart, sustainable and inclusive growth of marginal and mountain territories.
In general, the potential for commercializing landraces is substantial, given the poor number of plants used for food production worldwide. Many underutilized species have the potential for the creation of value chains that could increase farmers’ income. To achieve many of the UN SDGs [65], agricultural and health and nutrition experts will need to work more closely together toward a food system that better links agriculture, diet, and human health [63].
“Copafam”, for its particular agronomic and nutritional features in addition to its link with the history and gastronomy of a territory [32], could become an important resource in this framework. Currently, this bean is not available commercially and it is cultivated and used only by a few farmers in the Brescia pre-Alps (and neighboring territories), mostly hobbyists. They and Indigenous peoples use “Copafam” in the preparation of typical dishes (e.g., Copafam soup or pasta and beans) [32]. In the future, it could improve the incomes of farmers and restauranteurs in the mountain areas of Lombardy, because consumers are increasingly interested in local agricultural products and traditional foods [32].
At present, in order to conserve and enhance agrobiodiversity and re-establish ties with the territory in terms both of territorial tradition and history of agricultural and food practices, some farmers gathered in consortia and associations. Unfortunately, most of the landraces are still cultivated by individual hobby farmers, in the foothill and mountain areas especially [4,23]. The study and characterization of ancient crop varieties is the first step for their recovery and there are many virtue cases around the world, such as what was carried out recently by Fenzi et al. [19] for the reintroduction of a disappeared landrace of Veneto (called Sponcio maize). The reintroduction of this variety was possible thanks to an intense workflow that started from the discovery and study of lost landraces to the development of innovative approaches by farmers.
A similar strategy was used by Cassani et al. [66] for the landraces of beaked corn: “Nero Spinoso di Valcamonica”. The starting point was the genetic and phytochemical characterization of the landrace that appeared as a flavonoid-rich food that accumulates phlobaphenes in the pericarp. Genetic investigations demonstrated further that phlobaphene pigmentation is under the control of a monogenic dominant gene, making this variety an extremely interesting resource as a functional food and a useful tool in future breeding programs. After the nutritional and phytochemical characterization of “nero spinoso” maize landrace, a farmers’ consortium with the objective to preserve, produce, and transform this cultivar, was settled up. This traditional cultivar was included in the European Register of Conservation Varieties in order to prevent its loss as well as to preserve the genetic variability. Today the “Nero Spinoso” maize is grown in small plots in the Camonica Valley on a total area of about 30,000 m2. Before the activity of study and enhancement, it was cultivated in a small isolated field of 100 m² by just one farmer, so it was at great risk of genetic erosion (oral communication by Nero Spinoso Consortium).
Involving people in modern sustainable agricultural models, which also include the cultivation of landraces, will require time. The multi-actor approach is really important in revitalizing landraces and creating a value chain, meaning the focal role of partnerships of research centers concerned with the conservation of agrobiodiversity and the sustainable development of mountain regions with the private sector, NGOs, commonalities, etc. It is fundamental to look for support from organizations that deal with training, conservation of the territory and biodiversity, and socio-economic development. This aspect is of fundamental importance at a global level to support the local agri-food sector and therefore to favor the conservation of agrobiodiversity and the sustainable development of the local economy, in the foothill and mountain areas especially.

5. Conclusions

This research aimed at a comprehensive characterization of the “Copafam” landrace bean, comparing it with commercial cultivars to investigate its specificities. In front of a lower protein and lipidic content and higher dietary fiber, “Copafam” resulted as the best source of secondary metabolites such as polyphenols and anthocyanins and showed a high level of flavonoids, having, consequently, an interesting antioxidant activity. All these characteristics make it a resource of great interest for an innovative food industry.
Health is deeply tangled with the food production system and food consumer perception. The most promising legumes could be selected to enhance local production and improve food distribution and consumption strategies. The high content of functional molecules present in the “Copafam” bean could represent innovative forms of consumption like fortified foods to valorize agricultural products for human health. Our research was a preliminary trial opening possibilities for further investigations about alternative uses of “Copafam” bean flour. These “unconventional” uses are also ways to preserve, spread, and enhance that agricultural product. Coordinated actions of national institutions, supported by the EU, as well as of stakeholders, can improve knowledge, access, and use of landrace cultivars to transform them into potential resources for the sustainable development of mountains territories.

Author Contributions

Conceptualization, D.P., L.G., A.G., E.P. and A.S.; formal analysis, D.P., C.P., M.Z., G.B., S.M.B. and V.L.; investigation, D.P., V.L., M.Z., L.G. and A.M.B.; cultivars identification, L.G.; methodology and data curation, D.P., C.P., L.G., G.B., M.Z. and S.M.B.; writing—original draft preparation, D.P., C.P., S.M.B. and V.L.; writing—review and editing, D.P., L.G., V.L. and S.M.B.; supervision, L.G., A.G., E.P. and A.S.; project administration, A.G.; funding acquisition, A.G. and L.G. All authors have read and agreed to the published version of the manuscript.

Funding

This research was supported by “Montagne: Living Labs di innovazione per la transizione ecologica e digitale”, “PSR Fagio.Lo.– Ricerca, caratterizzazione e valorizzazione di cultivar di fagiolo tradizionali lombarde”, “MIND FoodS HUB (Milano Innovation District Food System Hub): Innovative concept for the eco-intensification of agricultural production and for the promotion of dietary patterns for human health and longevity through the creation in MIND of a digital Food System Hub” and “National Center for Technology in Agriculture-AGRITECH” projects.

Institutional Review Board Statement

The study was conducted according to the guidelines of the Declaration of Helsinki and approved by the Ethics Committee of the University of Milan.

Informed Consent Statement

Informed consent was obtained from all subjects involved in the study.

Data Availability Statement

The datasets used and/or analyzed during the current study are available from the corresponding author upon reasonable request.

Acknowledgments

We wish to thank the local “Copafam” bean producers’ and the “Forneria Pasticceria Salvetti” bakery for their collaboration.

Conflicts of Interest

The authors declare no competing interest. The funders had no role in the design of the study; in the collection, analyses, or interpretation of data; in the writing of the manuscript; or in the decision to publish the results.

Appendix A

Table A1. One-way ANOVA results of the effect of the bean cultivar on phytochemical and nutritional features.
Source of VarianceDfSum of SquaresMean SquareF-Ratiop-Value
Moisture3233,02077,673.447.250.0000
Protein3347,634115,878137.590.0000
Lipid317,450.95816.9771.670.0000
TPC32.92 × 10139.73 × 1012615.760.0000
Anthocyanin31.10 × 10123.68 × 101140,725.90.0000
DPPH38.06× 10112.69 × 10 11462.680.0000
Ash33115.581038.5311.090.0032
TFC3560,994186,9981298.60.0000
P-cumaric3149,65649,885.4108.310.0000
Sinapic3353,152117,71776.850.0000
Ferulic31.25 × 1011417,90329.480.0001
TIA351,709.617,236.512.090.0024
Phytic acid31630.33543,44410.620.0037
D-glucose314.254.752.280.1563
Saccarose3137,59245,864.14138.110.0000
RSO3872.25290.750.180.9083
Starch3620,205206,73519.710.0005
Dietary fibre32.48 × 1011828,18177.610.0000
Key: TIA (Trypsin inhibitor activity); TPC (total polyphenol component); TFC (total flavonoid content); RSO (Raffinose-Series Oligosaccharides).

References

  1. Giupponi, L.; Leoni, V. VegeT: An Easy Tool to Classify and Facilitate the Management of Seminatural Grasslands and Dynamically Connected Vegetation of the Alps. Land 2020, 9, 473. [Google Scholar] [CrossRef]
  2. Raggi, L.; Pacicco, L.C.; Caproni, L.; Álvarez-Muñiz, C.; Annamaa, K.; Barata, A.M.; Batir-Rusu, D.; Díez, M.J.; Heinonen, M.; Holubec, V.; et al. Analysis of landrace cultivation in Europe: A means to support in situ conservation of crop diversity. Biol. Conserv. 2022, 267, 109460. [Google Scholar] [CrossRef]
  3. Singh, V.; Jardhari, V. Landrace renaissance in the mountains: Experiences of the Beej Bachao Andolan in the Garhwal Himalayan region, India. In An Exchange of Experiences from South and South East Asia, Proceedings of the International Symposium on Participatory Plant Breeding and Participatory Plant Genetic Resources Enhancement, Pokhara, Nepal, 1–5 May 2000; Consultative Group on International Agricultural Research (CGIAR), Participatory Research and Gender Analysis (PRGA), Program Coordination Office: Cali, Colombia, 2001; pp. 87–96. [Google Scholar]
  4. Giupponi, L.; Pilu, R.; Scarafoni, A.; Giorgi, A. Plant agro-biodiversity needs protection, study and promotion: Results of research conducted in Lombardy region (Northern Italy). Biodivers. Conserv. 2020, 29, 409–430. [Google Scholar] [CrossRef]
  5. FAO. Agricultural Biodiversity, Multifunctional Character of Agriculture and Land Conference, Background Paper 1; FAO: Maastricht, The Netherlands, 1999. [Google Scholar]
  6. Villa, T.; Maxted, N.; Scholten, M.; Ford-Lloyd, B. Defining and identifying crop landraces. Plant Genet. Res. 2005, 3, 373–384. [Google Scholar] [CrossRef] [Green Version]
  7. Ceccarelli, S. Landraces: Importance and use in breeding and environmentally friendly agronomic systems. In Agrobiodiversity Conservation: Securing the Diversity of Crop Wild Relatives and Landraces; Maxted, N., Ehsan Dulloo, M., Ford-Lloyd, B.V., Frese, L., Iriondo, J.M., Pinheiro de Carvalho, M.A.A., Eds.; CAB International: Oxfordshire, UK, 2012; pp. 3–117. [Google Scholar]
  8. Puglisi, D.; Landoni, M.; Cassani, E.; Toschi, I.; Lucchini, G.; Cesari, V.; Borlini, G.; Scapin, A.; Pilu, R. Traditional farmers’ varieties: A valuable source of genetic variability for biofortification programs. Maydica 2018, 63, 10. [Google Scholar]
  9. Frison, E.A.; Cherfas, J.; Hodgkin, T. Agricultural biodiversity is essential for a sustainable improvement in food and nutrition security. Sustainability 2011, 3, 238–253. [Google Scholar] [CrossRef] [Green Version]
  10. Bertolino, M.A. Agri-Cultural Resistance and Local Development: The Cases of Lavender and Rye in the Susa Valley In La Nuova Centralità Della Montagna; Bolognesi, M., Corrado, F., Eds.; Territorio Rivista di Studi Territorialisti Firenze University Press: Firenze, Italy, 2009. [Google Scholar]
  11. FAO. 2021. Available online: https://www.fao.org/director-general/news/news-article/it/c/1390762/ (accessed on 11 April 2021).
  12. United Nations. Transforming Our World: The 2030 Agenda for Sustainable Development. 2015. Available online: https://undocs.org/A/RES/70/1 (accessed on 11 September 2021).
  13. FAO. Building on Gender, Agrobiodiversity and Local Knowledge; Food and Agriculture Organization of the United Nations: Rome, Italy, 2004. [Google Scholar]
  14. FAO. Second Report on the State of the World’s Plant Genetic Resources for Food and Agriculture. Commission on Genetic Resources for Food and Agriculture; Food and Agriculture Organization of the United Nations: Rome, Italy, 2010. [Google Scholar]
  15. EU Commission. EUROPE 2020 a Strategy for Smart, Sustainable and Inclusive Growth. 2010. Available online: https://eurlex.europa.eu/legal-content/EN/TXT/?uri=CELEX%3A52010DC2020 (accessed on 11 September 2020).
  16. European Commission. A European Green Deal. Available online: https://ec.europa.eu/info/strategy/priorities-2019-2024/european-green-deal (accessed on 19 November 2021).
  17. Spataro, G.; Negri, V. The European seed legislation on conservation varieties: Focus, implementation, present and future impact on landrace on farm conservation. Genet. Resour. Crop Evol. 2013, 60, 2421–2430. [Google Scholar] [CrossRef]
  18. European Commission. EU COM 380, 20.5.2020. Communication from the Commission to the European Parliament, the Council, the European Economic and Social Committee and the Commettee of the Regions: EU Biodiversity Strategy for 2030. Bringing Nature Back into Our Lives. Available online: https://ec.europa.eu/info/sites/info/files/communication-annex-eubiodiversity-strategy-2030_en.pdf. (accessed on 19 November 2021).
  19. Fenzi, M.; Couix, N. Growing maize landraces in industrialized countries: From the search for seeds to emerge of new practices and value. Int. J. Agric. Sustain. 2021, 20, 327–345. [Google Scholar] [CrossRef]
  20. Giupponi, L.; Borgonovo, G.; Panseri, S.; Giorgi, A. Multidisciplinary study of a little known landrace of Fagopyrum tataricum Gaertn. of Valtellina (Italian Alps). Genet. Resour. Crop Evol. 2019, 66, 783–796. [Google Scholar] [CrossRef]
  21. Giupponi, L.; Leoni, V.; Pedrali, D.; Ceciliani, G.; Bassoli, A.; Borgonovo, G. Morphometric and phytochemical characterization and elevation effect on yield of three potato landraces of the Ligurian Apennines (Northern Italy). J. Appl. Bot. Food 2020, 93, 234–243. [Google Scholar] [CrossRef]
  22. Giupponi, L.; Leoni, V.; Colombo, F.; Cassani, E.; Hejna, M.; Rossi, L.; Pilu, R. Characterization of “Mais delle Fiorine” (Zea mays L.) and nutritional, morphometric and genetic comparison with other maize landraces of Lombardy region (Northern Italy). Genet. Resour. Crop Evol. 2021, 68, 2075–2091. [Google Scholar] [CrossRef]
  23. Giupponi, L.; Pedrali, D.; Leoni, V.; Rodari, A.; Giorgi, A. The Analysis of Italian Plant Agrobiodiversity Databases Reveals That Hilly and Sub-Mountain Areas Are Hotspots of Herbaceous Landraces. Diversity 2021, 13, 70. [Google Scholar] [CrossRef]
  24. Aquino-Bolaños, E.N.; Garzón-García, A.; Alba-Jiménez, J.; Chávez-Servia, J.; Vera-Guzmán, A.; Carrillo-Rodríguez, J.; Santos-Basurto, M. Physicochemical Characterization and Functional Potential of Phaseolus vulgaris L. and Phaseolus coccineus L. Landrace Green Beans. Agronomy 2021, 11, 803. [Google Scholar] [CrossRef]
  25. Alcázar-Valle, M.; Lugo-Cervantes, E.; Mojica, L.; Morales-Hernández, N.; Reyes-Ramírez, H.; Enríquez-Vara, J.N.; García-Morales, S. Bioactive Compounds, Antioxidant Activity, and Antinutritional Content of Legumes: A Comparison between Four Phaseolus Species. Molecules 2020, 25, 3528. [Google Scholar] [CrossRef]
  26. Rodríguez Madrera, R.; Negrillo, A.C.; Valles, B.S.; Ferreira Fernández, J.J. Phenolic Content and Antioxidant Activity in Seeds of Common Bean (Phaseolus vulgaris L.). Foods 2021, 10, 864. [Google Scholar] [CrossRef]
  27. National Recovery and Resilience Plan (NRRP). Available online: https://www.governo.it/sites/governo.it/files/PNRR.pdf (accessed on 19 November 2021).
  28. Rodríguez Madrera, R.; Valles, B.S. Development and validation of ultrasound assisted extraction (UAE) and HPLC-DAD method for determination of polyphenols in dry beans (Phaseolus vulgaris). J. Food Compost. Anal. 2020, 85, 10334. [Google Scholar] [CrossRef]
  29. Finetti, F.; Biagi, M.; Ercoli, J.; Macrì, G.; Miraldi, E.; Trabalzini, L. Phaseolus vulgaris L. var. Venanzio Grown in Tuscany: Chemical Composition and In Vitro Investigation of Potential Effects on Colorectal Cancer. Antioxidant 2020, 9, 1181. [Google Scholar] [CrossRef]
  30. Lin, L.Z.; Harnly, M.J.; Pastor-Corrales, M.S.; Luthria, D.L. The polyphenolic profiles of common bean (Phaseolus vulgaris L.). Food Chem. 2008, 107, 399–410. [Google Scholar] [CrossRef] [Green Version]
  31. Correia Bento, J.A.; Ribeiro, P.R.V.; e Silva, L.M.A.; Filho, E.G.A.; Bassinello, P.Z.; de Brito, E.S.; Caliari, M.; Júnior, M.S.S. Chemical profile of colorful bean (Phaseolus vulgaris L.) flours: Changes influenced by the cooking method. Food Chem. 2021, 356, 129718. [Google Scholar] [CrossRef]
  32. Giupponi, L.; Tamburini, A.; Giorgi, A. Prospects for Broader Cultivation and Commercialization of Copafam, a Local Variety of Phaseolus coccineus L. in the Brescia Pre-Alps. Mt. Res. Dev. 2018, 38, 24–34. [Google Scholar] [CrossRef] [Green Version]
  33. Bortnowska, G.; Krudos, A.; Schube, V.; Krawczyńska, W.; Krzemińska, N.; Mojka, K. Effects of waxy rice and tapioca starches on the physicochemical and sensory properties of white sauces enriched with functional fibre. Food Chem. 2016, 202, 31–39. [Google Scholar] [CrossRef] [PubMed]
  34. Wang, Y.; Trani, A.; Knaapila, A.; Hietala, S.; Coda, R.; Katina, K.; Maina, N.H. The effect of in situ produced dextran on flavour and texture perception of wholegrain sorghum bread. Food Hydrocoll. 2020, 106, 105913. [Google Scholar] [CrossRef]
  35. Proserpio, C.; Bresciani, A.; Marti, A.; Pagliarini, E. Legume Flour or Bran: Sustainable, Fiber-Rich Ingredients for Extruded Snacks? Foods 2020, 9, 1680. [Google Scholar] [CrossRef]
  36. AOAC International. AOAC Method n_9991.36; 945.18; 993.40. In Official Methods of Analysis of AOAC International, 18th ed.; Horwitz, W., Latimer, G.W., Eds.; AOAC International: Gaithersburg, ML, USA, 2005. [Google Scholar]
  37. American Association of Cereal Chemists (AACC). Approved Methods of Analysis; Method n_ 08-01.01., 11th ed.; AACC International: St. Paul, MN, USA, 1999. [Google Scholar]
  38. Brand-Williams, W.; Cuvelier, M.E.; Berset, C. Use of a free radical method to evaluate antioxidant activity. LWT-Food Sci. Technol. 1995, 28, 25–30. [Google Scholar] [CrossRef]
  39. Saura-Calixto, L.; Bravo, F. Charactererization of Dietary Fiber and the In Vitro Indigestible Fraction of Grape Pomace. Am. J. Enol. Vitic. 1998, 49, 135–141. [Google Scholar]
  40. Abdel-Aal, E.-S.M.; Hucl, P. A Rapid Method for Quantifying Total Anthocyanins in Blue Aleurone and Purple Pericarp Wheats. Cereal Chem. 1999, 76, 350–354. [Google Scholar] [CrossRef]
  41. ISO 14902:2001; Animal Feeding Stuffs—Determination of Trypsin Inhibitor Activity of Soya Products. International Standardization Organization: Geneva, Swizzerland, 2010.
  42. Ares, G.; Deliza, R.; Barreiro, C.; Giménez, A.; Gámbaro, A. Comparison of two sensory profiling techniques based on consumer perception. Food Qual. Prefer. 2010, 21, 417–426. [Google Scholar] [CrossRef]
  43. Jaeger, S.R.; Chheang, S.L.; Yin, J.; Bava, C.M.; Gimenez, A.; Vidal, L.; Ares, G. Check-all-that-apply (CATA) questions for sensory product characterization by consumers: Investigations into the number of terms used in CATA questions. Food Qual. Prefer. 2015, 42, 154–164. [Google Scholar] [CrossRef]
  44. Meyners, M.; Castura, J.C. Randomization of CATA attributes: Should attribute lists be allocated to assessors or to samples? Food Qual. Prefer. 2016, 48, 210–215. [Google Scholar] [CrossRef]
  45. Laureati, M.; Spinelli, S.; Monteleone, E.; Dinnella, C.; Prescott, J.; Cattaneo, C.; Proserpio, C.; De Toffoli, A.; Gasperi, F.; Endrizzi, I.; et al. Associations between food neophobia and responsiveness to “warning” chemosensory sensations in food products in a large population sample. Food Qual. Prefer. 2018, 68, 113–124. [Google Scholar] [CrossRef]
  46. Capistrán-Carabarin, A.; Aquino-Bolaños, E.N.; García-Díaz, Y.D.; Chávez-Servia, J.L.; Vera-Guzmán, A.M.; Carrillo-Rodríguez, J.C. Complementarity in Phenolic Compounds and the Antioxidant Activities of Phaseolus coccineus L. and P. vulgaris L. Landraces. Foods 2019, 8, 295. [Google Scholar] [CrossRef] [PubMed] [Green Version]
  47. Conti, M.V.; Guzzetti, L.; Panzeri, D.; De Giuseppe, R.; Coccetti, P.; Labra, M.; Cena, H. Bioactive compounds in legumes: Implications for sustainable nutrition and health in the elderly population. Trends Food Sci. Technol. 2021, 117, 139–147. [Google Scholar] [CrossRef]
  48. Yoshida, H.; Yoshida, N.; Tomiyama-Sakamoto, Y.; Mizushina, Y. Characteristic distributions of fatty acids in different lipids from Jack beans (Canavalia gladiata DC.). Eur. J. Lipid Sci. Technol. 2012, 114, 787–793. [Google Scholar] [CrossRef]
  49. Doan, L.P.; Nguyen, T.T.; Pham, M.Q.; Tran, Q.T.; Pham, Q.L.; Tran, D.Q.; Than, V.T.; Bach, L.G. Extraction processes, identification of fatty acids, tocopherols, sterols and phenolic constituents and antioxidant evaluation of seed oils from five fabaceae species. Processes 2019, 7, 456. [Google Scholar] [CrossRef]
  50. WHO. 2020. Available online: https://www.who.int/news-room/fact-sheets/detail/healthy-diet (accessed on 20 April 2022).
  51. WHO. Diet, Nutrition and the Prevention of Chronic Diseases: Report of a Joint WHO/FAO Expert Consultation; WHO Technical Report Series, No. 916; World Health Organization: Geneva, Switzerland, 2003. [Google Scholar]
  52. WHO. Guideline: Sugars Intake for Adults and Children; World Health Organization: Geneva, Switzerland, 2015. [Google Scholar]
  53. WHO. 2022. Available online: https://www.who.int/news/item/04-03-2022-world-obesity-day-2022-accelerating-action-to-stop-obesity (accessed on 20 April 2022).
  54. Alava, C.; Verdú, S.; Barat, J.M.; Grau, R. Enrichment of chips with fibre from a tiger-nut (Cyperus esculentus) milk co-product at ‘source of fibre foods’ and ‘high fibre content foods’ levels: Impact on processing, physico-chemical and sensory properties. Int. J. Food Sci. 2019, 54, 908–915. [Google Scholar] [CrossRef]
  55. Jaeger, S.R.; Axten, L.G.; Wohlers, M.W.; Sun-Waterhouse, D. Polyphenol-rich beverages: Insights from sensory and consumer science. J. Sci. Food Agric. 2009, 89, 2356–2363. [Google Scholar] [CrossRef]
  56. Kushwah, S.; Dhir, A.; Sagar, M.; Gupta, B. Determinants of organic food consumption. A systematic literature review on motives and barriers. Appetite 2019, 143, 104402. [Google Scholar] [CrossRef]
  57. Tuorila, H.; Hartmann, C. Consumer responses to novel and unfamiliar foods. Curr. Opin. Food Sci. 2020, 33, 1–8. [Google Scholar] [CrossRef]
  58. Millar, K.A. Effect of pulse flours on the physiochemical characteristics and sensory acceptance of baked crackers. Int. J. Food Sci. 2017, 52, 1155–1163. [Google Scholar] [CrossRef] [Green Version]
  59. Venkatachalam, K.; Nagarajan, M. Physicochemical and sensory properties of savory crackers incorporating green gram flour to partially or wholly replace wheat flour. Ital. J. Food Sci. 2017, 29, 599. [Google Scholar] [CrossRef]
  60. Simons, C.W.; Hall, C., III. Consumer acceptability of gluten-free cookies containing raw cooked and germinated pinto bean flours. Food Sci. Nutr. 2018, 6, 77–84. [Google Scholar] [CrossRef] [PubMed]
  61. Anton, A.A.; Lukow, O.M.; Fulcher, R.G.; Arntfield, S.D. Shelf stability and sensory properties of flour tortillas fortified with pinto bean (Phaseolus vulgaris L.) flour: Effects of hydrocolloid addition. LWT-Food Sci. Technol. 2009, 42, 23–29. [Google Scholar] [CrossRef]
  62. Siegrist, M.; Hartmann, C.; Keller, C. Antecedents of food neophobia and its association with eating behavior and food choices. Food Qual. Prefer. 2013, 30, 293–298. [Google Scholar] [CrossRef]
  63. Rudebjer, P.G.; Schagen, B.V.; Chakeredza, S.; Njoroge, K.; Kamau, H.; Baena, M. Teaching Agrobiodiversity: A Curriculum Guide for Higher Education; Bioversity International: Rome, Italy, 2011. [Google Scholar]
  64. Veteto, J.R. Seeds of Persistence: Agrobiodiversity in the American Mountain South. CAFÉ 2014, 36, 17–27. [Google Scholar] [CrossRef]
  65. United Nations, Department of Economic and Social Affairs—Sustainable Development. Make the SDG a Reality, Discover the Goals. Available online: https://sdgs.un.org/#goal_section (accessed on 9 December 2021).
  66. Cassani, E.; Puglisi, D.; Cantaluppi, E.; Landoni, M.; Giupponi, L.; Giorgi, A.; Pilu, R. Genetic studies regarding the control of seed pigmentation of an ancient European pointed maize (Zea mays L.) rich in phlobaphenes: The “Nero Spinoso” from the Camonica valley. Genet. Resour. Crop Evol. 2017, 64, 761–773. [Google Scholar] [CrossRef]
Figure 1. Plant material. “Copafam” sample (beans and flour) is reported in the green box, while commercial bean samples are in the grey box.
Sustainability 14 13409 g001
Figure 2. Nutritional features of bean flour. Data with different superscript letters are significantly different, p < 0.05. Key: RSO (Raffinose-Series Oligosaccharides). Green column represents “Copafam” bean and the grey columns denote the commercial samples.
Sustainability 14 13409 g002
Figure 3. Phytochemical features of bean flour data with different superscript letters are significantly different, p < 0.05. Key: TIA (Trypsin inhibitor activity); TPC (total polyphenol component); TFC (total flavonoid content). Green column represents “Copafam” bean and the grey columns denote the commercial samples.
Sustainability 14 13409 g003
Figure 4. Hierarchical cluster analysis heatmap (a) and principal component analysis biplot (b) of beans samples associated with nutritional and phytochemical variables. The first two principal components (PCs) explain 74.89% of total variance (PC1 = 41.90%; PC2 = 32.99%). Key: TIA (Trypsin inhibitor activity); RSO (Raffinose-Series Oligosaccharides).
Sustainability 14 13409 g004
Figure 5. Mean hedonic ratings by samples. Different letters show significant differences (p < 0.05) according to post hoc test. Key: ST, biscuit with 100% type 1 wheat flour; Bor25, biscuit with 25% of borlotto flour; Bor50, biscuit with 50% of borlotto flour; Can25, biscuit with 25% of cannellino flour; Can50, biscuit with 50% of cannellino flour; Cop25, biscuit with 25% of “copafam” flour; Cop50, biscuit with 50% of “Copafam” flour. Different letters show significant differences (p < 0.05) according to post hoc test.
Sustainability 14 13409 g005
Figure 6. Correspondence analysis from check-all-that-apply data (o, odor; f, flavor).
Sustainability 14 13409 g006
Table 1. Frequency counts of check-all-that-apply terms used to describe biscuit samples and results of Cochran’s Q test for comparison among the samples.
Sensory AttributesSamples
STBor25Bor50Can25Can50Cop25Cop50
Appearance
Light color ***73 d26 b3 a73 d49 c19 ab1 a
Dark color ***0 a17 ab59 c0 a5 ab20 b54 c
Patchy ***5 ab18 bc14 ab5 ab3031 cd37 d
Uniform ***55 c25 b24 b56 c50 c16 ab5 a
Speckled ***3 a51 b59 b2 a3 a56 b64 b
Odor
Mild ***40 c31 abc23 ab39 bc34 abc32 abc19 a
Strong **5 a10 ab12 ab6 ab17 ab8 ab18 b
Butter *** 41 c32 bc8 a35 c10 a34 c17 ab
Legumes ***3 a7 ab20 c8 ab12 abc7 ab17 bc
Toasted *** 2 ab12 abcd21 d1 a14 bcd7 abc19 cd
Taste
Sour n.s.1 a2 a1 a0 a3 a1 a3 a
Bitter ***0 a2 a20 c1 a5 ab4 ab14 bc
Sweet ***39 d21 abc7 a29 cd23 bc24 bcd13 ab
Salty n.s.6 a11 a6 a6 a6 a4 a6 a
Flavor
Mild ***47 b30 ab13 a45 b31 ab38 b15 a
Strong ***10 a18 ab27 b9 a18 ab9 a23 ab
Butter ***42 d16 abc2 a28 cd11 ab21 bc4 a
Legumes ***4 a24 bc35 c8 a25 bc15 ab30 bc
Toasted *** 2 a9 ab32 c6 ab18 bc9 ab24 c
Texture
Sticky **2 a2 a1 a10 b3 ab4 ab1 a
Crunchy ***19 a34 abc47 c21 a39 bc30 ab33 abc
Floury **19 a13 a12 a20 a18 a8 a10 a
Crumbly ***52 b48 b25 a48 b41 ab44 b45 b
Grainy ***11 ab11 ab15 abc6 a10 a27 c25 bc
Dry **22 a29 b39 b17 a32 ab30 ab28 ab
Moist n.s.3 a1 a1 a5 a2 a2 a1 a
Key: ST, biscuit with 100% type 1 wheat flour; Bor25, biscuit with 25% of borlotto flour; Bor50, biscuit with 50% of borlotto flour; Can25, biscuit with 25% of cannellino flour; Can50, biscuit with 50% of cannellino flour; Cop25, biscuit with 25% of “copafam” flour; Cop50, biscuit with 50% of “Copafam” flour. Different letters show significant differences (p < 0.05) according to post hoc test. n.s, not significant; ** p < 0.01; *** p < 0.001.
Publisher’s Note: MDPI stays neutral with regard to jurisdictional claims in published maps and institutional affiliations.

