


Artificial Intelligence and Exploratory-Data-Analysis-Based Initial Public Offering Gain Prediction for Public Investors
 ,
,  , ,
, ,  and
and 
Abstract
1. Introduction
1.1. Motivations
1.2. Contributions
- We present an in-depth analysis of IPO data from the Indian market over the last decade. Useful trends and inferences on the stock market were derived from the data.
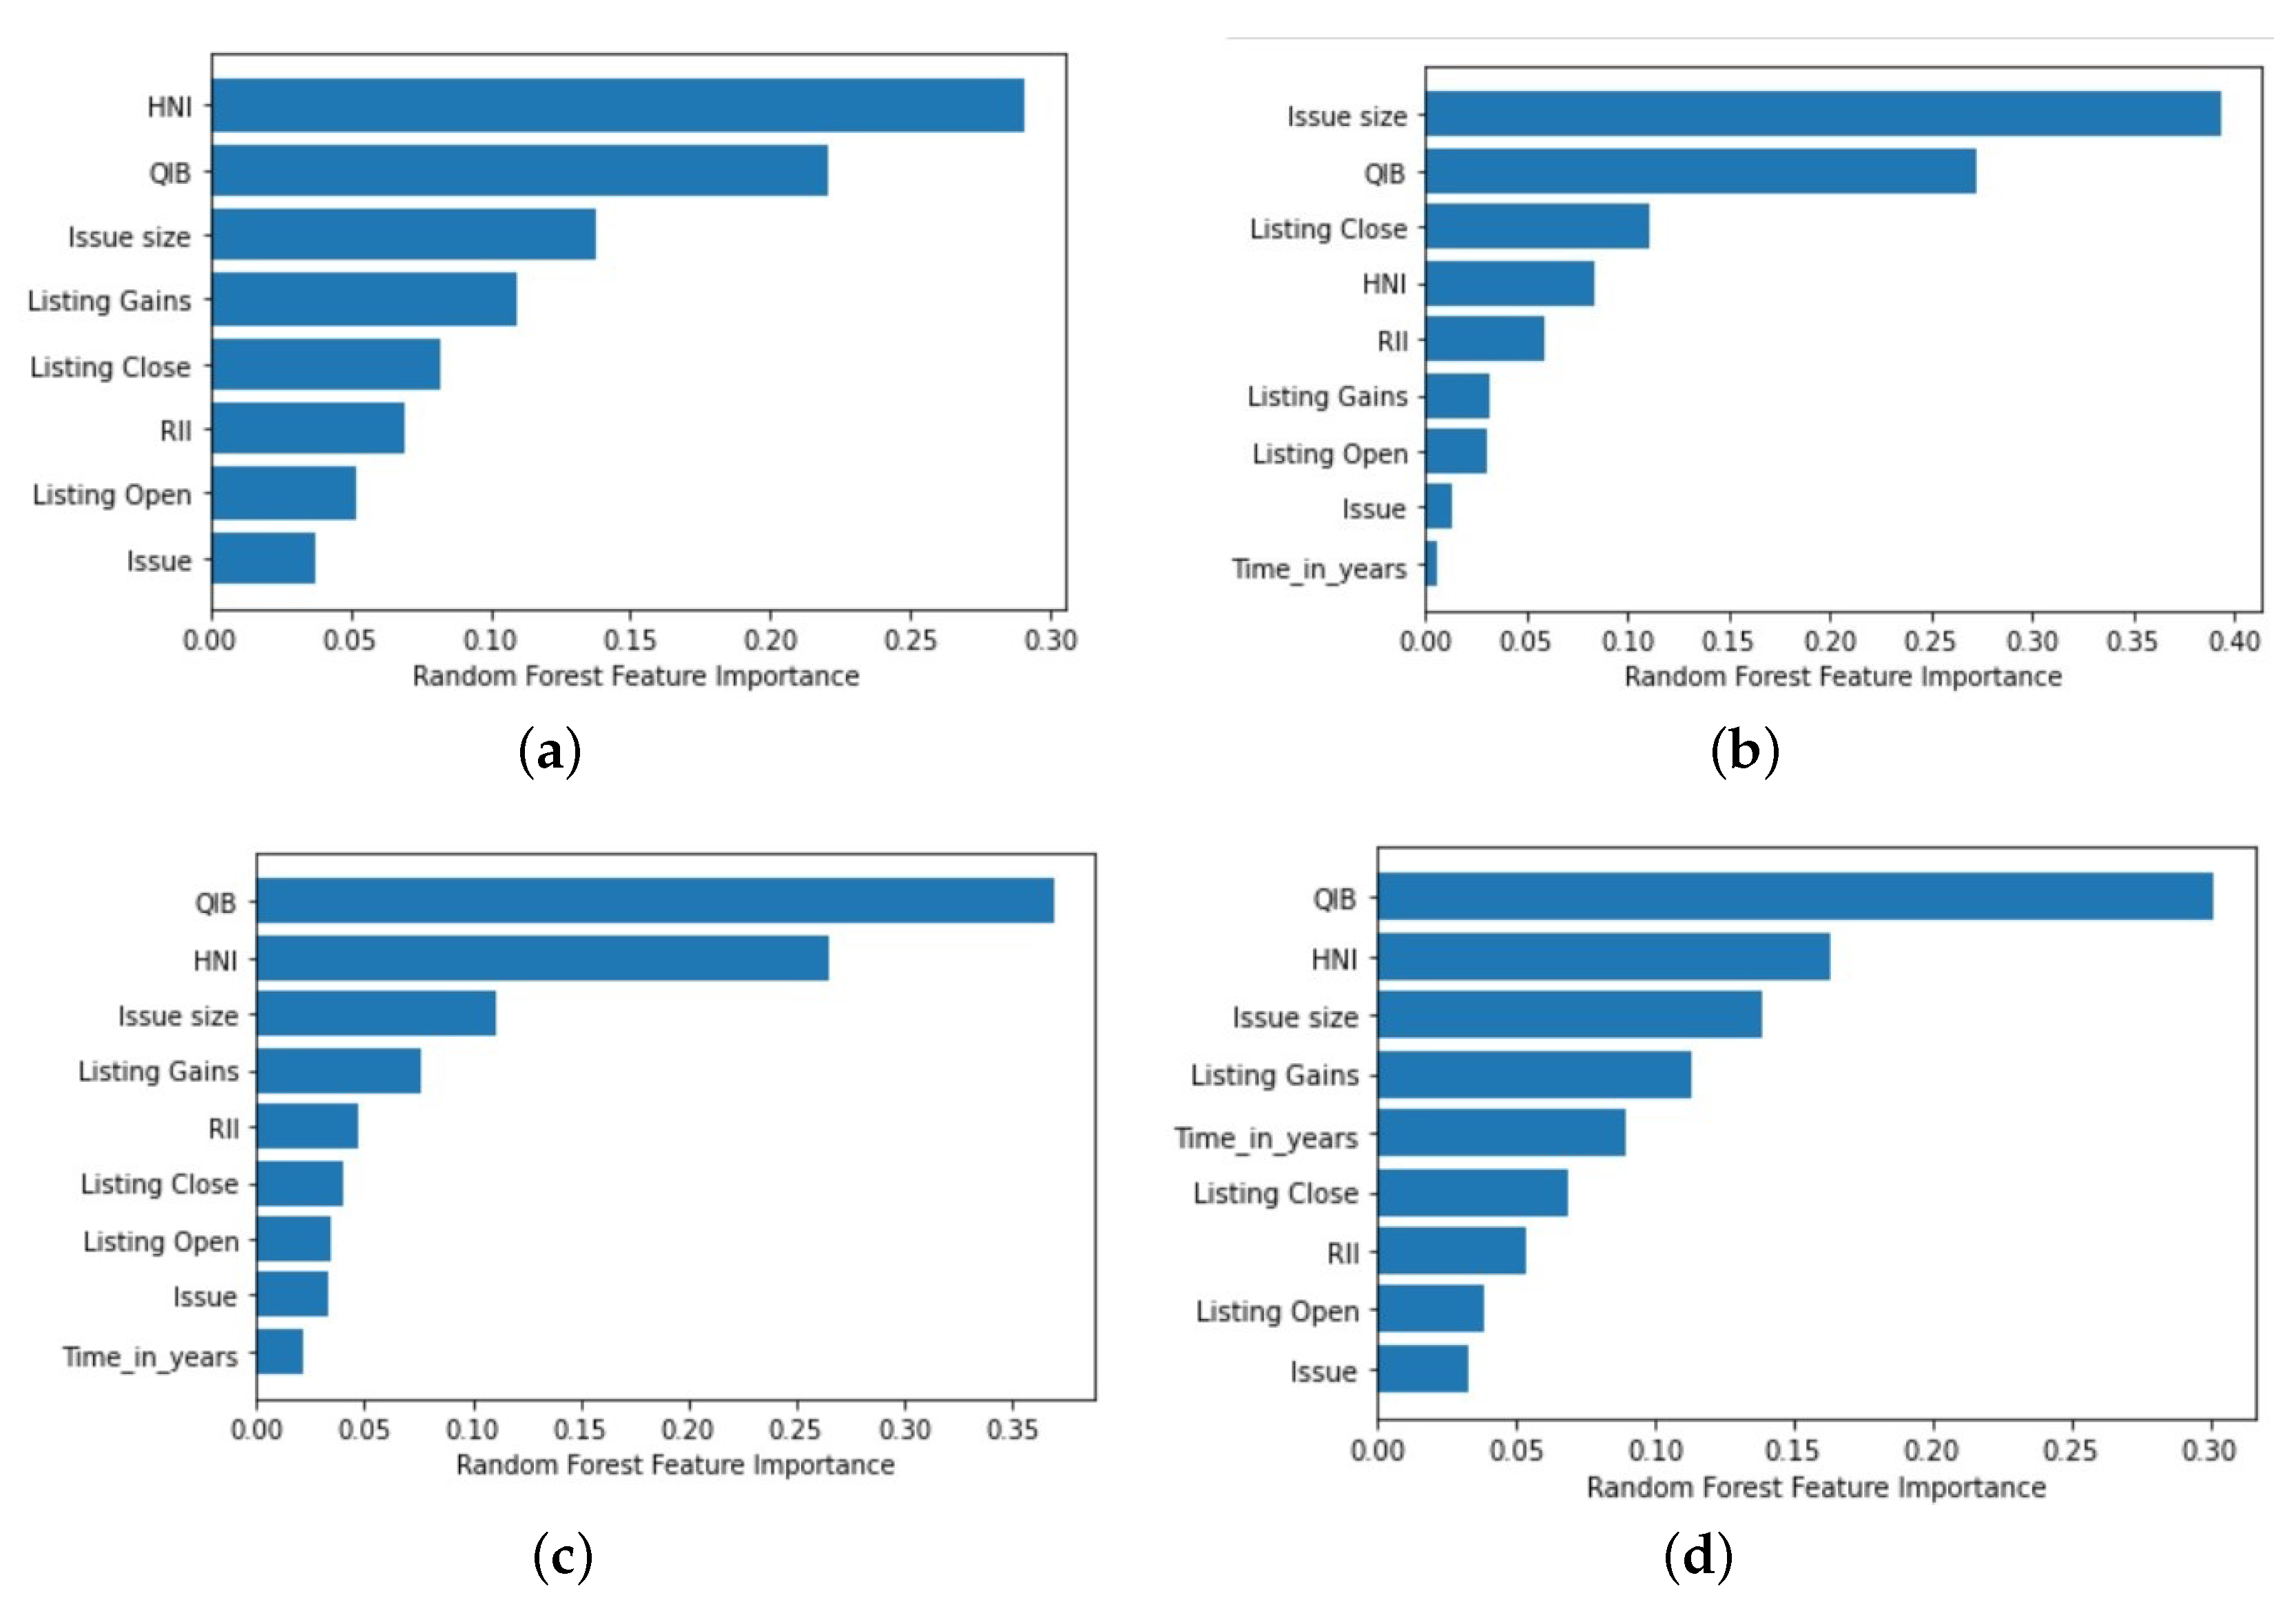
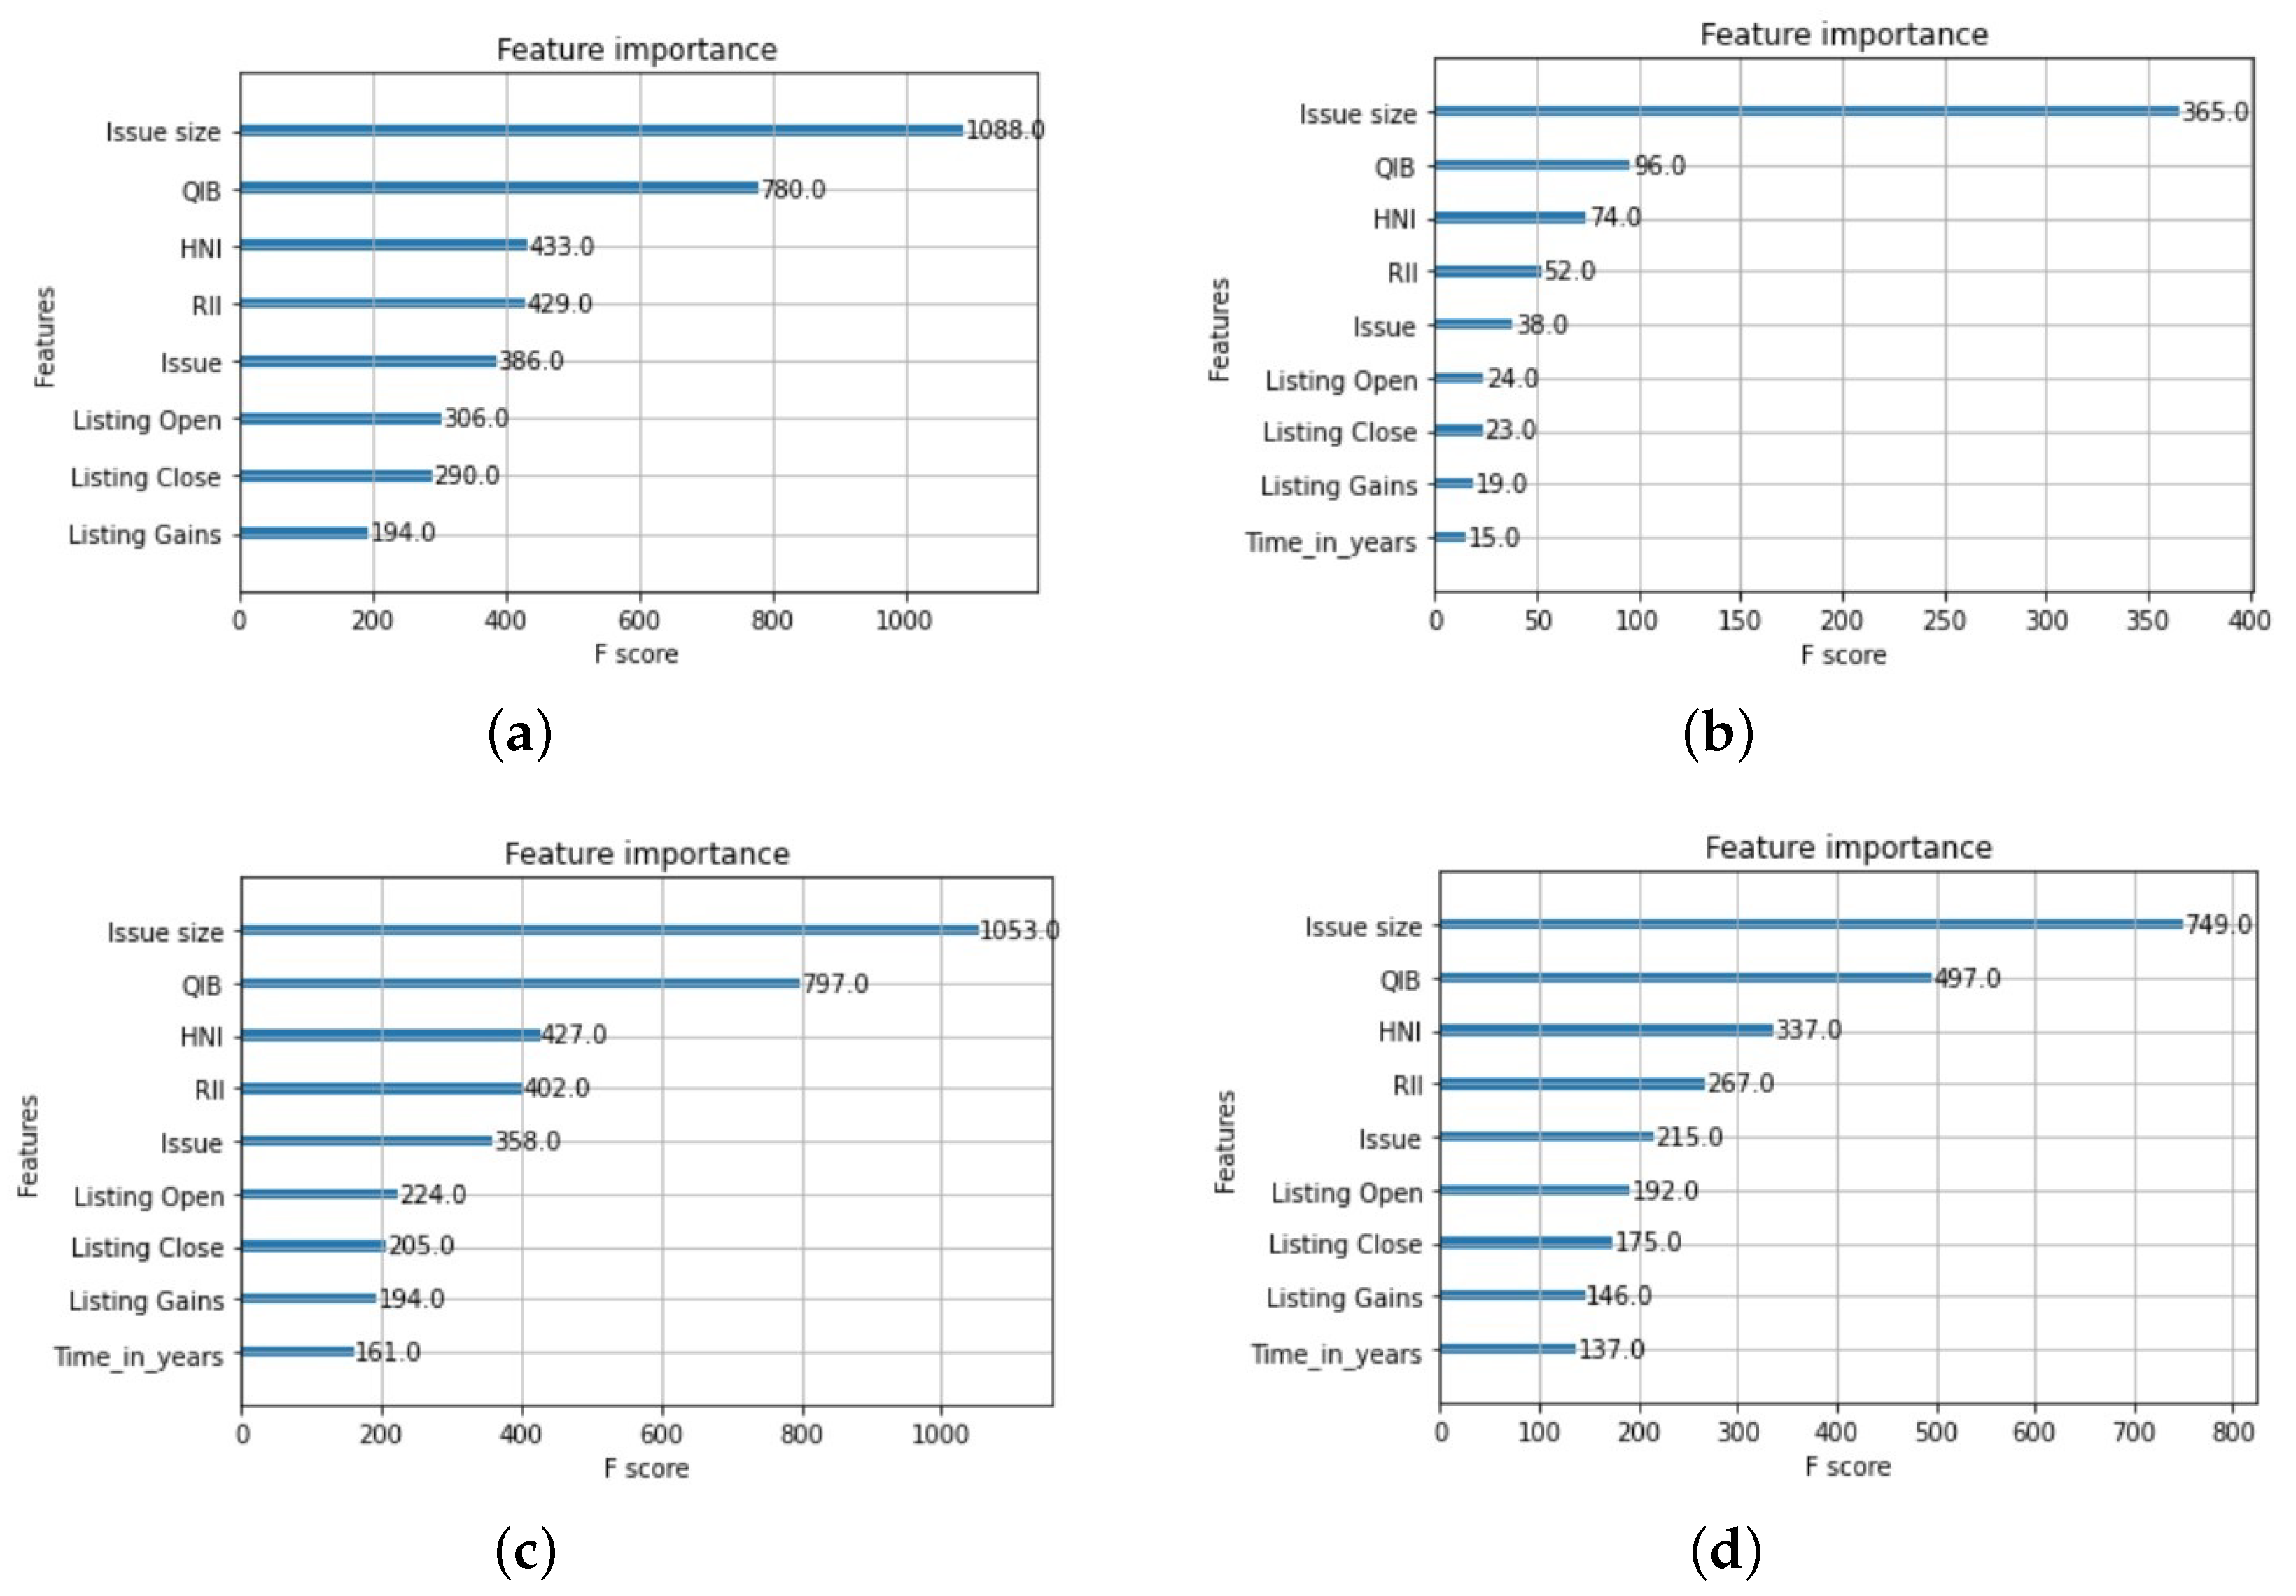
- We adopted AI-based models, i.e., RF and XGBoost Regressors, to enhance the efficiency of the prediction models for IPO performance in the stock market. A comparative study between the two algorithms in terms of their predictions and the feature importance curves was conducted.
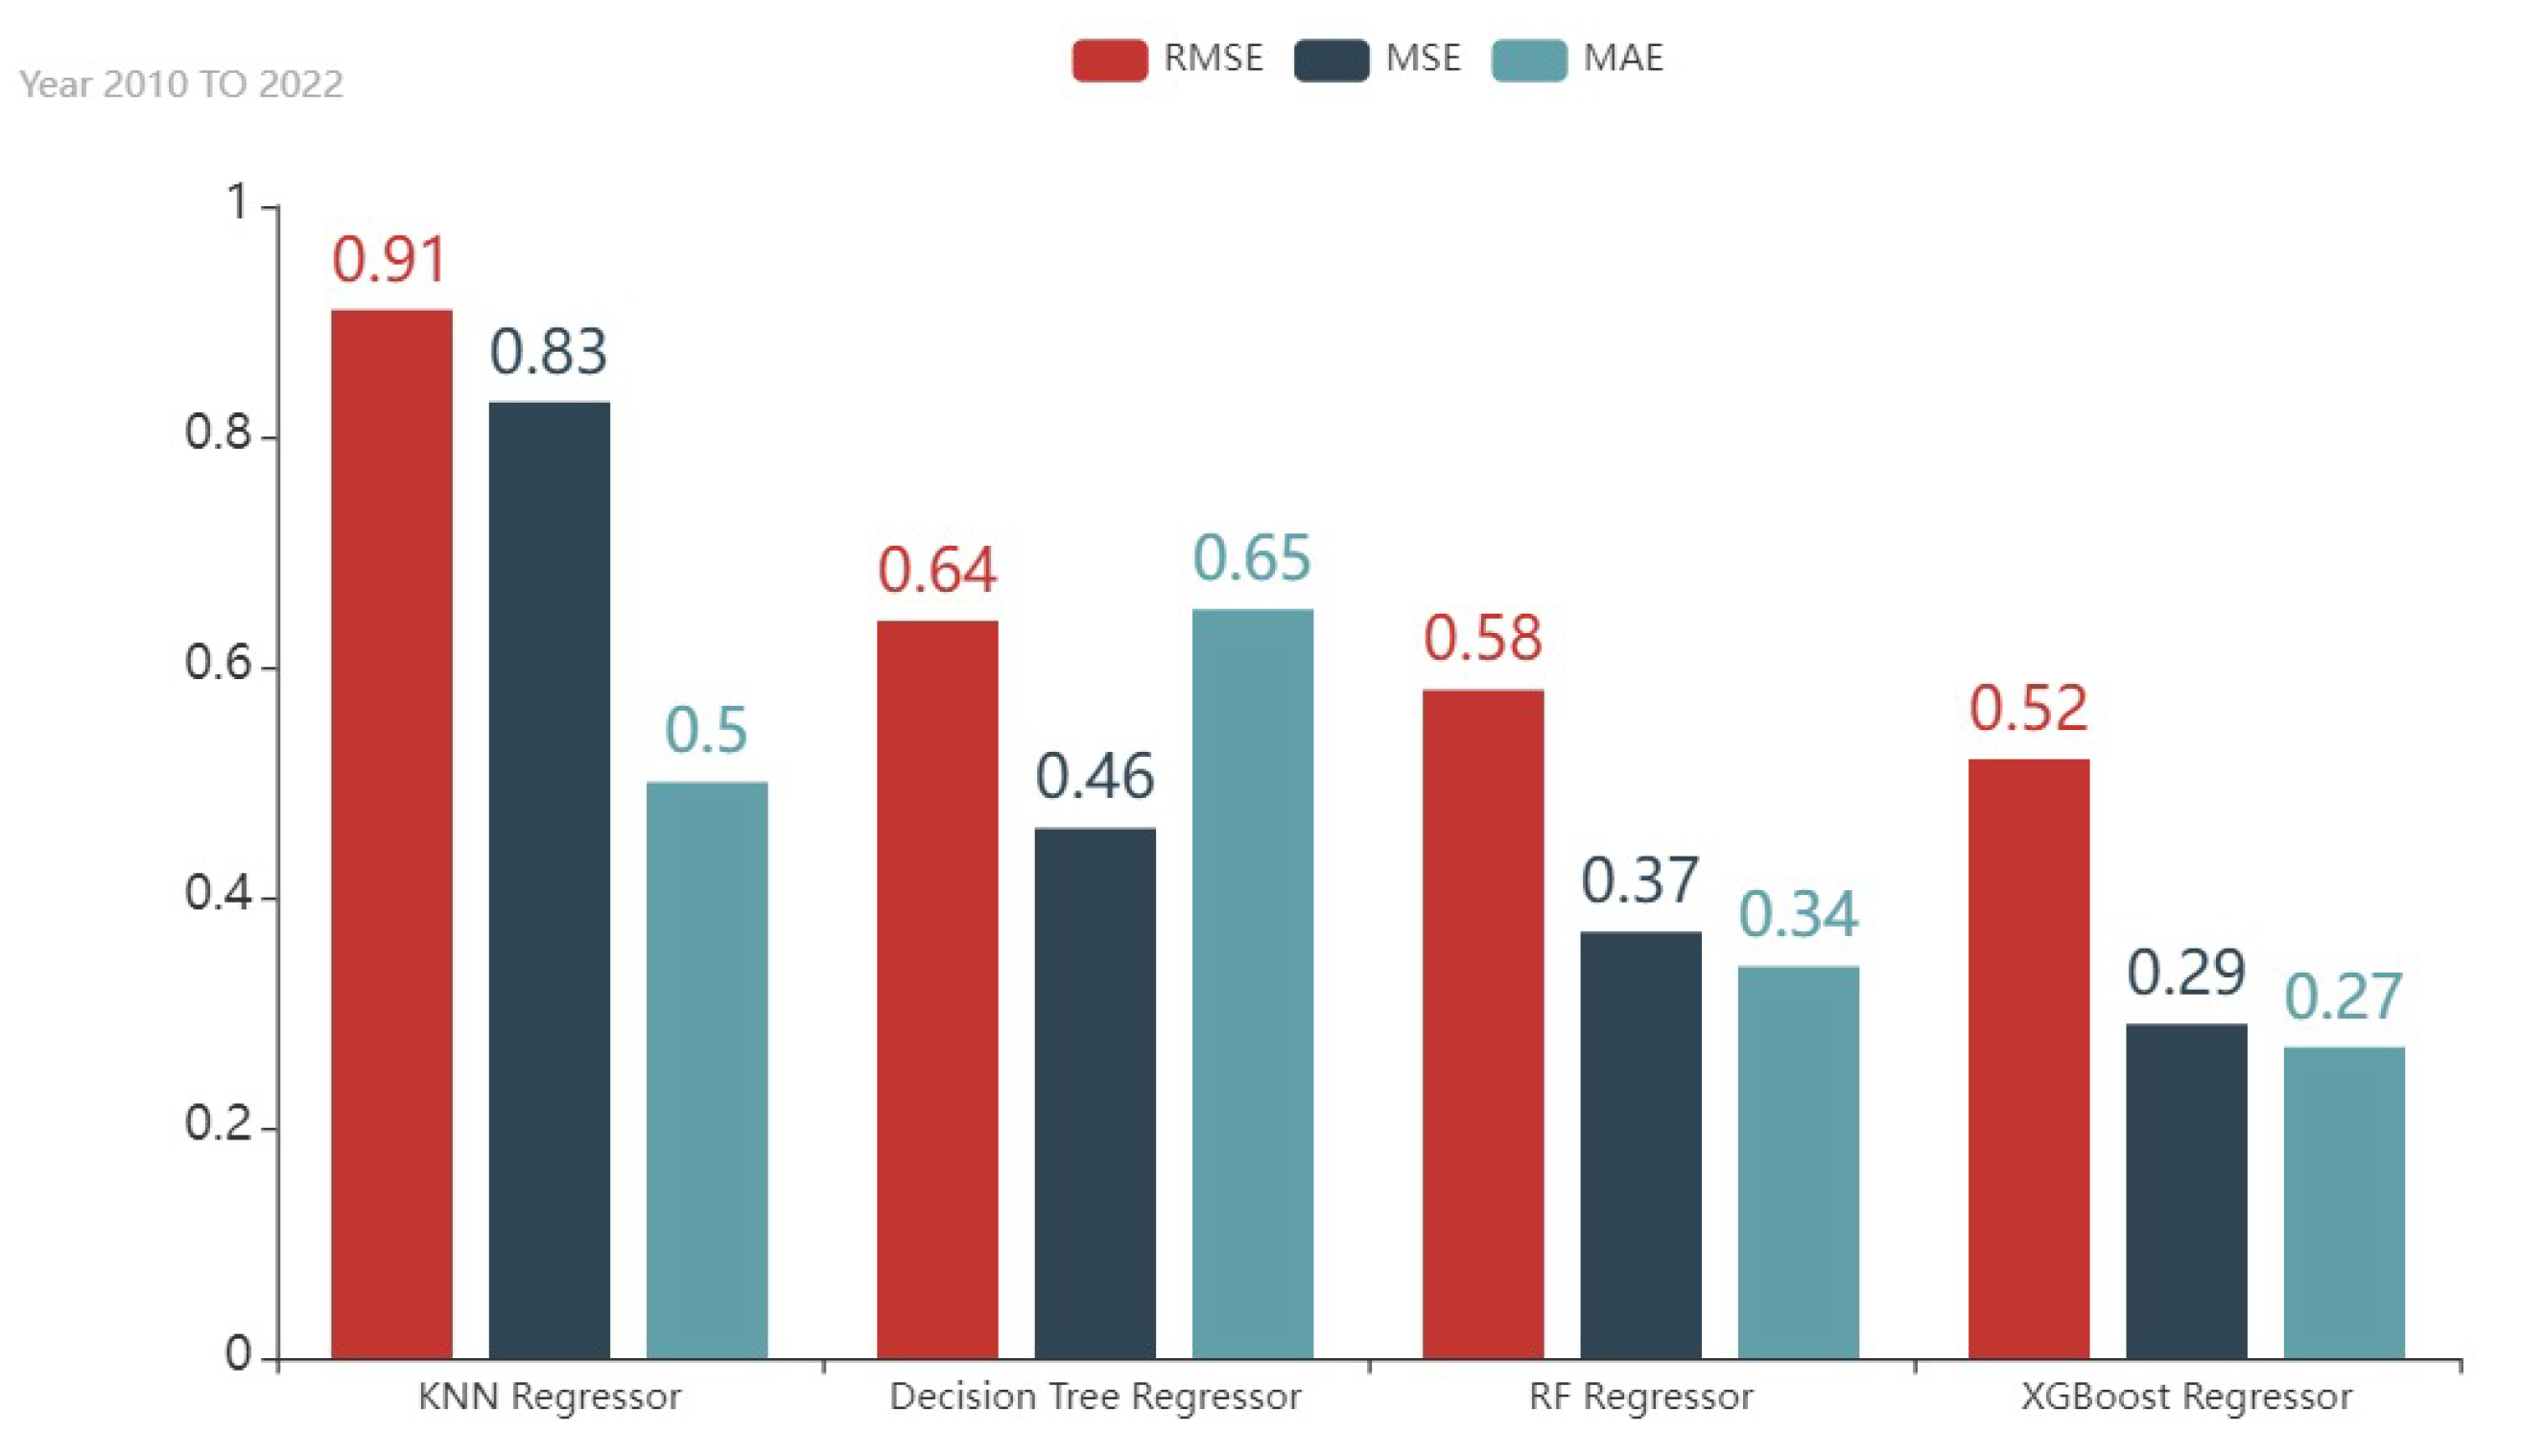
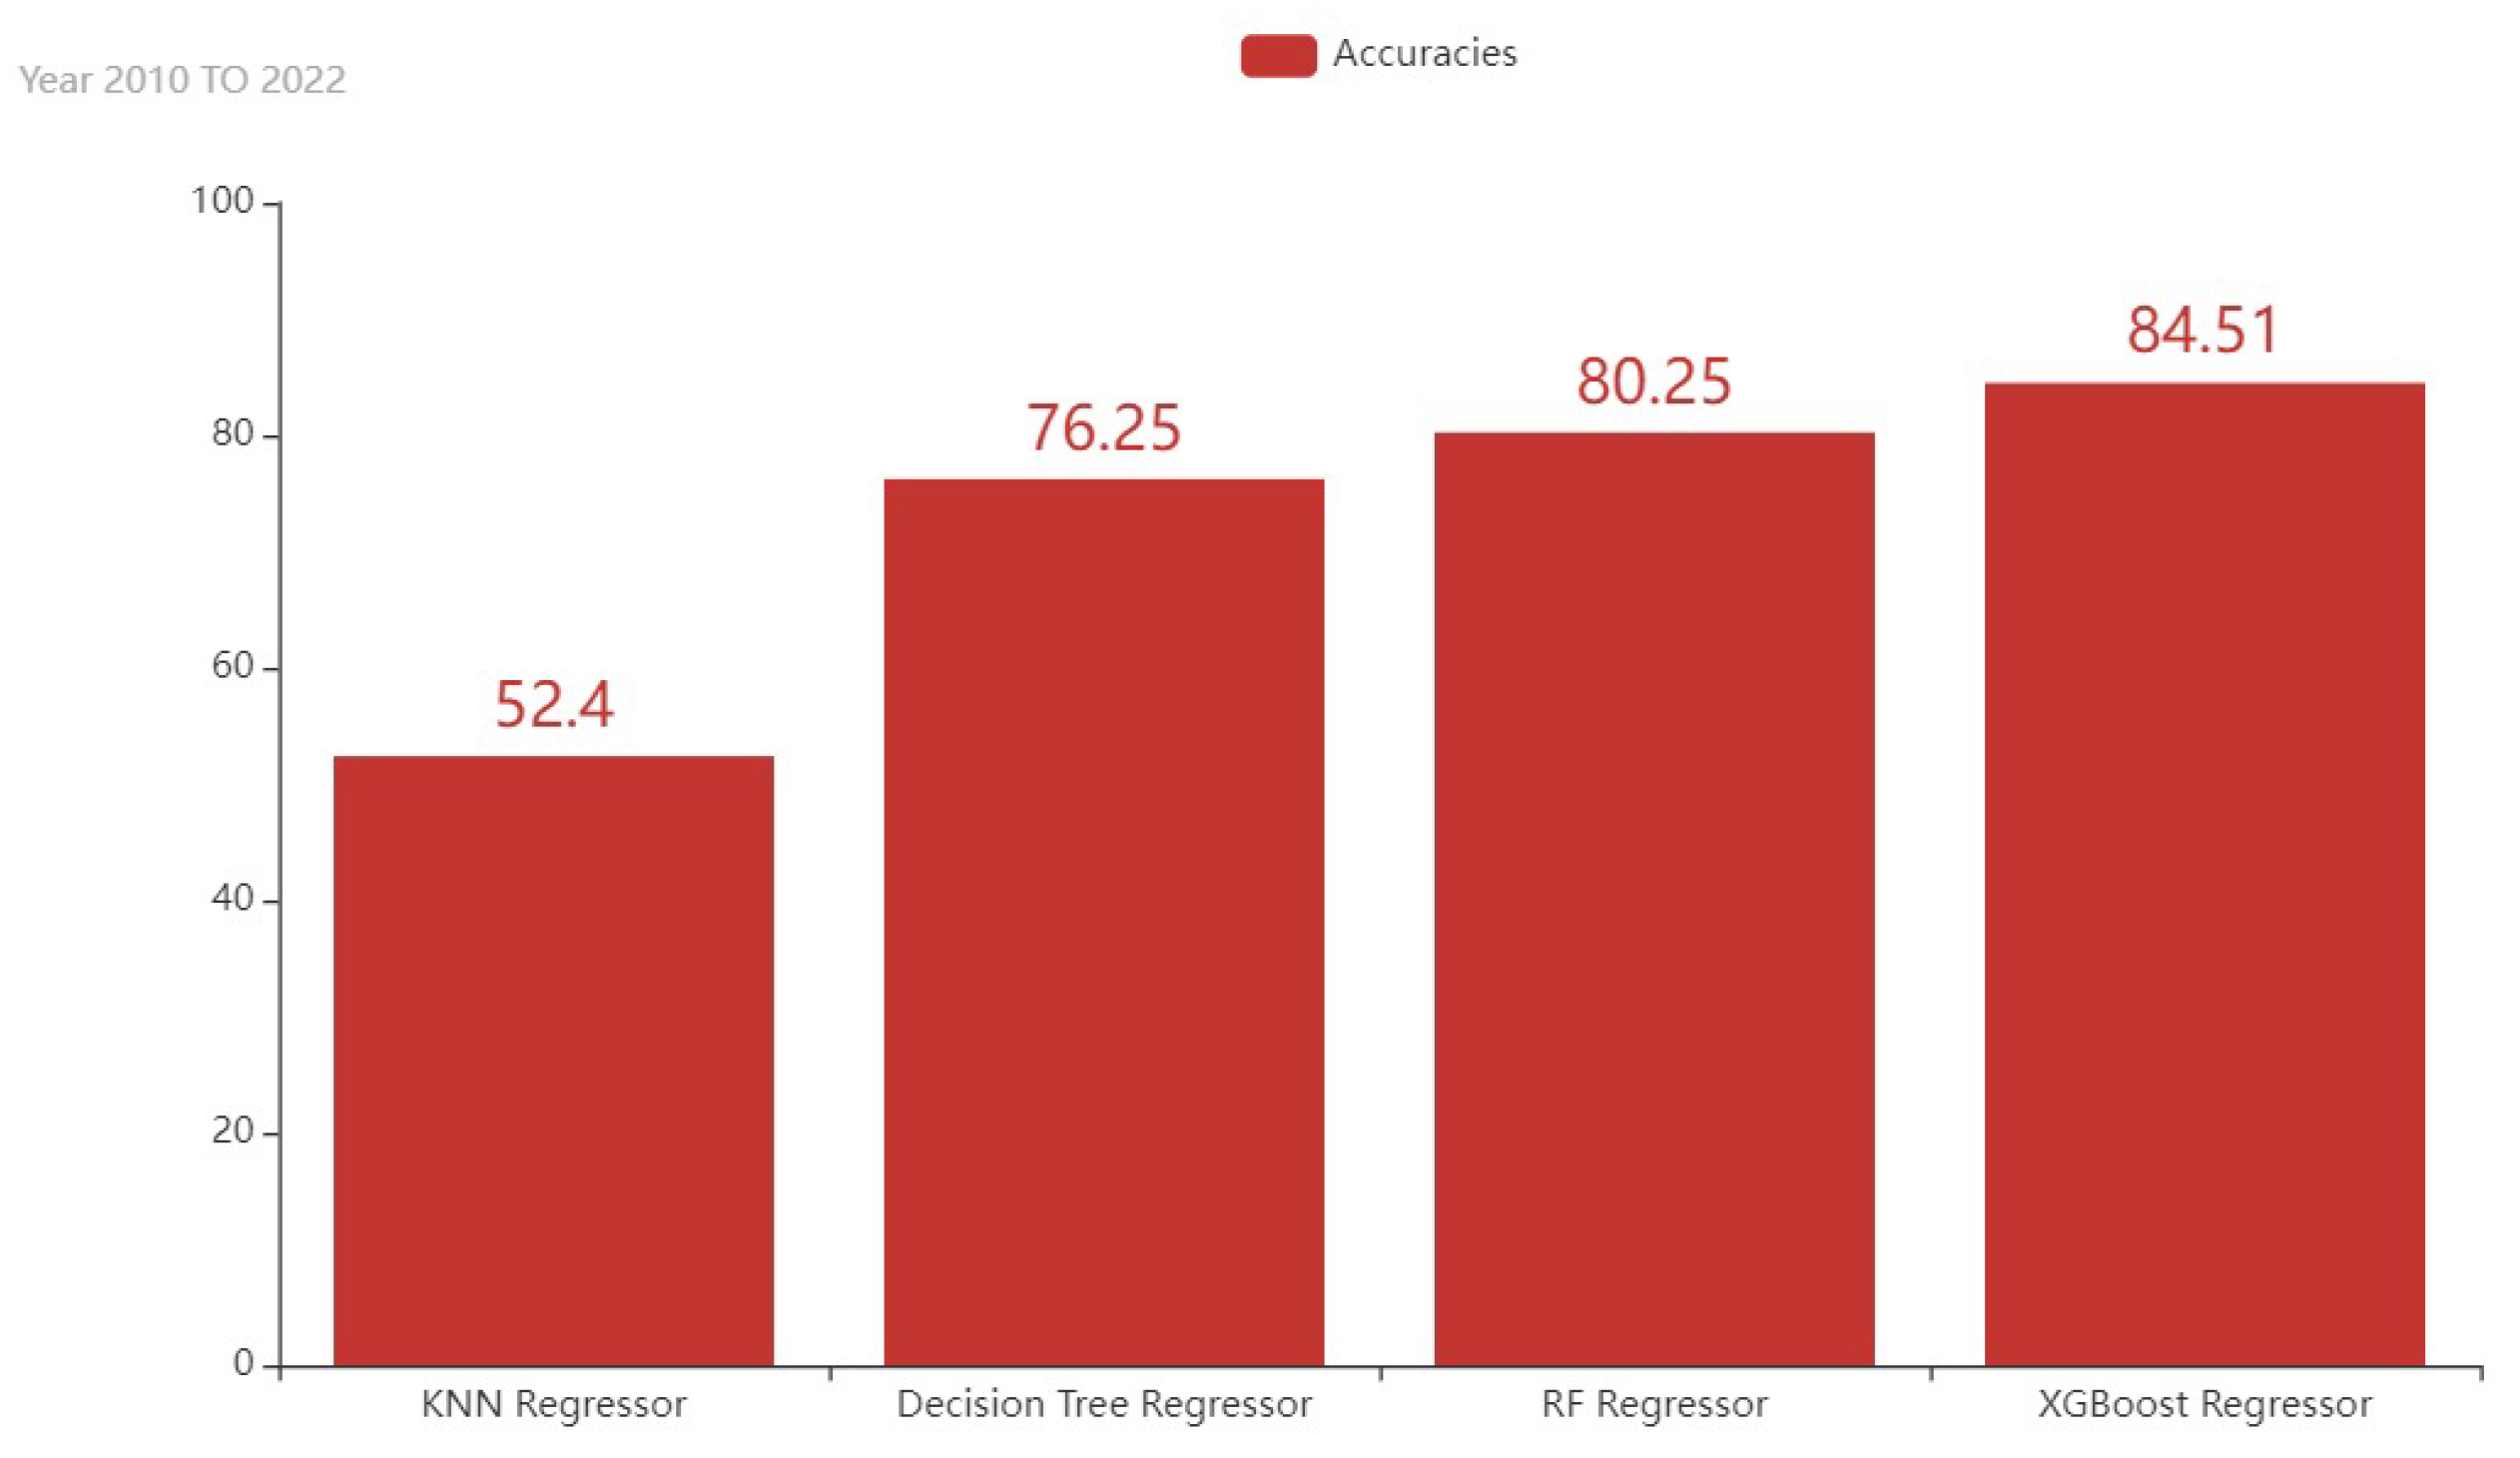
- Evaluation parameters such as the MSE, MAE, RMSE, and accuracy were used to evaluate the performance of the models and compare the predictions to the actual values given in the IPO dataset.
1.3. Novelty
1.4. Organization
2. Problem Formulation and System Model
2.1. System Model
2.2. Problem Formulation
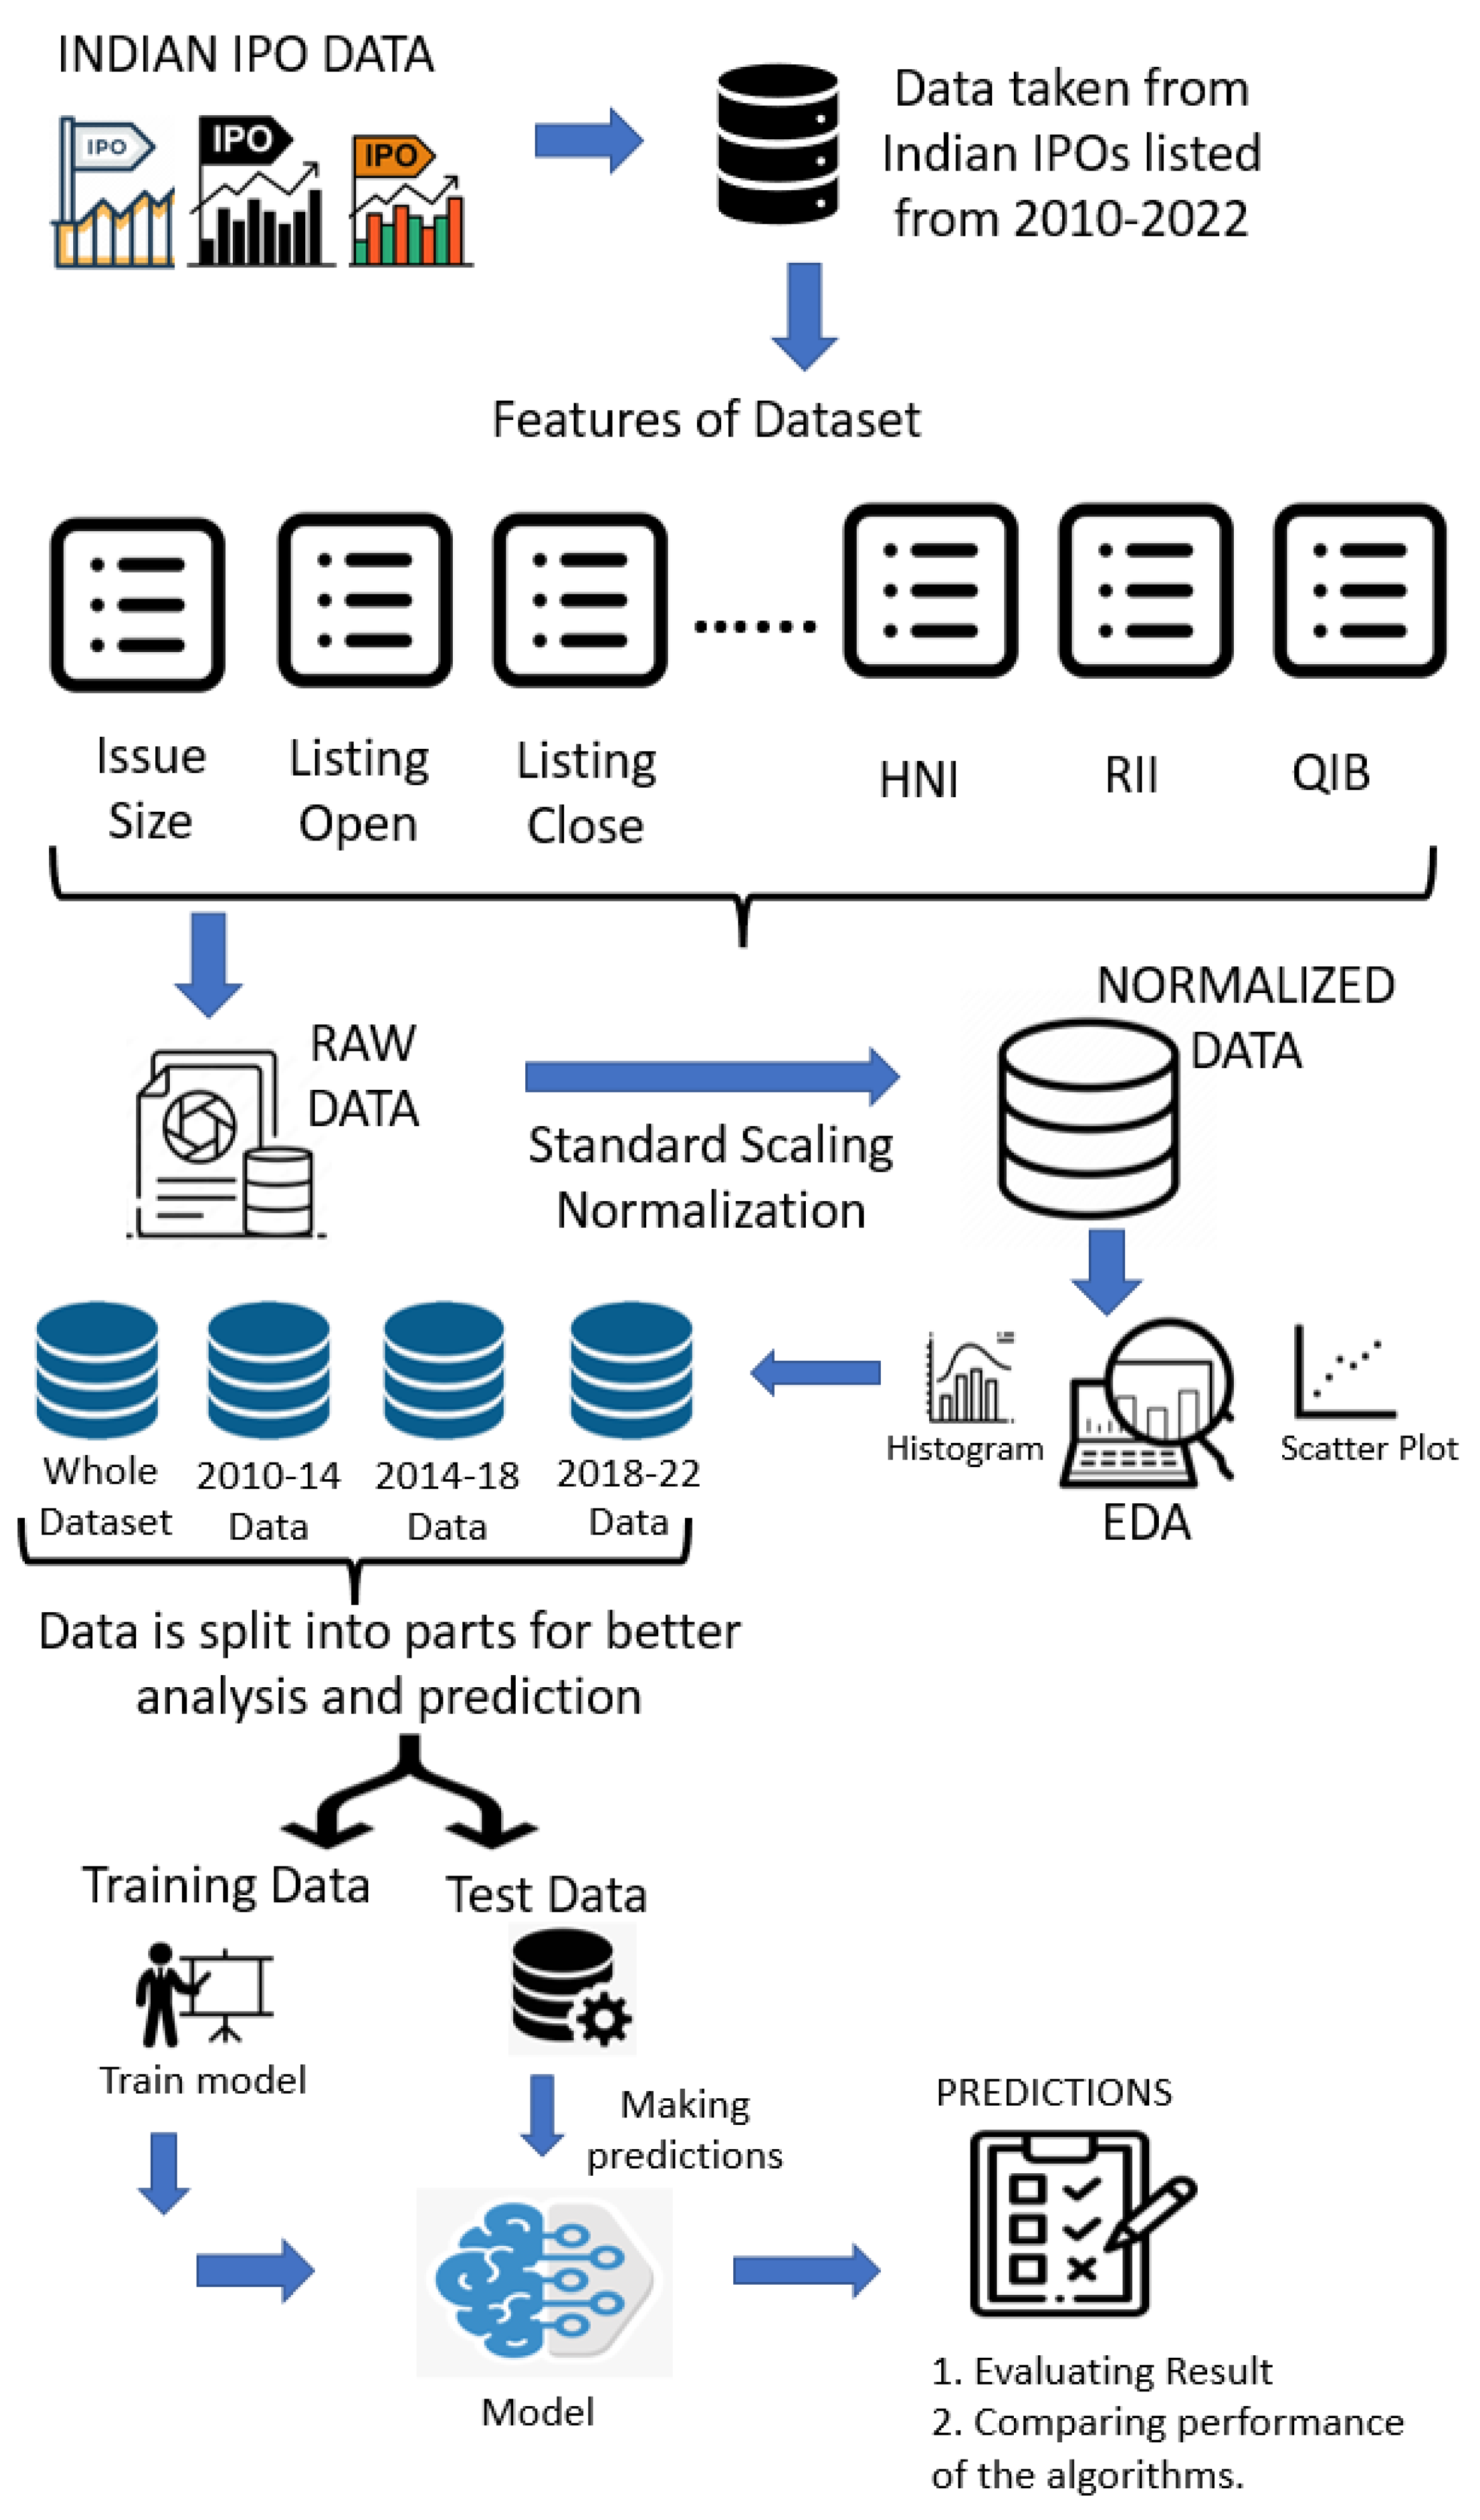
3. Proposed Architecture
3.1. Dataset Description
- Date: Date on which the IPO was listed in the market.
- IPO name: Name of the IPO.
- Issue size: Total number of shares issued by the company listing the IPO.
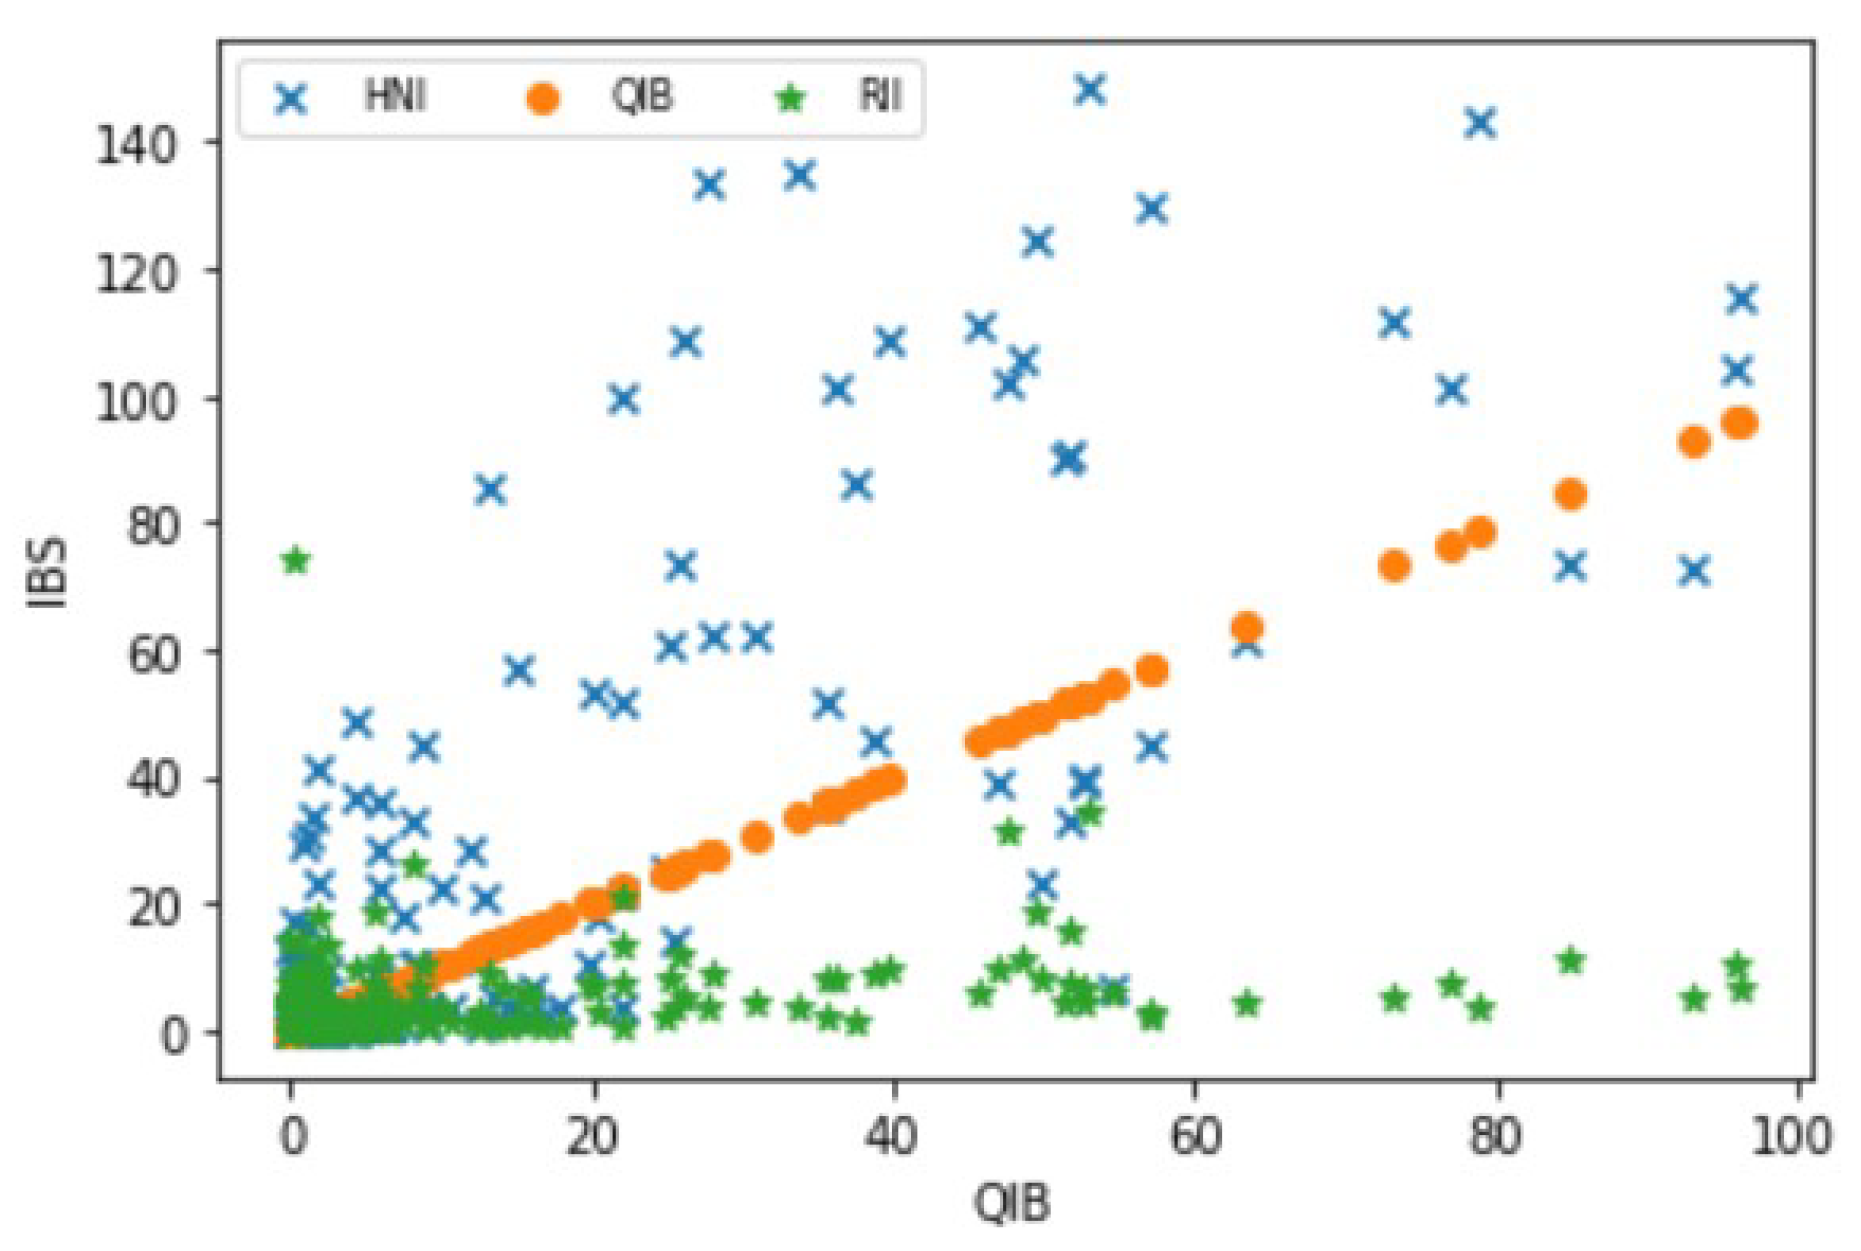
- QIB: The institutional investors known to have the means and expertise to evaluate the market and invest. These include banks, insurance companies, financial institutions, etc.
- HNI: The category of investors who invest in shares worth more than 2 lakh rupees in an IPO.
- RII: The category of investors who invest in shares worth less than 2 lakh rupees in an IPO.
- Issue price: The price at which the shares are sold by the company.
- Listing open: The opening price listed on the stock exchange as the market opens on the listing day.
- Listing close: The closing price listed on the stock exchange after the market closes on the listing day.
- Listing gains: The profit or loss percentage incurred by the difference in issue price and listing open price.
- Current market price (CMP): Current price of the IPO in the market.
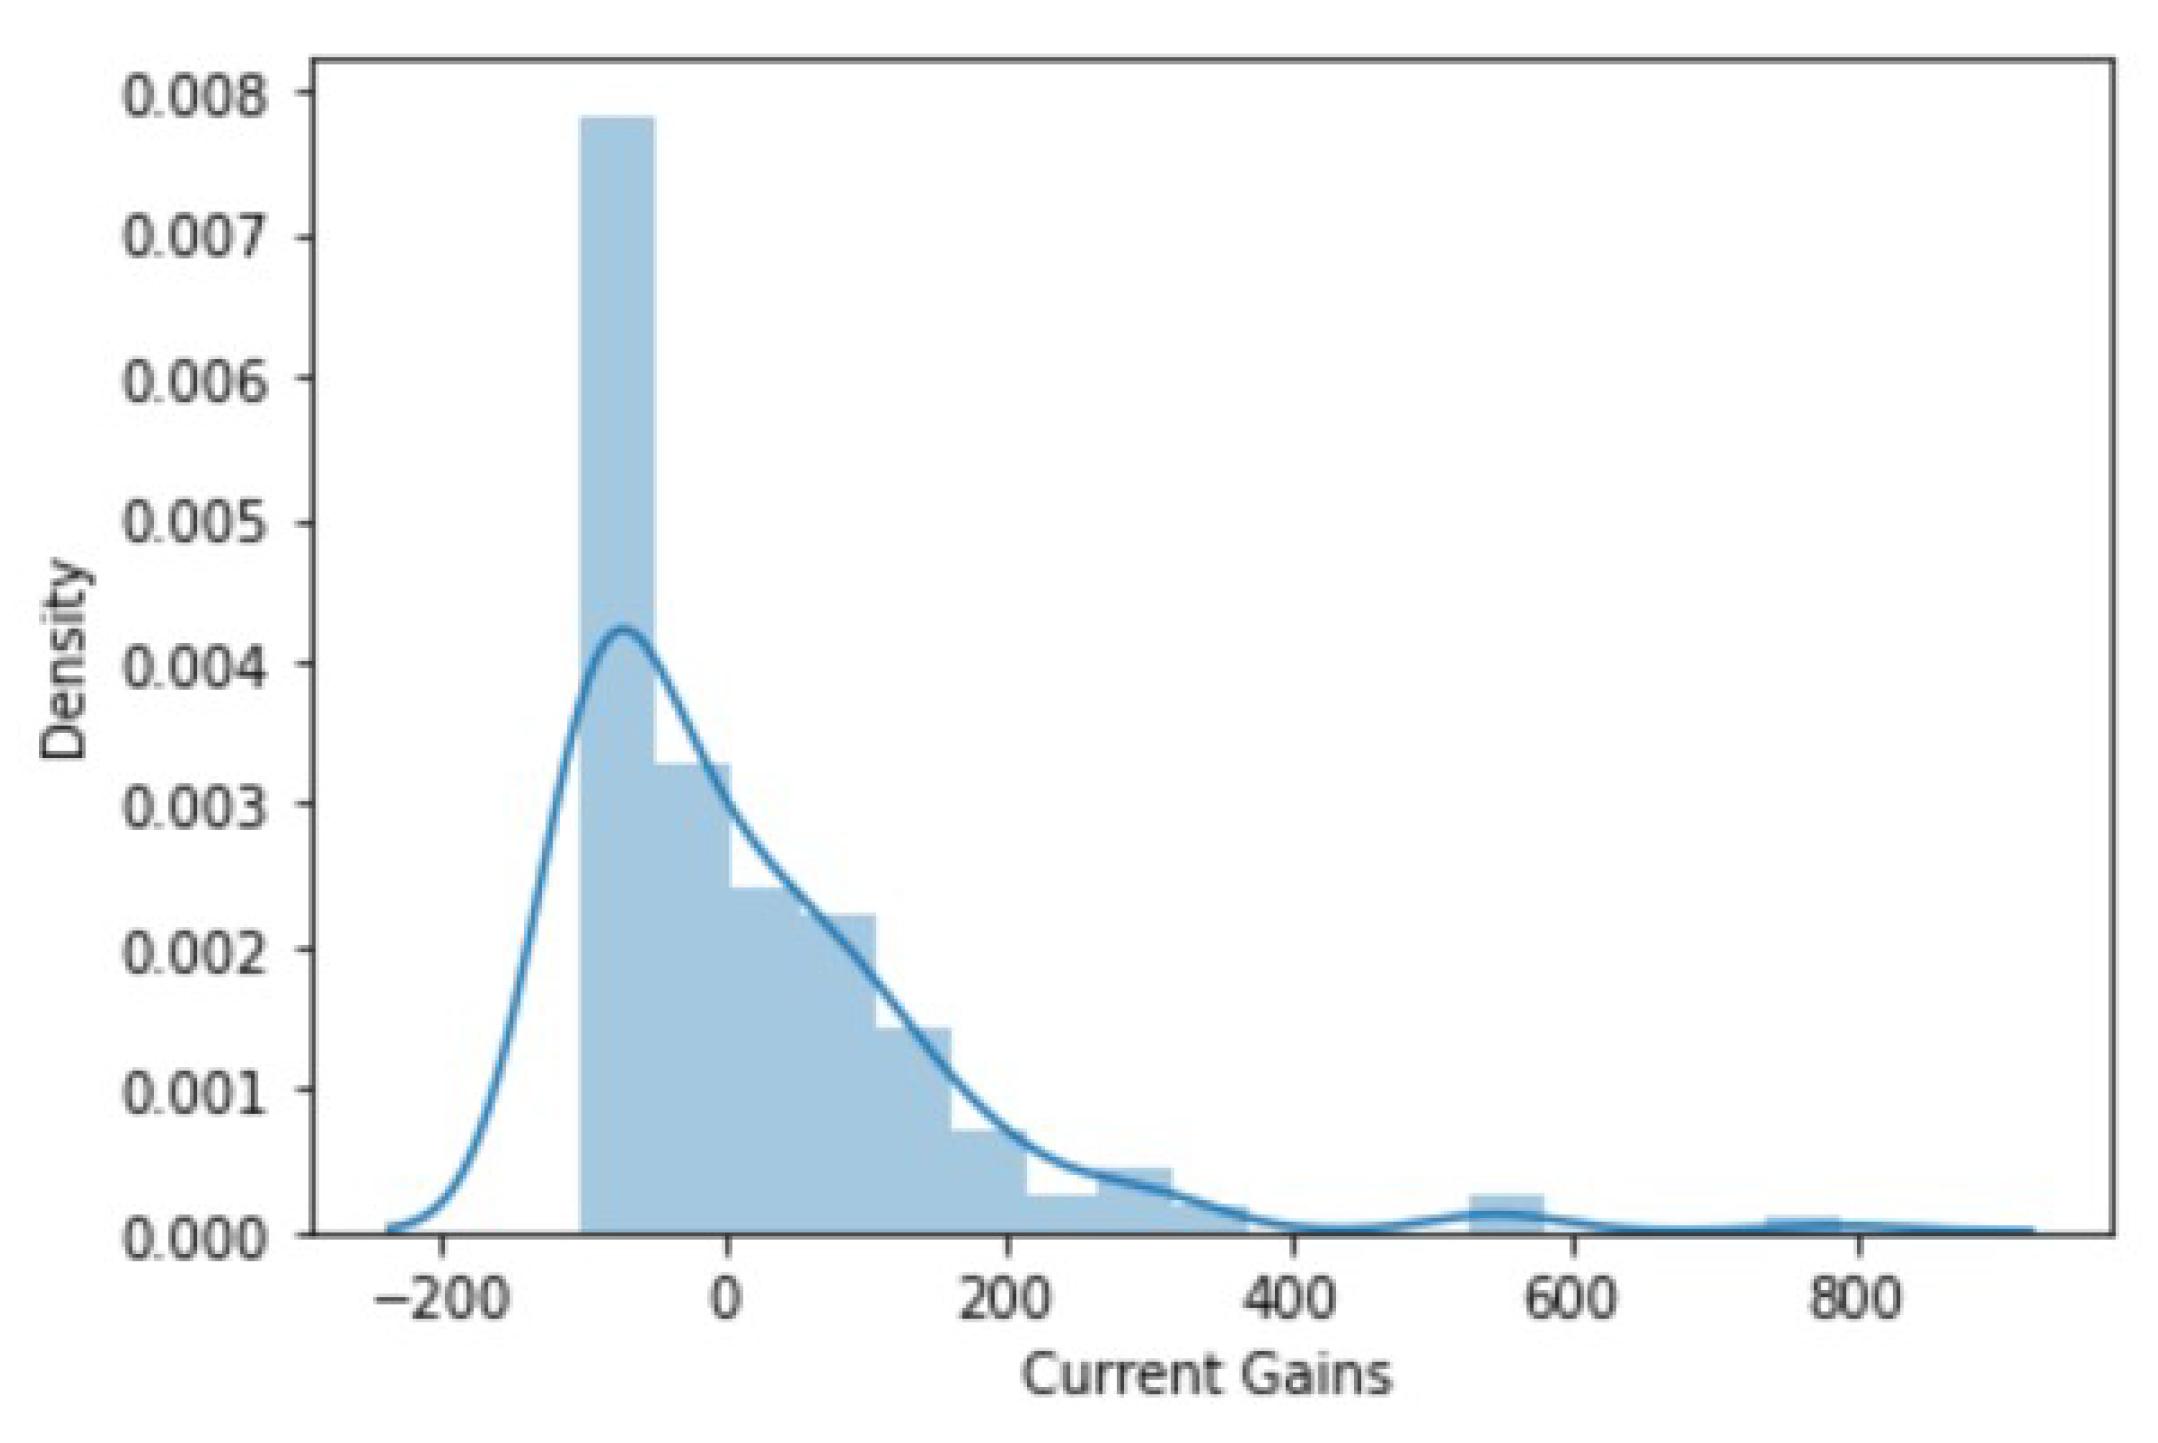
- Current gains: The gains obtained with the IPO. If they are negative, this is a loss for the investors.
3.2. Data Preprocessing
3.3. Proposed Model
4. Result Analysis
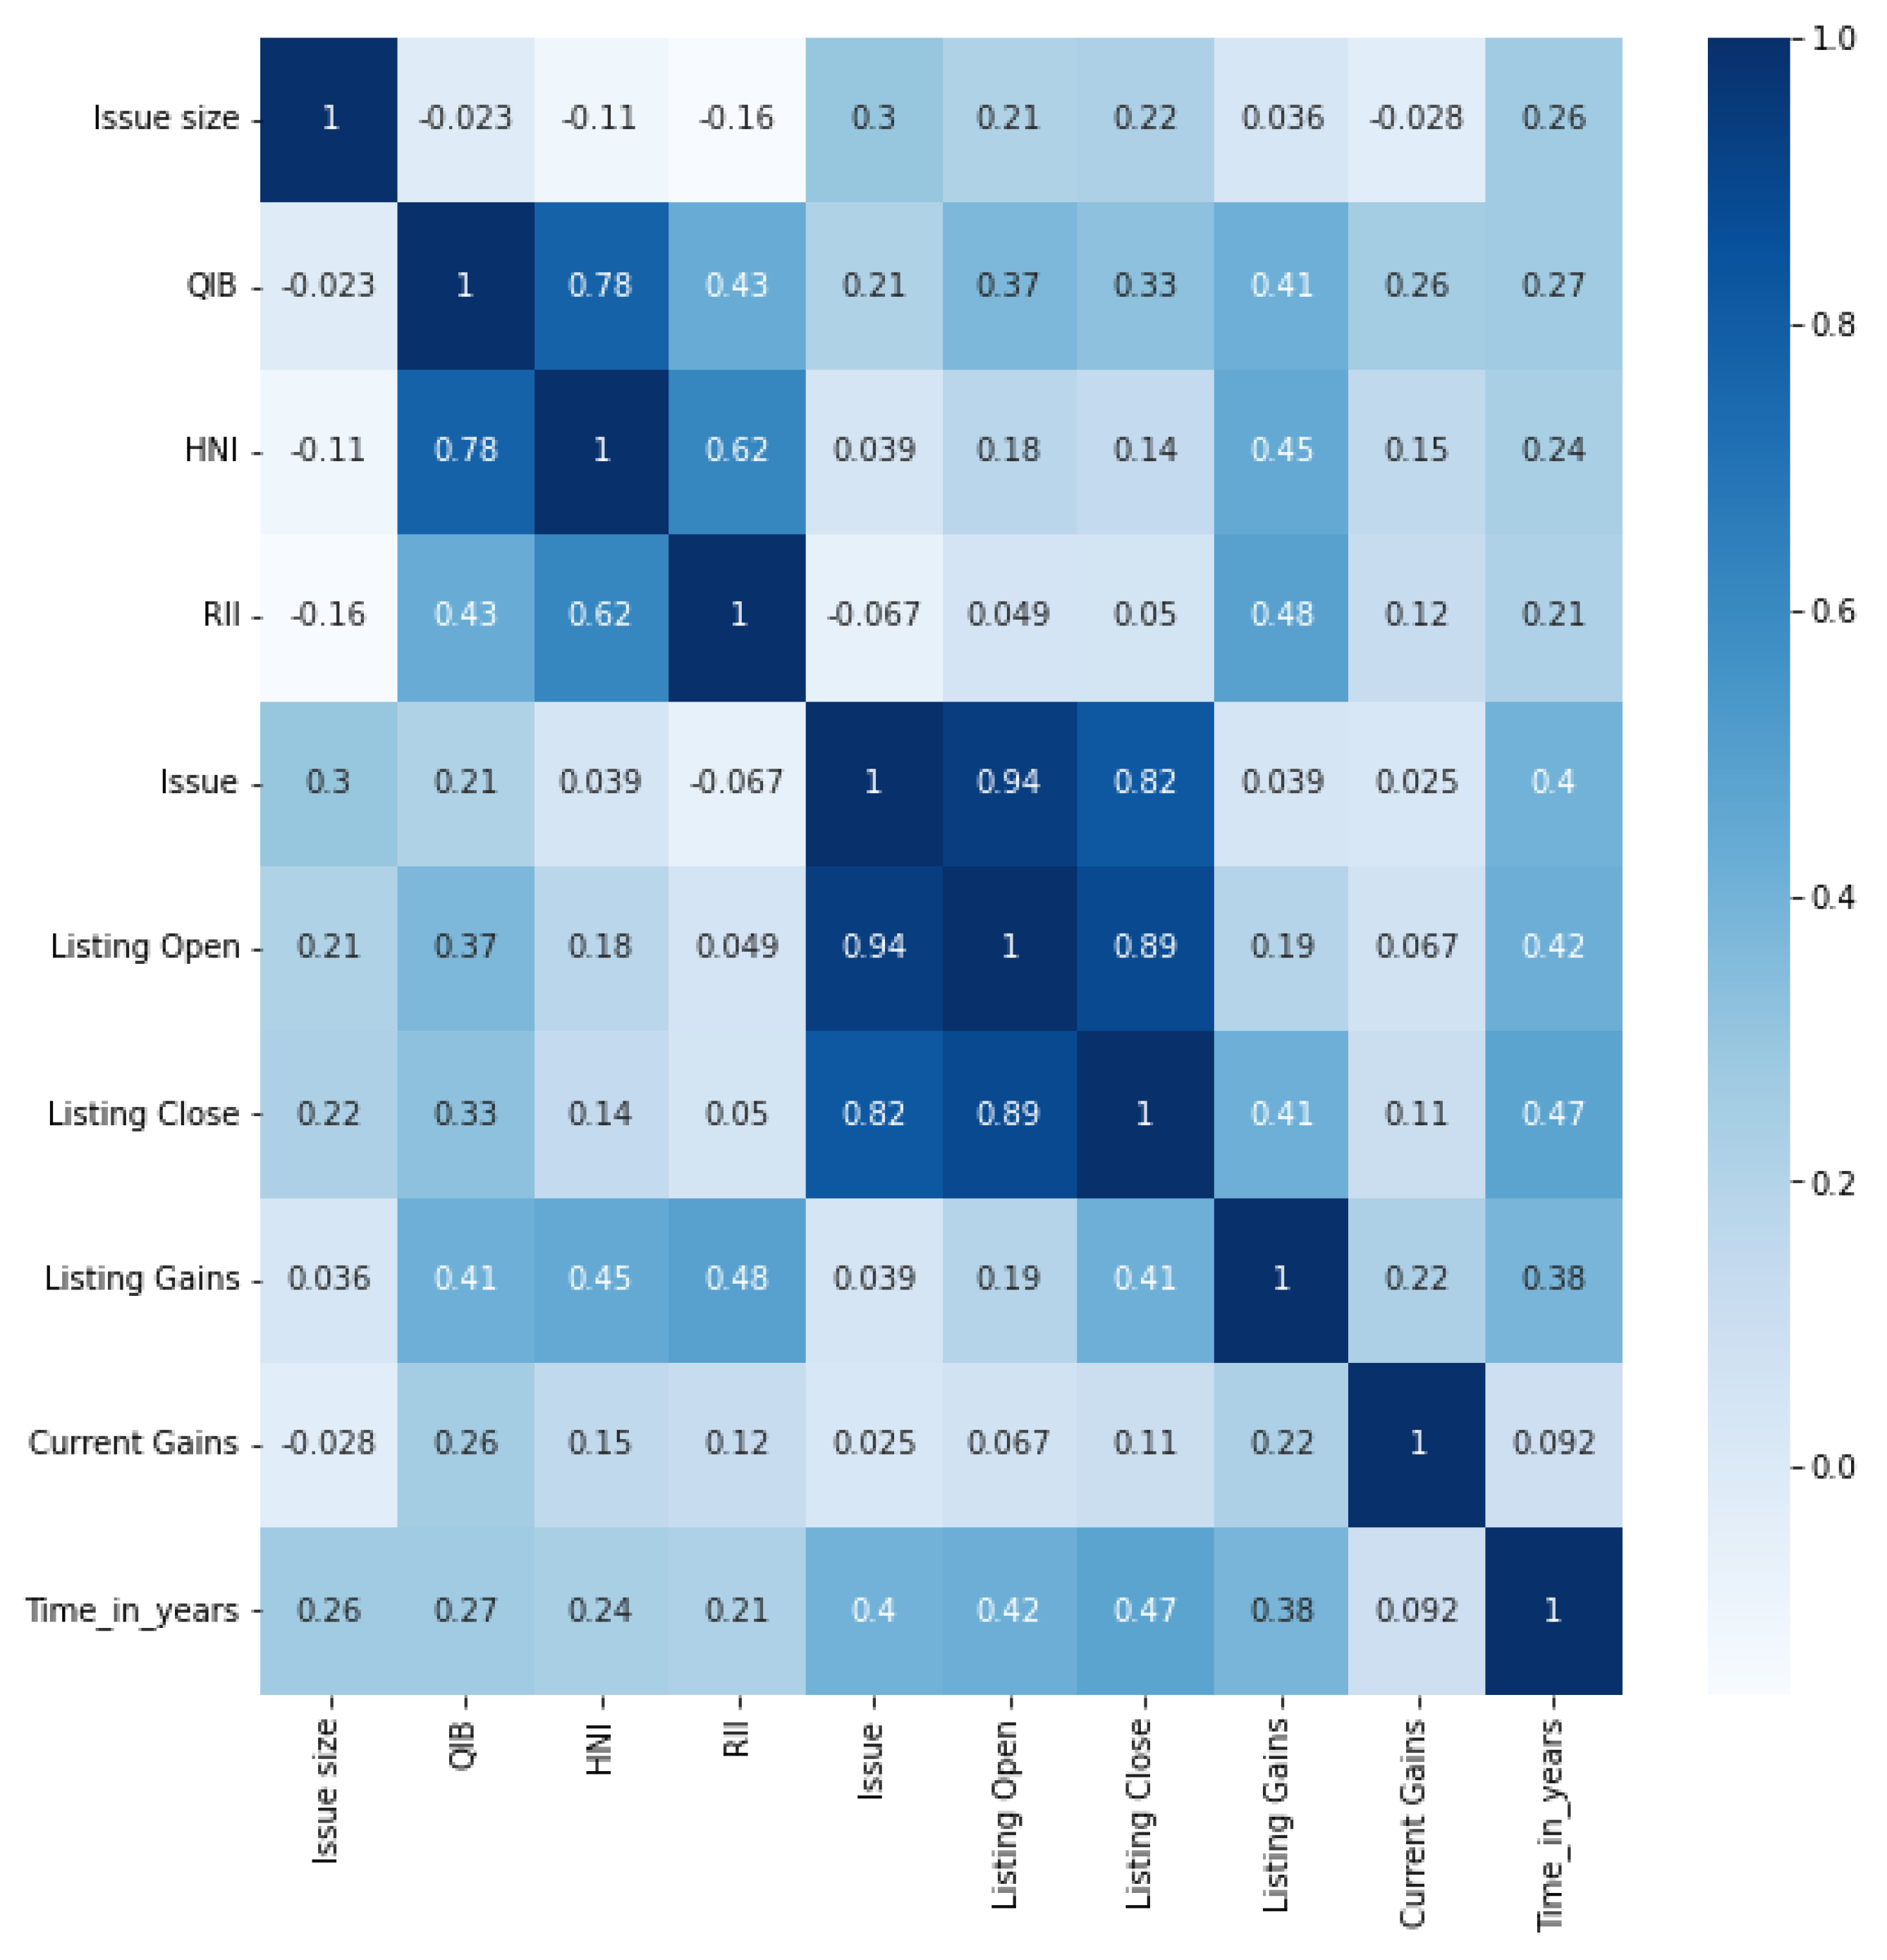
4.1. EDA Results
4.2. Prediction Results
4.2.1. RF and XGBoost Regressors Applied to the Dataset (2010–2022 Time Period)
4.2.2. RF and XGBoost Regressors Applied to the IPO Data from 2010 to 2014
4.2.3. RF and XGBoost Regressors Applied to the IPO Data from 2014 to 2018
4.2.4. RF and XGBoost Regressors Applied to the IPO Data from 2018 to 2022
4.3. Performance Analysis of the XGBoost Regressor
5. Conclusions and Future Plan
Author Contributions
Funding
Institutional Review Board Statement
Informed Consent Statement
Data Availability Statement
Acknowledgments
Conflicts of Interest
References
- IPO Def. Available online: https://www.investopedia.com/terms/i/ipo.asp (accessed on 28 June 2022).
- IPO Trends. Available online: https://www.ey.com/en_in/ipo/india-ipo-trends-report (accessed on 17 August 2022).
- Baba, B.; Sevil, G. Predicting IPO initial returns using random forest. Borsa Istanb. Rev. 2020, 20, 13–23. [Google Scholar] [CrossRef]
- Agrawal, R.; Sjmsom, U. Predicting IPO Underperformance Using Machine Learning. In Proceedings of the 51st Annual Conference of The Decision Sciences Institute, San Francisco, CA, USA, 21–23 November 2021; pp. 1–11. [Google Scholar]
- Vijh, M.; Chandola, D.; Tikkiwal, V.A.; Kumar, A. Stock Closing Price Prediction using Machine Learning Techniques. Procedia Comput. Sci. 2020, 167, 599–606. [Google Scholar] [CrossRef]
- Selvin, S.; Ravi, V.; Gopalakrishnan, E.; Menon, V.; Kp, S. Stock price prediction using LSTM, RNN and CNN-sliding window model. In Proceedings of the 2017 International Conference on Advances in Computing, Communications and Informatics (ICACCI), Udupi, India, 13–16 September 2017; pp. 1643–1647. [Google Scholar]
- Rout, A.; Dash, P.; Dash, R.; Bisoi, R. Forecasting Financial Time Series Using A Low Complexity Recurrent Neural Network and Evolutionary Learning Approach. J. King Saud Univ.-Comput. Inf. Sci. 2015, 29, 536–552. [Google Scholar] [CrossRef]
- Roman, J.; Jameel, A. Backpropagation and recurrent neural networks in financial analysis of multiple stock market returns. In Proceedings of the HICSS-29: 29th Hawaii International Conference on System Sciences, Wailea, HI, USA, 3–6 January 1996; Volume 2, pp. 454–460. [Google Scholar]
- Long, W.; Lu, Z.; Cui, L. Deep learning-based feature engineering for stock price movement prediction. Knowl.-Based Syst. 2019, 164, 163–173. [Google Scholar] [CrossRef]
- Kavinnilaa, J.; Hemalatha, E.; Jacob, M.S.; Dhanalakshmi, R. Stock Price Prediction Based on LSTM Deep Learning Model. In Proceedings of the 2021 International Conference on System, Computation, Automation and Networking (ICSCAN), Puducherry, India, 30–31 July 2021; pp. 1–4. [Google Scholar]
- Nguyen, T.T.; Yoon, S. A Novel Approach to Short-Term Stock Price Movement Prediction using Transfer Learning. Appl. Sci. 2019, 9, 4745. [Google Scholar] [CrossRef]
- Federated Learning. Available online: https://hdl.handle.net/10356/153212 (accessed on 17 July 2022).
- IPO Underpricing. Available online: https://www.investopedia.com/terms/u/underpricing.asp (accessed on 23 November 2020).
- Krishnamurti, C.; Kumar, P. The initial listing performance of Indian IPOs. Manag. Financ. 2002, 28, 39–51. [Google Scholar] [CrossRef]
- Luque, C.; Quintana, D.; Isasi, P. Predicting IPO Underpricing with Genetic Algorithms. Int. J. Artif. Intell. 2012, 8, 133–146. [Google Scholar]
- Data 1. Available online: https://www.kaggle.com/datasets/soumyadipghorai/all-ipo-stocks-of-moneycontrol (accessed on 18 July 2022).
- Data 2. Available online: https://www.kaggle.com/datasets/aimack/ipo-data-india2021 (accessed on 10 June 2022).
- Patel, N.P.; Parekh, R.; Thakkar, N.; Gupta, R.; Tanwar, S.; Sharma, G.; Davidson, I.E.; Sharma, R. Fusion in Cryptocurrency Price Prediction: A Decade Survey on Recent Advancements, Architecture, and Potential Future Directions. IEEE Access 2022, 10, 34511–34538. [Google Scholar] [CrossRef]


| Parameter | Description | Optimal Value |
|---|---|---|
| n_estimators | Number of decision trees | 1000 |
| learning_rate | Rate set to reduce overfitting | 0.05 |
| max_depth | Maximum depth of tree | 6 |
| num_parallel_tree | No. of trees formed in each iteration | 1 |
| Time Period | MAE | MSE | RMSE | Accuracy |
|---|---|---|---|---|
| 2010–2022 | 0.29 | 0.27 | 0.52 | 84.51% |
| 2010–2014 | 0.12 | 0.02 | 0.15 | 91.95% |
| 2014–2018 | 0.23 | 0.15 | 0.39 | 87.99% |
| 2018–2022 | 0.26 | 0.15 | 0.39 | 87.10% |
| Model | MAE | MSE | RMSE | Accuracy |
|---|---|---|---|---|
| KNN Regressor | 0.50 | 0.83 | 0.91 | 52.40% |
| Decision Tree Regressor | 0.31 | 0.41 | 0.64 | 76.25% |
| RF Regressor | 0.37 | 0.34 | 0.58 | 80.25% |
| XGBoost Regressor | 0.29 | 0.27 | 0.52 | 84.51% |
Publisher’s Note: MDPI stays neutral with regard to jurisdictional claims in published maps and institutional affiliations. |
© 2022 by the authors. Licensee MDPI, Basel, Switzerland. This article is an open access article distributed under the terms and conditions of the Creative Commons Attribution (CC BY) license (https://creativecommons.org/licenses/by/4.0/).
Share and Cite
Munshi, M.; Patel, M.; Alqahtani, F.; Tolba, A.; Gupta, R.; Jadav, N.K.; Tanwar, S.; Neagu, B.-C.; Dragomir, A. Artificial Intelligence and Exploratory-Data-Analysis-Based Initial Public Offering Gain Prediction for Public Investors. Sustainability 2022, 14, 13406. https://doi.org/10.3390/su142013406
Munshi M, Patel M, Alqahtani F, Tolba A, Gupta R, Jadav NK, Tanwar S, Neagu B-C, Dragomir A. Artificial Intelligence and Exploratory-Data-Analysis-Based Initial Public Offering Gain Prediction for Public Investors. Sustainability. 2022; 14(20):13406. https://doi.org/10.3390/su142013406
Chicago/Turabian StyleMunshi, Manushi, Manan Patel, Fayez Alqahtani, Amr Tolba, Rajesh Gupta, Nilesh Kumar Jadav, Sudeep Tanwar, Bogdan-Constantin Neagu, and Alin Dragomir. 2022. "Artificial Intelligence and Exploratory-Data-Analysis-Based Initial Public Offering Gain Prediction for Public Investors" Sustainability 14, no. 20: 13406. https://doi.org/10.3390/su142013406
APA StyleMunshi, M., Patel, M., Alqahtani, F., Tolba, A., Gupta, R., Jadav, N. K., Tanwar, S., Neagu, B.-C., & Dragomir, A. (2022). Artificial Intelligence and Exploratory-Data-Analysis-Based Initial Public Offering Gain Prediction for Public Investors. Sustainability, 14(20), 13406. https://doi.org/10.3390/su142013406