Article

Spatiotemporal Variability in Water-Use Efficiency in Tianshan Mountains (Xinjiang, China) and the Influencing Factors

1
Anhui Engineering and Technology Research Center for Smart City, Anhui Jianzhu University, Hefei 230601, China
2
School of Geography and Tourism, Shaanxi Normal University, Xi’an 710119, China
*
Author to whom correspondence should be addressed.
Sustainability 2022, 14(13), 8191; https://doi.org/10.3390/su14138191
Submission received: 6 June 2022 / Revised: 30 June 2022 / Accepted: 1 July 2022 / Published: 5 July 2022
(This article belongs to the Topic Climate Change and Environmental Sustainability)

Abstract

:
Water-use efficiency (WUE) is a crucial physiological index in carbon–water interactions and is defined as the ratio of vegetation productivity to water loss. The variation in climatic variables and drought have the most significant effects on WUE and evapotranspiration (ET). Nevertheless, how WUE varies with climate factors and drought processes in the Tianshan Mountains (TMS) is still poorly understood. In the present work, we analyzed the spatiotemporal variations in WUE, and investigated the correlations between WUE, climate factors, and drought, in the study area. The results showed that, in the TMS during 2000–2020, annual net primary productivity (NPP) ranged from 147.9 to 189.4 gC·m−2, annual ET was in the range of 212.5–285.8 mm, and annual WUE ranged from 0.66 to 0.78 gC·kg−1·H2O. Both NPP and ET exhibited an increasing trend with some fluctuation, whereas WUE showed the opposite tendency during the study period. The obtained results demonstrated that the decrease in WUE was primarily because of the increase in ET. There were obvious differences in WUE, under different land-use types, caused by NPP and ET. However, the interannual variation in WUE showed small fluctuations and the dynamic process of WUE in each land-use type showed good consistency. Temperature and wind speed had a positive influence on WUE in the middle and eastern regions of the TMS. Precipitation also played a mainly positive role in enhancing WUE, especially on the northern slope of the TMS. There was strong spatial heterogeneity of the correlation coefficient (0.68, p < 0.05) between WUE and the temperature vegetation drought index (TVDI). Moreover, the slopes of WUE and TVDI showed good consistency in terms of spatial distribution, suggesting that drought had a significant impact on ecosystem WUE. This work will enhance the understanding of WUE variation, and provide scientific evidence for water resource management and sustainable utilization in the study area.

1. Introduction

Water-use efficiency (WUE), the ratio of carbon assimilation during photosynthesis to water loss through transpiration, is a significant ecological index that connects physiological processes controlling carbon with water cycling in terrestrial ecosystems [1,2]. Dryland ecosystems account for more than 40% of the global land surface, and these areas are important in the global carbon cycle because of the inherent variability in the water status [3]. Thus, analyzing the patterns, magnitude, and influencing factors of WUE for natural ecosystems, and the management of WUE in arid regions, is extremely significant for estimating carbon and water balances, and thus supports the sustainable management of water resources in arid regions and fragile ecological environments.
At the ecosystem scale, three definitions of WUE are extensively used, namely: (1) Gross Primary Production (GPP)-based WUE: GPP/ET; (2) Net Primary Productivity (NPP)-based WUE: NPP/ET; and (3) Net Ecosystem Production (NEP)-based WUE: NEP/ET [4,5,6,7]. ET is the key step in the process of the hydrological cycle and is the main component of the energy–water balance in agriculture ecosystems. It is also widely regarded as the quantity of water consumed by vegetation to provide ecosystem services [8]. NPP is a crucial indicator for evaluating ecological health, and is also important for estimating the carbon sink and ecological change. NPP is defined as the new carbon stored in living plants per unit time (annually) per unit surface area. Compared with GPP and NEP, the NPP index deducts organic carbon consumed by plant respiration, and can objectively reflect the net cumulative organic carbon. Therefore, it is of great significance to investigate the spatiotemporal variation in ET and NPP. Several models and studies have been proposed to calculate NPP at different scales (global, regional, or local), which can be classified into climate-related models, process-based models, and light-use efficiency models [9]. Climate-related and process-based models have been extensively applied in previous research. Nevertheless, process-based models (e.g., the LPJ-GUESS model) are not inappropriate for calculating NPP in areas disturbed by frequent and significant human activity [10]. By comparison, climate-related models (e.g., the Miami model) can be used to evaluate the potential vegetation productivity [11]. In contrast, the theoretical model of the Carnegie-Ames-Stanford Approach (CASA) was developed based on light-use efficiency, and includes temperature, precipitation, solar radiation, the Normalized Difference Vegetation Index (NDVI), and land cover as input variables [12,13]. The CASA model has been well demonstrated in some areas and can accurately calculate NPP [11,14,15]. More importantly, it has been proven that the CASA model is suitable for estimating activity in Xinjiang, China [14,15].
Traditional studies of WUE have mainly focused on crop leaves or individual levels, and have used gas exchange methods and field monitoring to estimate WUE [16]. In recent decades, due to the development of observation facilities and theoretical models, the investigation scale of WUE has been extended to ecosystems, including those at the local scale [17], regional scale [18], and global scale [19,20]. Because the influencing factors of WUE change with the research scale and vegetation type, significant variability exists in the characteristics of the spatiotemporal variation in WUE. For example, the average WUE in China’s ecosystem during 1979–2012 obtained by a process-based model was negatively correlated with the averages of annual precipitation and annual temperature [21]. Recently, Liu et al. [20] reported that variations in terrestrial ecosystem WUE at the global scale are mainly related to soil moisture. According to reports published by the government’s climate change committee, the global average surface temperature will rise by 1.8–3.7 °C and global precipitation will change greatly by the end of the 21st century; these variations will influence carbon and water balancing processes in the ecosystem [22].
In addition to the drivers mentioned above, drought is a typical hydrometeorological phenomenon and the main environmental factor that affects the functioning of the ecosystem [23]. Drought events are becoming more frequent and more severe in the context of climate change [24], and these changes have been considered to be a dominant factor responsible for increasing plant mortality [25] and ecosystem degradation [26,27]. However, the consequences of droughts on ecosystem WUE differ depending on whether they occur in dry or wet zones, the drought severity, and the vegetation type. Although it has been reported that drought can decrease ecosystem WUE [28], other studies reported increases in WUE due to drought [29]. For instance, at the global scale, WUE showed a negative relationship with drought in arid areas, but showed both positive and negative responses in humid areas [30]. Another study reported that the trend of increasing drought resulted in a decrease in WUE in Central Asia during 2000–2014 [31]. It can be concluded that the response of WUE to drought is obviously different in different climate zones. Desert, oasis, and alpine ecosystems are widely distributed in the arid and semi-arid regions in the western part of China [3]. These areas are of vital importance to agriculture management and ecological protection. The Tianshan Mountains (TMS), located in the hinterland of Eurasia, are the main water source in the middle section of the Silk Road Economic Belt. The water circulations of the TMS are characterized by significant spatiotemporal variations, complex water-generation mechanisms, multiple runoff compositions, and fragile water systems. Ecosystem WUE is very sensitive to small changes in hydrological elements caused by climate change and human activity.
Therefore, MODIS products were applied to investigate the spatiotemporal variations in the relationship between meteorological factors and the temperature vegetation dryness index (TVDI), and the changes in WUE under different vegetation cover types, in the terrestrial ecosystems of the TMS during 2000–2020. The specific objectives of the present work were to: (1) investigate the temporal and spatial variations in annual NPP, ET, WUE and drought in the TMS in the past two decades and the trends in the annual values; (2) clarify the spatial distribution characteristic in WUE under different land-use types; (3) and investigate the relationship between WUE and meteorological factors (temperature, precipitation, sunshine duration), drought, NDVI, NPP, ET, and WUE during the past two decades.

2. Materials and Methods
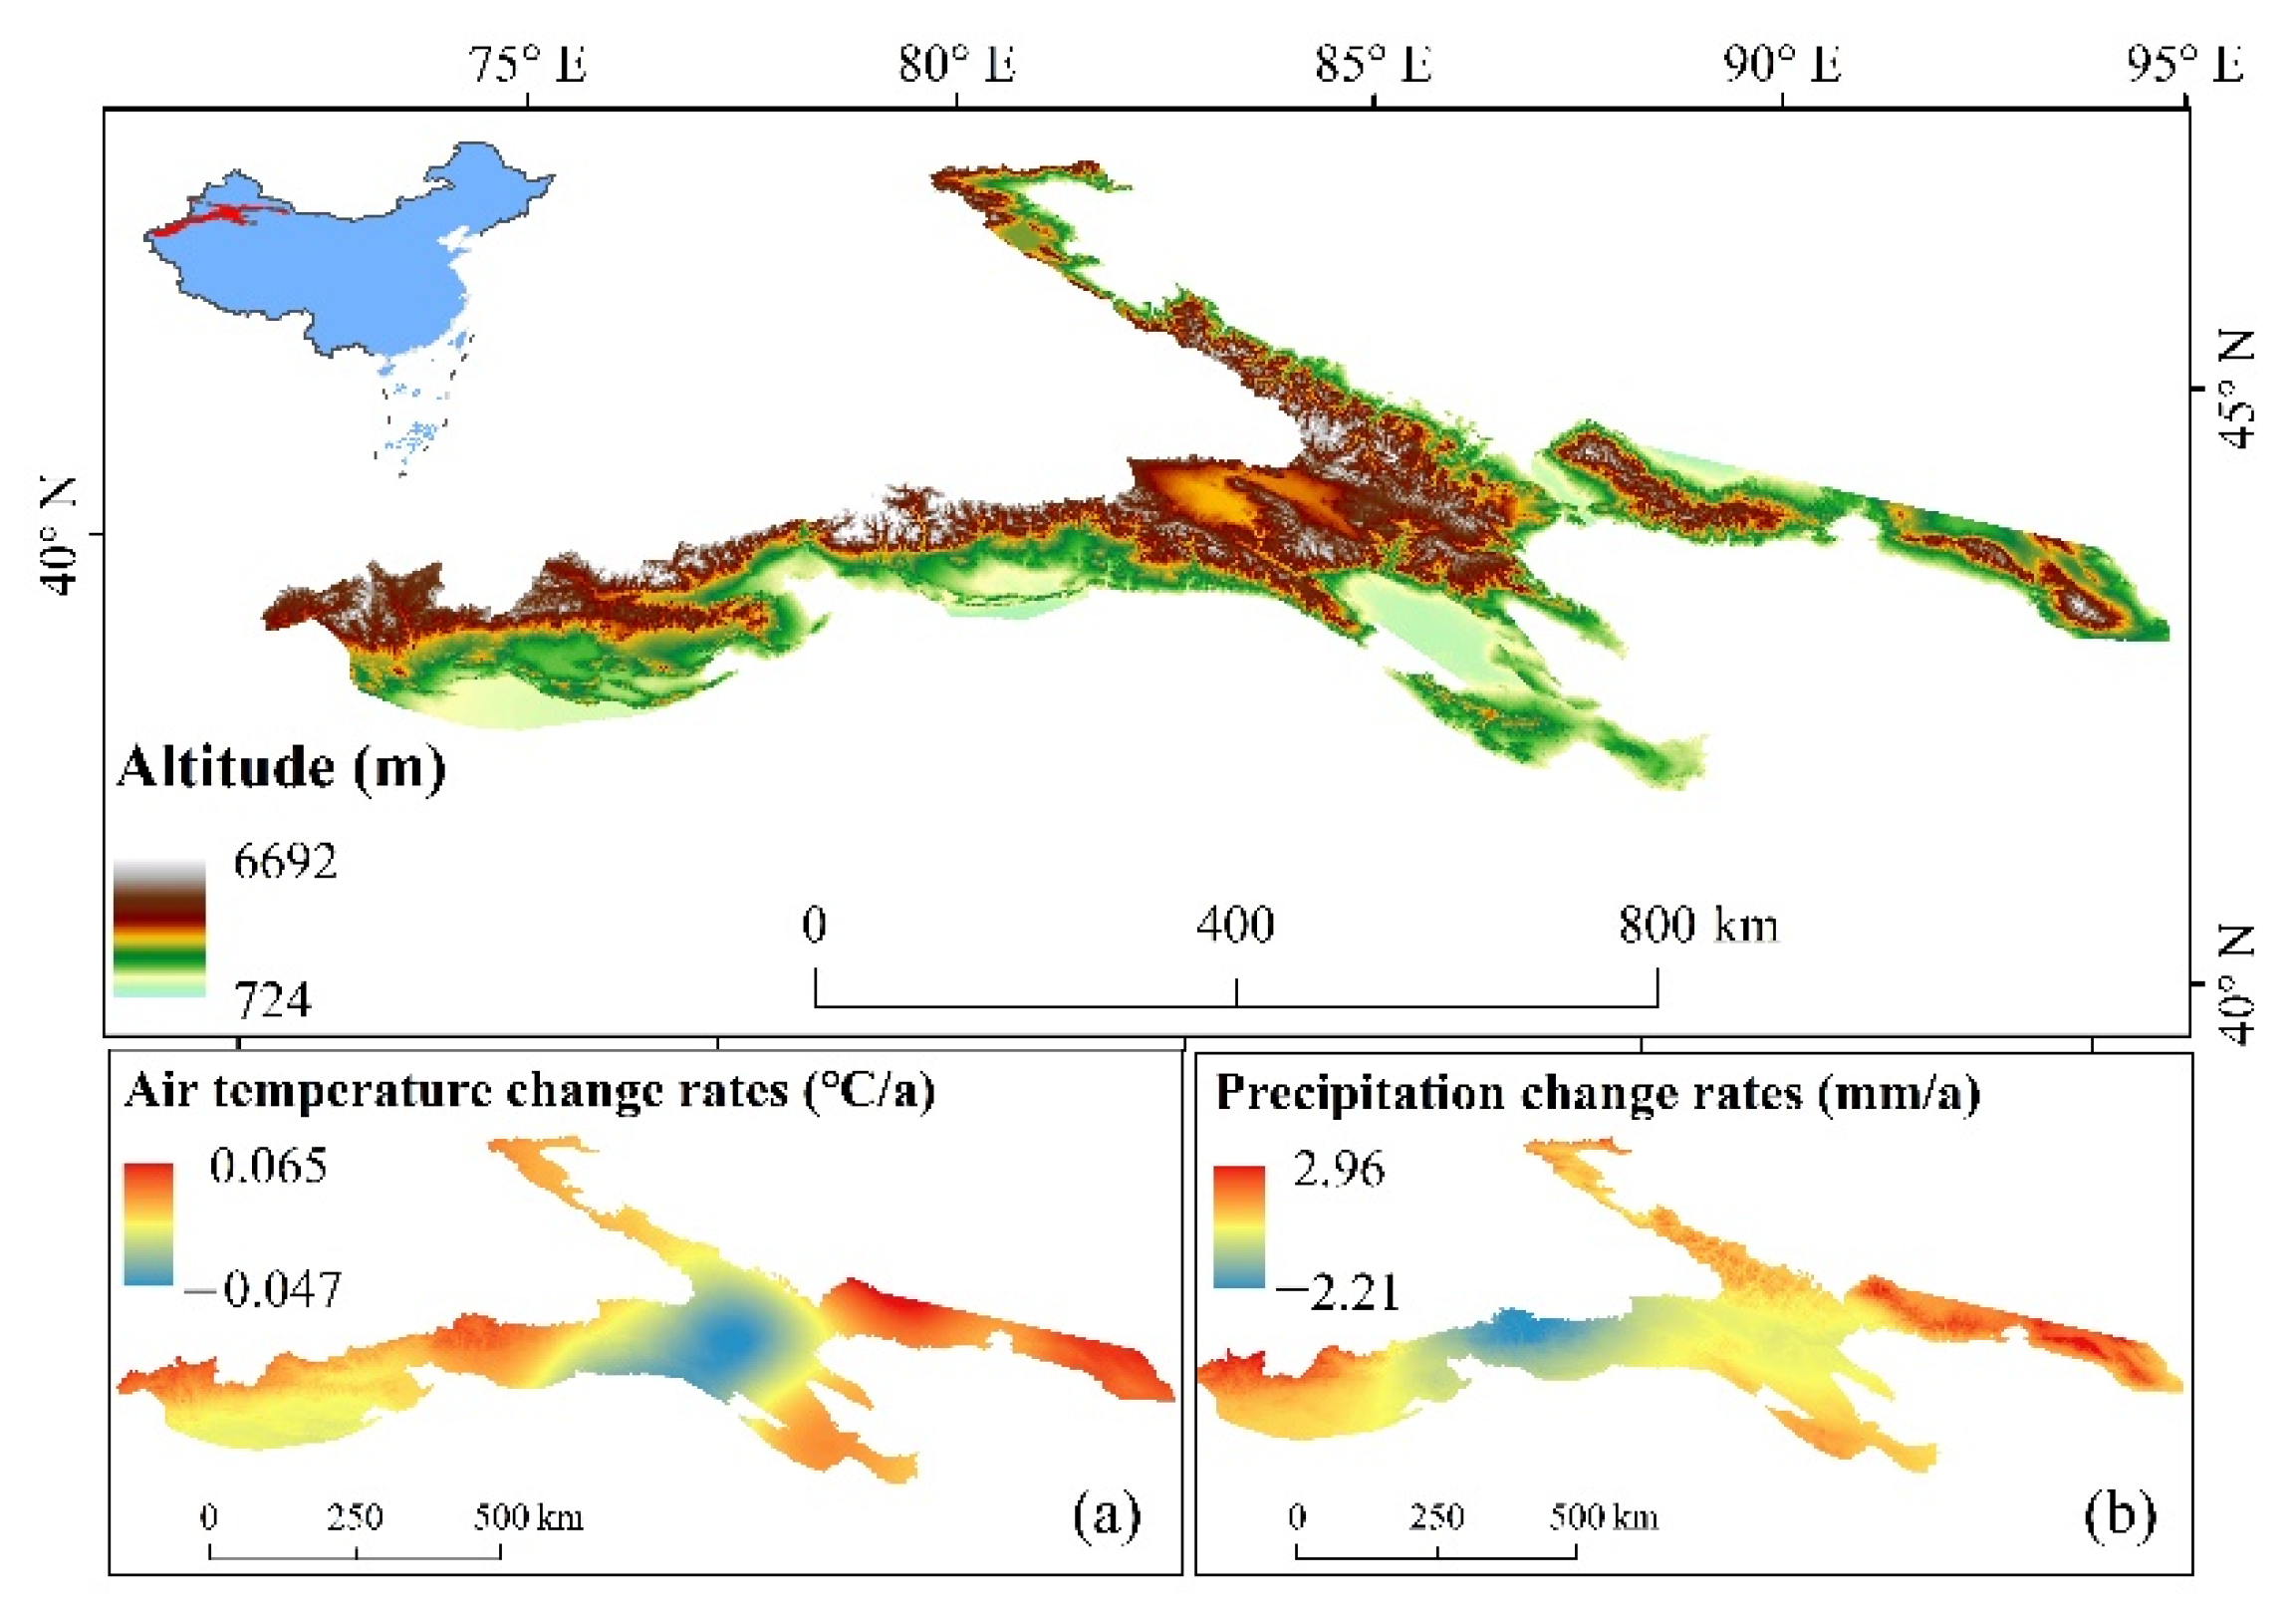
2.1. Study Area

The Tianshan Mountains (TMS) are in Xinjiang, north-western China (34.34°–55.43° N, 75°–96.37° E) (Figure 1). The study area has a typical temperate continental climate characterized by wide temperature and precipitation ranges, strong winds, and low humidity. Water vapor is mainly transported by westerly winds [32]. The annual mean value of precipitation is about 200 mm in the northern part of the TMS, and is lower (approximately 50–100 mm) in the southern part of TMS [33]. The annual maximum precipitation, of 200–300 mm, occurs in the western area of the TMS (the Yili River Valley). In contrast, only 10–30 mm falls in the eastern area (the Turpan-Hami basin), and this value is the minimum precipitation falling in the TMS. The TMS are mostly covered by grassland, in addition to having barren and sparsely vegetated areas, arable land, and forest [34].

2.2. Data

We downloaded the land surface temperature (MOD11A2) and surface albedo (MOD09A1) and NDVI (MOD13A2) data products from the NASA website (available at https://ladsweb.modaps.eosdis.nasa.gov/search/, accessed on 1 April 2021). In this work, temperature, precipitation, relative humidity, and sunshine duration in the TMS during 2000–2020 were obtained from the China Meteorological Information Center (available at http://data.cma.cn, accessed on 20 May 2021). Data regarding land-use type and vegetation type having a 1 km resolution in the TMS were obtained from the Research and Environment Science and Data Center of Chinese Academy of Sciences (available at http://www.resdc.cn/, accessed on 15 June 2021).

2.3. Method

2.3.1. NPP Calculation

The CASA model was used to calculate annual NPP, and temperature, precipitation, solar radiation, NDVI, and land cover were selected as variables. NPP was estimated as the product of absorbed photosynthetically active radiation (APAR). We defined an annual value for NPP, having the unit of grams of carbon per square meter, as follows:
N P P ( n , m ) = A P A R ( n , m ) × ε ( n , m )
where m is area and n is time; NPP (m, n) is net primary productivity fixed by vegetation photosynthesis (gC·m−2); APAR (m, n) is photosynthetically active radiation over area m during time t(gC·m−2); ε (m, n) is obtained light-use efficiency over area m during time n (g C MJ−1). APAR (m, n) and ε (m, n) are given by Equations (2) and (3):
A P A R ( n , m ) = S O L ( n , m ) × F P A R ( n , m ) × 0.5
where SOL (m, n) is total solar radiation (gC·MJ−1), and FPAR (m, n) is photosynthetically active radiation derived from NDVI [35].
ε ( n , m = T ε 1 ( n , m ) × T ε 2 ( n , m ) × W ε l ( n , m ) × ε m a x
where Tε1 (m, n) and Tε2 (m, n) are temperature stresses; Wε1 (m, n) is water stress, which represents the reduction in light-use efficiency and εmax (gC·MJ−1) is the maximum light-use efficiency under ideal conditions.

2.3.2. ET Calculation

A Surface Energy Balance System (SEBS) has been proposed for calculation of ET based on Earth observation satellite data and weather information at proper scales [36]. The surface energy balance is usually given as follows:
R n = G 0 + H + λ E
where Rn is the net radiation (W/m2), G0 is the soil heat flux (W/m2), H is the turbulent sensible heat flux (W/m2), λE is the turbulent latent heat flux (W/m2,, λ is the latent heat of vaporization ( λ = 2.49 × 10 6 J/kg), and E is the actual evapotranspiration [kg/(m2·s)]).
The formula to estimate the net radiation is shown as follows:
R n = ( 1 α ) R s w d + R l w d ε σ T 0 4
where α is the albedo, Rswd is the downward solar radiation, Rlwd is the downward longwave radiation, ε is the emissivity of the surface, σ is the Stefan–Bolzmann constant (5.67 × 10⁻⁸ W·m−2·K−4), and T0 is the surface temperature (K).
The formula to evaluate soil heat flux is parameterized as:
G 0 = R n [ Γ c + ( 1 f c ) ( Γ s Γ c ) ]  
where the ratio of soil heat flux to net radiation Γc = 0.315 for a full-vegetation canopy [37] and Γs = 0.05 for bare soil [38]. An interpolation was conducted between these limiting cases by applying the fractional canopy coverage, fc. fc can be calculated by the following equation:
f c = ( N D V I N D V I m i n N D V I m a x N D V I m i n ) 2
where NDVImax and NDVImin represent total vegetation coverage (fc = 1) and bare land (fc = 0).
E T = 8.64 × 10 7 × Λ   R n λ ρ w
where ET is the actual evaporation on a daily basis (mm d−1), λ is the latent heat of vaporization ( λ = 2.49 × 10 6 J/kg), ρw is the density of water (1.000 kg m−3), and Λ is the evaporative fraction [36].

2.3.3. WUE Calculation

WUE is defined as the ratio of NPP to ET, i.e., the amount of carbon assimilated per unit of water loss by ET:
WUE = NPP/ET
where WUE is the water-use efficiency (gC·kg−1 H2O), and NPP (gC·m−2) and ET (mm) are the annual NPP and ET in a specific grid cell, respectively.
TVDI has been widely applied in drought monitoring, and its advantages have been verified by a series of studies. For details on the TVDI calculation, see Sandholt et al. 2002 [39].

3. Results and Discussion

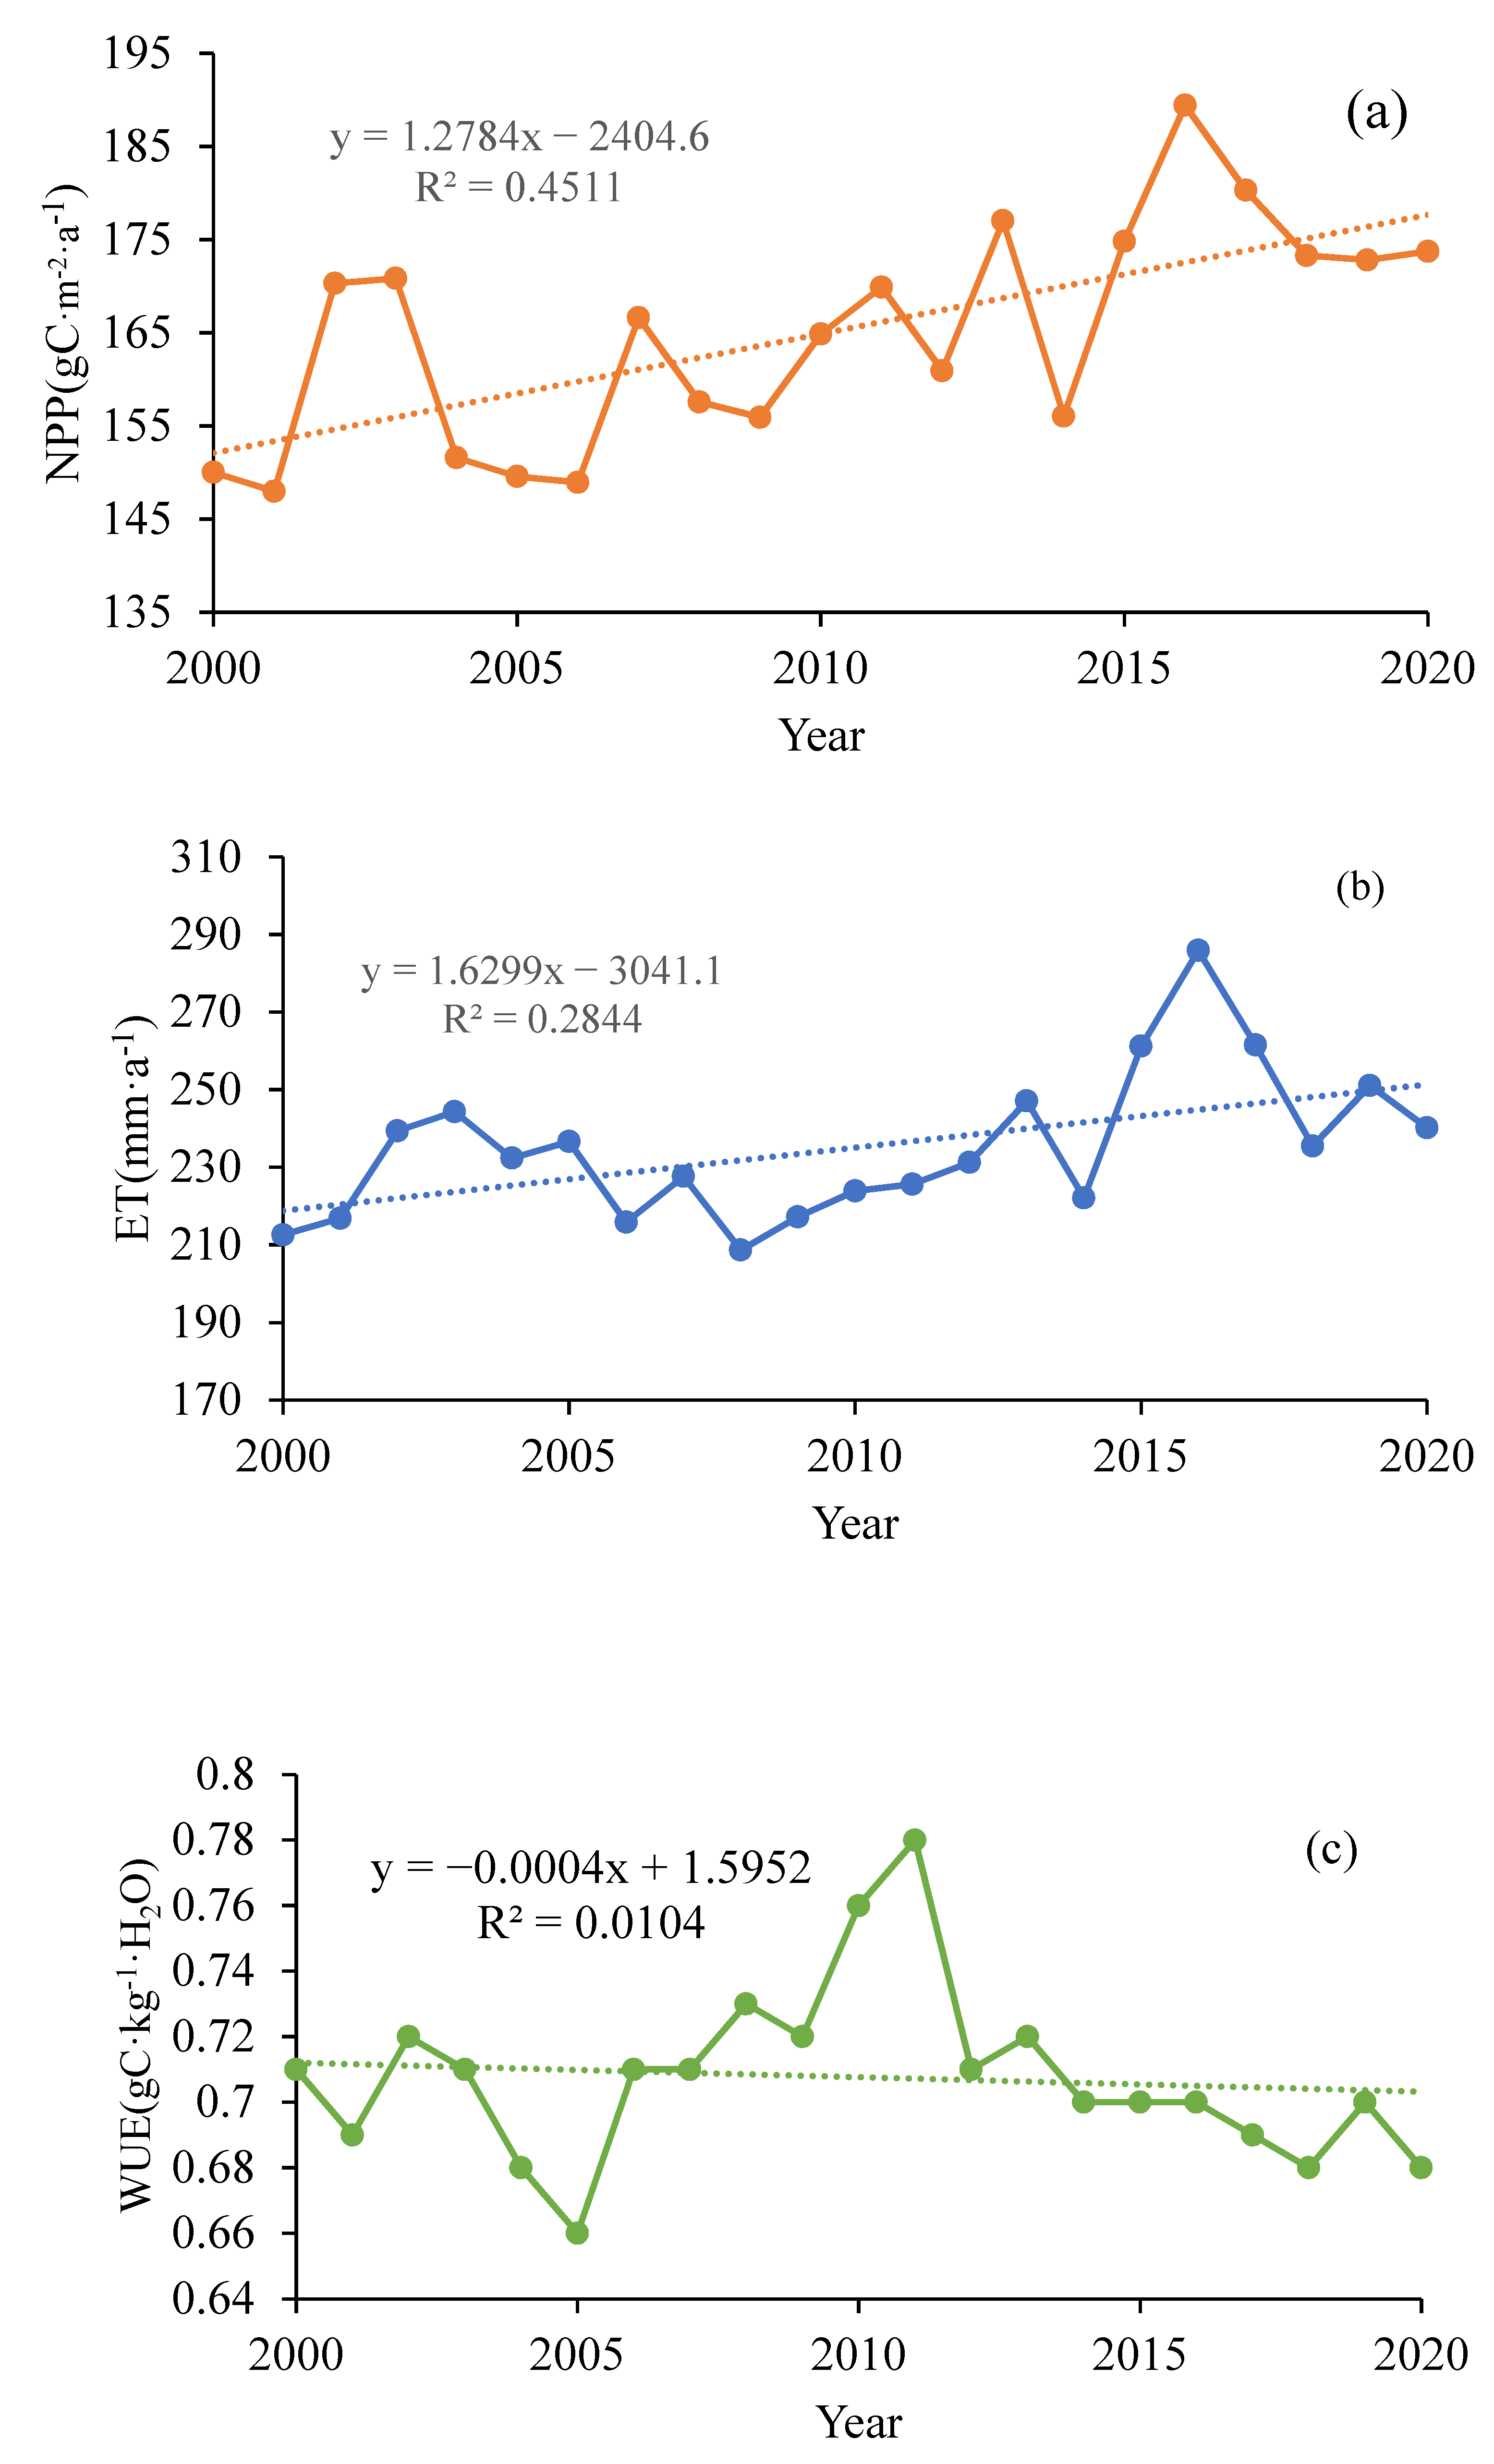
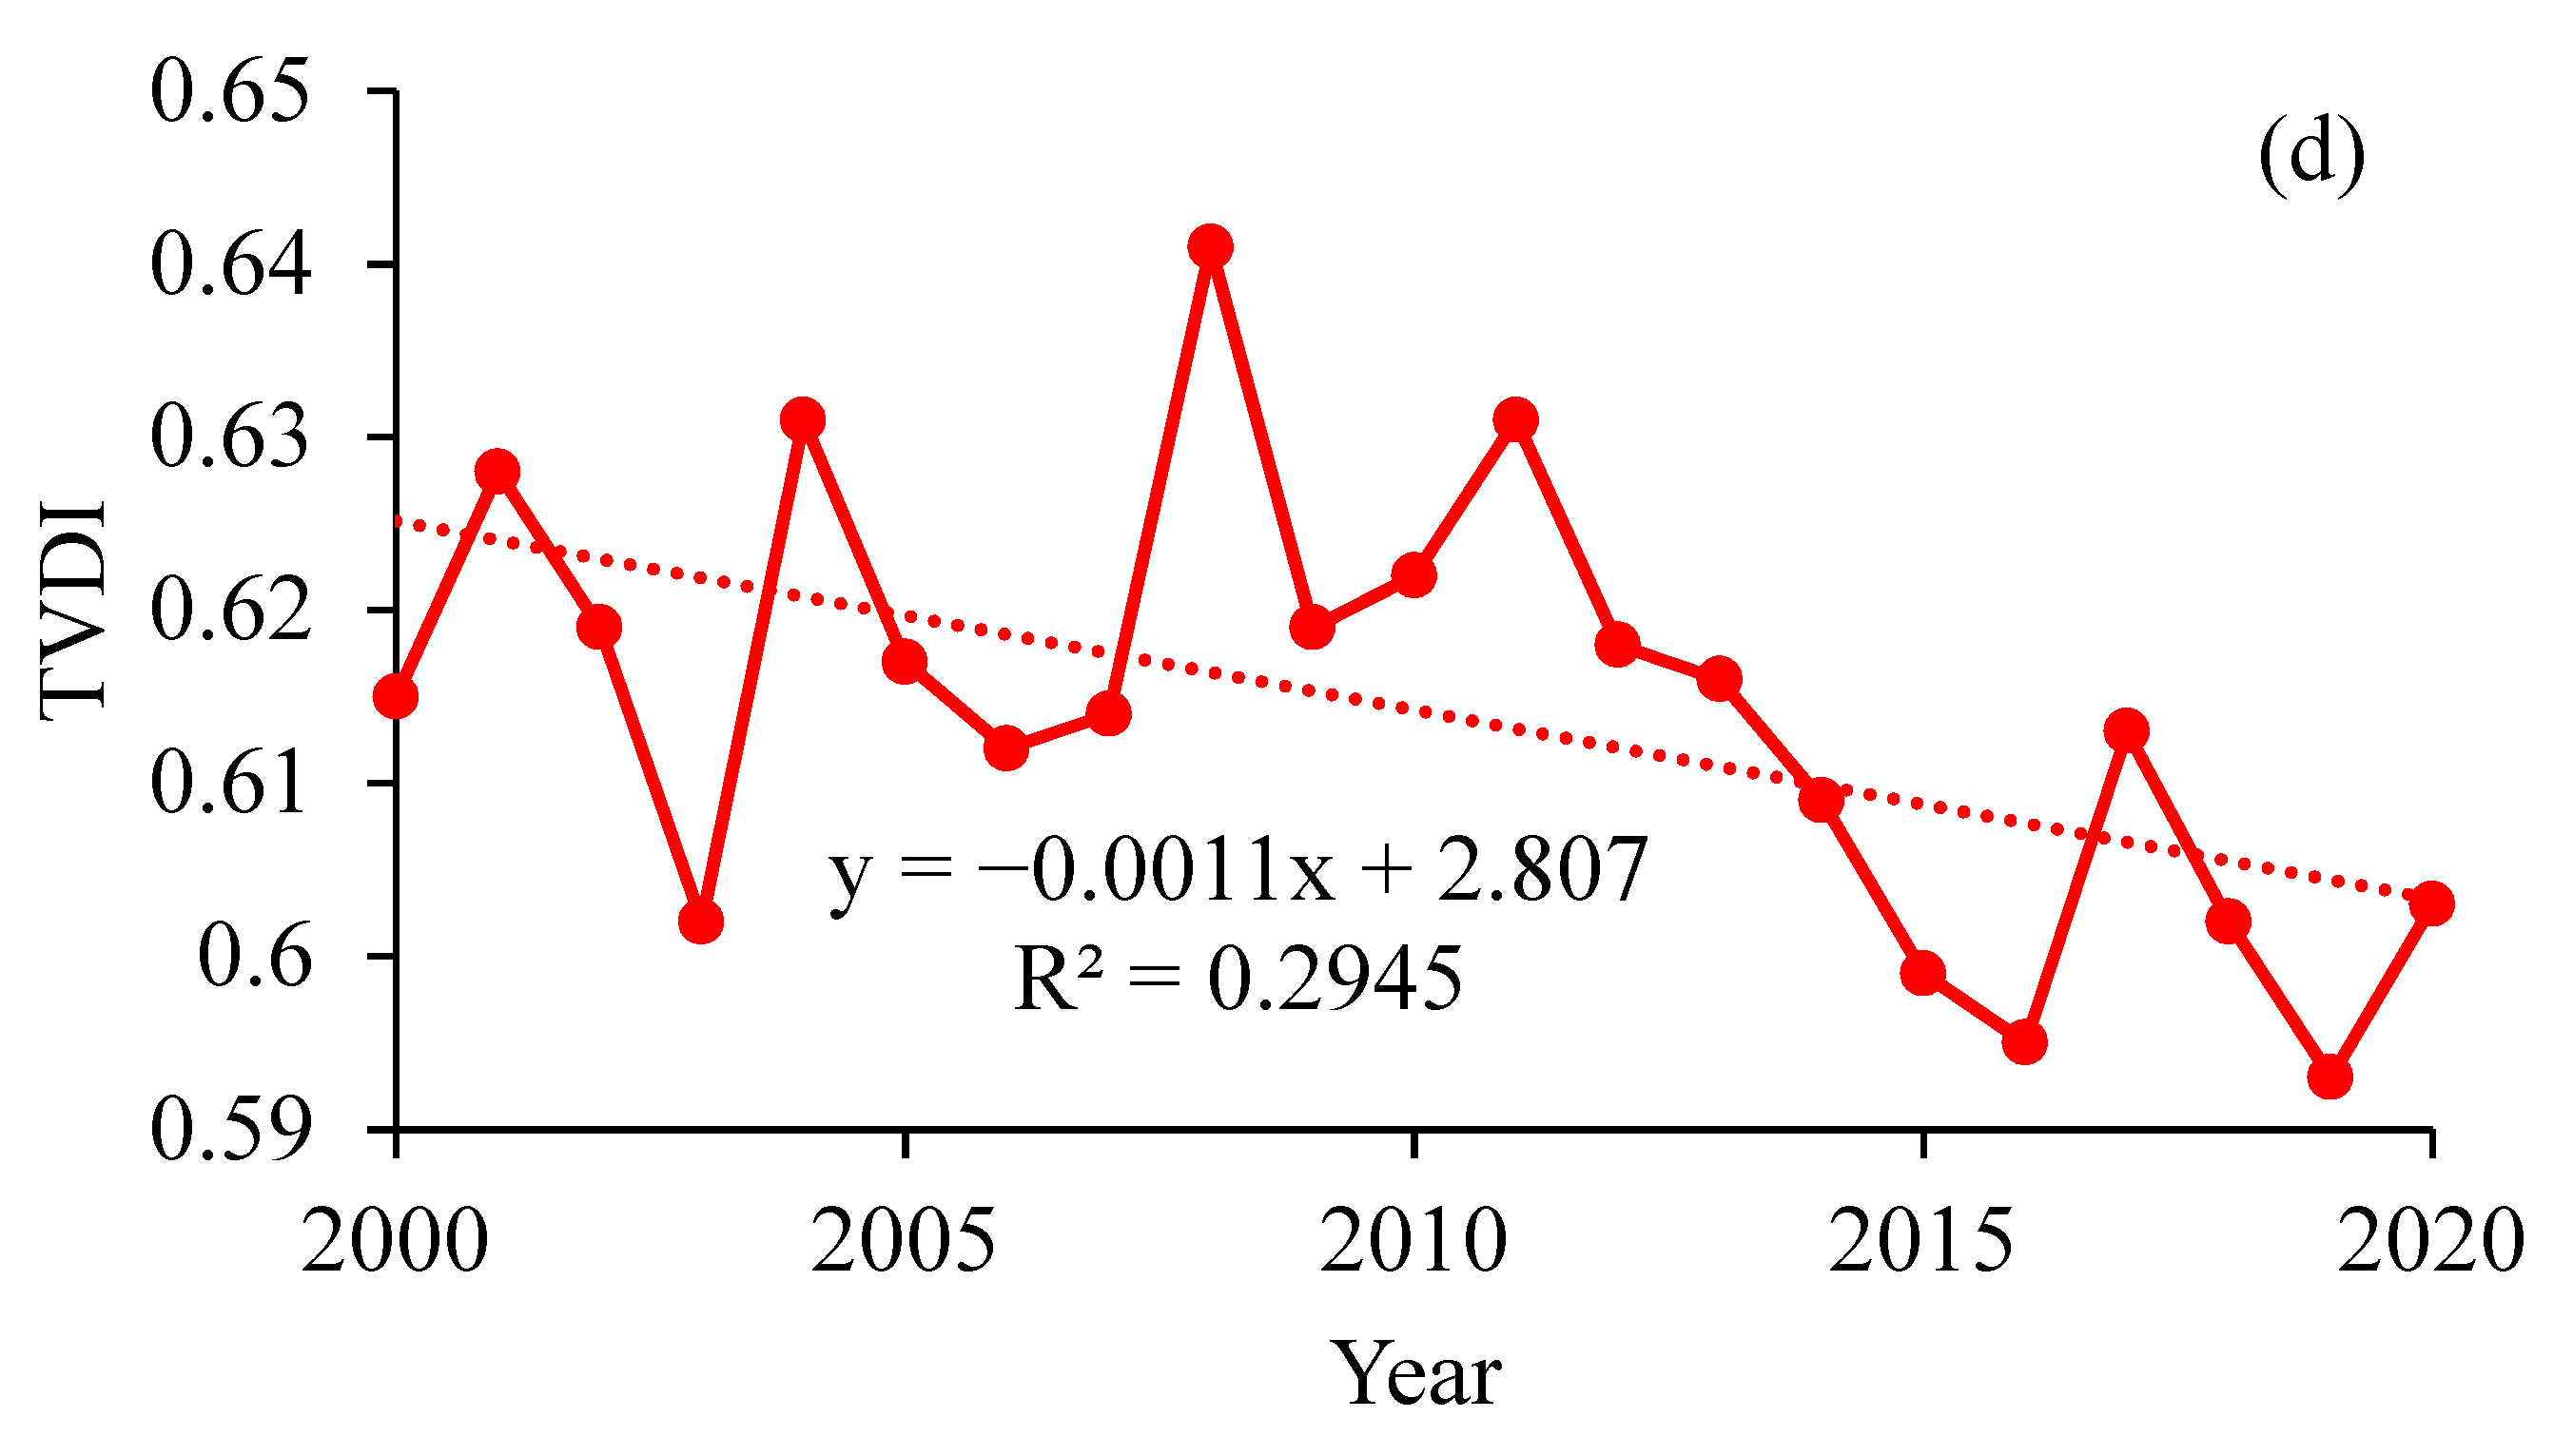
3.1. Characteristics of Temporal Variation in NPP, ET, WUE, and TVDI

Based on Figure 2, the annual values of NPP, ET, WUE, and TVDI during 2000–2020 were obtained for temporal analysis. Annual NPP presented a significant increase in the TMS, with a slope of 1.2 gC·m−2 per year (Figure 2a). NPP reached a maximum value of 84.9 gC·m−2 in 2016. Annual ET also exhibited an increasing trend in the study region during 2000–2020, with a slope of 1.6 mm per year (Figure 2b). NPP displayed a significantly increasing trend, which was in line with the results of previous research that observed improvements in vegetation across Central Asia [39,40]. These variations have affected ecosystems through various processes, and the increasing temperature and humidification of the climate have led to improvements in vegetation growth [40]. The highest and lowest values of ET appeared in the year 2016 (285.8 mm) and 2008 (208.5 mm), respectively. After 2016, ET showed a decreasing and fluctuating trend. The trend increases obtained for NPP and ET in the TMS are obviously greater than those in Central Asia, which can be highly correlated with the vegetation cover [31]. Moreover, the increase in runoff over the TMS has increased the available water, which can improve both NPP and ET to some extent.
Annual WUE and its trend during the past 20 years (2000–2020) are shown in Figure 2c. The extreme low value of WUE was 0.66 gC·kg−1·H2O in 2005 and the extreme high value was 0.78 gC·kg−1·H2O in 2011. WUE was at a higher level from 2000 to 2011 than during 2012 to 2020. WUE started to decrease in 2011, after the maximum value was reached. Overall, the regional annual series for WUE displayed an unremarkable decreasing trend. The decrease in WUE can be explained by the faster rate of increase in ET than that in NPP. In addition, the large areas covered by cotton, and the changes in cotton planting areas and irrigation patterns, may be the dominant reasons for the decrease in WUE [31]. The results for TVDI show that the TMS experienced a decreasing trend in drought events in terms of frequency and intensity. The study area was categorized as arid during 2000–2010, with the average TVDI value (0.62) being between 0.6 and 0.8, and the changed to slight aridity during 2011–2020, when the TVDI value was between 0.4 and 0.6.

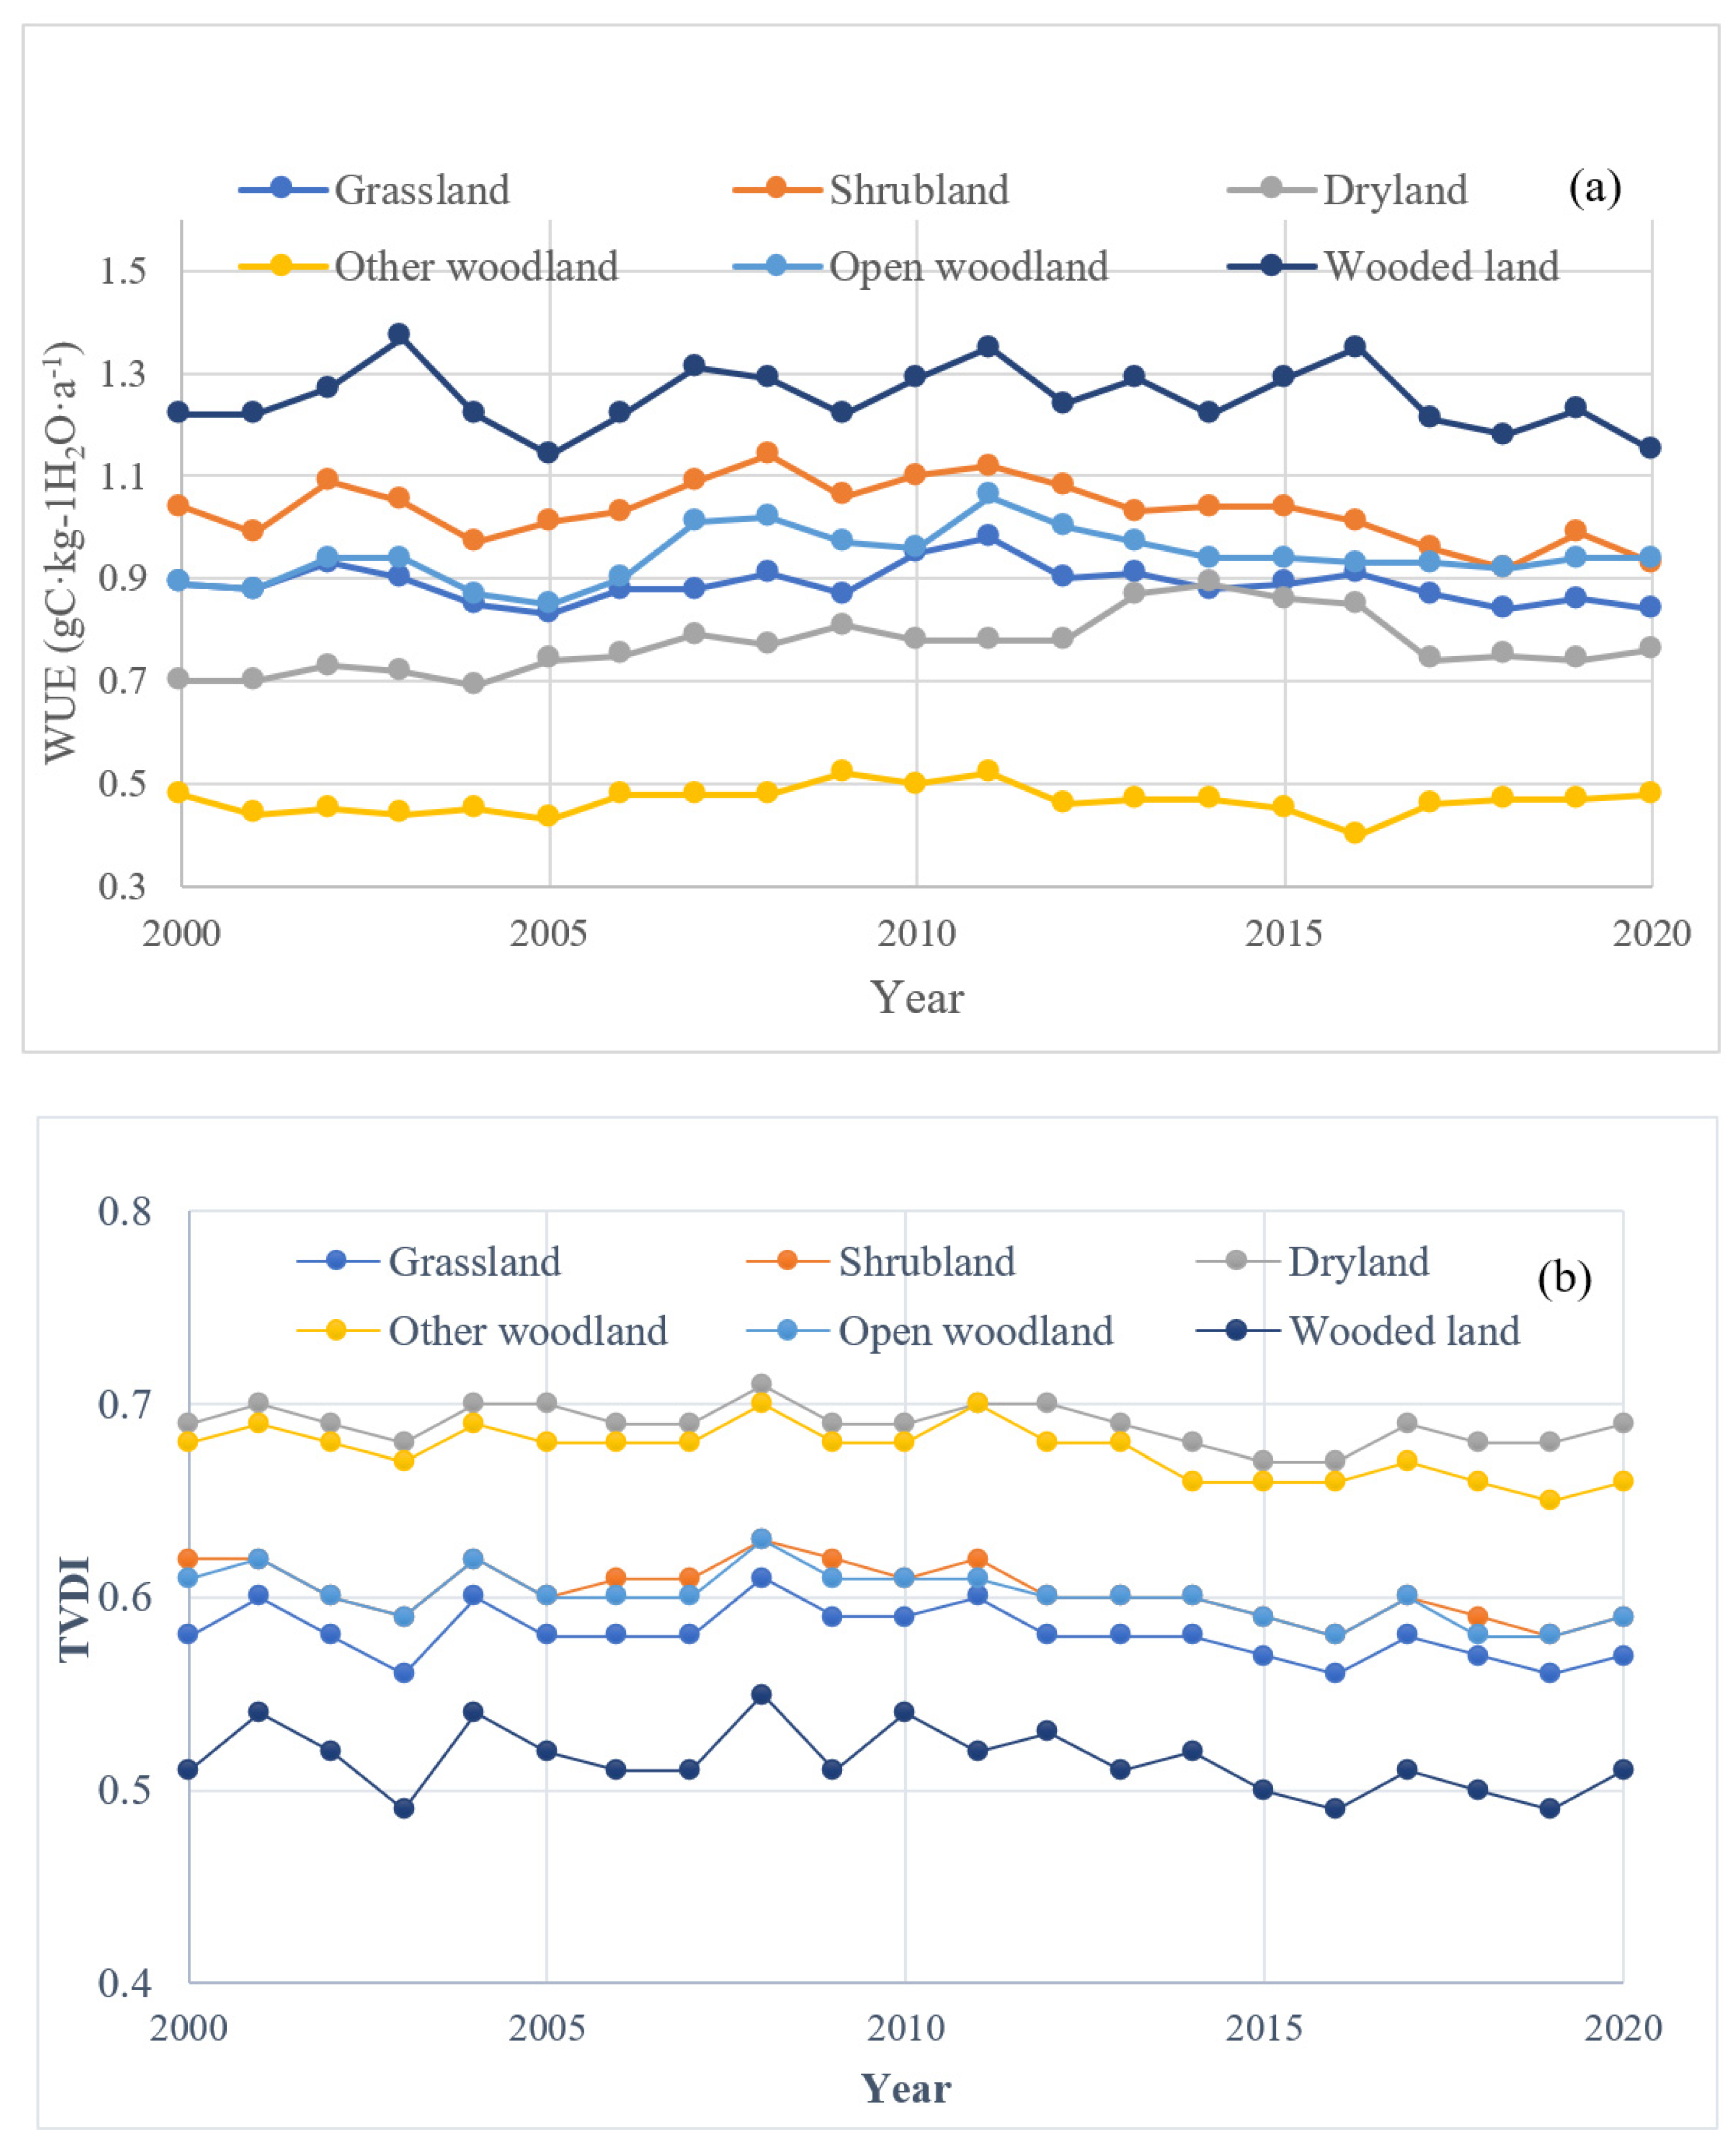
3.2. Characteristics of Temporal Variation in WUE and TVDI under Different Land-Use Types

As shown in Figure 3a, there are obvious differences in WUE under different land-use types caused by NPP and ET. However, the interannual variation in WUE showed a small fluctuation, and the dynamic process of WUE in each land-use type had a good consistency. For different land cover types during 2000–2020, the values of WUE descended in the order of wooded land (1.25 gC·kg−1·H2O) > shrub land (1.03 gC·kg−1·H2O) > open woodland (0.94 gC·kg−1·H2O) > grassland (0.88 gC·kg−1·H2O) > dryland (0.77 gC·kg−1·H2O) > other woodland (0.47 gC·kg−1·H2O). The difference in WUE among the different vegetation types is remarkable, and is consistent with previous research [22,31]. The main reason for this result is that, under the same water supply conditions, forest land can produce more biomass and store more organic substances [41]. Previous research also demonstrated that the WUE of evergreen plants was significantly lower than that of deciduous plants, and the WUE of arbor, shrub, herb, and liana was also different. Liana had the highest WUE, and there was little difference between the values of arbor and shrub [42]. The estimated TVDI in this work can be divided into three groups (Figure 3b), namely, the higher-value group (other woodland and dryland), the middle-value group (shrub land, open woodland, grassland), and the low-value group (wooded land). The TVDI under different land-use types presented small changes during 2000–2012, and then exhibited a slightly decreasing trend for all land-use types in the TMS. The obtained higher TVDI values for other woodland and dryland may be caused by the higher temperature because TVDI is more sensitive to the land surface temperature, and land surface temperature contains more drought information than NDVI [43]. By comparison, it has been reported that the main influential factor for the TVDI in northern and north-western regions was sunshine duration [44]. However, the response of TVDI to climate factors in different regions may differ, and needs to be further investigated and analyzed.

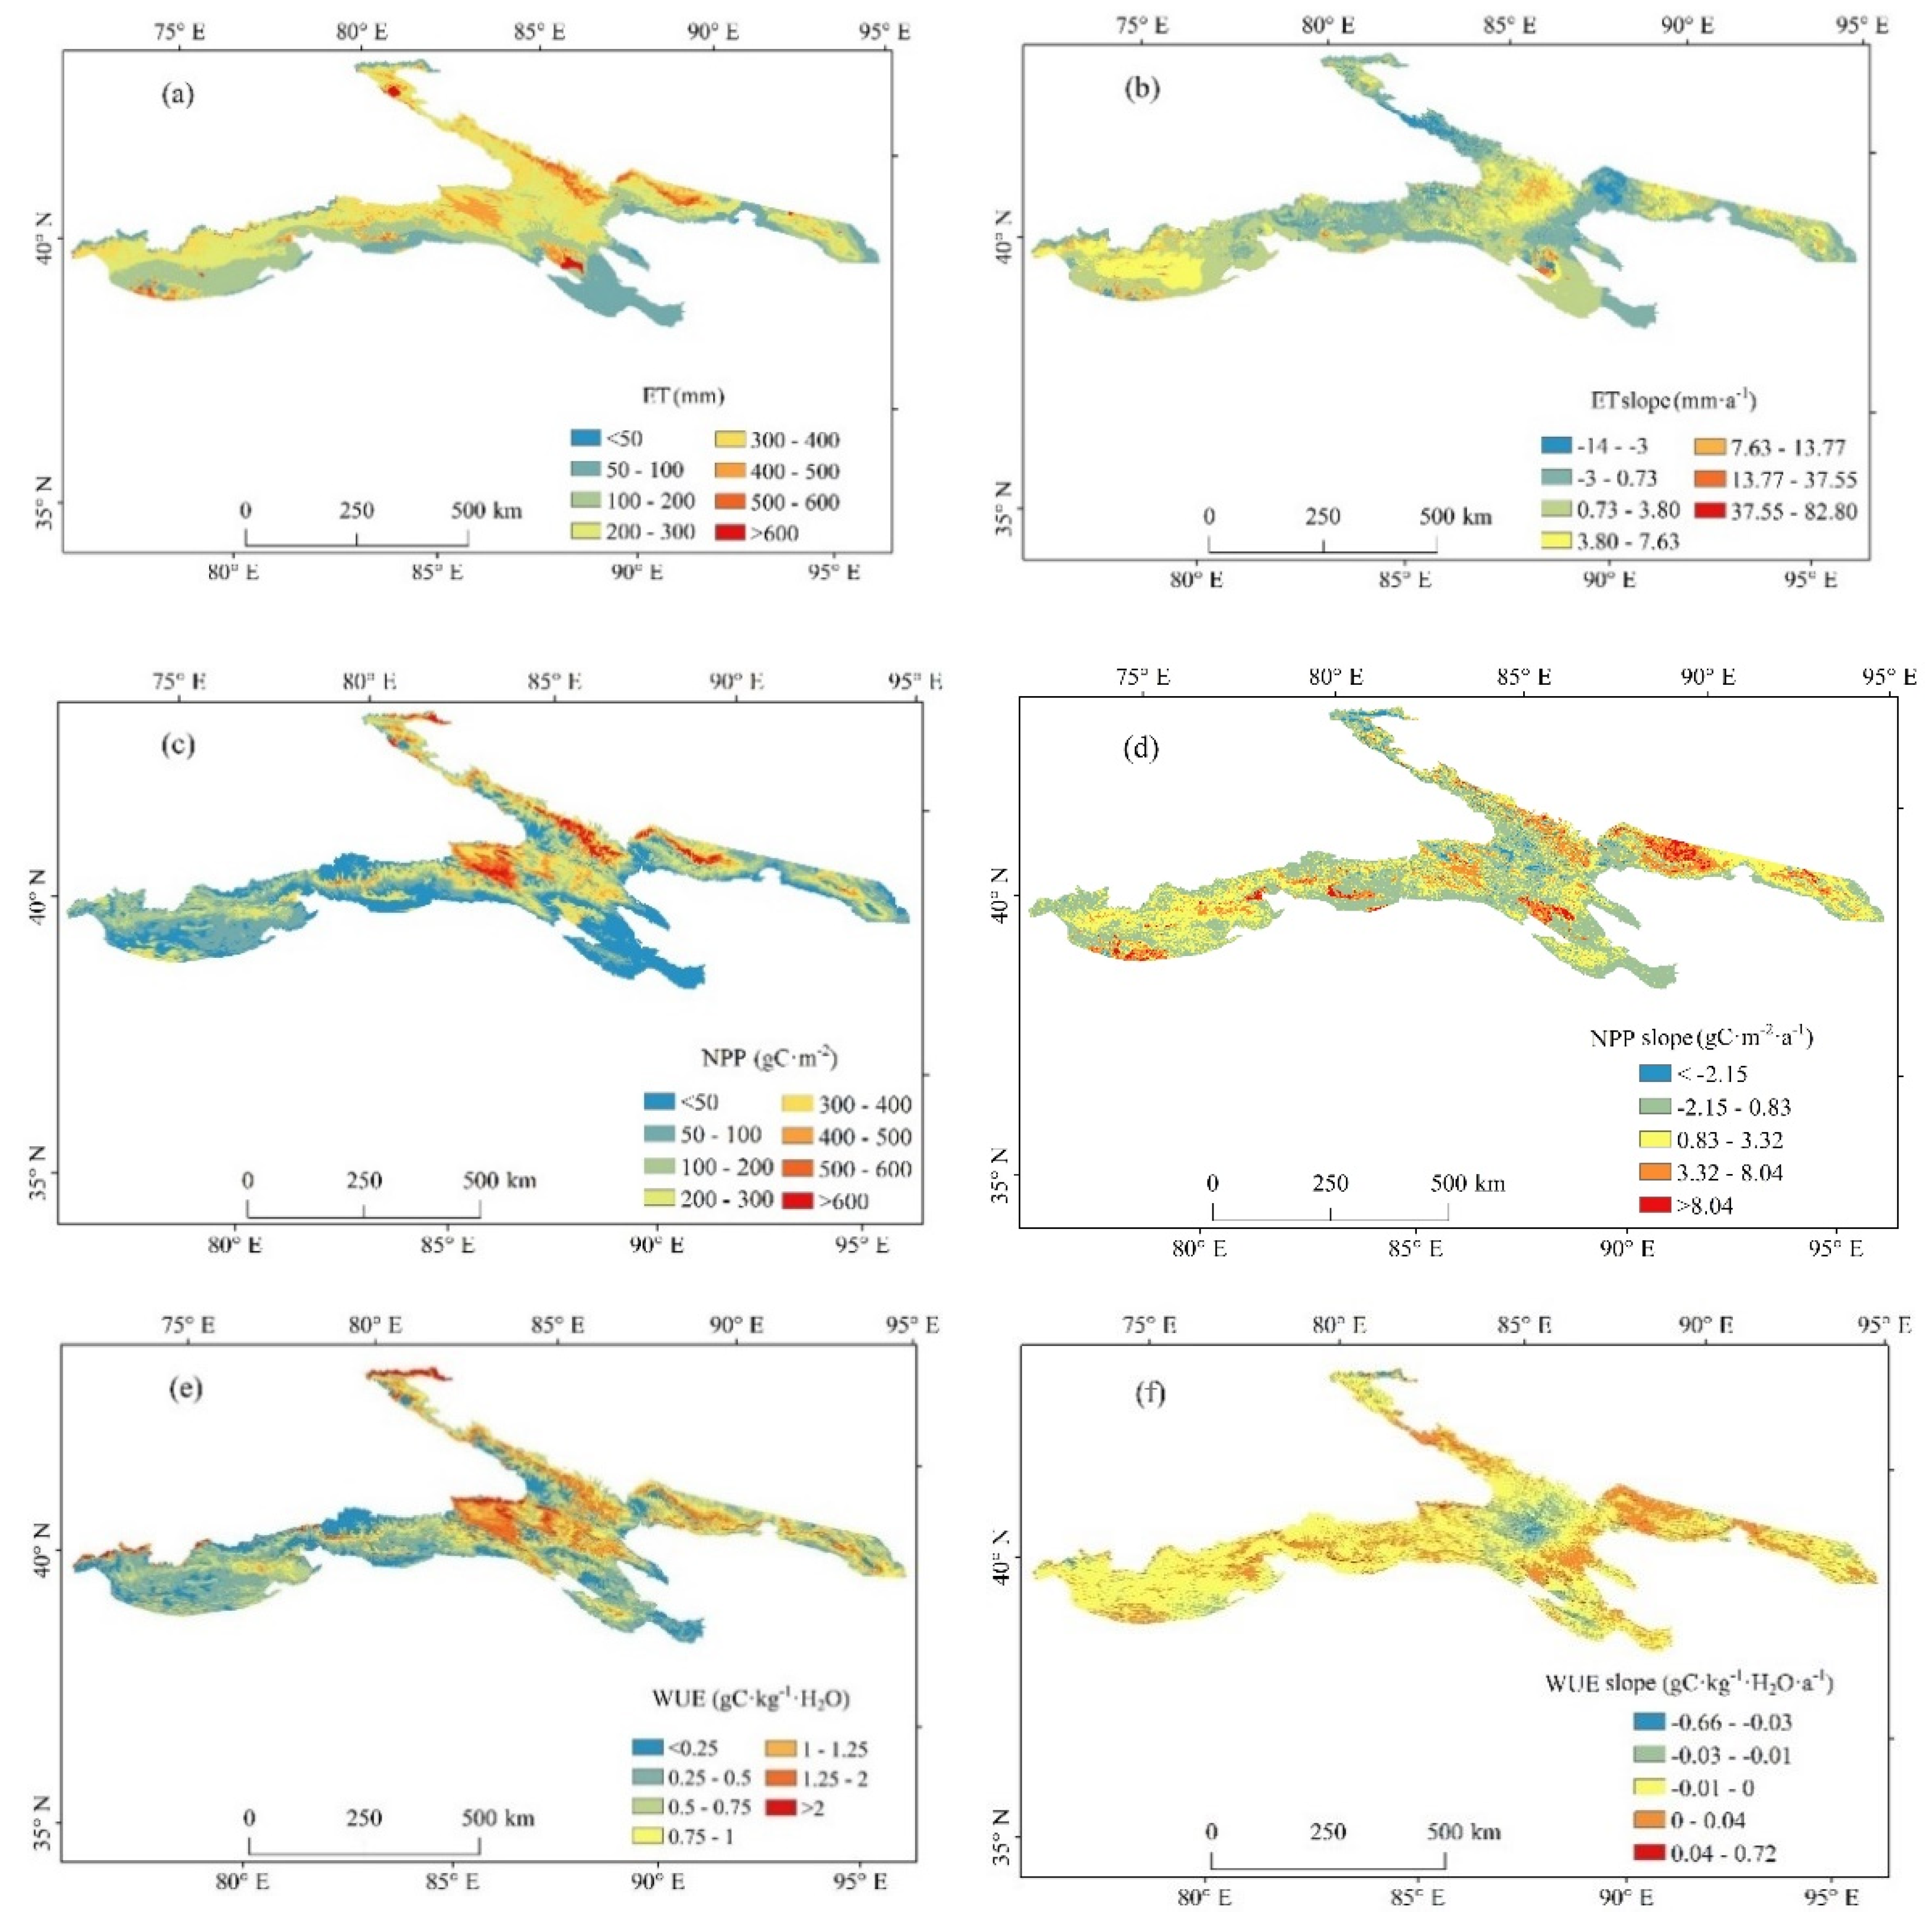
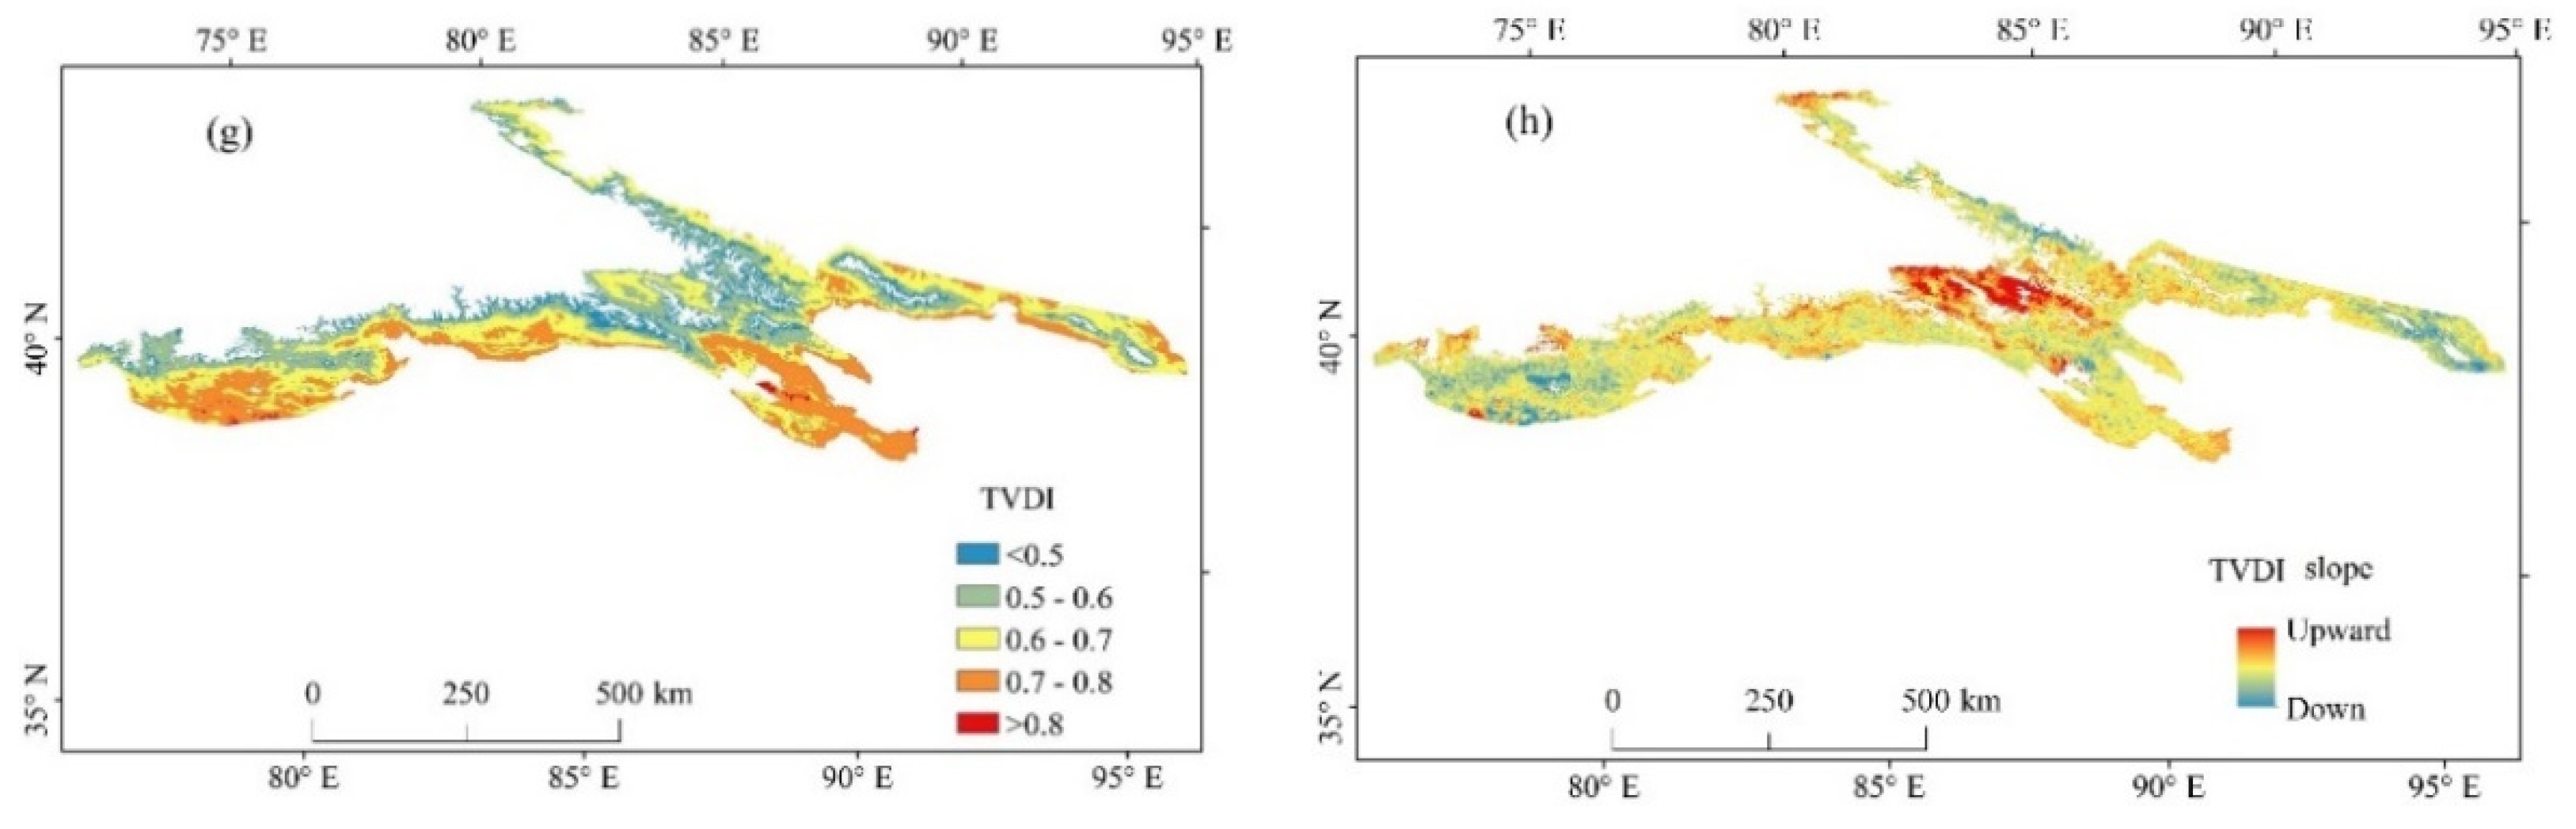
3.3. Spatial Distribution Characteristics of NPP, ET, WUE, and TVDI

The spatial patterns of the annual mean and slope of NPP, ET, WUE, and TVDI during 2000–2020 are depicted in Figure 4. The spatial patterns in the average value of ET showed a decreasing trend with decreasing latitude (southward) and the highest value (620 mm) appeared in the Turpan region (Figure 4a). From west to east, the slope of ET experienced an “increase–decrease–increase–decrease” mode in the TMS, and most of the rates of increase were in the range of 0.73–7.36 (Figure 4b). The spatial pattern of the average annual NPP showed that highest NPP generally occurred in the central region of the study area (Figure 4c). Furthermore, the regions having decreasing trends that were statistically significant at the 0.01 level for NPP were primarily distributed in the central and eastern TMS (Figure 4d). In addition, a majority of regions (approximately 86%) exhibited a generally increasing trend for NPP, with range of 0.54–8.25 gC·m−2·a−1, which is consistent with a study conducted in the Hexi Corridor in north-western China [45].
Comparing the map for average annual NPP with that for average annual WUE, we noticed that the spatial distribution for average annual NPP was consistent with that of annual WUE (Figure 4c,e). For example, the high values of NPP and WUE appeared predominantly in the central and northern regions of the TMS. Overall, the number of regions in which WUE decreased was greater than that in which WUE increased, indicating that WUE had a decreasing variation in the TMS during 2000–2020. Compared with the multiyear mean spatial distribution of WUE, the slope indicated a different pattern that presented no significant changes for all of the areas, and only some areas in the central TMS showed a remarkably decreasing trend, at a rate of 0.03–0.66 gC·kg−1·H2O·a−1 (Figure 4f). In addition, most areas (75%) experiencing an increasing trend in WUE were distributed in the eastern region of the TMS. As shown in Figure 4g, notably, the majority of pixels having high TVDI values were distributed in low-altitude areas on the southern slope of the TMS, which indicates that these areas, especially those at the edge of oases, experienced drought and severe drought, which may be related to the increasing temperature (Figure 1) and lower vegetation coverage in these areas [31]. Overall, the percentage of pixels showing an increase in the TVDI was slightly larger than that showing a decrease in the TVDI in the TMS (Figure 4h). Interestingly, the region experiencing a significant increase (at the 0.05 significance level) in the TVDI corresponded to the area showing a significant decrease (at the 0.05 significance level) in WUE, indicating that the TVDI may reduce WUE and increase ET. This issue is discussed in the following section.

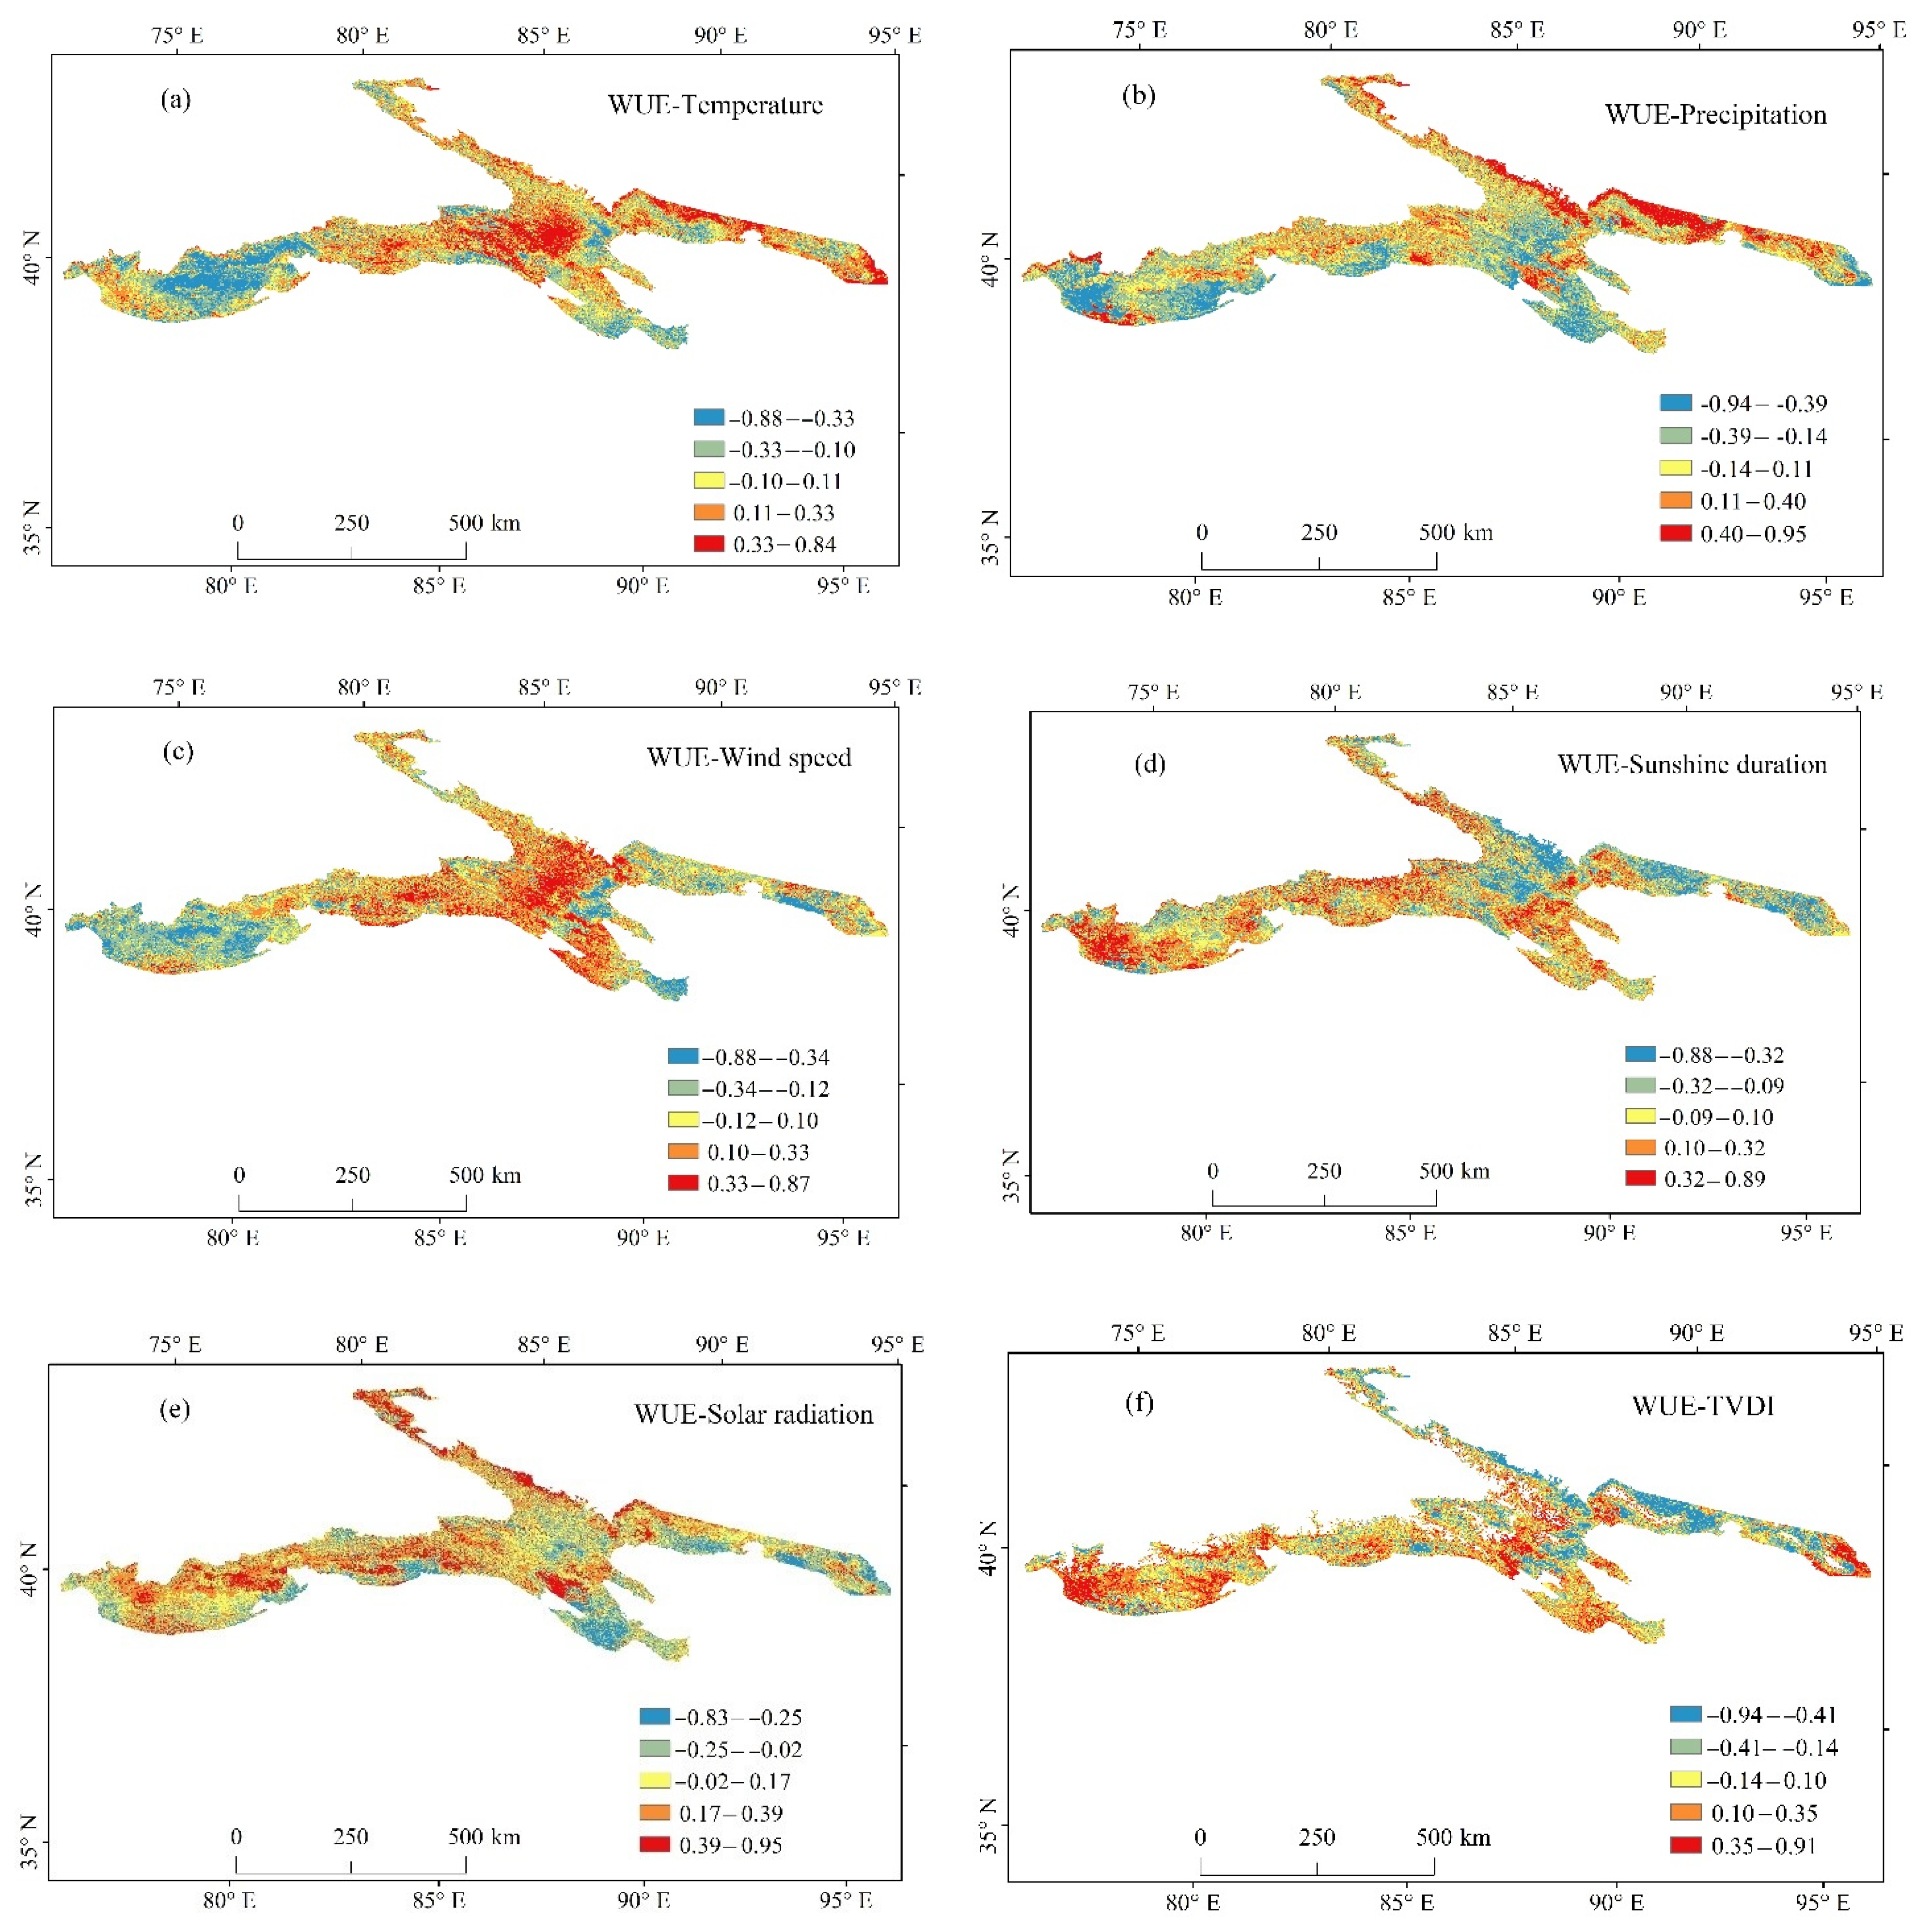
3.4. Response of WUE to Climatic Factors and Drought

Extensive studies have reported that climatic conditions can result in spatial and temporal changes in WUE. For instance, slight changes in precipitation reduce runoff [46] and can improve the plant growth environment [47], therefore increasing the NPP, which has a positive effect on WUE. Thus, the relationship between WUE and climate factors and drought were investigated at a large regional scale in the TMS. As shown in Figure 5a–c, temperature and wind speed had a positive influence on WUE in the central and eastern TMS. Precipitation can also play a positive role in enhancing WUE, especially on the northern slope of the TMS, which is consistent with a previous study that was carried out on the Chinese Loess Plateau [48]. The authors also demonstrated that the positive correlation between WUE and the mean annual precipitation range in the Chinese Loess Plateau was larger for forest vegetation than for steppe vegetation [48]. The two climatic factors (wind speed and precipitation) both had a negative influence on WUE in the Ili region in the western part of the TMS (Figure 5a–c). It is easy to understand that higher wind speeds decrease NPP and further decrease WUE. The Ili region is located in a river valley and is mainly covered by grassland, and a previous study revealed that precipitation is the main factor controlling WUE variation in grassland [5]. Our results are in line with this finding, and the decrease in precipitation was found to reduce ET, which may lead to enhancing WUE in the Ili region. This phenomenon occurs because the relationship between WUE and precipitation is primarily controlled by the carbon process rather than the hydrological process [5]. As presented in Figure 5d,e, the correlation coefficients of annual mean WUE with sunshine duration and solar radiation in the TMS showed strong spatial heterogeneity, and the spatial distribution of these correlation coefficients had good consistency. Additionally, the areas having a positive correlation were scattered in the central and western TMS, and the areas having a negative correlation were distributed in the eastern regions.
At present, the analysis of the effect of drought on water cycles’ terrestrial carbon is a popular and meaningful research topic. It was reported that drought can cause a significant increase in WUE in natural ecosystems [49,50], but other researchers demonstrated that severe drought may obviously reduce ecosystem WUE [51,52]. In the present study, although there was strong spatial heterogeneity of the correlation coefficient (0.68, p < 0.05) between WUE and the TVDI (Figure 5f), the slopes of WUE and the TVDI presented good consistency in spatial distribution (Figure 4f,h). Thus, we concluded that drought can enhance the WUE of natural ecosystems, which agrees with results obtained by Campos et al. [49]. However, considering that the adopted drought index, spatiotemporal scale, and statistical method can vary, the conclusion regarding the relationship between WUE and drought may differ. In future, it will be necessary to analyze the mechanism by which drought influences WUE, in addition to making field observations. This will improve the comprehension of the WUE of ecosystems and enhance the scientific basis for water resource management in the TMS.

4. Conclusions

It is of great importance to analyze the spatiotemporal changes in NPP and WUE to enable suitable management measures to be applied for water resources and agriculture, and thus ensure the sustainable provision of essential ecosystem services. In the present work, NPP in the TMS from 2000 to 2020 was calculated using the CASA model, and ET was estimated using the SEBS model. This enabled WUE to be easily obtained using the NPP and ET values. The spatiotemporal variations in the annual values and slopes of NPP, ET, and WUE were further investigated and discussed. These results provide important spatially explicit information for decision making and sustainable development in TMS.
Annual NPP in the study area ranged from 147.9 to 189.4 gC·m−2, annual ET ranged from 212.5 to 285.8 mm, and annual WUE ranged from 0.66 to 0.78 gC·kg−1·H2O in the TMS during 2000–2020. During the study period, both NPP and ET exhibited an increasing trend with some fluctuation, whereas WUE showed the opposite tendency. The annual NPP and ET values showed a similar spatial pattern, with remarkable changes in some regions of the TMS from 2000 to 2020. The number of areas where WUE decreased was larger than that where WUE increased, indicating that WUE experienced a decreasing trend in the TMS during 2000–2020. Our results demonstrate that the decrease in WUE was primarily because of the increase in ET. Obvious differences were found for WUE under different land-use types, caused by NPP and ET. However, the interannual variation in WUE showed a small fluctuation, and the dynamic process of WUE in each land-use type showed good consistency. The correlations between WUE, climate factors, and drought were investigated. For example, temperature and wind speed had positive influences on WUE in the central and eastern TMS. Precipitation also played a mainly positive role in enhancing WUE, especially on the northern slope of the TMS. There was strong spatial heterogeneity of the correlation coefficient (0.68, p < 0.05) between WUE and the TVDI, and the slopes of WUE and the TVDI presented good consistency in their spatial distribution, suggesting that drought had a significant impact on ecosystem WUE. Thus, in future, it will be necessary to analyze the mechanism by which drought influences WUE, in addition to making field observations. This will improve the understanding of the WUE in ecosystems and enhance the scientific basis for water resource management in the TMS.

Author Contributions

J.C.: Investigation, Data. L.C.: Methodology, Writing, Review and Editing. All authors have read and agreed to the published version of the manuscript.

Funding

This study was supported National Natural Science Foundation of China (No.41901129; No.42101100); the Nature Science Foundation of Shaanxi Province (No.2021JQ-313), the China Postdoctoral Science Foundation (2020M673334).

Institutional Review Board Statement

Not applicable.

Informed Consent Statement

Not applicable.

Data Availability Statement

Not applicable.

Acknowledgments

This work was partially supported by National Natural Science Foundation of China (No.41901129; No.42101100); the Nature Science Foundation of Shaanxi Province (No.2021JQ-313); the China Postdoctoral Science Foundation (2020M673334); Open fund from Anhui Engineering and Technology Research Center for Smart City. We are also grateful to the editor and anonymous reviewers for their constructive comments and suggestions leading to improvement of this paper.

Conflicts of Interest

The authors declare no conflict of interest.

References

  1. Beer, C.; Ciais, P.; Reichstein, M.; Baldocchi, D.; Law, B.E.; Papale, D.; Soussana, J.F.; Ammann, C.; Buchmann, N.; Frank, D.; et al. Temporal and among-site variability of inherent water use efficiency at the ecosystem level. Glob. Biogeochem. Cycles 2009, 23, GB2018. [Google Scholar] [CrossRef]
  2. Keenan, T.F.; Hollinger, D.Y.; Bohrer, G.; Dragoni, D.; Munger, J.W.; Schmid, H.P.; Richardson, A.D. Increase in forest water-use efficiency as atmospheric carbon dioxide concentrations rise. Nature 2013, 499, 324–327. [Google Scholar] [CrossRef] [PubMed]
  3. Wang, H.; Li, X.; Xiao, J.; Ma, M.; Tan, J.; Wang, X.; Geng, L. Carbon fluxes across alpine, oasis, and desert ecosystems in northwestern China: The importance of water availability. Sci. Total Environ. 2019, 697, 133978. [Google Scholar] [CrossRef] [PubMed]
  4. Lu, L.; Li, X.; Huang, C.L.; Veroustraet, F. Using remote sensing to estimate water use efficiency in Western China. In Proceedings of the 2007 IEEE International Geoscience and Remote Sensing Symposium, Barcelona, Spain, 23–27 July 2007; pp. 4538–4541. [Google Scholar] [CrossRef]
  5. Hu, Z.; Yu, G.; Fu, Y.; Sun, X.; Li, Y.; Shi, P.; Wang, Y.; Zheng, Z. Effects of vegetation control on ecosystem water use efficiency within and among four grassland ecosystems in China. Glob. Chang. Biol. 2008, 14, 1609–1619. [Google Scholar] [CrossRef]
  6. Tian, H.; Chen, G.; Liu, M.; Zhang, C.; Sun, G.; Lu, C.; Xu, X.; Ren, W.; Pan, S.; Chappelka, A. Model estimates of net primary productivity, evapotranspiration, and water use efficiency in the terrestrial ecosystems of the southern United States during 1895–2007. For. Ecol. Manag. 2010, 259, 1311–1327. [Google Scholar] [CrossRef]
  7. Liu, Y.; Xiao, J.; Ju, W.; Zhou, Y.; Wang, S.; Wu, X. Water use efficiency of China’s terrestrial ecosystems and responses to drought. Sci. Rep. 2015, 5, 13799. [Google Scholar] [CrossRef]
  8. Oki, T.; Kanae, S. Global Hydrological Cycles and World Water Resources. Science 2006, 313, 1068–1072. [Google Scholar] [CrossRef] [Green Version]
  9. Mu, S.; Zhou, S.; Chen, Y.; Li, J.; Ju, W.; Odeh, I. Assessing the impact of restoration-induced land conversion and management alternatives on net primary productivity in Inner Mongolian grassland, China. Glob. Planet. Chang. 2013, 108, 29–41. [Google Scholar] [CrossRef]
  10. Pappas, C.; Fatichi, S.; Rimkus, S.; Burlando, P.; Huber, M.O. The role of local-scale heterogeneities in terrestrial ecosystem modeling. J. Geophys. Res. Biogeosci. 2015, 120, 341–360. [Google Scholar] [CrossRef] [Green Version]
  11. Yang, H.; Mu, S.; Li, J. Effects of ecological restoration projects on land use and land cover change and its influences on territorial NPP in Xinjiang, China. Catena 2014, 115, 85–95. [Google Scholar] [CrossRef]
  12. Monteith, J.L. Solar Radiation and Productivity in Tropical Ecosystems. J. Appl. Ecol. 1972, 9, 747–766. [Google Scholar] [CrossRef] [Green Version]
  13. Field, C.B.; Randerson, J.T.; Malmström, C.M. Global net primary production: Combining ecology and remote sensing. Remote Sens. Environ. 1995, 51, 74–88. [Google Scholar] [CrossRef] [Green Version]
  14. Bondeau, A.; Kicklighte, D.W.; Kaduk, J. Intercomparison TPOFTPNM Comparing global models of terrestrial net primary productivity (NPP): Importance of vegetation structure on seasonal NPP estimates. Glob. Chang. Biol. 1999, 5, 35–45. [Google Scholar] [CrossRef]
  15. Zhang, R.; Liang, T.; Guo, J.; Xie, H.; Feng, Q.; Aimaiti, Y. Grassland dynamics in response to climate change and human activities in Xinjiang from 2000 to 2014. Sci. Rep. 2018, 8, 2888. [Google Scholar] [CrossRef] [PubMed]
  16. Donovan, L.A.; Dudley, S.A.; Rosenthal, D.M.; Ludwig, F. Phenotypic selection on leaf water use efficiency and related ecophysiological traits for natural populations of desert sunflowers. Oecologia 2006, 152, 13–25. [Google Scholar] [CrossRef]
  17. Zhao, J.; Xu, T.; Xiao, J.; Liu, S.; Mao, K.; Song, L.; Yao, Y.; He, X.; Feng, H. Responses of Water Use Efficiency to Drought in Southwest China. Remote Sens. 2020, 12, 199. [Google Scholar] [CrossRef] [Green Version]
  18. Guo, L.; Shan, N.; Zhang, Y.; Sun, F.; Liu, W.; Shi, Z.; Zhang, Q. Separating the effects of climate change and human activity on water use efficiency over the Beijing-Tianjin Sand Source Region of China. Sci. Total Environ. 2019, 690, 584–595. [Google Scholar] [CrossRef]
  19. Lu, X.; Chen, M.; Liu, Y.; Miralles, D.; Wang, F. Enhanced water use efficiency in global terrestrial ecosystems under increasing aerosol loadings. Agric. For. Meteorol. 2017, 237–238, 39–49. [Google Scholar] [CrossRef]
  20. Liu, X.; Feng, X.; Fu, B. Changes in global terrestrial ecosystem water use efficiency are closely related to soil moisture. Sci. Total Environ. 2019, 698, 134165. [Google Scholar] [CrossRef]
  21. Sun, S.; Song, Z.; Wu, X.; Wang, T.; Wu, Y.; Du, W.; Che, T.; Huang, C.; Zhang, X.; Ping, B.; et al. Spatio-temporal variations in water use efficiency and its drivers in China over the last three decades. Ecol. Indic. 2018, 94, 292–304. [Google Scholar] [CrossRef]
  22. Guo, L.; Sun, F.; Liu, W.; Zhang, Y.; Wang, H.; Cui, H.; Wang, H.; Zhang, J.; Du, B. Response of Ecosystem Water Use Efficiency to Drought over China during 1982–2015: Spatiotemporal Variability and Resilience. Forests 2019, 10, 598. [Google Scholar] [CrossRef] [Green Version]
  23. Zhao, T.; Dai, A. The Magnitude and Causes of Global Drought Changes in the Twenty-First Century under a Low–Moderate Emissions Scenario. J. Clim. 2015, 28, 4490–4512. [Google Scholar] [CrossRef]
  24. Zhao, J.; Feng, H.; Xu, T.; Xiao, J.; Guerrieri, R.; Liu, S.; Wu, X.; He, X.; He, X. Physiological and environmental control on ecosystem water use efficiency in response to drought across the northern hemisphere. Sci. Total Environ. 2020, 758, 143599. [Google Scholar] [CrossRef]
  25. Anderegg, W.R.L.; Schwalm, C.R.; Biondi, F.; Camarero, J.J.; Koch, G.W.; Litvak, M.; Ogle, K.; Shaw, J.D.; Shevliakova, E.; Williams, A.P.; et al. Pervasive drought legacies in forest ecosystems and their implications for carbon cycle models. Science 2015, 349, 528–532. [Google Scholar] [CrossRef] [PubMed] [Green Version]
  26. Schwalm, C.R.; Anderegg, W.R.L.; Michalak, A.M.; Fisher, J.B.; Biondi, F.; Koch, G.; Litvak, M.; Ogle, K.; Shaw, J.D.; Wolf, A.; et al. Global patterns of drought recovery. Nature 2017, 548, 202–205. [Google Scholar] [CrossRef]
  27. Yang, Y.; Guan, H.; Batelaan, O.; McVicar, T.R.; Long, D.; Piao, S.; Liang, W.; Liu, B.; Jin, Z.; Simmons, C.T. Contrasting responses of water use efficiency to drought across global terrestrial ecosystems. Sci. Rep. 2016, 6, 23284. [Google Scholar] [CrossRef] [Green Version]
  28. Zhang, X.; Moran, M.S.; Zhao, X.; Liu, S.; Zhou, T.; Ponce-Campos, G.E.; Liu, F. Impact of prolonged drought on rainfall use efficiency using MODIS data across China in the early 21st century. Remote Sens. Environ. 2014, 150, 188–197. [Google Scholar] [CrossRef]
  29. Linderson, M.-L.; Mikkelsen, T.N.; Ibrom, A.; Lindroth, A.; Ro-Poulsen, H.; Pilegaard, K. Up-scaling of water use efficiency from leaf to canopy as based on leaf gas exchange relationships and the modeled in-canopy light distribution. Agric. For. Meteorol. 2012, 152, 201–211. [Google Scholar] [CrossRef]
  30. Huang, L.; He, B.; Han, L.; Liu, J.; Wang, H.; Chen, Z. A global examination of the response of ecosystem water-use efficiency to drought based on MODIS data. Sci. Total Environ. 2017, 601–602, 1097–1107. [Google Scholar] [CrossRef]
  31. Zou, J.; Ding, J.; Welp, M.; Huang, S.; Liu, B. Assessing the Response of Ecosystem Water Use Efficiency to Drought During and after Drought Events across Central Asia. Sensors 2020, 20, 581. [Google Scholar] [CrossRef] [Green Version]
  32. Aizen, E.M.; Aizen, V.B.; Melack, J.M.; Nakamura, T.; Ohta, T. Precipitation and atmospheric circulation patterns at mid-latitudes of Asia. Int. J. Clim. 2001, 21, 535–556. [Google Scholar] [CrossRef]
  33. Wang, P.Y.; Li, Z.Q.; Li, H.L.; Wang, W.B.; Yao, H.B. Comparison of glaciological and geodetic mass balance at Glacier Urumqi No.1, Tian Shan, Central Asia. Glob. Planet Chang. 2014, 114, 14–22. [Google Scholar] [CrossRef]
  34. Li, Y.; Chen, Y.; Li, Z. Climate and topographic controls on snow phenology dynamics in the Tienshan Mountains, Central Asia. Atmos. Res. 2019, 236, 104813. [Google Scholar] [CrossRef]
  35. Ruimy, A.; Saugier, B.; Dedieu, G. Methodology for the estimation of terrestrial net primary production from remotely sensed data. J. Geophys. Res. Earth Surf. 1994, 99, 5263–5283. [Google Scholar] [CrossRef]
  36. Su, Z. The Surface Energy Balance System (SEBS) for estimation of turbulent heat fluxes. Hydrol. Earth Syst. Sci. 2002, 6, 85–100. [Google Scholar] [CrossRef]
  37. Monteith, J.L.; Reifsnyder, W.E. Principles of Environmental Physics. Phys. Today 1974, 27, 51–52. [Google Scholar] [CrossRef]
  38. Kustas, W.P.; Choudhury, B.J.; Kunkel, K.E.; Gay, L.W. Estimate of the aerodynamic roughness parameters over an incomplete canopy cover of cotton. Agric. For. Meteorol. 1989, 46, 91–105. [Google Scholar] [CrossRef]
  39. Propastin, P.; Kappas, M.; Muratova, N. Inter-annual changes in vegetation activities and their relationship to temperature and precipitation in Central Asia from 1982 to 2003. J. Environ. Inform. 2008, 12, 75–87. [Google Scholar] [CrossRef] [Green Version]
  40. Suo, Y.; Wang, Z.; Liu, C.; Yu, B. Relationship between NDVI and precipitation and temperature in middle Asia during 1982–2002. Resour. Sci. 2009, 31, 1422–1429. [Google Scholar]
  41. Lu, S.; Tian, F. Spatiotemporal variations of agricultural water use efficiency and its response to the Grain to Green Program during 1982–2015 in the Chinese Loess Plateau. Phys. Chem. Earth Parts A/B/C 2021, 121, 102975. [Google Scholar] [CrossRef]
  42. Liu, F.; Ye, X.; Guo, Q.; Li, X.; Liu, J. Spatio-temporal variation of carbon and water use efficiency of different land cover in the Poyang Lake Basin and their correlations with climate factors. Acta Ecol. Sin. 2021, 41, 1–13. (In Chinese) [Google Scholar]
  43. Patel, N.R.; Anapashsha, R.; Kumar, S.; Saha, S.K.; Dadhwal, V.K. Assessing potential of MODIS derived temperature/vegetation condition index (TVDI) to infer soil moisture status. Int. J. Remote Sens. 2008, 30, 23–39. [Google Scholar] [CrossRef]
  44. Liang, L.; Zhao, S.-H.; Qin, Z.-H.; He, K.-X.; Chen, C.; Luo, Y.-X.; Zhou, X.-D. Drought Change Trend Using MODIS TVDI and Its Relationship with Climate Factors in China from 2001 to 2010. J. Integr. Agric. 2014, 13, 1501–1508. [Google Scholar] [CrossRef]
  45. Yan, H.; Zhan, J.; Jiang, Q.; Yuan, Y.; Li, Z. Multilevel modeling of NPP change and impacts of water resources in the Lower Heihe River Basin. Phys. Chem. Earth Parts A/B/C 2015, 79–82, 29–39. [Google Scholar] [CrossRef]
  46. Hu, L.; Fan, W.; Ren, H.; Liu, S.; Cui, Y.; Zhao, P. Spatiotemporal Dynamics in Vegetation GPP over the Great Khingan Mountains Using GLASS Products from 1982 to 2015. Remote Sens. 2018, 10, 488. [Google Scholar] [CrossRef] [Green Version]
  47. Gao, X.; Gu, F.; Mei, X.; Hao, W.; Li, H.; Gong, D.; Li, X. Light and Water Use Efficiency as Influenced by Clouds and/or Aerosols in a Rainfed Spring Maize Cropland on the Loess Plateau. Crop. Sci. 2018, 58, 853–862. [Google Scholar] [CrossRef]
  48. Zheng, H.; Lin, H.; Zhu, X.-J.; Jin, Z.; Bao, H. Divergent spatial responses of plant and ecosystem water-use efficiency to climate and vegetation gradients in the Chinese Loess Plateau. Glob. Planet. Chang. 2019, 181, 102995. [Google Scholar] [CrossRef]
  49. Ponce-Campos, G.E.; Moran, M.S.; Huete, A.; Zhang, Y.; Bresloff, C.; Huxman, T.E.; Eamus, D.; Bosch, D.D.; Buda, A.R.; Gunter, S.; et al. Ecosystem resilience despite large-scale altered hydroclimatic conditions. Nature 2013, 494, 349–352. [Google Scholar] [CrossRef]
  50. Yang, S.; Zhang, J.; Han, J.; Wang, J.; Zhang, S.; Bai, Y.; Cao, D.; Xun, L.; Zheng, M.; Chen, H.; et al. Evaluating global ecosystem water use efficiency response to drought based on multi-model analysis. Sci. Total. Environ. 2021, 778, 146356. [Google Scholar] [CrossRef]
  51. Gang, C.; Wang, Z.; Chen, Y.; Yang, Y.; Li, J.; Cheng, J.; Qi, J.; Odeh, I. Drought-induced dynamics of carbon and water use efficiency of global grasslands from 2000 to 2011. Ecol. Indic. 2016, 67, 788–797. [Google Scholar] [CrossRef]
  52. Ji, Y.; Li, Y.; Yao, N.; Biswas, A.; Zou, Y.; Meng, Q.; Liu, F. The lagged effect and impact of soil moisture drought on terrestrial ecosystem water use efficiency. Ecol. Indic. 2021, 133, 103349. [Google Scholar] [CrossRef]
Figure 1. Map showing location of the TMS in China; rates of change in air temperature (a) and precipitation (b) during 2000–2020.
Sustainability 14 08191 g001
Figure 2. Annual NPP (a), ET (b), WUE (c), and TVDI (d) in the TMS during 2000–2020.
Sustainability 14 08191 g002aSustainability 14 08191 g002b
Figure 3. Temporal variation in WUE (a) and TVDI (b) under different land-use types during 2000–2020.
Sustainability 14 08191 g003
Figure 4. The spatial patterns of the average and change trend in NPP (a,b), ET (c,d), WUE (e,f), and TVDI (g,h) in the TMS from 2000 to 2020.
Sustainability 14 08191 g004aSustainability 14 08191 g004b
Figure 5. Spatial distribution of the correlation coefficients between WUE and temperature (a), precipitation (b), wind speed (c), sunshine duration (d), solar radiation (e) and TVDI (f) during 2000–2020 over the TMS.
Sustainability 14 08191 g005
Publisher’s Note: MDPI stays neutral with regard to jurisdictional claims in published maps and institutional affiliations.

