Abstract
Electricity demand forecasting is essential for utilities. For the consumer, predictability of demand is vital for efficient operation, installation, sizing and maintenance planning. Hospitals, which are among the institutions with high-energy consumption, provide uninterrupted service 24 h a day, 7 days a week. Every hospital building is unique, and many do not conform to a typical shape or floor plan. Depending on the services provided, each hospital can differ significantly in terms of energy demand. Therefore, demand forecasting is one of the most complex elements of hospital construction. Although there are many studies on energy optimization related to hospital buildings in the literature, there is a knowledge gap regarding the maximum power estimation of hospitals. In this study, the annual electrical energy use of 23 public hospitals with over 100 beds in Istanbul is measured, and after determining the monthly peak loads, two new forecasting models are generated using regression techniques for maximum demand forecasting. It is determined that the design criteria used in power calculations in hospitals was very high. A positive result was obtained from the linear regression technique, which is one of the basic regression techniques, and it was shown that the maximum power needs of the hospital can be estimated with great confidence by determining a new design factor in the light of the determined values. This study allows designers to set maximum demands and select transformer and generator sizes with a single formula.
1. Introduction
Electricity demand forecasting is essential for utilities, and balancing energy production and consumption becomes more accessible with demand forecasting. For the consumer, it is vital that demand must be predictable for efficient operation, installation, sizing and maintenance planning. There is extensive literature on demand forecasting worldwide. Kasule and Ayan built a hybrid model based on particle swarm optimization and artificial bee colony algorithms for the electricity consumption prediction of Uganda [1]. Mohamed and Bödger researched New Zealand’s electricity consumption and evaluated both residential and nonresidential users. Multiple linear regression was used in the estimation model, and it was considered to be efficacious when compared to the national estimates of the country [2]. Kavaklioglu et al., estimated Turkey’s electricity consumption up to 2027 using the Neural Network model [3]. According to Tumbaz et al., the energy demand in Turkey uses time series and neural networks as well as regression techniques. They concluded that the ridge regression technique gave very good estimates [4]. Toksarı et al., Kankal et al., Oğcu et al., and Kıran et al., also use various estimates of Turkey’s energy demand forecasting methodologies [5,6,7,8]. However, there are relatively few studies in the literature for hospital demand forecasting. Bertolini et al., used the data of two hospitals in Italy, created the Artificial Neural Network model and reached approximately 75% accurate predictions [9]. According to Cao et al., the accuracy of eight machine learning models was trained on daily and weekly datasets from a general hospital in Shanghai. It was concluded that RF, XGBoost and SVR are the most accurate learning models for hospital daily electrical load estimation [10]. Sotelo et al., Bagnasco et al., and Runge et al., built an Artificial Neural Network model for hospital electrical load estimation. [11,12,13]. The models have proven to be very efficient at forecasting demand.
Hospitals are areas that always play an indispensable role in human life. Hospitals provide 24/7 uninterrupted service [14]. According to the data of Istanbul Provincial Health Directorate as a cultural capital, financial and health center, there are 25 international training and research hospitals and 33 public hospitals in Istanbul [15]. Every hospital building is unique and does not conform to a typical shape or typical floor plan. Depending on the services provided and their designers, each hospital can differ significantly from one another [16]. There are special heating, cooling and ventilation systems used by thousands of patients, employees and visitors every day in hospitals. In addition, imaging (MRI, CT), operating room, intensive care unit, sterilization, laundry, laboratory, computer and server use, kitchen, etc. exist in hospitals. There are many energy-intensive activities [17,18]. For this reason, hospitals consume more energy compared to other building types [19]. According to a report by the US Energy Information Administration, large hospitals—200,000 square feet or more—accounted for 5.5 percent of the total energy used by the commercial sector in 2007, although they account for less than 1% of all commercial buildings and 2% of commercial floor area in the United States [20]. Another study by Neal concluded that the energy consumption of hospitals is more than 2.5 times that of commercial buildings [21].
However, despite all this technical infrastructure, installation optimization is overlooked because the system design is generally made according to regulations. The installed electricity capacity of the hospital is calculated according to the regulation without any demand forecasting. Thus, the entire infrastructure is designed in line with this value, which is often much more than demand. For this reason, in this study, annual electrical energy use and annual peak loads of 23 public hospitals with 100 beds or more are determined, and the values found are compared with the design criteria specified in the regulation. In the light of the determined values, a regression model is employed to determine a new design factor. In this model, after the completion of the application project for a new hospital, the total construction area and installed power, which are the known basic elements, and the maximum power estimation algorithm are generated. Then, a method similar to the empirical calculation of power per unit area (VA/m2) for schools in the US National Electrical Code was designed as an option.
Demand forecasting is one of the most complex yet fundamental parts of hospital construction [22]. Although there are many studies on energy optimization in the literature [23,24,25,26,27], there is a lack of information about the maximum power estimation of hospitals.
This study aims to determine a new demand factor for maximum demand forecasting using a different approach from the previous literature. The novelty and scientific significance of this study lies in the methodology, which simply and systematically assesses the maximum demand effectiveness. The system capacity is the result of the sum of the electrical powers of each load. There is no estimation method for how much these devices will work or how many of them will work at the same time. Since the only constant value that is known is the system capacity, the maximum demand estimate with the system capacity has enabled effective results to be obtained.
2. Hospital Data and Analysis Methods
2.1. Hospital Data
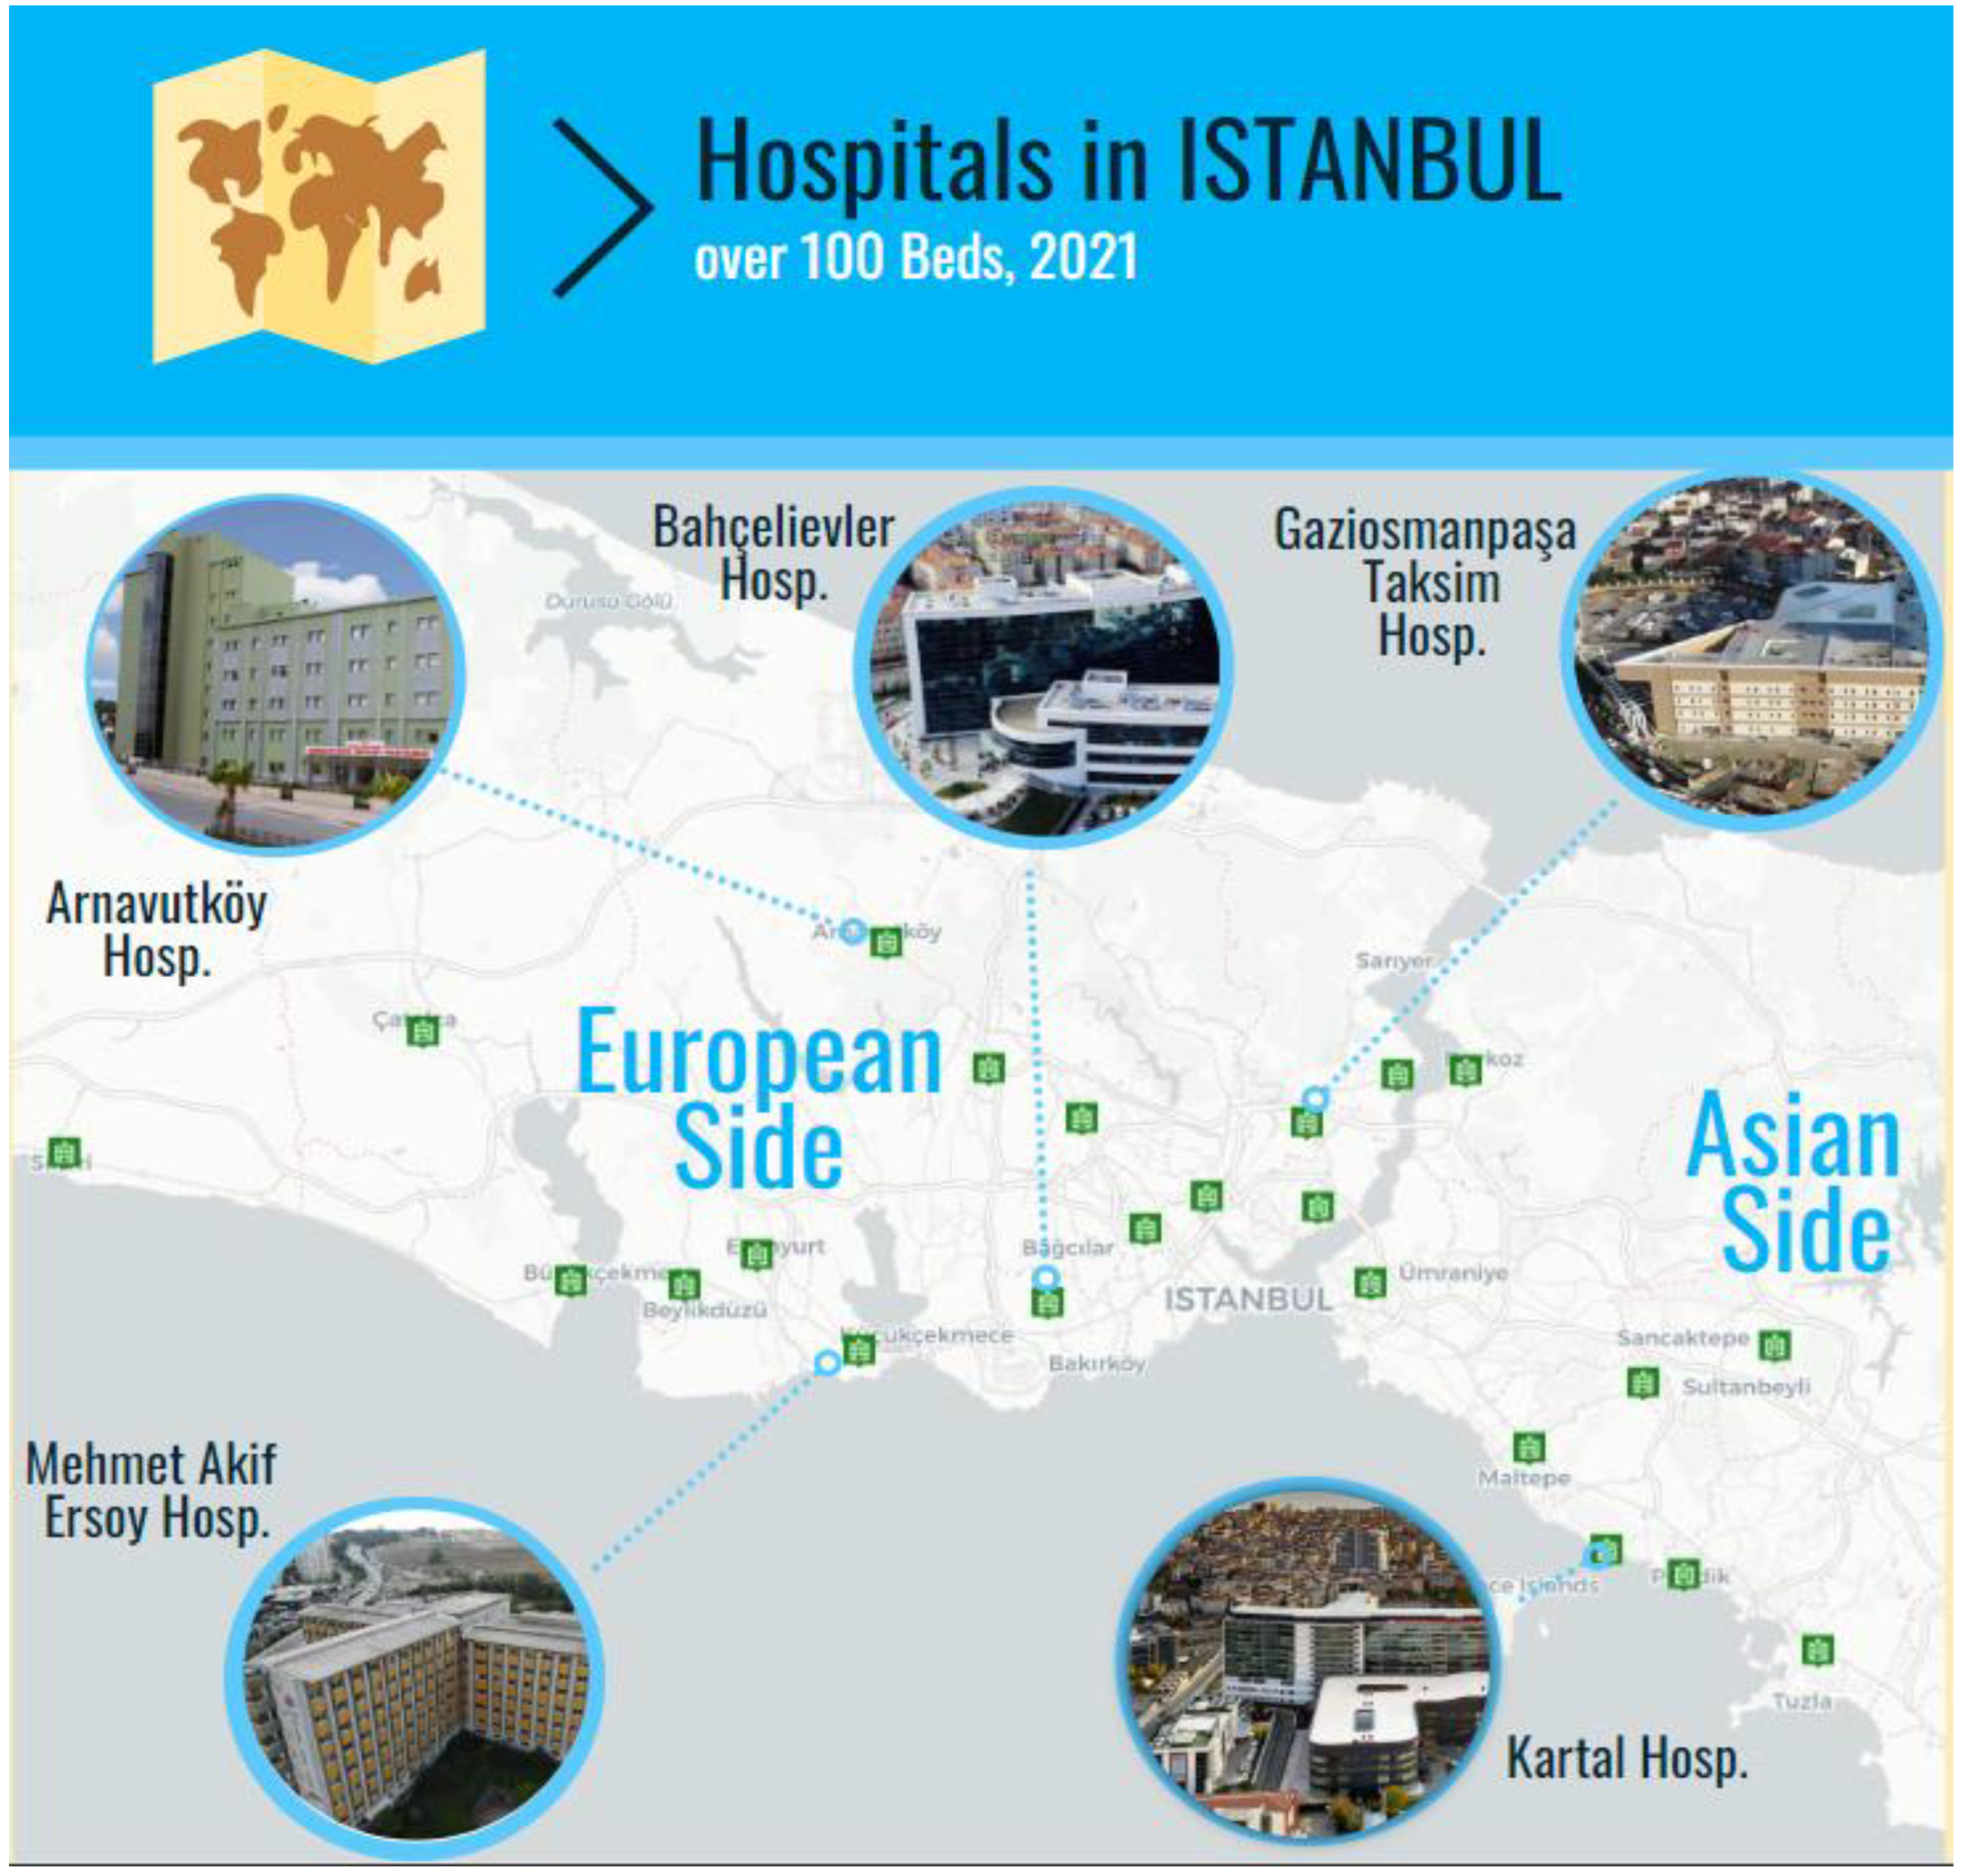
The annual electrical energy usage of 23 public hospitals with more than 100 beds in Istanbul was measured, and monthly peak loads were determined. The hospitals subject to the study are shown on the map in Figure 1.

Figure 1.
Hospitals in Istanbul.
The number of beds, total closed area, installed power and contract authorizations of 23 public hospitals with 100 beds or more in Istanbul are obtained from the records of the Istanbul Provincial Health Directorate. In addition, the peak power data for 2020 are determined from the electricity meters of the hospital. The data obtained are given in Table 1 [28,29].

Table 1.
Hospital data.
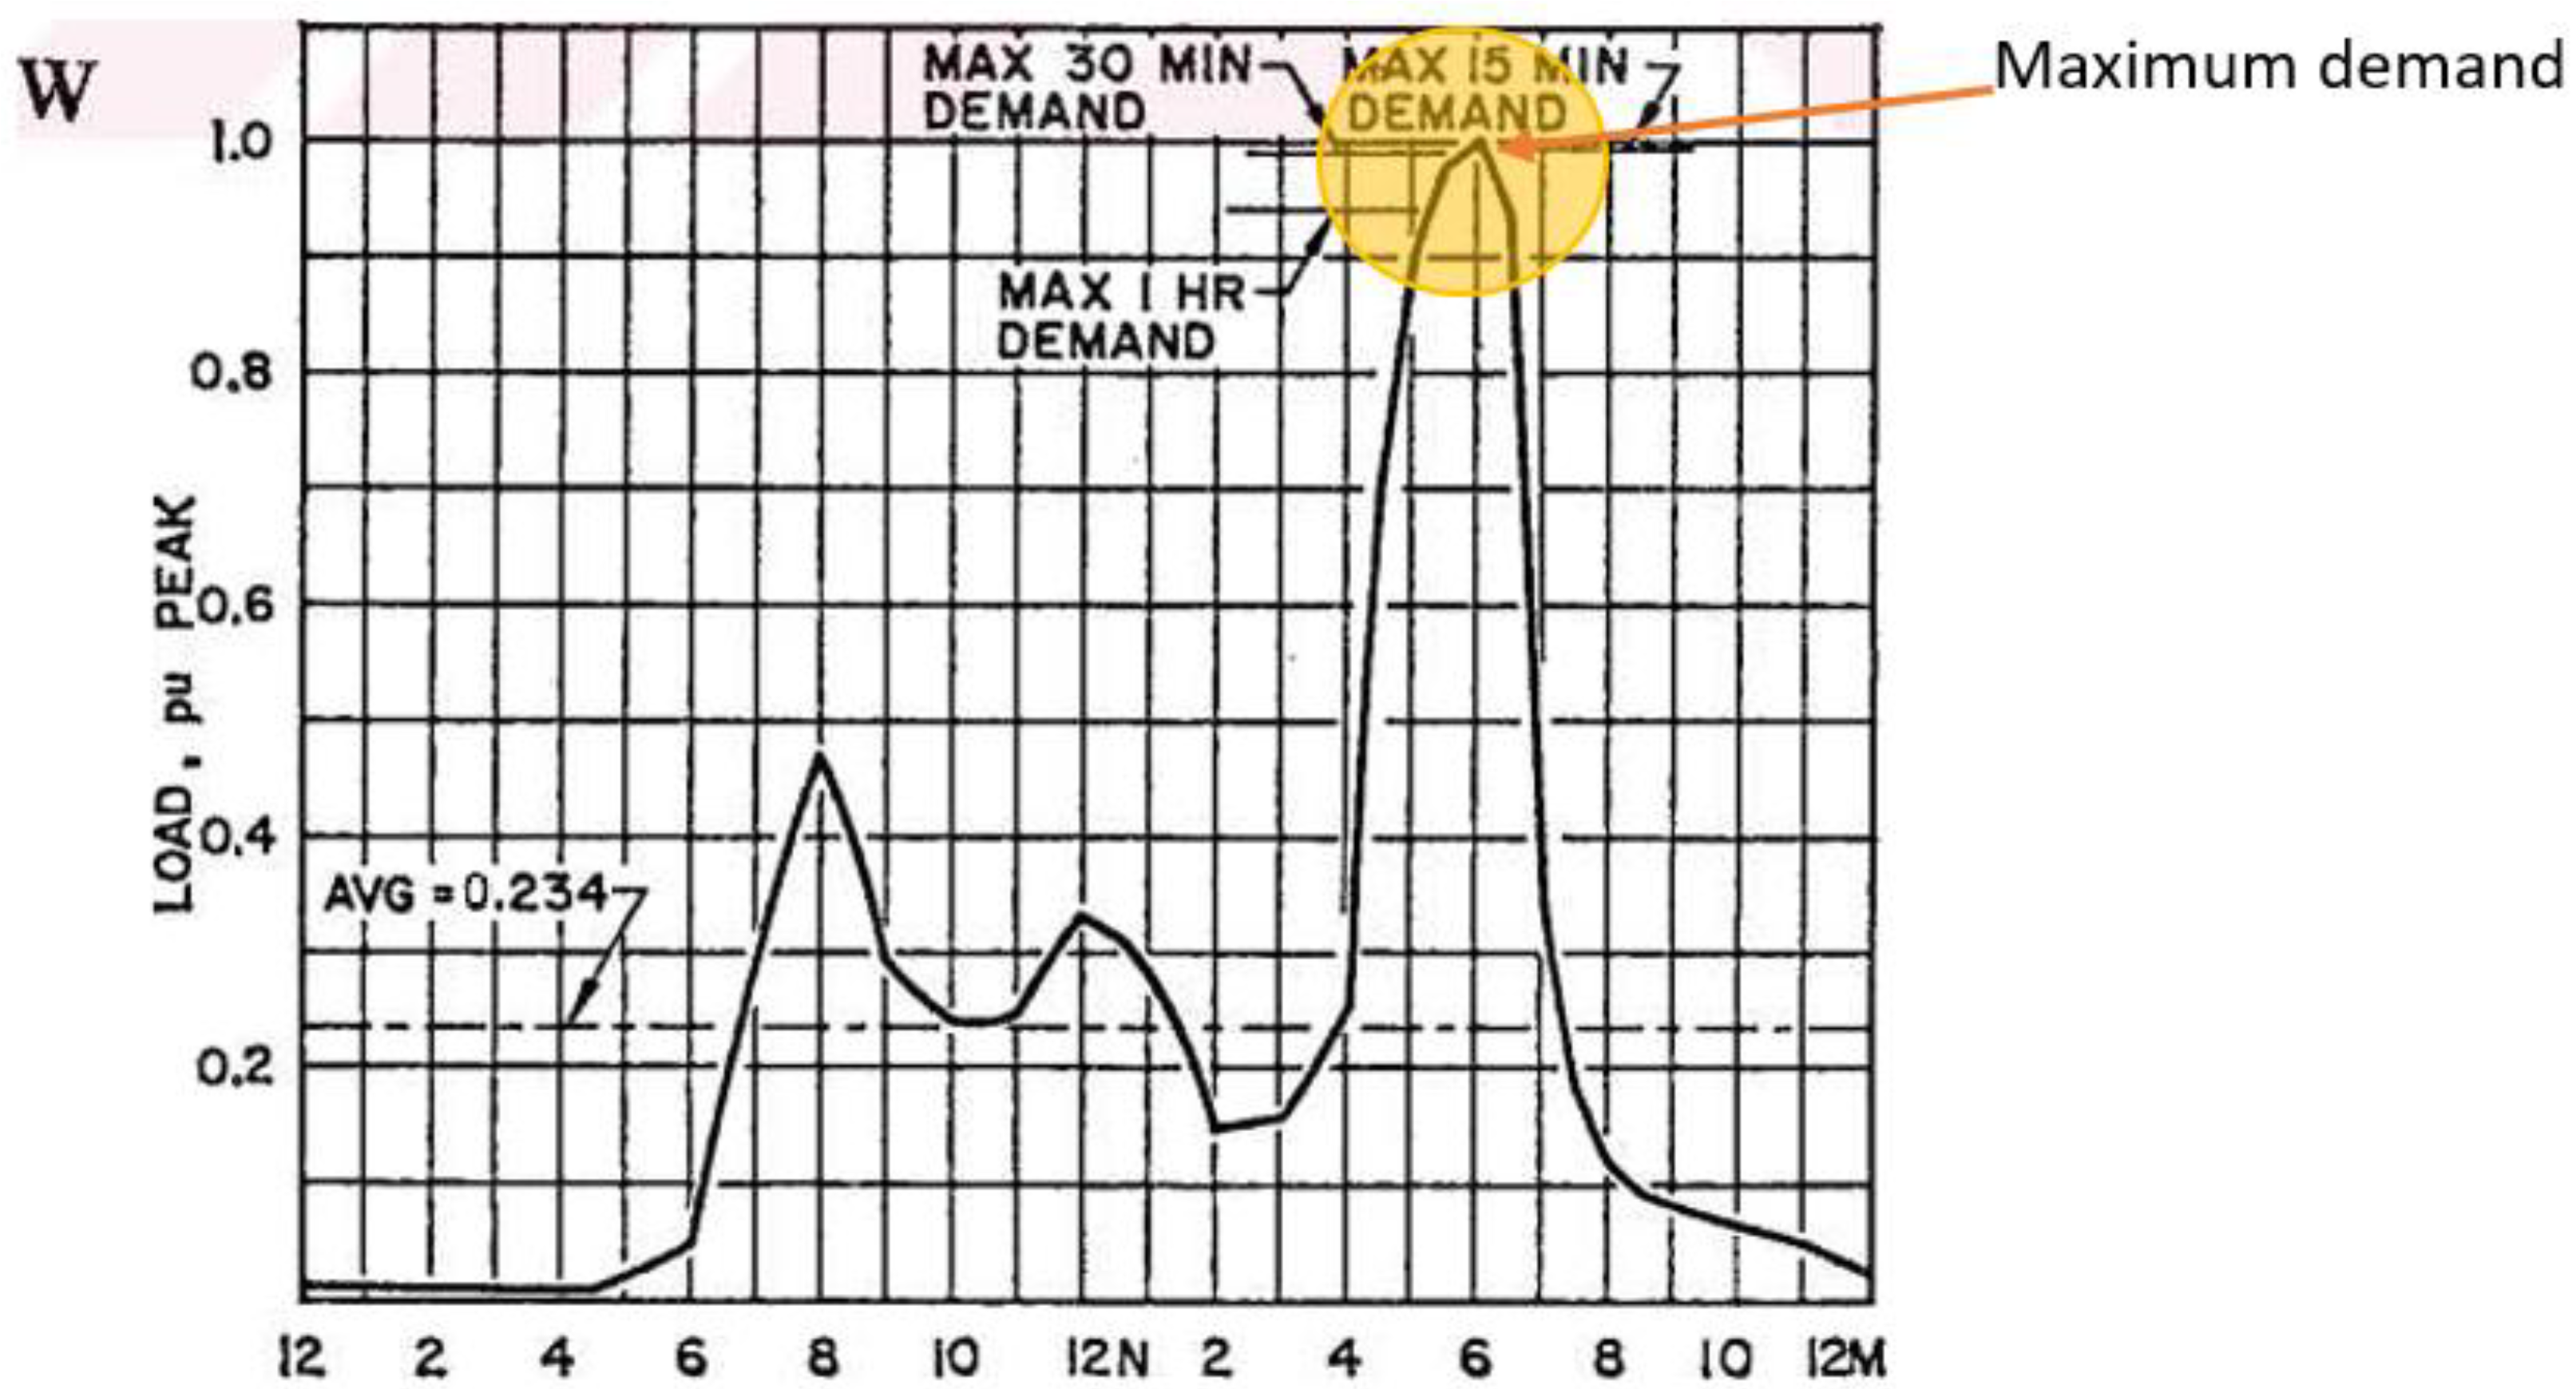
Consumers often do not operate simultaneously and not all are at their full rated power. The actual power is therefore always less than the sum of the rated power of all individual users. The most important criterion in planning and projecting a distribution system is the calculation of the current load density and load characteristics and the determination of future changes in loads. To design systems economically, demand load, maximum demand, maximum overlap demand can be calculated from the system installed load. The measurement results need to be obtained to calculate data based on the overlap factor, diversity factor, load factor, and other load characteristics. Demand is the average load received from the grid in a given period. Active power can be reactive power, apparent power or current as expressed in A, kW, kVAr, or kVA. The time interval in which the load is averaged is called the “Demand Interval”, which is selected as 15, 30, 60 min or more, taking into account factors such as the loading time and the thermal time constant of the system consuming the load. The demand range and the changes in demand for a given load are shown in Figure 2 [30].
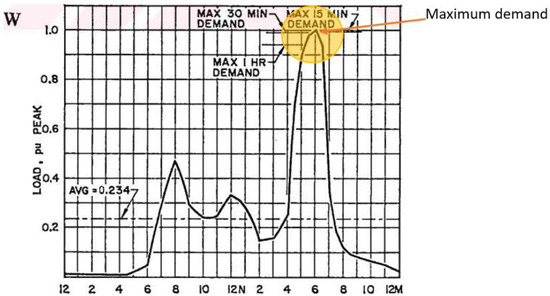
Figure 2.
Demand interval and changes in demand.
2.1.1. Demand Factor
Demand Factor is the ratio of the Maximum demand of a system to the Total Connected Load. It is dimensionless and is expressed as a percentage. If all consumers in the network load at their own power values at the same time, it reaches “1”. Sometimes the Demand Factor value can be greater than 1 and this is called an “overload”. However, the Demand Factor is usually less than one [31].
2.1.2. Coincidence Factor
The coincidence factor (CF) is the ratio of the group maximum demand or maximum overlap demand to the sum of the individual maximum demands of the loads.
Coincidence factor is the inverse of the diversity factor.
CF is always smaller than 1 (CF < 1) [32].
The 57th article of the Turkish Electricity Indoor Installations Regulation, the overlapping peak demand calculation, is made as follows.
In workplaces, administrative buildings, social buildings, health buildings and similar places, accidental loads, installed load, lighting load, socket load, mechanical installations excluding spares, winter-summer load, elevator load, and kitchen load whichever are more taken into consideration. The coincidence factor of the mechanical installation should be taken as 100%, and the coincidence factor of 70% for the kitchen load. Conflict factors for lighting, socket and elevator load should be taken from the list in Table 2 [33].
Table 2.
Coincidence factor.
The same values for the hospitals in Table 1 are also found in Table 3, which is numbered as 220.42 in NFPA70 (US National Electrical Code, National Fire Protection Association, MA, USA) [34].
Table 3.
Lighting load demand factors.
Another method is to determine the volt-ampere level per unit area. This method is given in Table 4, only for lighting, which is numbered 220.12 in NFPA70 (US National Electrical Code, National Fire Protection Association, MA, USA) [34].
Table 4.
General lighting load by occupancy.
Apart from all of these, it is stated in the NFPA70 (US National Electrical Code, National Fire Protection Association, MA, USA) 220.86 table that a method different from the standard calculations can be used for schools. Table 5 gives an empirical calculation method by determining the power per unit area [34].
Table 5.
Optional method—Demand factors for feeders and service conductors for schools.
2.2. Methods
Linear Regression: Linear regression is a statistical technique used for finding a relation between two or more variables. If the relation is found between two variables, it is called simple linear regression. Linear regression is a quite simple method to fit the curve and find the coefficients. The model takes the form y = mx + c, where m is the slope of the curve and c is the intercept. The parameter x is the independent variable. F(x) is the dependent variable. The aim is to find the coefficients m and c with the help of available data of x and y.
Performance Evaluation: There are different measures to evaluate the performance of the forecasted result.
Mean Squared Error (MSE): It is measured by finding the mean of squares of errors at every point.
where Yi is the value of actual dependent variable at the ith instant of independent variable. Xi is the value of forecasted variable at the ith instant of. N is the number of independent variable instances.
Root Mean Squared Error (RMSE): It is measured by square root of mean of square of difference between forecasted variable value and actual output.
Mean Absolute Percentage Error (MAPE): It is also known as Mean Absolute Percentage Deviation (MAPD). It is one of the most accurate and most popular measures of finding the performance.
In this study, a linear regression model is created for maximum load estimation, and the relationship between maximum demand and installed power is determined. In addition, it is aimed to use a method similar to the elective method given for schools in Table 5 by normalizing the maximum demand per unit area.
3. Results
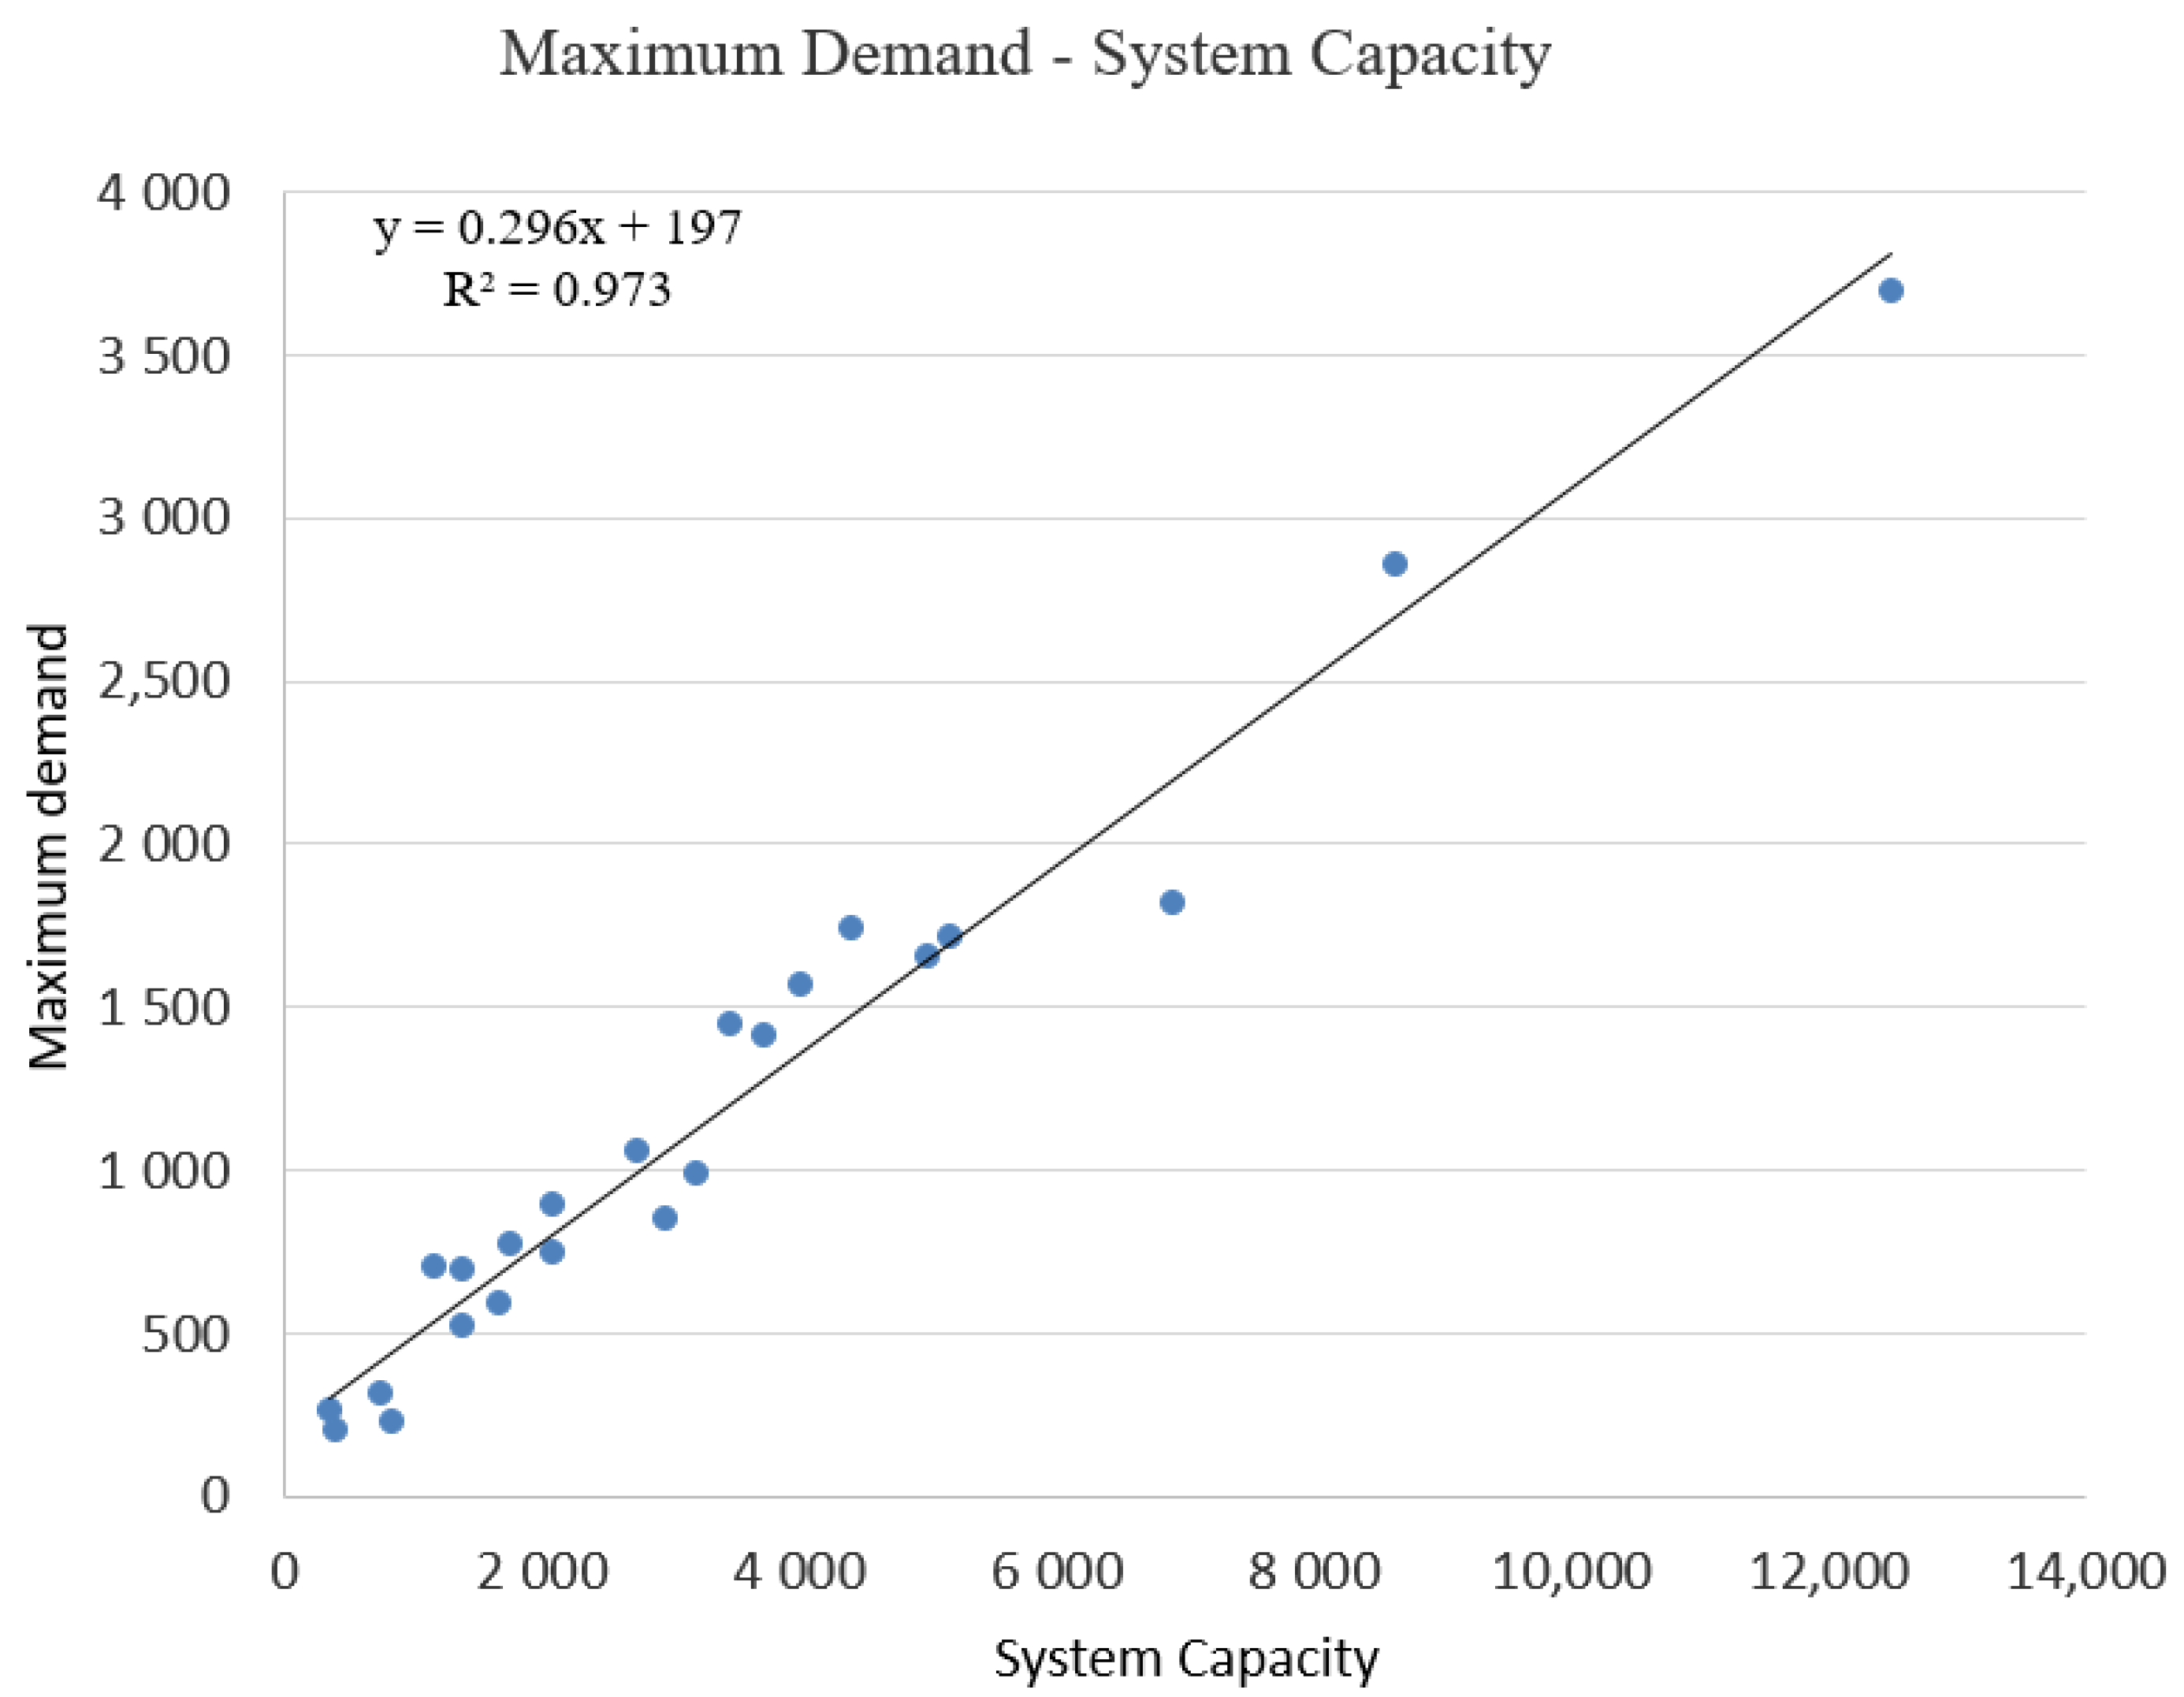
The basic elements that can be known in hospital design are the number of beds, the total closed area, and the system capacity. It has been determined that the only factor affecting the maximum demand among these factors is the system capacity. Accordingly, using the data in Table 1 of 23 public hospitals with over 100 beds, the relationship between system capacity and maximum demand is given in Figure 3. Regression models are used to estimate the maximum demand.

Figure 3.
Maximum demand curve.
3.1. Formula 1
It is concluded that there is a linear relationship between the maximum demand and the system capacity. The formula of the curve obtained as a result of linear regression is y = 0.296x + 197. For maximum demand and system capacity, coefficients have been found as 0.296 (slope) and 197 (intercept). The error performances obtained are MSE = 49, 648.75, RMSE = 222.820, MAPE = 9.857.
As a result, it is found that the maximum demand in hospitals with over 100 beds can be determined by the following formula.
MD = 0.296 (SC) + 197
MD: Maximum demand (kVA)
SC: System capacity (kVA).
The values specified in the formula adapted to the regulation are given in Table 6.
Table 6.
Demand factors for feeders and service conductors for hospitals.
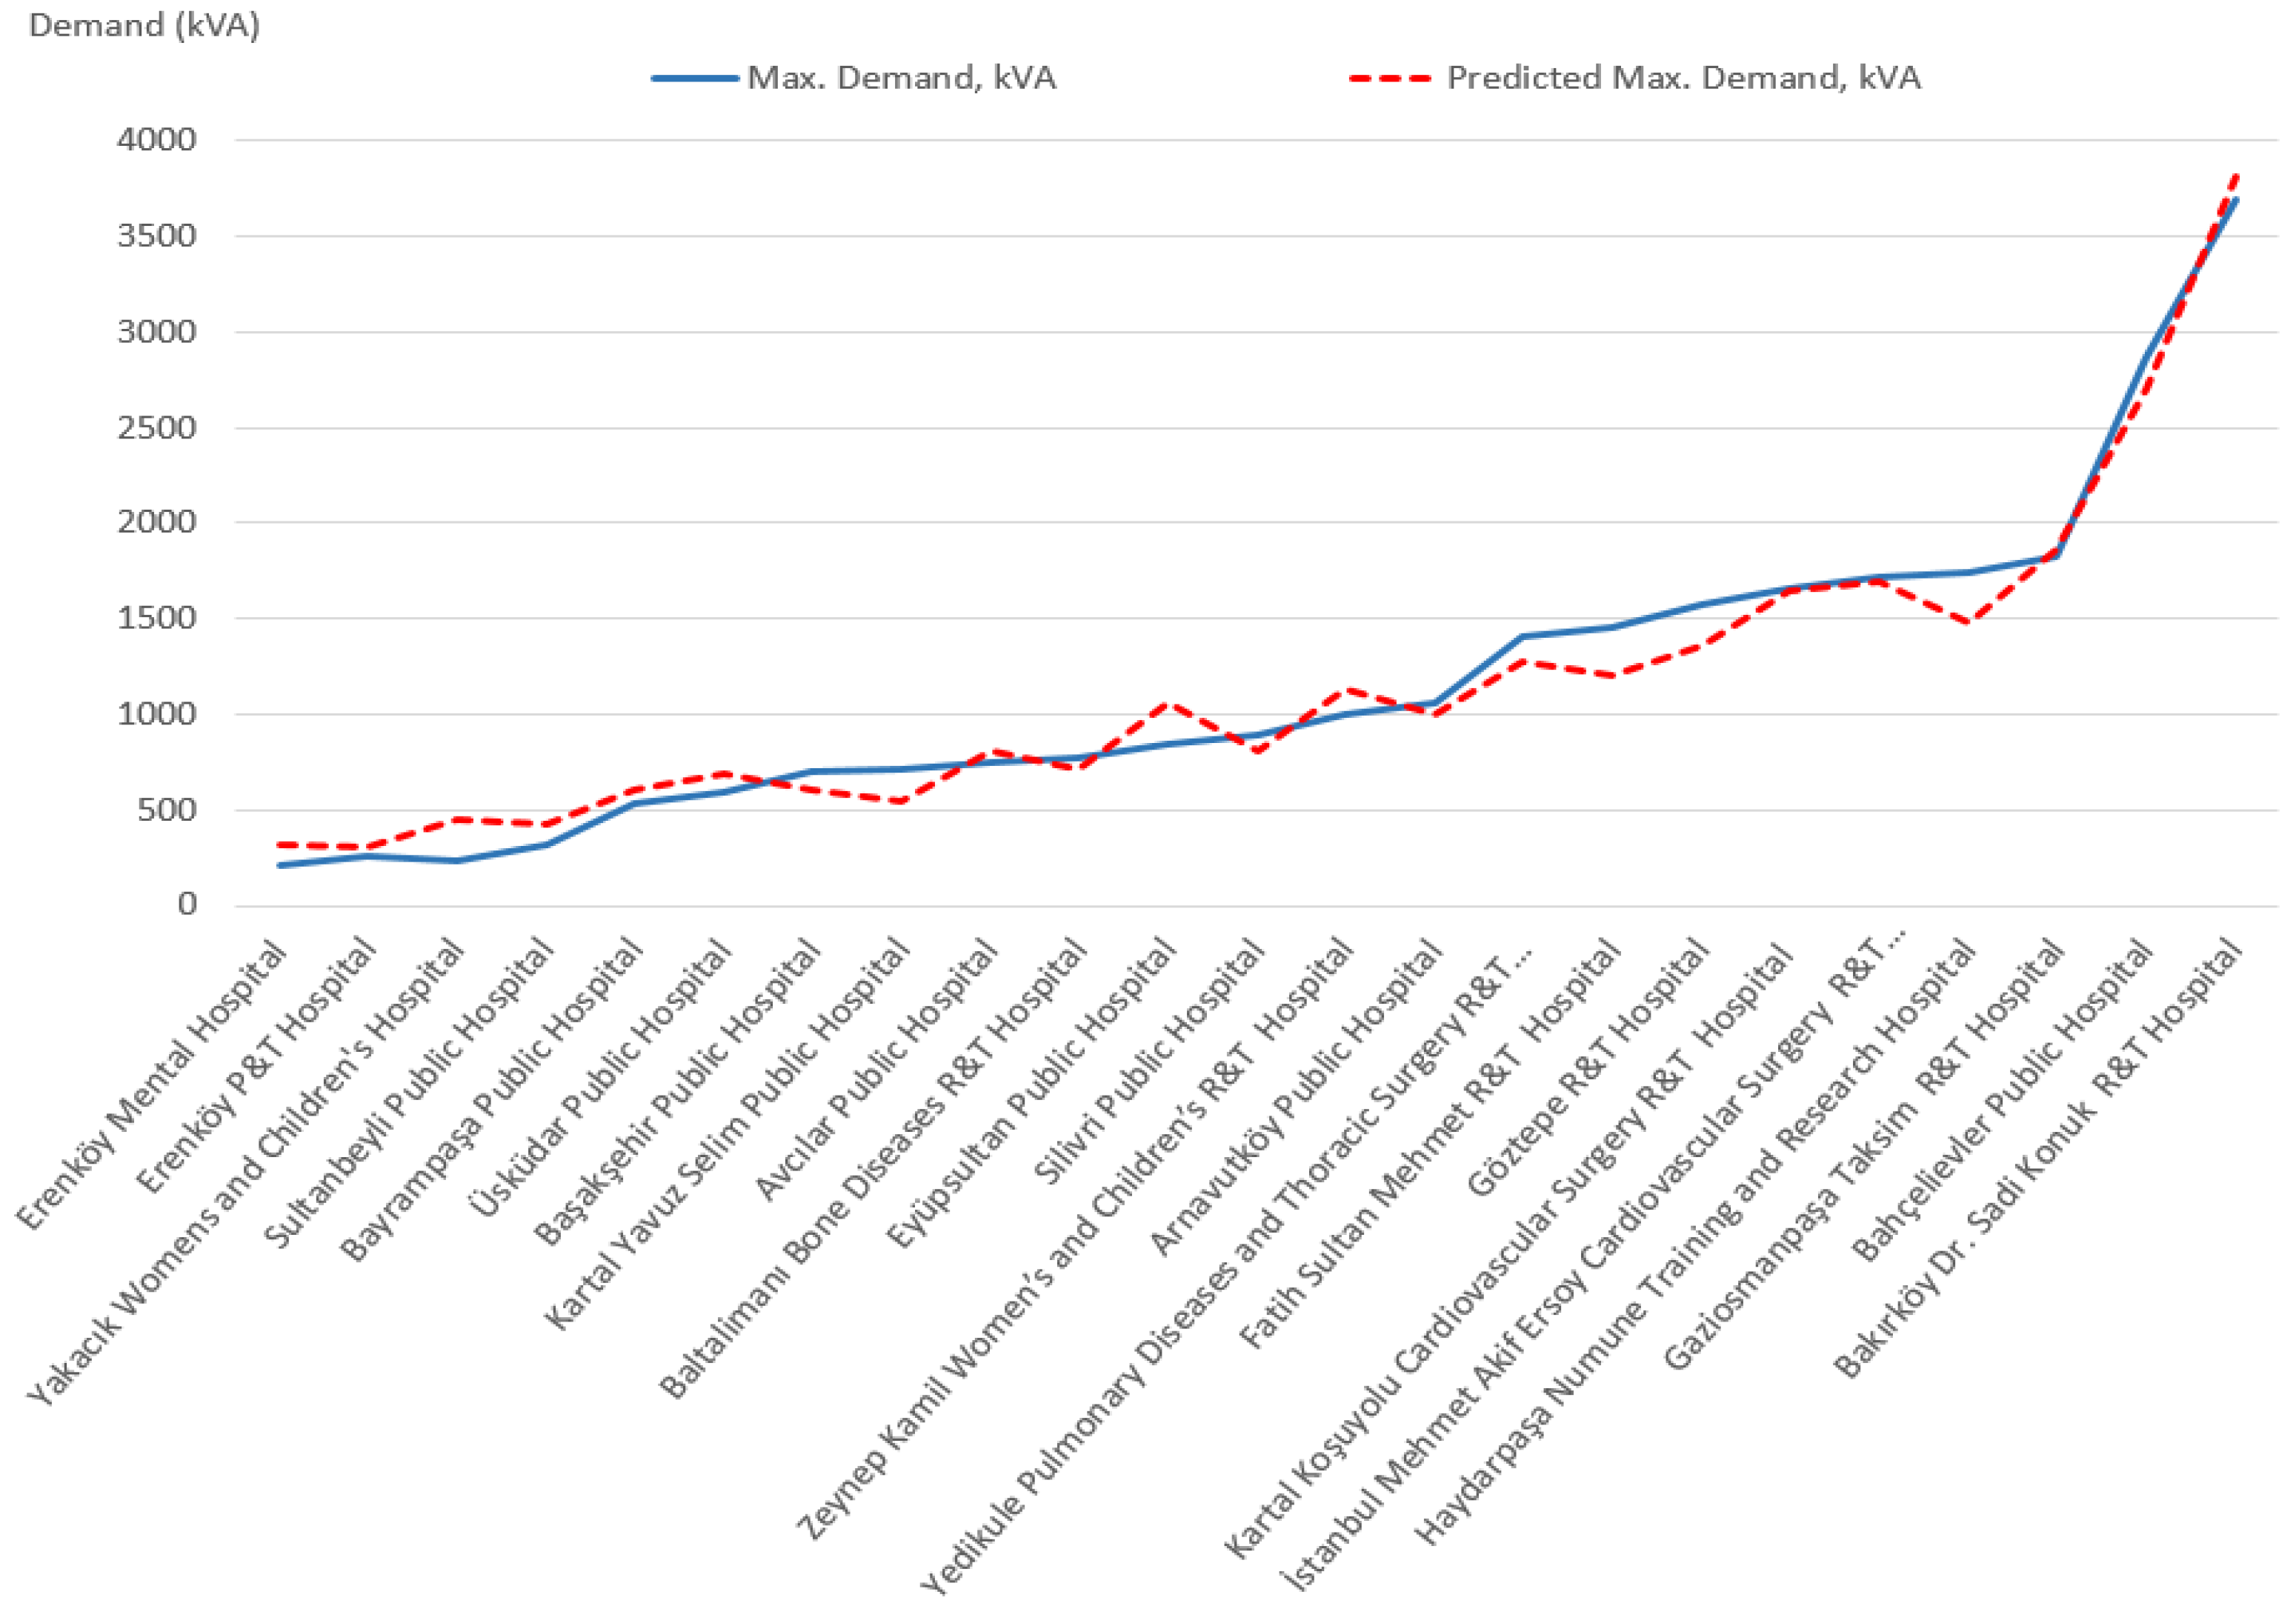
This formula differs from the coefficients in the current regulations in that it does not have to calculate the loads (lighting, mechanical, etc.) one by one. If the system capacity is known, the maximum demand can be calculated with a single formula. The actual and forecasted maximum demands are given in Figure 4.
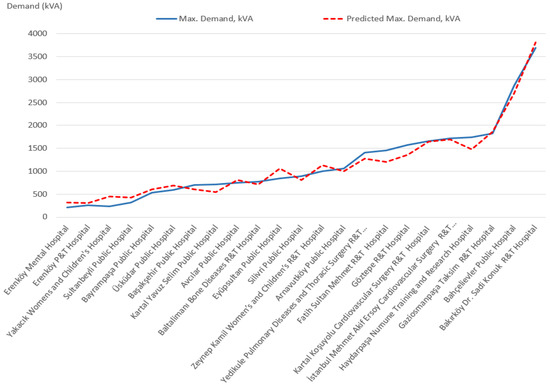
Figure 4.
Actual and predicted max demand.
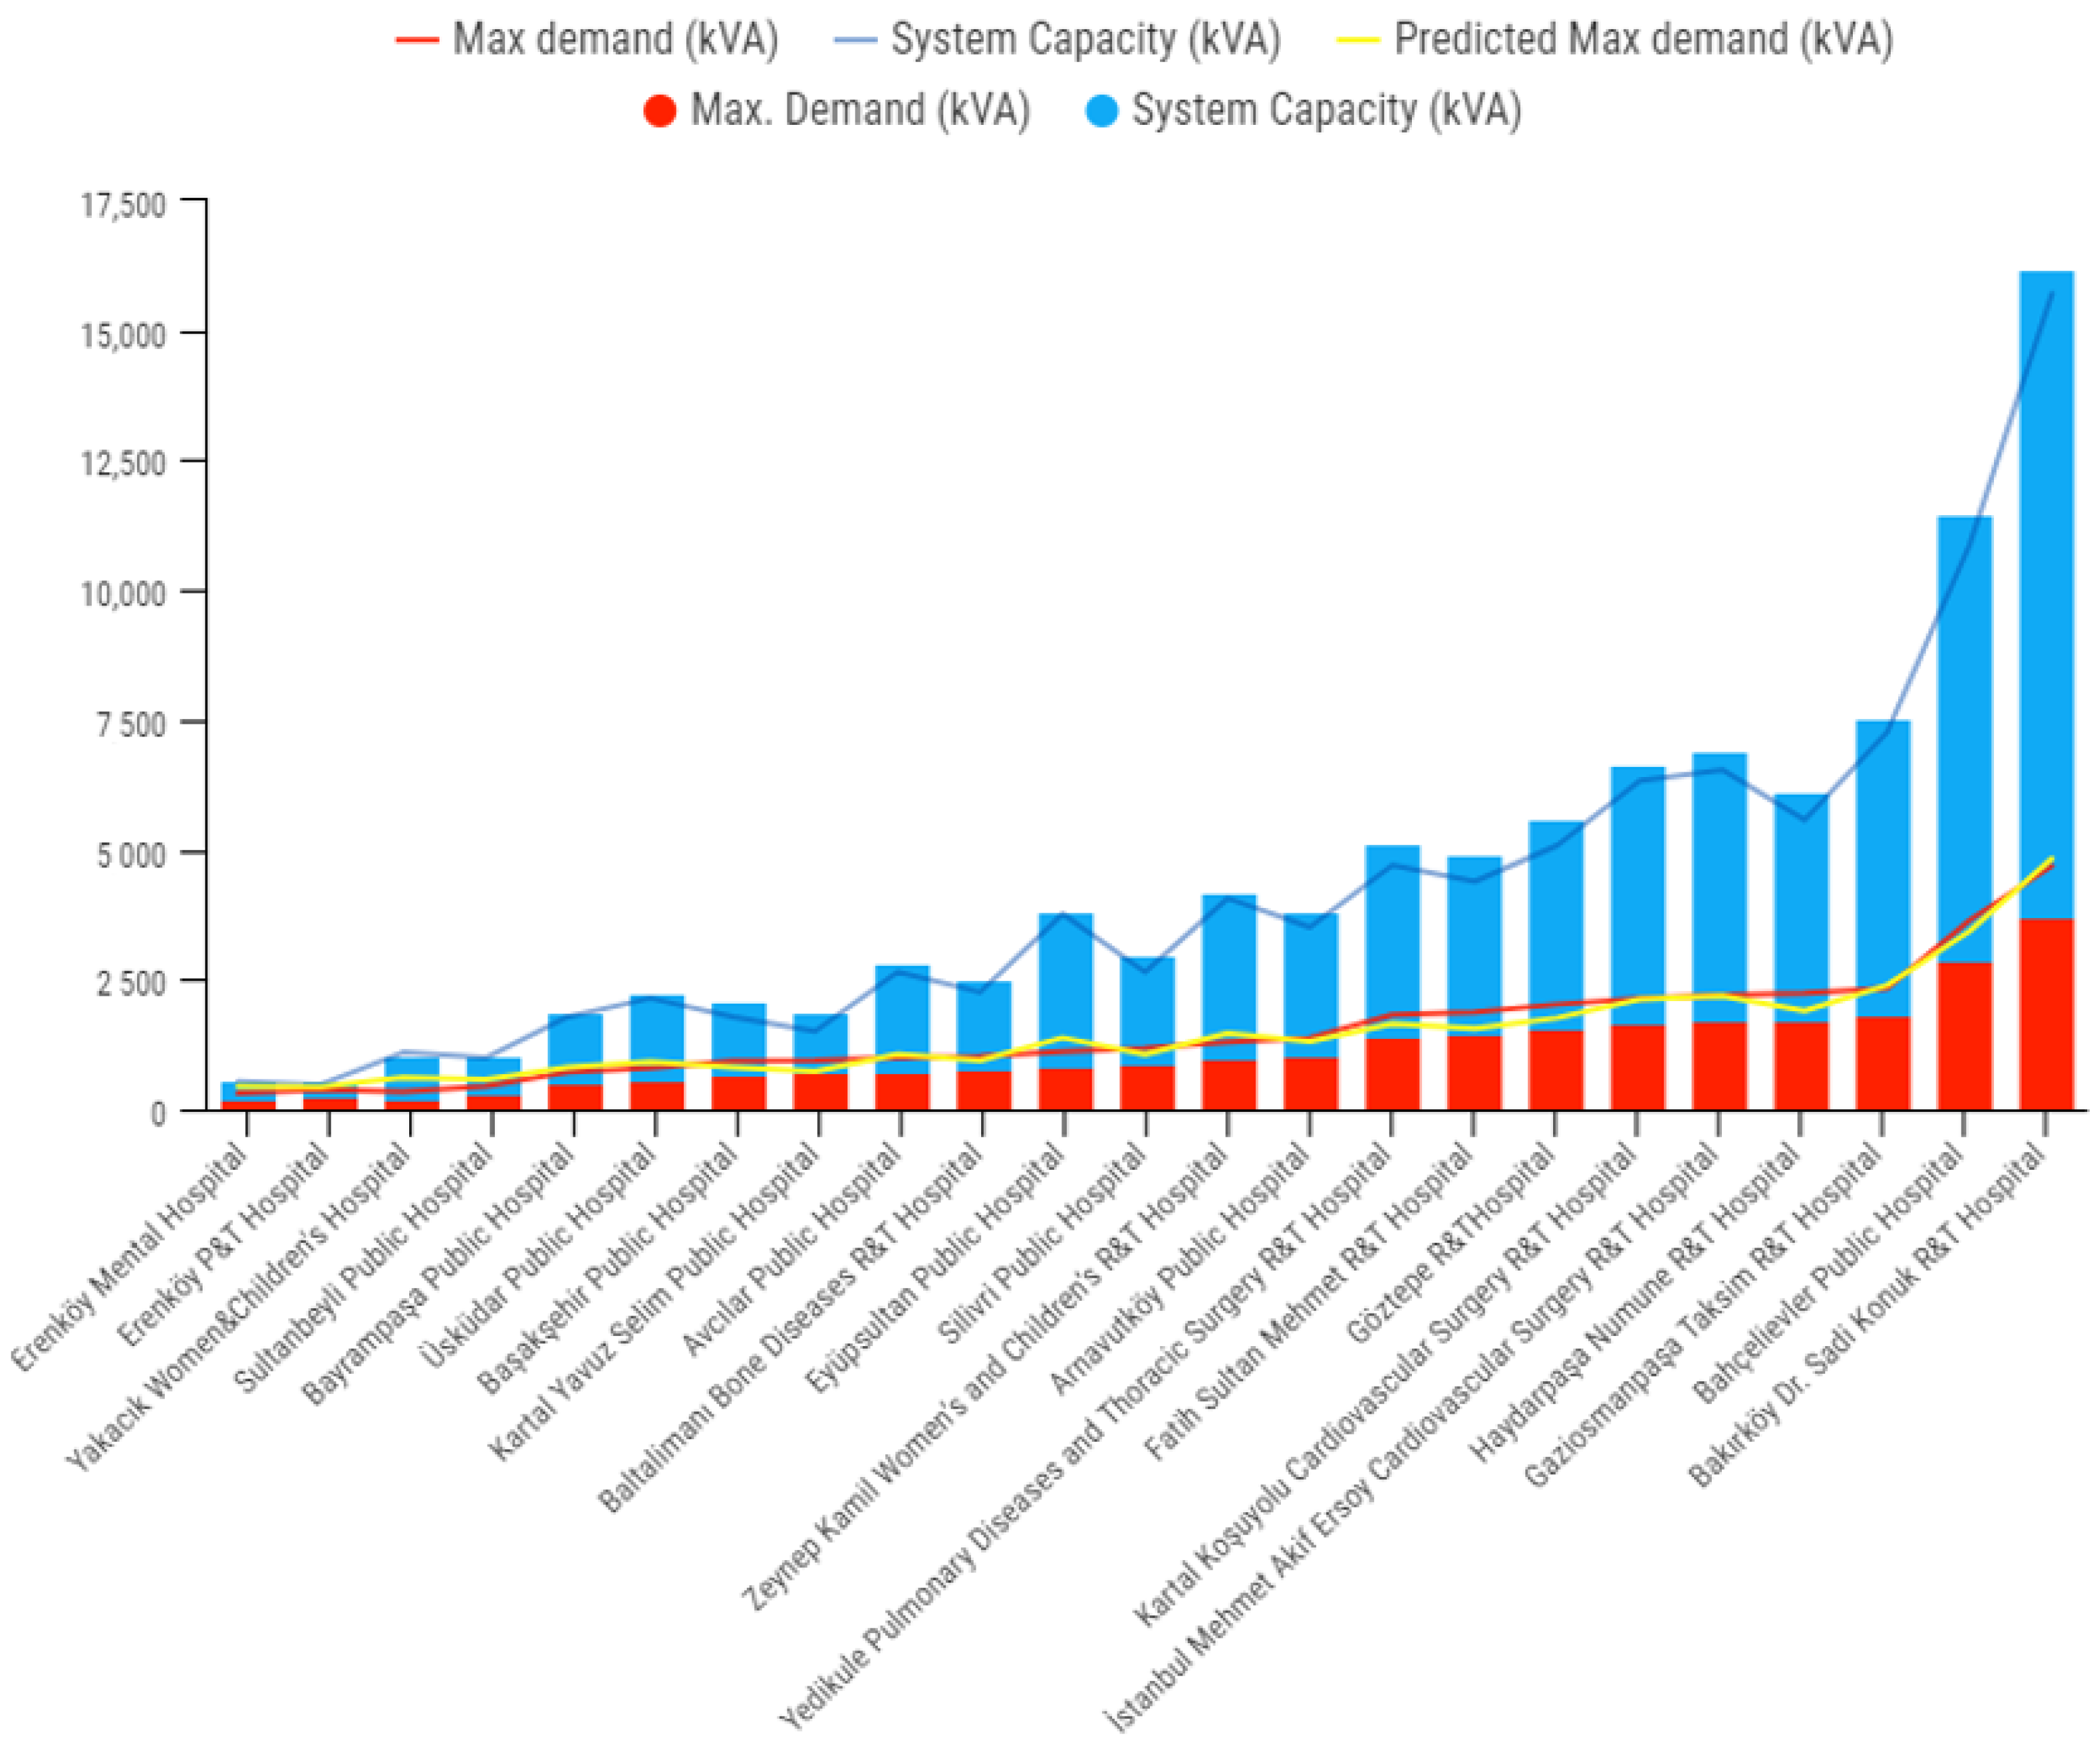
The relationship between system capacity, actual maximum demand, and predicted maximum demand is given in Figure 5.

Figure 5.
System capacity, actual and predicted max demand.
It is concluded that hospitals use about one-third of their system capacity. While preparing the hospital electrical projects according to the values in the regulation, transformer and generator capacities are selected almost three times more than the need, and idle capacity is created.
3.2. Formula 2
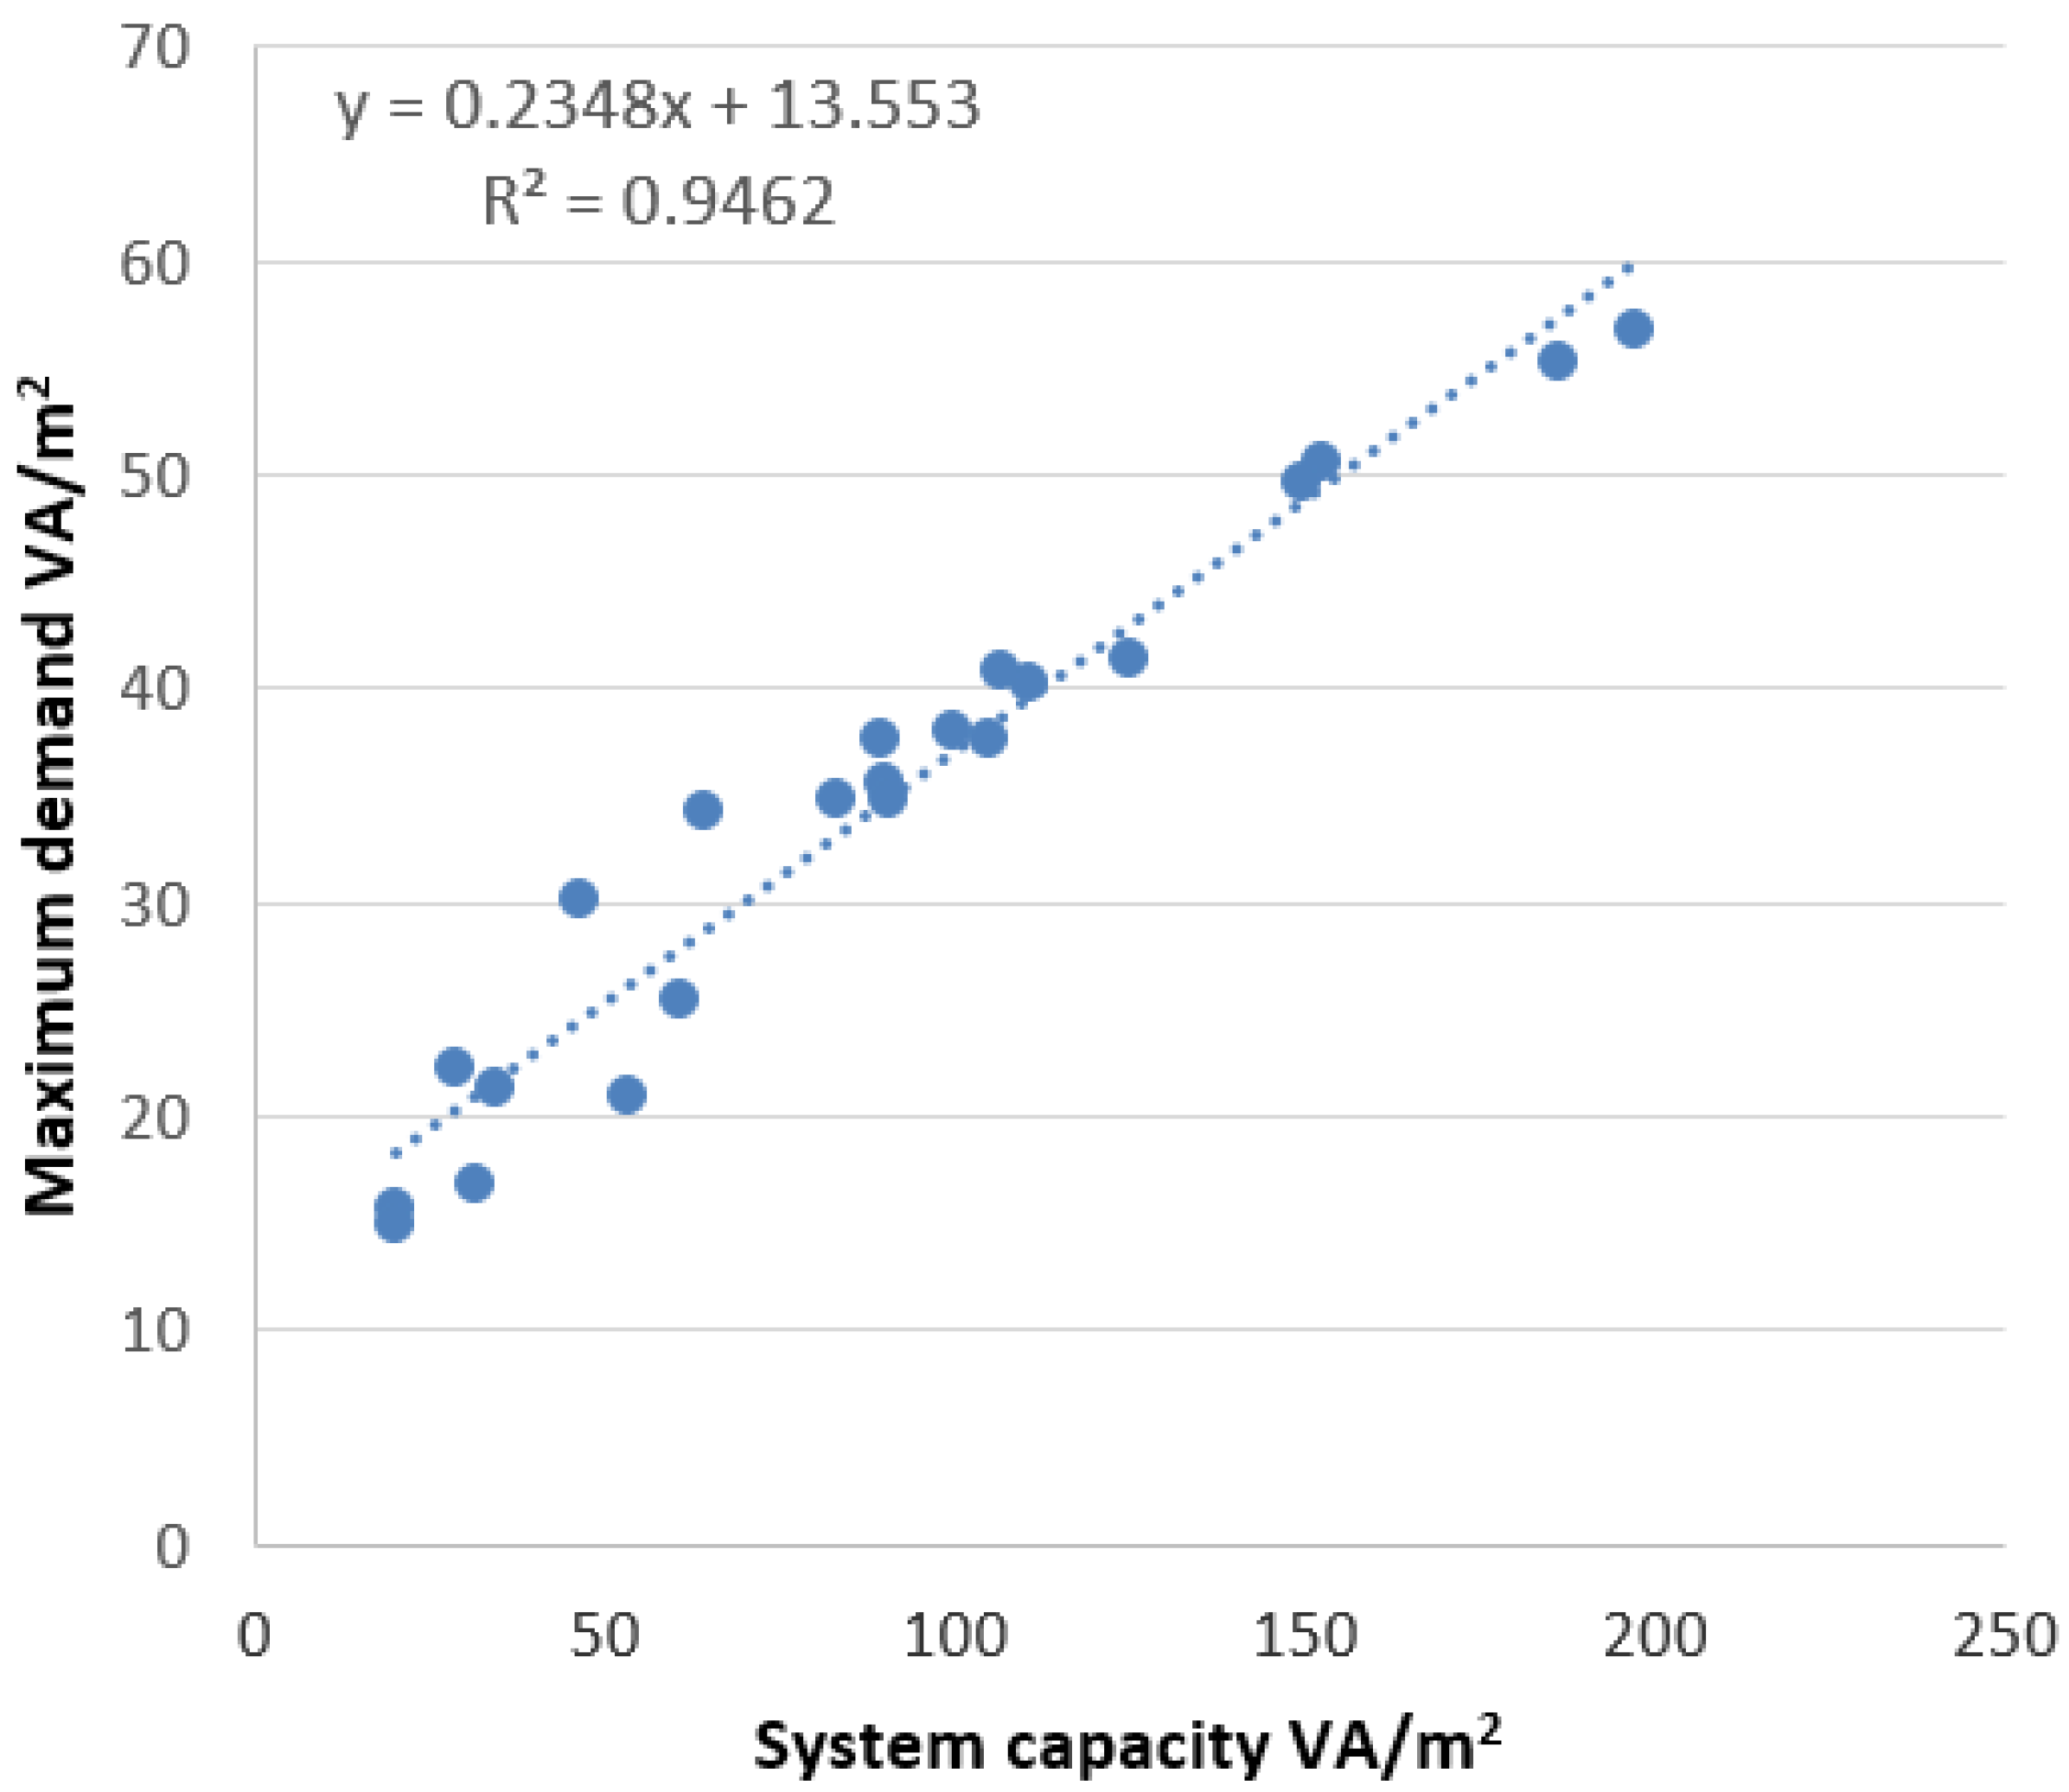
Another method is used to determine the volt-ampere level per unit area, such as the 220.86 table in NFPA70 (US National Electrical Code, National Fire Protection Association, MA, USA). According to the data in Table 1, the maximum demand per unit area is determined by the curve fitting method given in Figure 6.
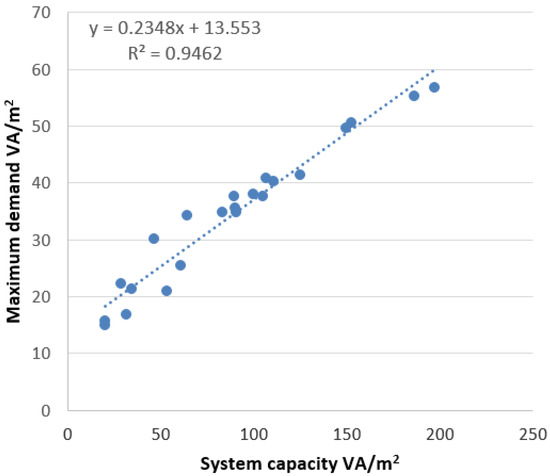
Figure 6.
Maximum VA/m2 curve.
It is concluded that there is a linear relationship between the maximum demand per area and the system capacity per area. The formula of the curve obtained as a result of linear regression is y = 0.2348x + 13.553. For maximum demand, system capacity coefficients have been found as 0.2348 (slope) and 13.553 (intercept). The error performances obtained are MSE = 0.0049, RMSE = 0.07, MAPE = 10.77.
As a result, it is found that the maximum demand per area in hospitals with over 100 beds can be determined by the following formula.
MD: Maximum demand (VA)
SC: System Capacity (VA)
The values specified in the formula adapted to the regulation are presented in Table 7.
Table 7.
Optional method-Demand factors for feeders and service conductors for hospitals.
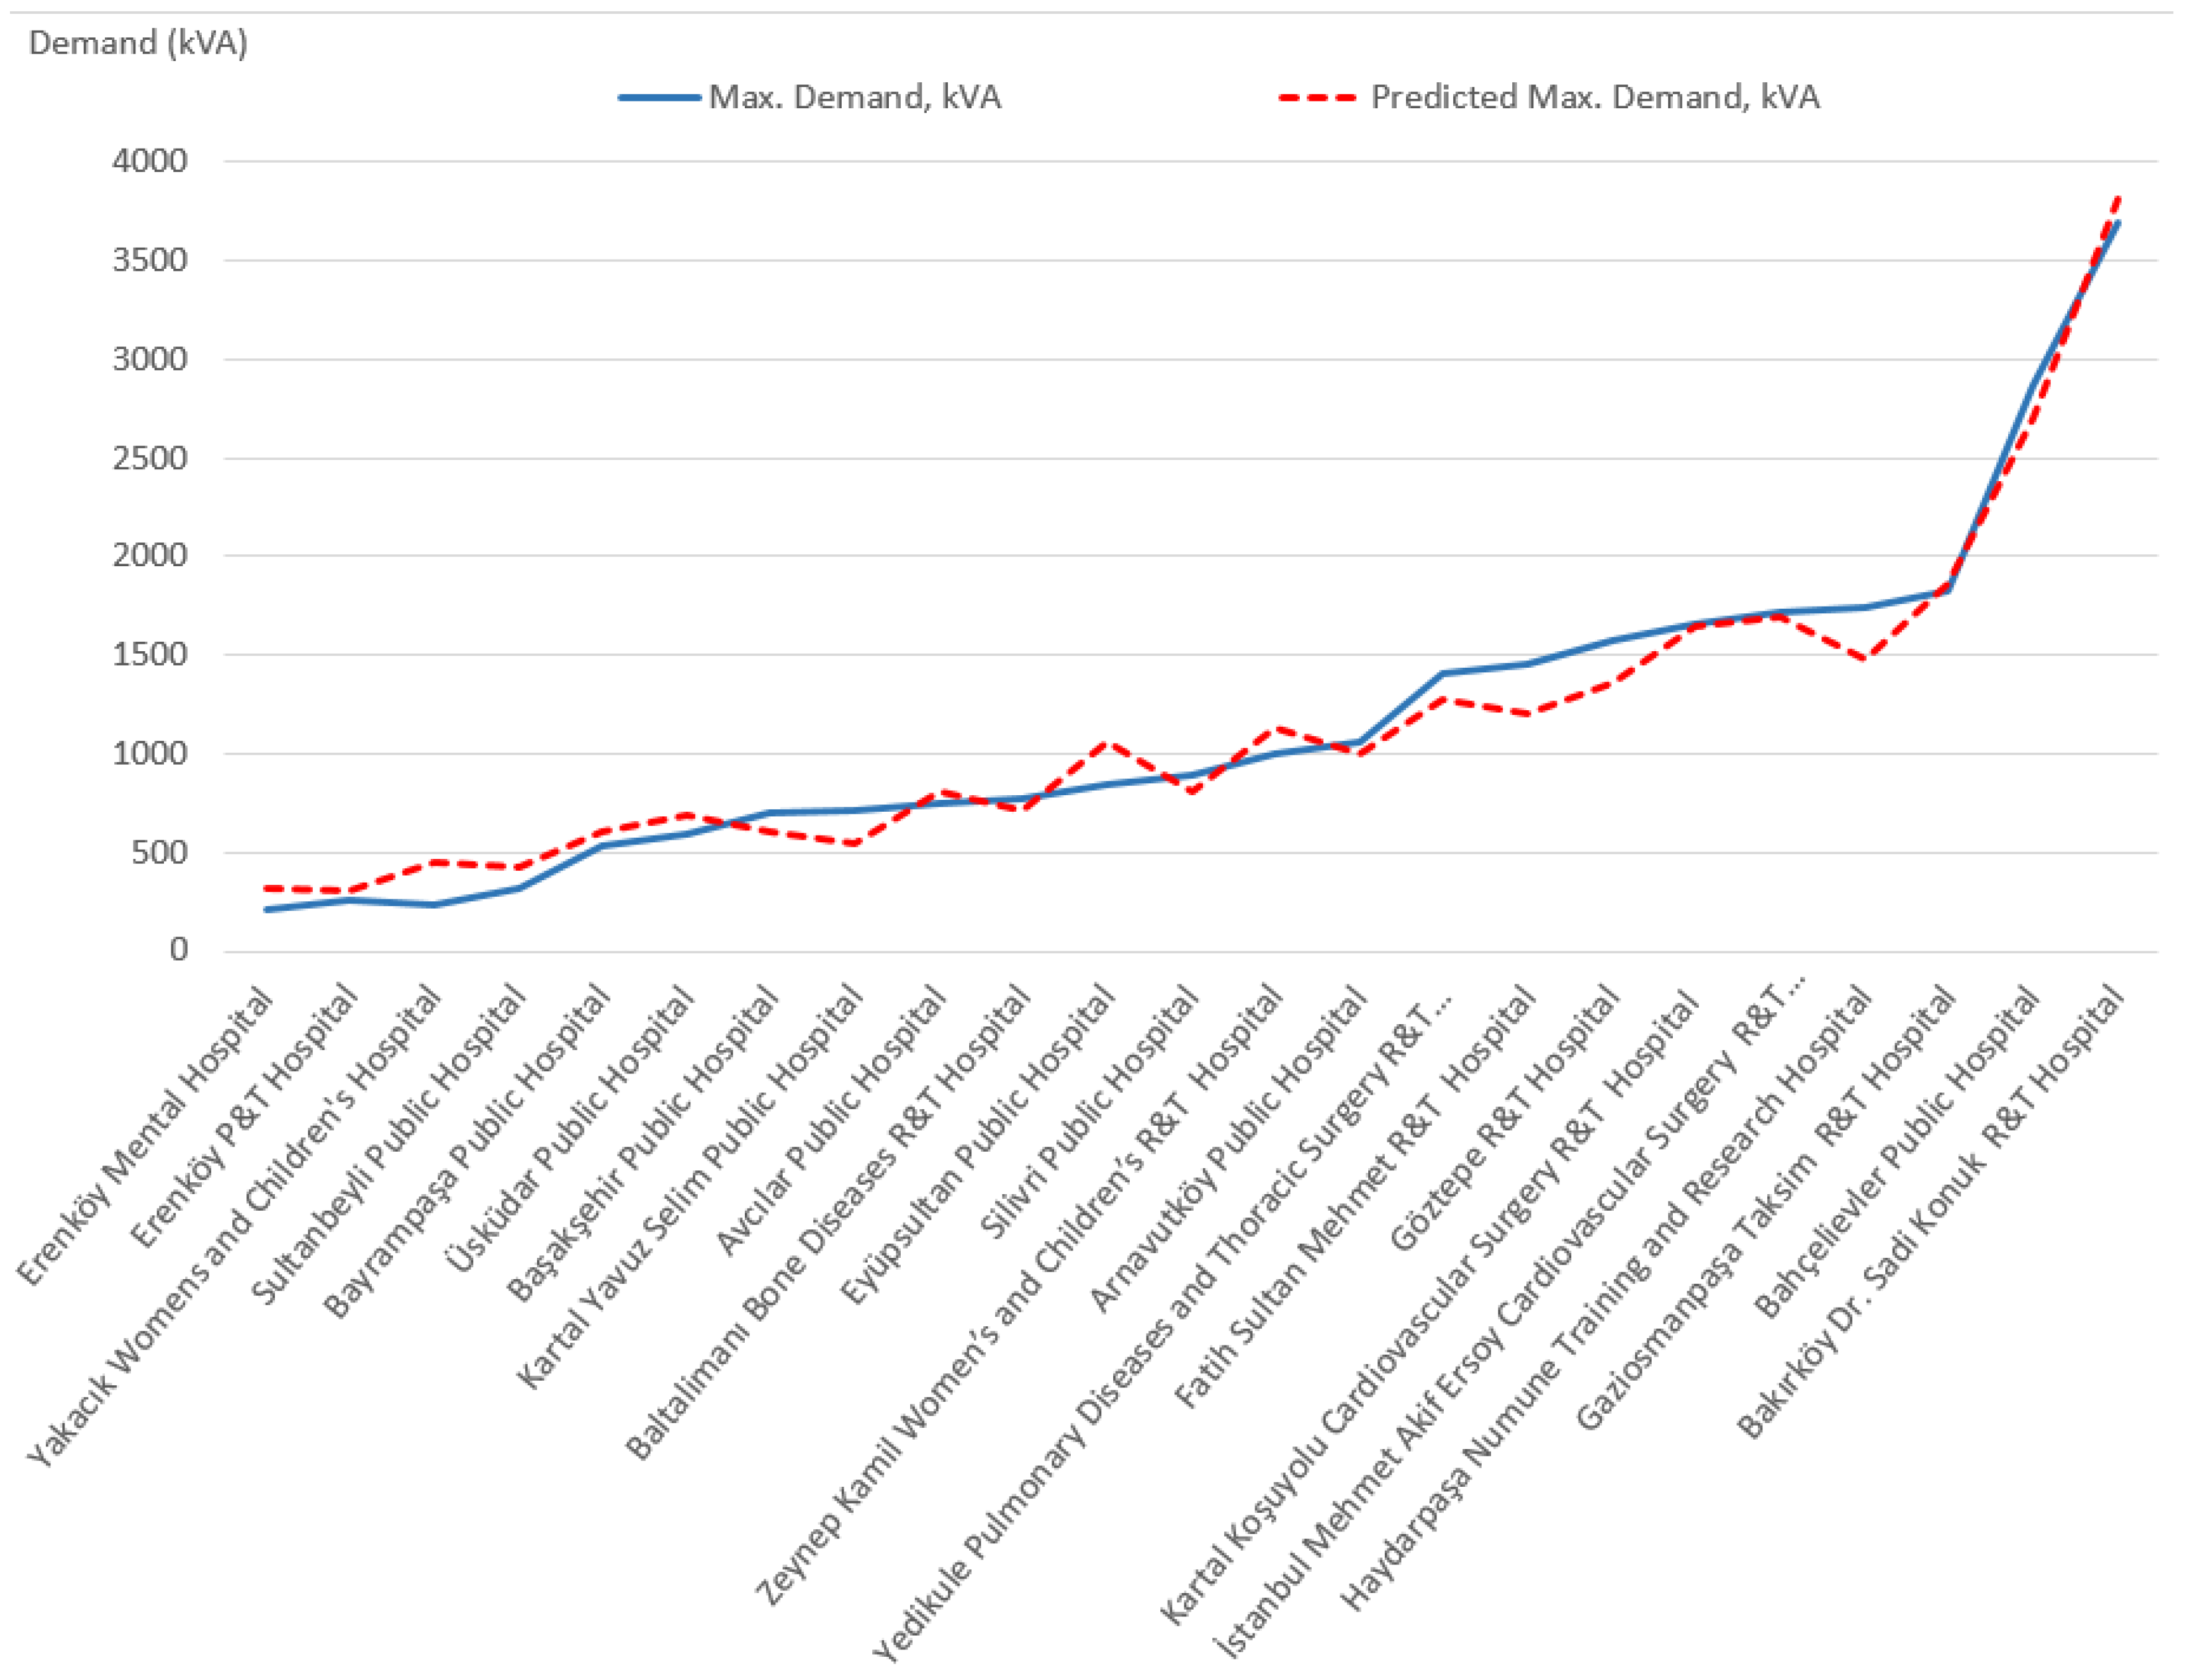
This formula differs from the coefficients in the current regulations in that it does not have to calculate the loads (lighting, mechanical, etc.) one by one. If the system capacity is known, the maximum demand can be calculated with a single formula. The actual and predicted maximum demand per area is given in Figure 7.

Figure 7.
Actual and predicted max demand per area.
3.3. Cost-Saving Implications
This analysis is a new technique that can be used for both new hospitals and existing hospitals. This technique aids in overcoming the difficulties that arise in determining the installed power calculation. The power system has been designed excessively, which results in unnecessary initial costs and lifecycle costs. The proposed idea is to optimize the quantity of the transformer and generator to be the most appropriate to the actual situation.
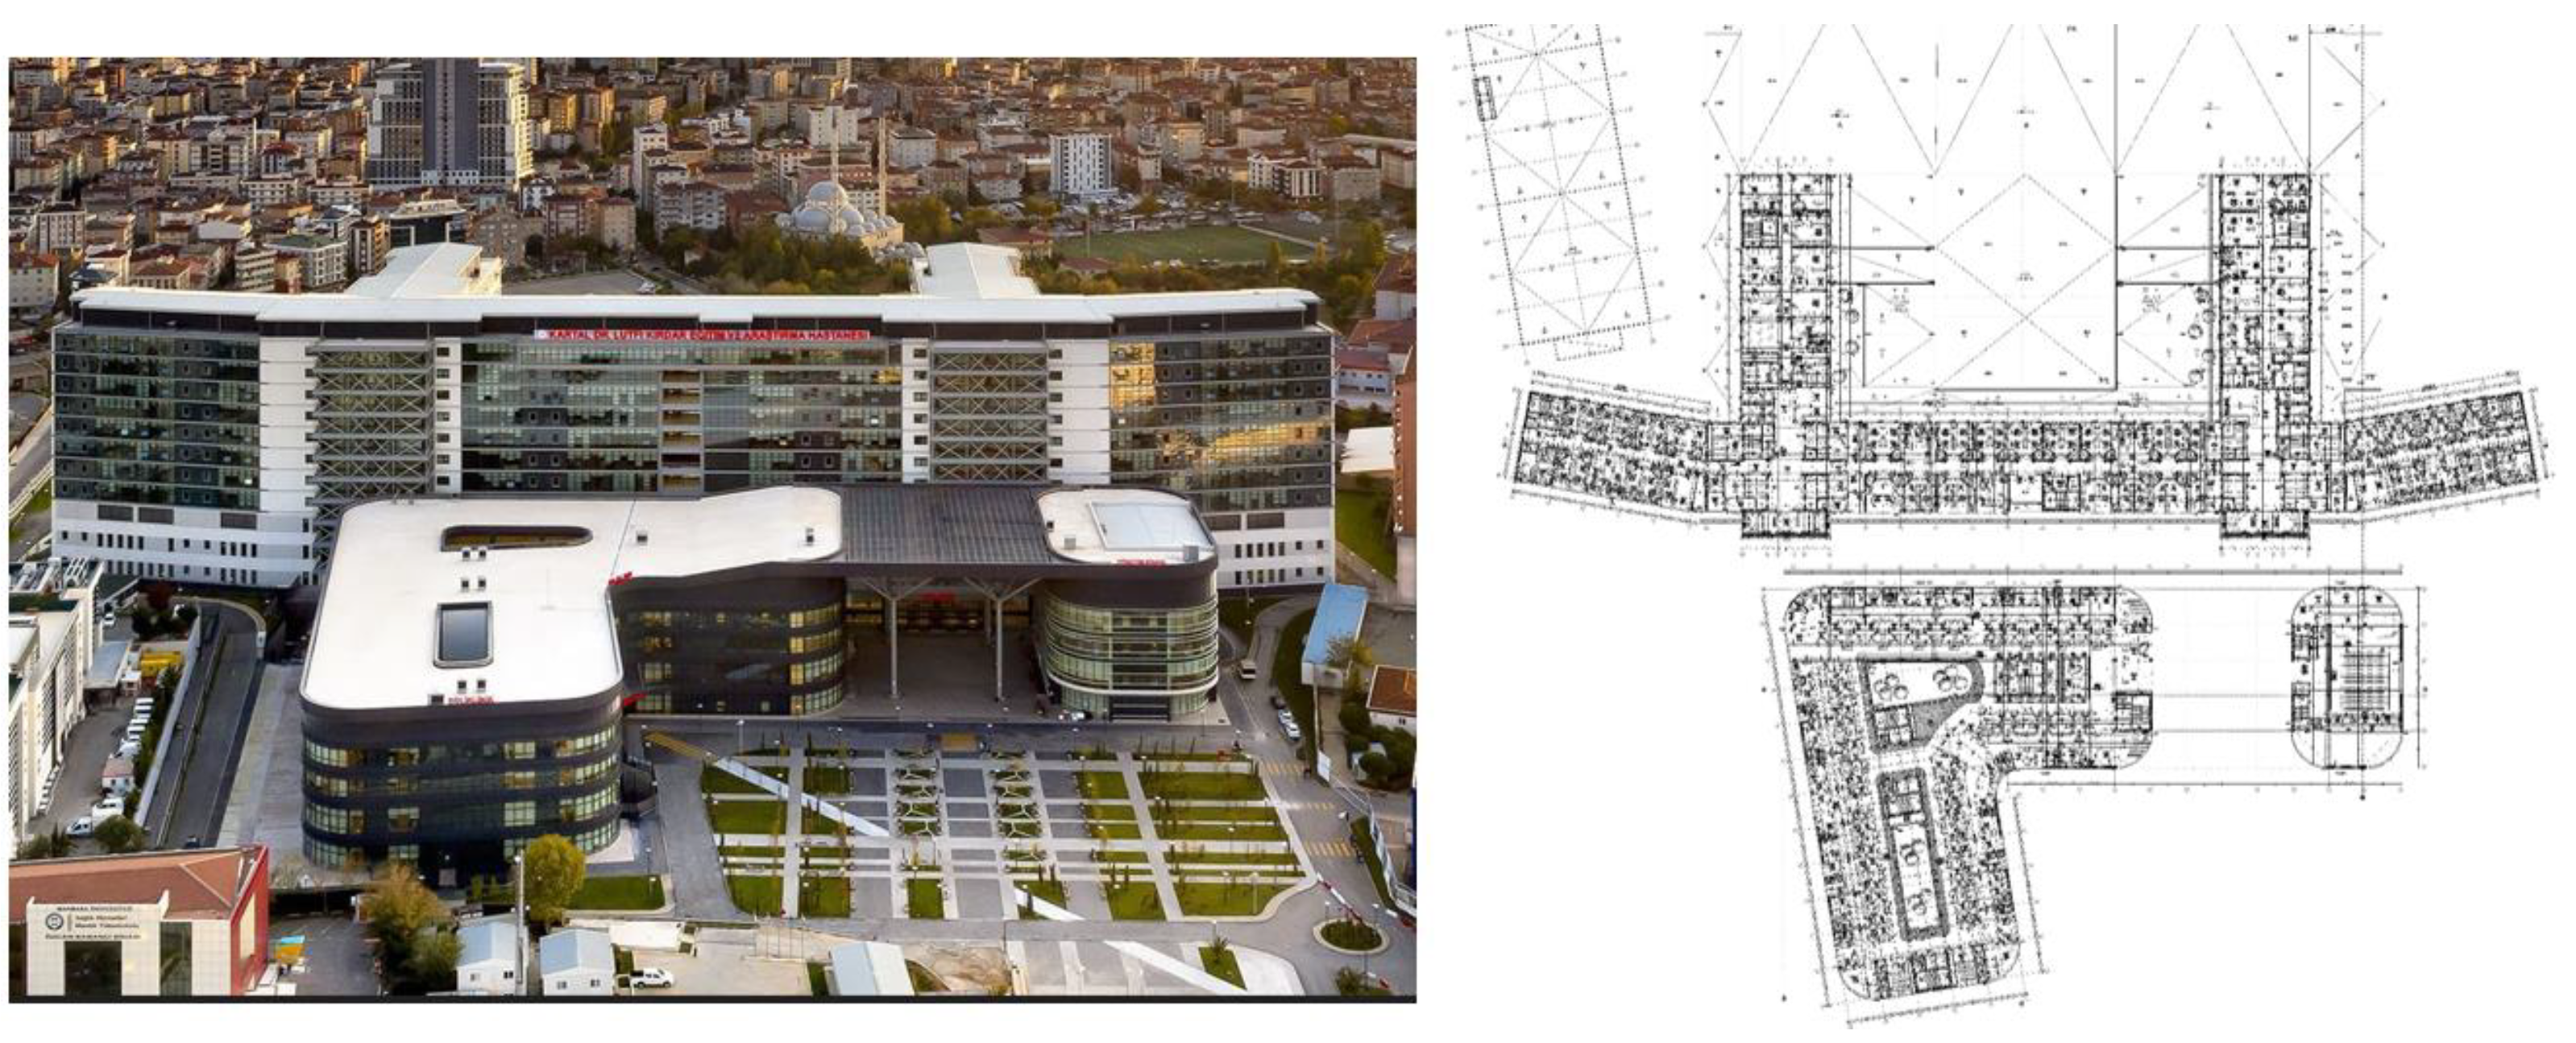
For example, in the reconstructed Kartal Training and Research Hospital Project shown in Figure 8, the installed load of the hospital is 43 MVA; according to the result of the calculations made according to the Turkish Electricity Indoor Facilities Regulation, it is seen that the maximum demand should be 30 MVA.
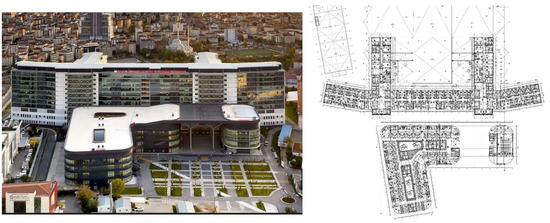
Figure 8.
Kartal Dr. Lütfü Kırdar R&T Hospital.
However, when the formula obtained from this study is applied, the maximum demand becomes as
MD = 0.296(SC) + 197
MD = 0.296(43000) + 197
MD = 12.925 MVA
Similarly, when the volt-ampere level per unit area formula obtained from this study is applied, the maximum demand results as follows.
While the system is designed with 30 MVA, 13 MVA needs to be designed for overlapping peak demand. As a result, transformers and generators are installed almost three times the amount actually needed. If the economic analysis is made for the Kartal Training and Research Hospital Project, which is being reconstructed, the initial cost saving result is shown in Table 8.
Table 8.
Potential savings.
It has been calculated that a total of $2,696,100 will be spent. However, the idle operation losses of the extra transformers and the maintenance and operating costs of the extra transformers and generators are bound to cause increase in the operating costs of the hospital. While this work continues, the construction of Kartal Training and Research Hospital was completed, and it was put into service at full capacity in July 2020. Its highest power to date has been recorded as 9.9 MVA. The results proved the effectiveness of this study.
4. Discussion
4.1. The Effect of Hospital Typology
Hospital typology can exist in very different ways depending on the designer. The age, enclosed space, and form of each hospital building are unique. The exterior of some of them is covered with glass, some with aluminum, and some with plaster. The thermal insulation ratios of each of them are also different from each other. It is expected that the heating and cooling systems will affect the maximum power account. In addition, the medical service offered in hospitals also varies depending on the type of hospital. Considering that the types of devices used will differ, it is thought that the type of hospital will also affect the maximum demand. Therefore, is it possible to apply a singular formula as a standard to all hospitals? Having considered the following examples empirically, we have confirmed that the answer is yes. In the found method, a calculation method is used over the installed power. The calculation of the installed power is carried out by collecting each individual load in the system. Hence, it has been concluded that the age of the hospital, its structure, form, type, etc. are factors that do not affect the method found, and the method can be used for all hospitals in Turkey.
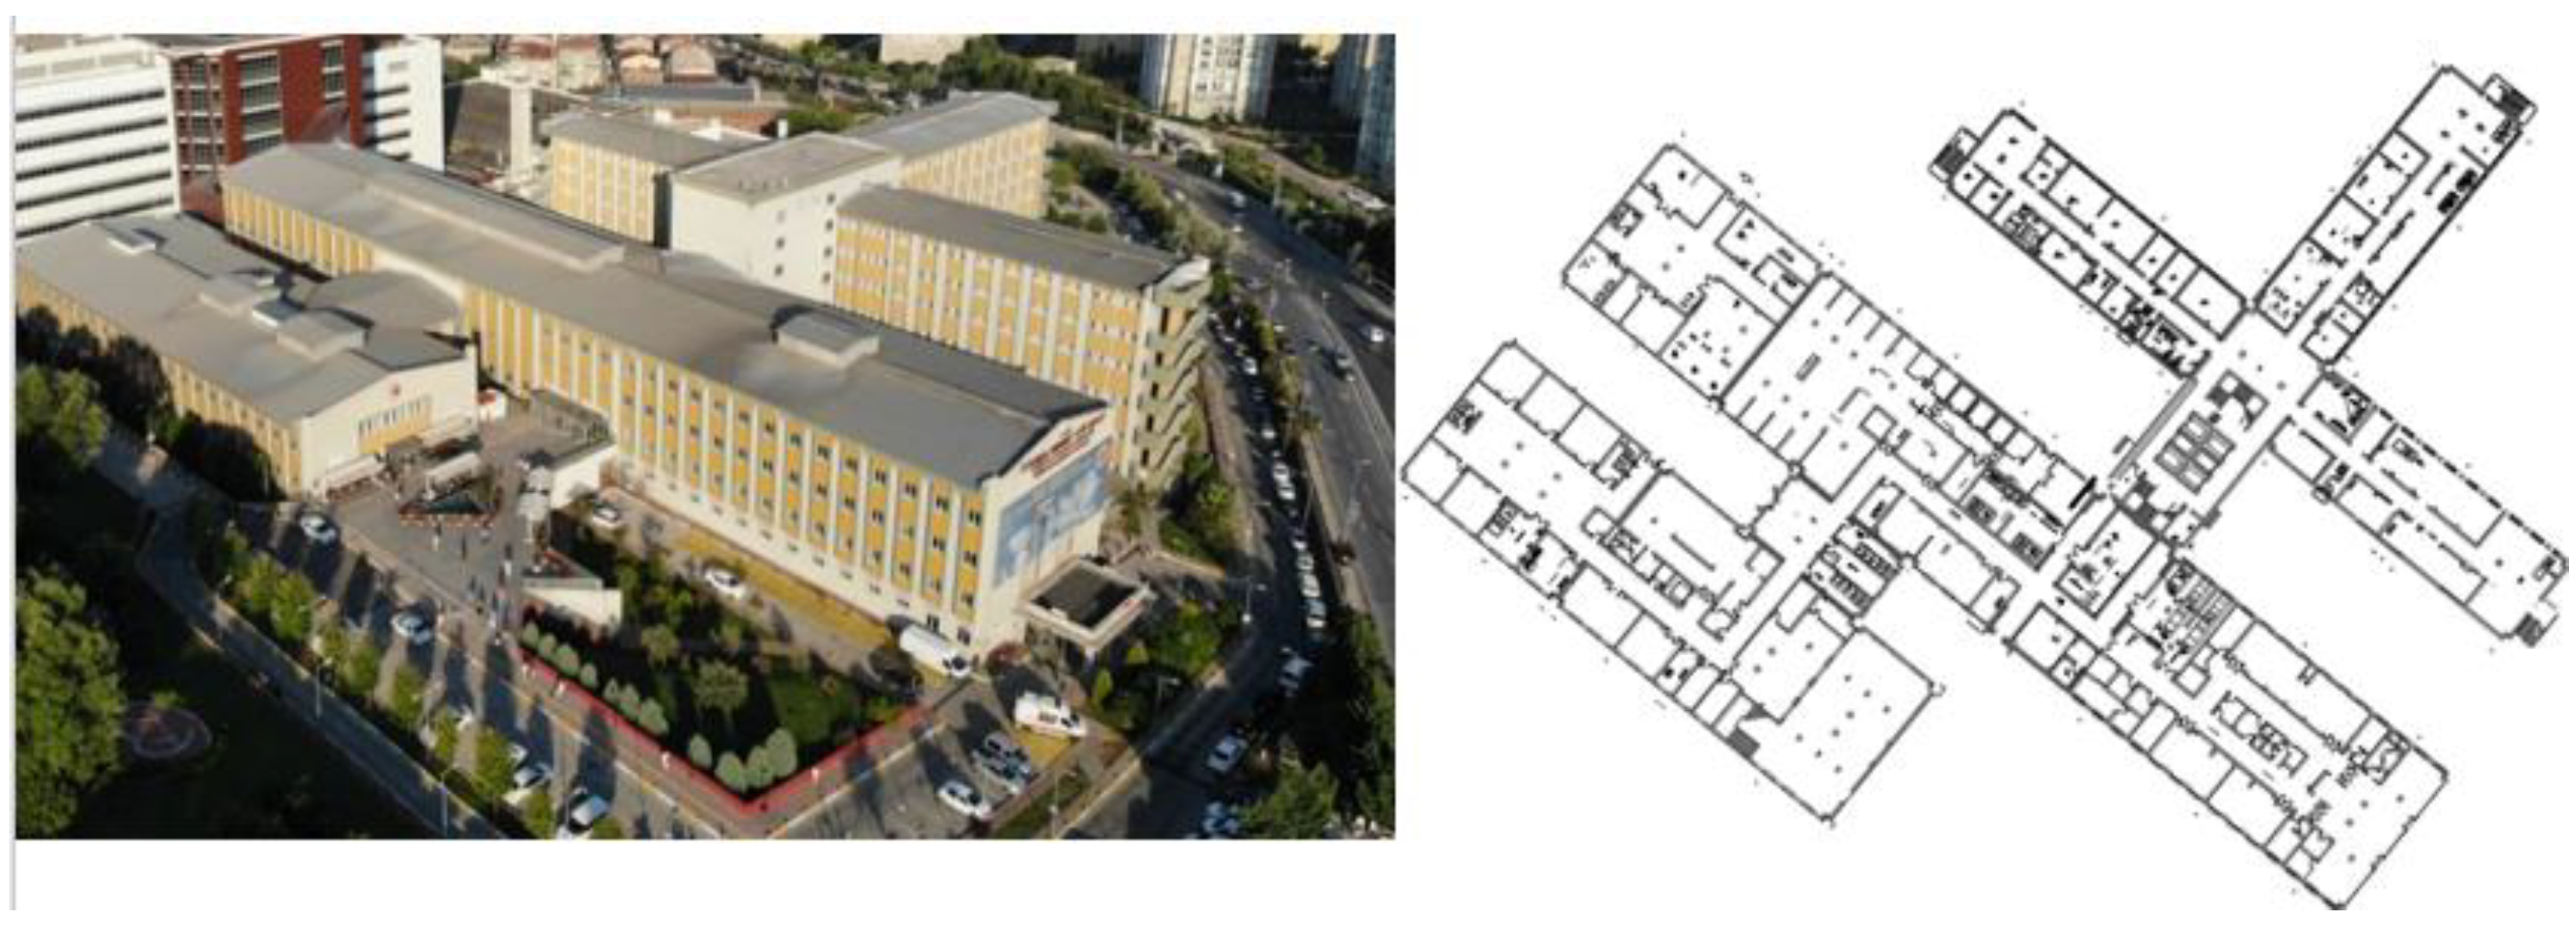
First, the Gaziosmanpasa Taksim Public Hospital in Figure 9 is considered.
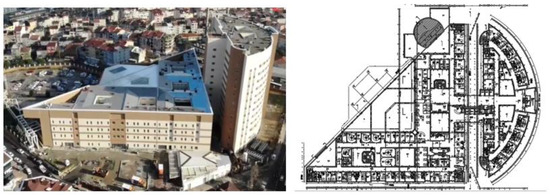
Figure 9.
Gaziosmanpaşa Taksim Public Hospital.
The installed power of Gaziosmanpaşa Taksim Public Hospital is 5750 kVA, and the maximum power was calculated at 1899 kVA when the linear model was applied. The actual maximum power is 1821 kVA.
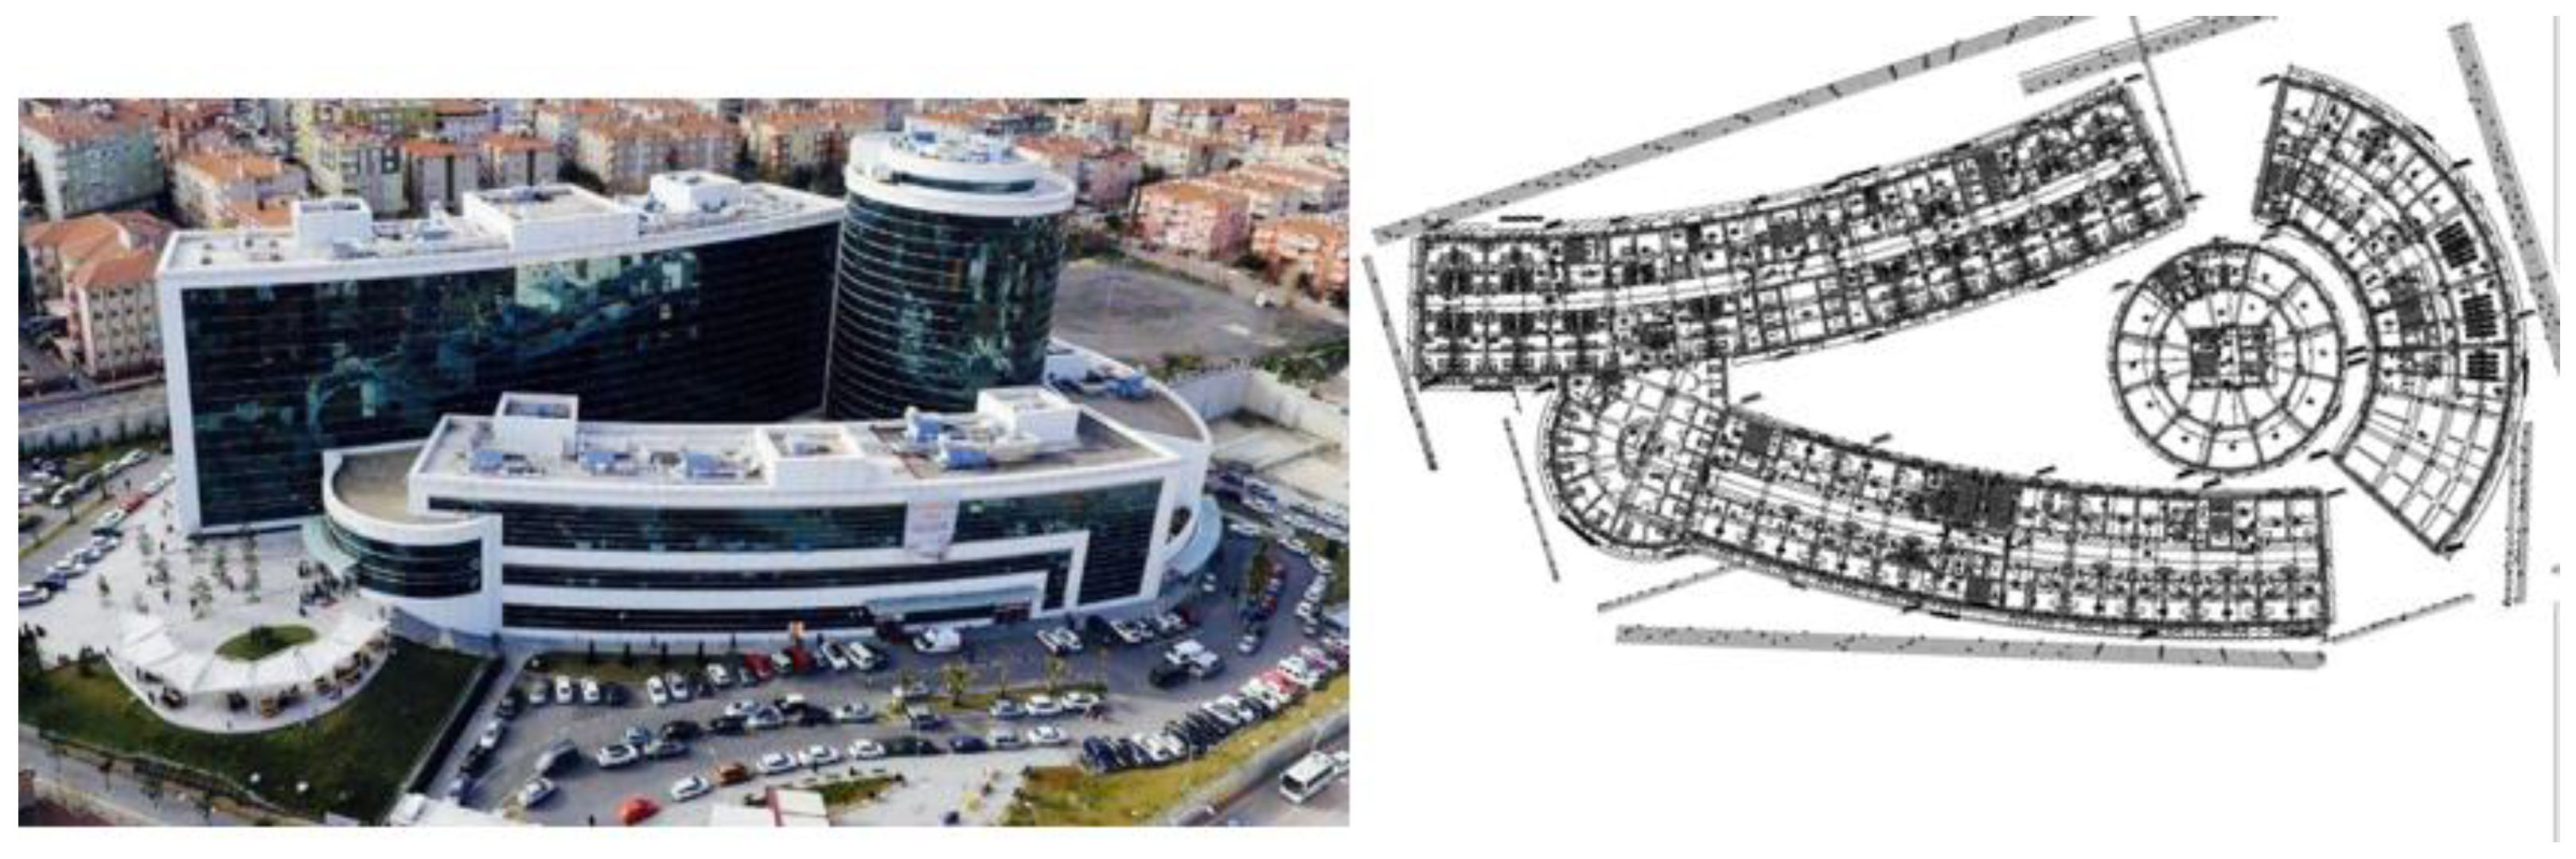
Secondly, the Bahçelievler Public Hospital in Figure 10 is considered.

Figure 10.
Bahçelievler Public Hospital.
The installed power of Bahçelievler Public Hospital is 8625 kVA, and the maximum power was calculated at 2750 kVA when the linear model is applied. The actual maximum power is 2863 kVA.
Thirdly the Mehmet Akif Ersoy Cardiovascular Surgery Training and Research Hospital in Figure 11 is considered.

Figure 11.
Mehmet Akif Ersoy Cardiovascular Surgery Training and Research Hospital.
The installed power of Mehmet Akif Ersoy Cardiovascular Surgery Training and Research Hospital is 5175 kVA, and the maximum power was calculated at 1728 kVA when the linear model is applied. The actual maximum power is 1718 kVA.
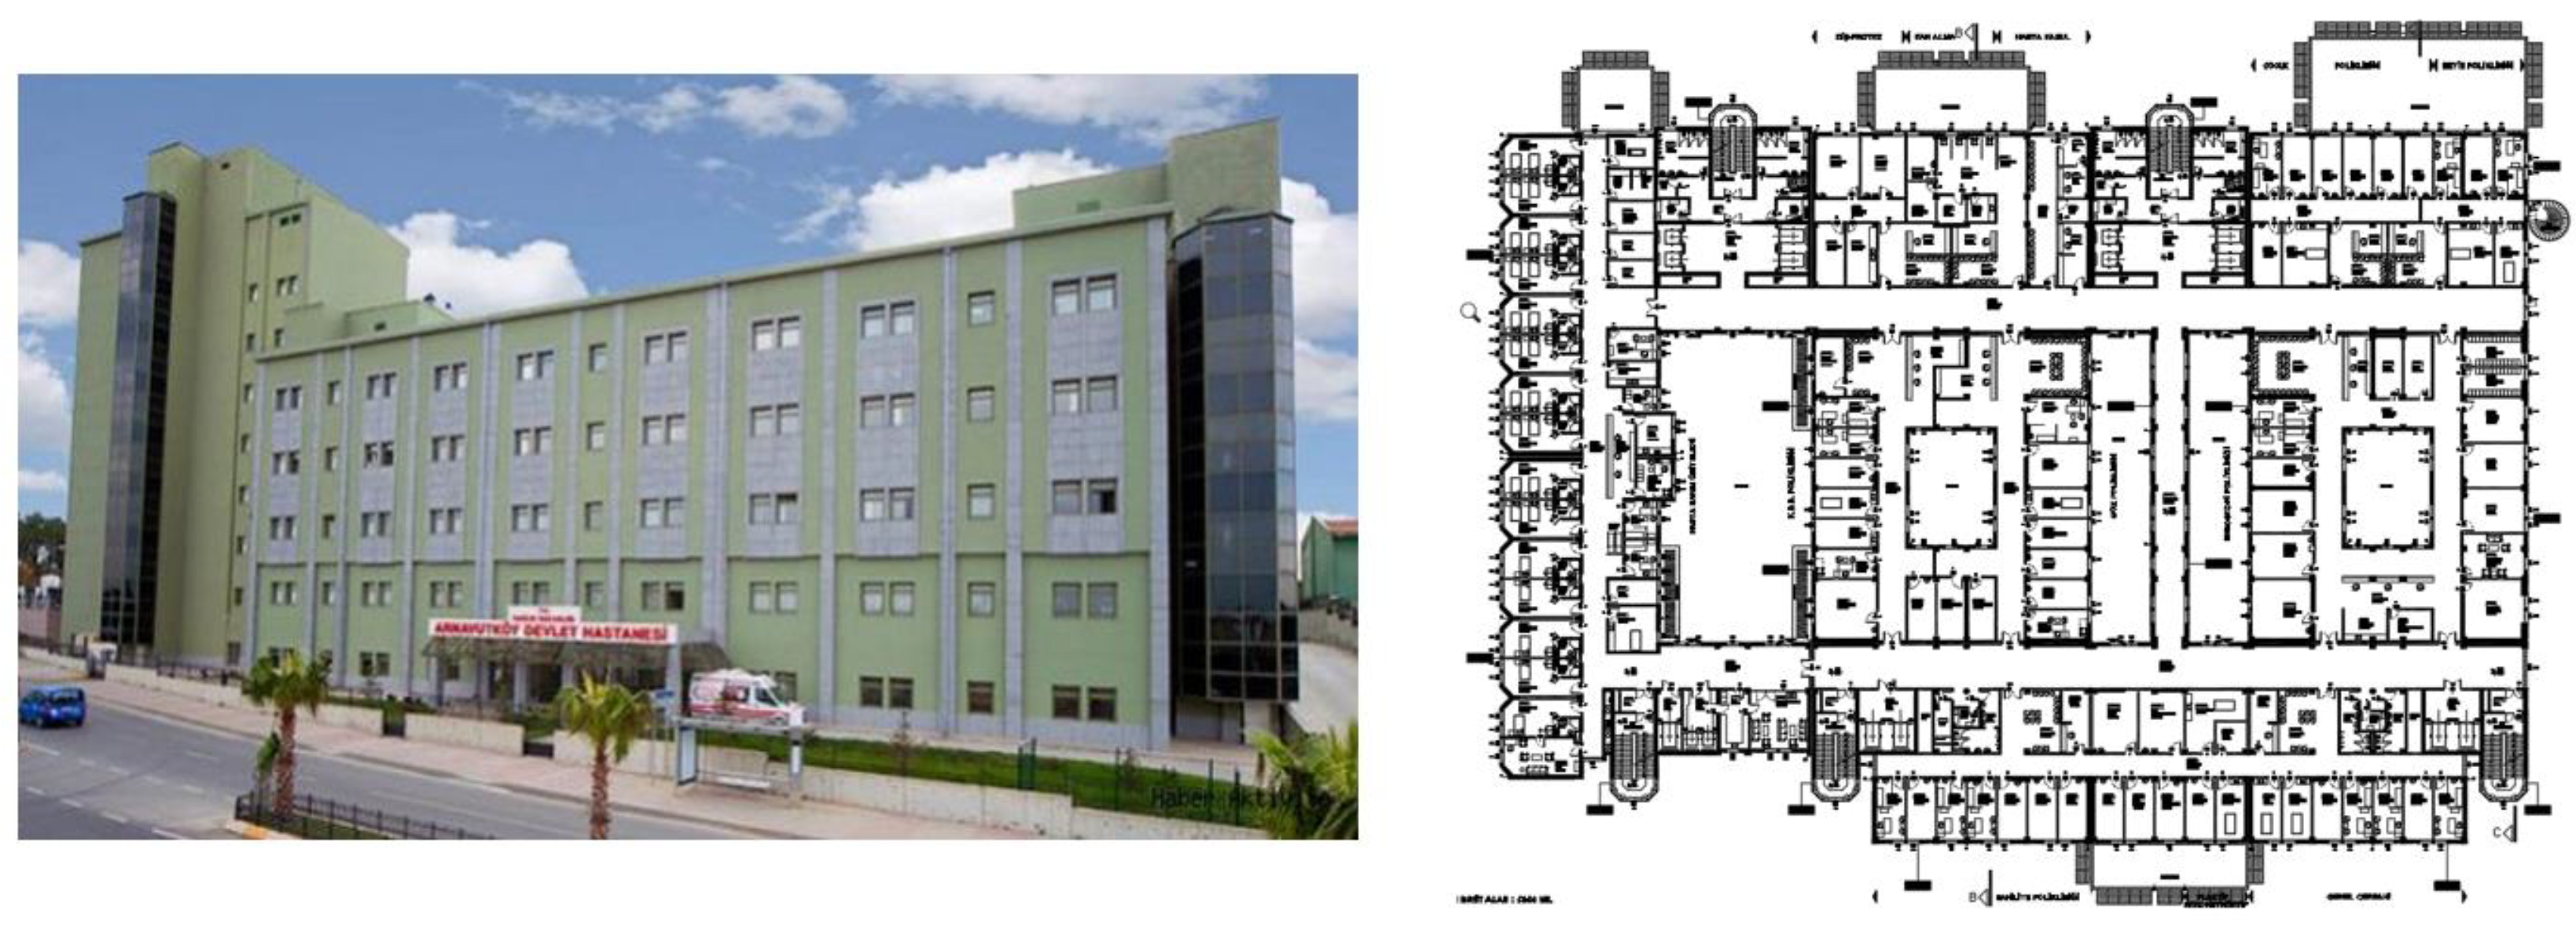
Lastly the Arnavutköy Public Hospital in Figure 12 is considered.

Figure 12.
Arnavutköy Public Hospital.
The installed power of Arnavutköy Public Hospital is 2760 kVA, and the maximum power was calculated at 1014 kVA when the linear model is applied. The actual maximum power is 1059 kVA.
Therefore, hospital typology is not a factor for maximum demand estimation.
4.2. The Effect of Considering a Limited Number of Hospitals
Although the number of hospitals is limited, the variety of selected hospitals is very large. Hospitals with more than 100 beds include new and old, glass-fronted and plastered-fronted, roofed and terrace, and with and without HVAC systems.
The 23 selected hospitals are a core that encompasses almost all hospitals. Therefore, as can be seen from the examples above, the method found can be applied to all types of hospitals in Turkey.
In the literature, there is information about the annual energy use intensity (EUI, kWh/m2) of hospitals in various countries. However, there is no information about the maximum demand of hospitals. When hospitals in developed countries are evaluated in terms of medical devices and electromechanical equipment, they are generally similar to each other. Because the formula calculates the system capacity, it is predicted that the method can be used in countries such as America, Germany, and England when it is evaluated that the devices using the system capacity and the health system are similar. However, data and further studies are needed to apply the results of the study all over the world.
5. Conclusions
In this study, the annual electrical energy consumption of 23 public hospitals with over 100 beds in Istanbul is measured, and after determining the monthly peak loads, two new forecasting models are proposed using regression techniques for maximum demand forecasting. The actual maximum power is about one third of the installed power. The maximum demand can be calculated easily and with high accuracy by the formula “Maximum Demand = 0.296 (System Capacity) + 197” or by summing 100% of the 13.5 kva per square meter and 24% of the remaining load per square meter. The findings of this study have improved the understanding of hospital power design.
The results obtained from the study show that the maximum demand of a hospital at the design stage can be estimated with high accuracy using a simple formula. This method, which can also be applied to active hospitals, allows you to identify hospitals that need energy optimization in a short time.
The results of this study can be used as a reference for the design of hospital power systems. The findings in this article have practical benefits for the world. Design engineers and hospital managers can estimate the maximum power of hospitals with a single formula and evaluate hospital power systems.
The conceptual system developed in this research contributes to the scope of the field of sustainable engineering. The results of this study contribute to the energy policy design goals, as they demonstrate a new methodological approach to reducing installation and operating costs.
Author Contributions
Conceptualization, I.S.; methodology, I.S.; software, I.S.; validation, I.S. and E.I.; formal analysis, I.S.; investigation, I.S.; resources, I.S.; data curation, I.S.; writing—original draft preparation, I.S.; writing—review and editing, I.S. and E.I.; visualization, I.S.; supervision, E.I.; project administration, E.I.; funding acquisition, I.S. All authors have read and agreed to the published version of the manuscript.
Funding
This research received no external funding.
Institutional Review Board Statement
Not applicable.
Data Availability Statement
All data, models, and code generated or used during the study appear in the submitted article.
Acknowledgments
The authors would like to thank the Istanbul Directorate of Health, which made this work possible.
Conflicts of Interest
The authors declare that they have no known competing financial interests or personal relationships, which have, or could be perceived to have, influenced the work reported in this article.
Abbreviations
| CF | Coincidence factor |
| DF | Demand Factor |
| MD | Maximum demand |
| MSE | Mean Squared Error |
| MAPE | Mean Absolute Percentage Error |
| MAPD | Mean Absolute Percentage Deviation |
| R&T | Training and research |
| RMSE | Root Mean Squared Error |
| SC | System Capacity |
References
- Kasule, A.; Ayan, K. Forecasting Uganda’s Net Electricity Consumption Using a Hybrid PSO-ABC Algorithm. Arab. J. Sci. Eng. 2019, 44, 3021–3031. [Google Scholar] [CrossRef]
- Mohamed, Z.; Bodger, P. Forecasting electricity consumption in New Zealand using economic and demographic variables. Energy 2005, 30, 1833–1843. [Google Scholar] [CrossRef] [Green Version]
- Kavaklioglu, K.; Ceylan, H.; Ozturk, H.K.; Canyurt, O.E. Modeling and prediction of Turkey’s electricity consumption using artificial neural networks. Energy Convers. Manag. 2009, 50, 2719–2727. [Google Scholar] [CrossRef]
- Morgül Tumbaz, M.N.; İpek, M. Energy Demand Forecasting: Avoiding Multi-collinearity. Arab. J. Sci. Eng. 2021, 46, 1663–1675. [Google Scholar] [CrossRef]
- Toksarı, D.M. Ant colony optimization approach to estimate energy demand of Turkey. Energy Policy 2007, 35, 3984–3990. [Google Scholar] [CrossRef]
- Kankal, M.; Akpınar, A.; Kömürcü, M.I.; Özşahin, T.Ş. Modeling and forecasting of Turkey’s energy consumption using socio-economic and demographic variables. Appl. Energy 2011, 88, 1927–1939. [Google Scholar] [CrossRef]
- Oğcu, G.; Demirel, O.F.; Zaim, S. Forecasting electricity consumption with neural networks and support vector regression. Procedia Soc. Behav. Sci. 2012, 58, 576–1585. [Google Scholar] [CrossRef] [Green Version]
- Kiran, M.S.; Özceylan, E.; Gündüz, M.; Paksoy, T. Swarm intelligence approaches to estimate electricity energy demand in Turkey. Knowl. Based Syst. 2012, 36, 93–103. [Google Scholar] [CrossRef]
- Bertolini, S.; Massucco, S.; Silvestro, F.; Grillo, S.; Giacomini, G. Short-Term Load Forecasting in Hospital Systems. In IFMBE Proceedings, Proceedings of the World Congress on Medical Physics and Biomedical Engineering, Beijing, China, 26–31 May 2012; Long, M., Ed.; Springer: Berlin/Heidelberg, Germany, 2013; Volume 39. [Google Scholar] [CrossRef]
- Cao, L.; Li, Y.; Zhang, J.; Jiang, Y.; Han, Y.; Wei, J. Electrical load prediction of healthcare buildings through single and ensemble learning. Energy Rep. 2020, 6, 2751–2767. [Google Scholar] [CrossRef]
- Morinigo-Sotelo, D.; Duque-Perez, O.; Garcia-Escudero, L.A.; Fernandez-Temprano, M.; Fraile-Llorente, P.; Riesco-Sanz, M.V.; Zorita-Lamadrid, A.L. Short-Term Hourly Load Forecasting of a Hospital Using an Artificial Neural Network. In Proceedings of the International Conference on Renewable Energies and Power Quality, Las Palmas de Gran Canaria, Spain, 13–15 April 2011; pp. 441–446. [Google Scholar]
- Bagnasco, A.; Saviozzi, M.; Silvestro, F.; Vinci, A.; Grillo, S.; Zennaro, E. Artificial Neural Network Application to Load Forecasting in a Large Hospital Facility. In Proceedings of the International Conference on Probabilistic Methods Applied to Power Systems (PMAPS), Durham, UK, 7–10 July 2014; pp. 1–6. [Google Scholar]
- Bagnasco, A.; Fresi, F.; Saviozzi, M.; Silvestro, F.; Vinci, A. Electrical Consumption Forecasting in Hospital Facilities: An Application Case. Energy Build. 2015, 103, 261–270. [Google Scholar] [CrossRef]
- World Health Organization. 2017. Available online: http://www.who.int/hospitals/en/ (accessed on 9 January 2021).
- Istanbul Health Directorate. 2021. Available online: www.istanbulsaglik.gov.tr/w/sb/tedk/belge/Devlet_Hastaneleri.pdf (accessed on 9 January 2021).
- Katsanis, J.S.; Malahias, G.N.; Koustellis, J.D.; Halaris, P.G. Electrical Energy Consumptions in Hospitals—The Case of Lifts. In Proceedings of the Power and Energy Systems Europes—IASTED International Conference, Crete, Greece, 22–24 June 2011. [Google Scholar]
- Becker’s Hospital Review. 2012. Available online: http://www.beckershospitalreview.com/strategic-planning/18-statistics-on-hospital-energy-consumption.html (accessed on 9 January 2021).
- Katsanis, J.S.; Tsarabaris, P.T.; Koufakis, E.I.; Polykrati, A.; Proios, A.N. An energy saving system for hospital laundries. In Proceedings of the Power and Energy Systems Europes—IASTED International Conference, Palma de Mallorca, Spain, 7–9 September 2009. [Google Scholar]
- Balaras, C.A.; Gaglia, A.G.; Georgopoulou, E.; Mirasgedis, S.; Sarafidis, Y.; Lalas, D.P. European residential buildings and empirical assessment of the Hellenic building stock, energy consumption, emissions and potential energy savings. Build. Environ. 2007, 42, 1298–1314. [Google Scholar] [CrossRef]
- US Energy Information Administration. Commercial Buildings Energy Consumption Survey CBECS 2007; US Energy Information Administration: Washington, DC, USA, 2012.
- Neal, B. Spec’ing Hospital Electrical Distribution System. Consult. Specif. Eng. 2013, 50, 22–27. [Google Scholar]
- Barros, O.; Weber, R.; Reveco, C.; Ferro, E.; Julio, C. Demand Forecasting and Capacity Management for Hospitals. 2011. Available online: https://www.researchgate.net/publication/274390870_Demand_Forecasting_and_Capacity_Management_for_Hospitals (accessed on 29 June 2021).
- Hu, S.; Chen, J.; Chuah, Y. Energy Cost and Consumption in a Large Acute Hospital. Int. J. Archit. Sci. 2004, 5, 11–19. [Google Scholar]
- Teke, A.; Timur, O.; Zor, K. Üniversite Hastanesinde Enerji Verimliliğini Artıran Uygulamaların Geri Dönüşüm Sürelerinin Hesaplanması. Çukurova Üniv. Mühendis. Mimar. Fak. Derg. 2015, 30, 41–56. [Google Scholar] [CrossRef] [Green Version]
- Altan, H.; Ozarisoy, B. An Analysis of the Development of Modular Building Design Elements to Improve Thermal Performance of a Representative High Rise Residential Estate in the Coastline City of Famagusta, Cyprus. Sustainability 2022, 14, 4065. [Google Scholar] [CrossRef]
- Faber, T.; Finkenrath, M. (2021). Load Forecasting in District Heating Systems Using Stacked Ensembles of Machine Learning Algorithms. In Proceedings of the 14th International Renewable Energy Storage Conference 2020 (IRES 2020), Dusseldorf, Germany, 10–12 March 2020. [Google Scholar] [CrossRef]
- Gordillo-Orquera, R.; Lopez-Ramos, L.; Muñoz-Romero, S.; Iglesias-Casarrubios, P.; Arcos-Aviles, D.; Marques, A.; Rojo-Álvarez, J. Analyzing and Forecasting Electrical Load Consumption in Healthcare Buildings. Energies 2018, 11, 493. [Google Scholar] [CrossRef] [Green Version]
- Hospital Contract Power; Anatolian Side of the Electricity Distribution Company: Istanbul, Turkey, 2020.
- Maximum Demand per Month; Boğaziçi Electricity Distribution Company: Istanbul, Turkey, 2020.
- Weedy, B. Electric Power Systems; Wiley: Southampton, UK, 1979. [Google Scholar]
- Şentürk, E. A New Aproach to Load Characteristics and Coincidence Factor in Residential Areas. Master’s Thesis, Department of Electrical and Electronic Engineering, Yildiz Technical University, Istanbul, Turkey, 1996. [Google Scholar]
- Pekiner, F.O. A New Approach to the Use of Load Characteristics of Urban Housing Loads; Elektromek: Bursa, Turkey, 1993. [Google Scholar]
- Turkey Official Gazette. Electricity Internal Facilities Regulation in Turkey; Official Gazette: Ankara, Turkey, 1984.
- National Electrical Codes; NFPA70; National Fire Protection Association: Quincy, MA, US, 2017.
- Unit Price Book; Turkey Electricity Distribution Company: Ankara, Turkey, 2020.

Publisher’s Note: MDPI stays neutral with regard to jurisdictional claims in published maps and institutional affiliations. |
© 2022 by the authors. Licensee MDPI, Basel, Switzerland. This article is an open access article distributed under the terms and conditions of the Creative Commons Attribution (CC BY) license (https://creativecommons.org/licenses/by/4.0/).