Abstract
Global warming has become an increasing challenge due to the impact of human activities on the environment. In this regard, university campuses with various activities and departments have a great impact on the environment. Ecological Footprint Analysis (EFA) is a natural resource depletion assessment tool, with a high level of accuracy, that measures the impact of human activities on the environment. Considering the Ecological Footprint (EF) capabilities, this study developed a method to assess the environmental impacts of a university campus using component-based parameters. The goals of the study are to explore the effective components of EF and to propose some policy guidelines to diminish the human impacts on the environment on university campuses. Five components, including natural gas and electricity consumption, water and food usage, and waste production, were measured in a survey from 2013 to 2016 at the building scale. The mean EF of the campus was 16,484 global hectares (gha). Fossil fuel energy had the highest level of environmental impact with 70.73%, followed by waste production and food and water usage with 26.87%, 1.28%, and 1.12%, respectively. The results demonstrate that the EF Index (EFI) of the case study campus was −0.82, which reveals an unsustainable performance. The EF results were illustrated on an Ecological Footprint Map (EFM), which shows the east and west parts of the camps were more unsustainable.
1. Introduction
1.1. The Serious Impacts of Humans on the Environment
Current assessments indicate that approximately 83 million people are being added to the world’s population every year [1]. Therefore, food consumption is increased fivefold and the related trade enlarged almost twenty times. Balancing the food supply with this growing market has resulted in the conversion of wetlands into farmlands, indiscriminate felling of forests, overexploitation of fishery resources, and degradation of natural life-dependent areas throughout the planet [2]. The human pressure on the environment in terms of natural resources depletion, greenhouse gas emissions, and waste production has been rising steadily [3]. Now the human ecological footprint is 60% higher than the world’s ecosystems renewal capability. In 2020, the ecological footprint temporarily decreased due to the widespread effect of COVID-19 pandemic global lockdowns; however, it is still far beyond what our planet can replenish [4]. The human pressures on the environment have led to a serious problem for the planet, with one piece of evidence being global warming, a crucial environmental challenge [5]. The planet’s mean surface temperature has risen about 1.18 degrees Celsius since the late 19th century, a change driven largely by carbon dioxide and other greenhouse gas emissions into the atmosphere. In this regard, the highest warming temperatures have been recorded frequently in the past 40 years, with six critical warmest years since 2014 [6].
1.2. The Importance of Conducting the Ecological Footprint Assessment (EFA) at a University Campus
Based on various declarations such as the Talloires Declaration [7], Halifax Declaration [8], and Copernicus University Charter [9], one of the main environmental goals is the integration of education with environmental concepts, especially in higher educational institutions (HEIs). In recent years, Ecological Footprint (EF) as a decision-making [10] as well as an educational tool for sustainability [11] has been used to assess the environmental impact of higher educational organizations. Countries like the USA, China, and the United Kingdom have paid serious attention to integrating education with the environment and some research was conducted on the application of EF at university campuses [12,13,14]. Universities with thousands of students and staff and a variety of building types such as colleges, gyms, restaurants, outdoor sports centers, libraries, shops, conference halls, etc., have a fundamental impact on the environment. Understanding the ecological performance of a university campus is critical to address global warming.
1.3. The Novelty of the Proposed Method
This paper has developed the EF methodology. The first contribution of this research is the assessment of the UOK’s EF (Ecological Footprint) that was conducted over four academic years (2013–2016), while most of the similar research was applied in one year. The second contribution is the assessment of the EF at both the campus and building levels, whereas other reviewed research was conducted only at the campus level. The assessment of the EF at the building scale leads to the comparison between the performance of the buildings and ranking them for further sustainability policy. The other contribution of the study refers to the visualizing of the results of the Ecological Footprint Analysis (EFA) and presenting them via Ecological Footprint Maps (EFMs).
2. Literature Review
2.1. Ecological Footprint Tool
A lot of tools and methods have been presented to assess ecological sustainability [15]. The footprint term is widely used to describe the sustainability level that is applied in various knowledge fields such as Carbon Footprint (CF) [16], Water Footprint (WF) [17], Material Footprint (MF) [18], and Urban Energy Density Footprint (UEDf) [19]. One of the most scientific methods for the assessment of environmental performance is the Ecological Footprint (EF) [20], which is broadly applied to measure the sustainability grade [21] of communities. EF is also an accounting tool for quantifying Herman Daly’s (Nobel Prize winner for sustainable development) principles of sustainability, and it could provide the ability of natural resource consumption monitoring and present advice for the reduction of human pressure on the ecosystem [22].
Mathis Wackernagel and William Rees from the University of British Columbia defined the Ecological Footprint (EF) concept for the first time in the early 1990s [23]. EF has been applied frequently as an index to control the quality of the environment in educational institutions [24] and as a policy guide as well as a planning measure to achieve sustainability [25]. It is also a proper tool to address the UNICEF’s motto of “education for sustainability” [26].
Since EF is calculated based on the appropriation of land and all the impacting components, expressed in global hectares (gha), it is also called the land footprint [27]. EF compares the amount of natural resource consumption with the available Biological Capacity (BC) to indicate how human beings are using natural resources. BC is determined by inverting the concept of EF [28,29] and can be interpreted as the maximum allowed resource consumption rate and waste discharge that can be sustained indefinitely in a given region without gradually impairing the functional integrity and productivity of the relevant ecosystem [30].
EF is an accurate tool to measure the impact of all components resulted from human behaviors on a university campus. EF is calculated using two approaches, including the compound- and component-based models. In the compound approach (known as Wackernagel’s approach) the human impact on each land type (fossil-energy land, arable land, pasture, forest, built-up land, and sea space) is considered for a given population [31]. In a component-based calculation, one starts with identifying all the individual items, i.e., goods and services, and accurate measuring of natural resources consumption as well as the produced waste by a given population in a given region. In the component-based model, the ecological footprint values are calculated using appropriate data belonging to the investigated region [32]. In this approach, one does not build up the total EF through an item-by-item methodology but starts from the overall consumption balance [33].
2.2. The Background of the Ecological Footprint Assessment for University Campuses
In recent years, Higher Education Institutions (HEIs) have been encouraged worldwide to boost their role to be an active part of the sustainable society, therefore, several research studies have been conducted to assess the sustainability level of HEIs [34,35,36,37]. As key actors in society, HEIs may educate thousands of students and staff for challenges connected to sustainable development. The fundamental purposes of EF accounting in HEIs can be summarized in 3 steps: (1) to have a clear intuition about the HEI’s ecological impact, (2) to serve as a base for further policy planning, (3) to raise ecological awareness through education in the society [38].
EFA has been applied for several university campuses around the world and the specifications of this research are reviewed and summarized in Table 1. It shows both the total and the per capita footprint, the research period, the percentage impact of each component, the component with the highest environmental impact (%), and the Ecological Footprint Index (EFI) of each university. However, few studies have calculated the EFI. More information on the EFI is presented in Section 4.4.

Table 1.
Summarizing the EFA results of different universities.
One of the major defects in the reviewed research is related to the short period of the assessment time (an academic year) of the calculated EF. To assess the EF of university campuses accurately, selecting a longer period is fundamental. The impact of humans on the environment may alter over the years because of temporary activities at campuses such as the number of national or international conferences or building constructions. For example, if the EF measurement is conducted in a year in which a university organized several international conferences (impact of guests) or during the same year engaged with new building construction, definitely the EF in that year is radically higher than normal. Therefore, analyzing the EF during one academic year is not reliable.
Furthermore, the assessment of the EF at a campus scale, as conducted in the reviewed literature, does not provide detailed information. Understanding which part of a university such as colleges, cafeterias, libraries, sports centers, etc. behaves unsustainably is essential to outline sustainable policy plans. Among 14 reviewed university campuses in terms of EF assessment, none of them has conducted EFA at the building scale. In the majority of the university campuses (at six campuses, including this study), fossil fuel energy has the highest environmental impact, followed by mobility (at four campuses), waste (at two campuses), and food (at two campuses). Only on a campus, the built-up land had the highest environmental impact (Table 1). The per capita EF varies between 0.16 gha (Tianjin University, China) and 8.66 gha (Ohio State University, the USA). The EFI was only calculated for Tianjin University (0.61). The EFI was only calculated for Tianjin University (0.61). We also calculated the EFI for the UOK campus.
3. Case Study
The case study, the University of Kurdistan (UOK), is located in the south of Sanandaj city, Kurdistan province, Iran. The UOK is located at a latitude of 35°16′ North and a longitude of 46°59′ East. It is one of the largest universities in the West of the country. The UOK campus has a total area of 101 ha (hectare) and includes seven faculties, three dormitory building blocks, two restaurants and cafeterias, several office buildings, a central building of classes (Gollan Building), several amphitheaters, several labs, outdoor/indoor sports centers, and two central libraries. The mean population (students and staff) during the four years of research was about 9982 people. In Figure 1 two faculties at the UOK are shown (left: the Faculty of The Literature and Languages; right: the Faculty of Engineering) as an example.
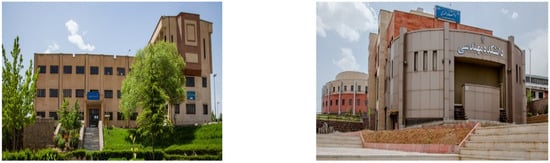
Figure 1.
The Faculty of Engineering (Right) and the Faculty of Literature and Languages (Left), UOK campus.
4. Research Method
Since the type of EF approach is primarily selected based on the size of a case study and the available data resolution [11], the detailed data of the resource consumption and waste production is a key factor. The component approach is more flexible when the goal of the EF assessment is to measure the impact of activities in a smaller area (at campus scale) [46]. Accordingly, in this research, the component-based model was applied to assess the EF of the UOK campus. In the methodology, five components, including natural gas (m3) and electricity consumption (kWh), water (m3) and food usage (Ton), and waste production (Ton), have been analyzed in the period of four years, 2013–2016. The applied methodology is outlined in Figure 2.
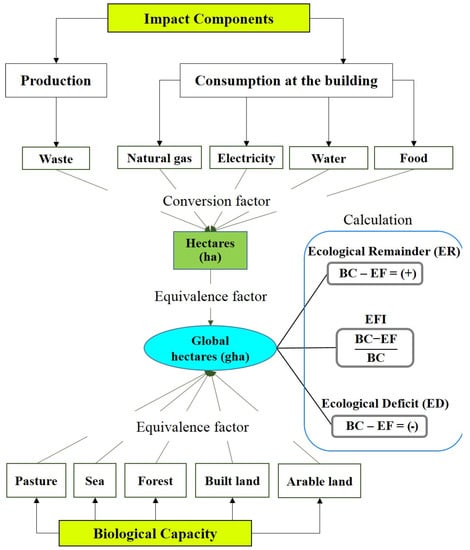
Figure 2.
Flowchart of the developed model for the UOK.
4.1. Data Collection and Cleaning
The necessary data were attained directly from the Central Office and the Central Services Office of the University of Kurdistan at the building scale. Some parts of the data were attained via survey and interview with the relevant managers. The collected data were categorized into four classes, including fossil energy (natural gas and electricity consumption), water and food usage, and waste production for four academic years (2013–2016). If mobility is excluded from EFA, the EF value of different universities converges toward more similar values [48]. This strategy makes the comparison between campuses more accurate, so the contribution of mobility is not calculated in this research. Mobility is better to be considered separately to assess the EF in higher educational institutions [49].
4.1.1. Energy Consumption
The data of fossil energy, including electricity and natural gas consumption, was attained from the Central Services Office of the university. To raise the accuracy of the calculation, we have also extracted detailed data from the monthly bills of the local meters at the building level.
4.1.2. Water Usage
The data of the water usage was also obtained from the Central Services Office of the university and its granularity is the same as the energy data.
4.1.3. Food Usage
The amount of food usage at the UOK campus was provided by the central services. We have also used 560 invoices in a year collected from the university restaurants. A survey and interview were also conducted to calculate the amount of food usage. Food variables were divided into the following categories: rice, meat, fish, dairy, vegetables, and oil.
4.1.4. Waste Production
The waste production data were obtained via interviews with university waste disposal officials. Since waste is collected daily at the university, we have estimated the amount of the waste during a day according to the allowed load on trucks. Then, the annual waste weight in tons was estimated. The recorded reports of the Central Services Office were applied in the estimations. Apparently, on some days there was no waste, particularly during the holidays.
4.1.5. Biological Capacity
As explained, Biological Capacity (BC) has a fundamental role in ecological sustainability. To calculate the BC for the UOK campus, first, the necessary data such as the area of forests, agricultural lands, etc. were obtained from the Forest, Range and Watershed Management Organization (FRWMO) of Kurdistan province [50], and then this information was double-checked using the data obtained from the Agriculture Jihad Organization (AJO) [51]. Based on the validated data, the BC for the province was calculated (1,397,698 gha) and then the BC per capita was determined, which was 0.93. The province BC extrapolated for the UOK campus was based on its mean population. The BC per capita for Kurdistan province was calculated and the results are presented in Table 2.
Table 2.
Kurdistan province’s per capita BC in 2016.
4.2. Ecological Footprint Calculation for UOK Campus
Total EF (gha) was determined via a weighted sum of the total natural resources consumption components and waste production divided by pi (ha/ton/year), where ci (amount/year) is the amount of the consumed resources or waste production in a year, efi (global ha/ha) is a constant coefficient, and pi (ha/ton/year) is the land productivity (Equation (1)) [48]. In Table 3 the constant coefficients used in the calculation of ecological footprint are compiled from [48,52].
Table 3.
Constant coefficients used in the calculation of ecological footprint.
A region’s BC (gha) for any land use type is calculated as follows (Equation (2)) [53].
where A is the available area for a given land use type (ha), YF is the yield factor that is different for anywhere (Equation (3)) [53], and EqF is the equivalent factor.
BC (gha) = A . YF . EqF
As most human settlements are located in the most fertile areas of the world [54], arable land and built area are equal in the amount of EqF. The equivalent factors for various land types are presented in Table 4 [55].
Table 4.
Equivalent factors for various land types.
4.3. Ecological Deficit and Ecological Reminder
The Ecological Deficit (ED) indicates that the ecological resilience capacity is insufficient, whereas the Ecological Remainder (ER) indicates that the ecological capacity is surplus, i.e., more than the resource consumption and the amount of waste neutralization. This concept is illustrated in Figure 3.
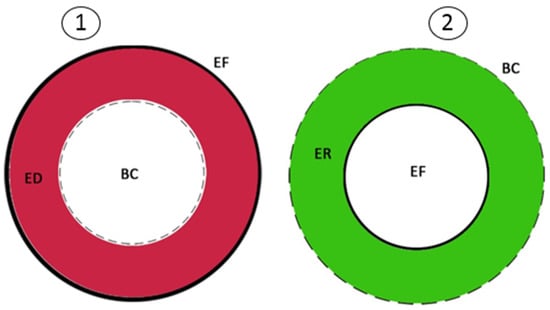
Figure 3.
Ecological deficit (1) and ecological remainder (2).
ED: when EF is larger than BC (Figure 3, on the left).
ER: when EF is smaller than BC (Figure 3, on the right).
BC and EF are used to determine whether a region is located in an ecological remainder or ecological deficit situation. They are calculated as follows (Equation (4)) [12]:
ER and ED show the given regions with footprints larger and smaller than their capacity (BC), respectively. To show how much they are smaller than the threshold, in other words, to depict how much they are sustainable, the authors of this research have used another concept, i.e., Ecological Footprint Index (EFI), which determines the level of sustainability. EFI presents more information compared with ER or ED.
4.4. The Ecological Footprint Index Concept
The Ecological Footprint Index (EFI) is the percentage difference between the ecological resilience capacity and the ecological footprint and shows the level of sustainability of a given region. Equation (5) [12] is applied to calculate the EFI. The interpretation of EFI and its relationship with the sustainability level are shown in Table 5 [12]. In terms of sustainability, there are four levels of a society’s performance. Each level is interpreted using a numerical code from 1 to 4. The UOK’s EFI assessment is presented in Section 5.4.
Table 5.
Ecological footprint index.
5. Results
5.1. The Assessment of Ecological Footprint at UOK Campus
The EF per capita of the UOK campus over four years (2013–2016) has been determined and is presented in Table 6. Since the annual amount of waste production and food usage roughly is the same at the university, we have generalized the calculation of one year to the others for these components.
Table 6.
Ecological footprint (per capita) of UOK campus.
Figure 4 shows that the performance of the UOK campus in terms of EF per capita from 2013 to 2016 is not sustainable. In the first academic year (2013), the EF per capita was 1.05 gha, while the mean EF per capita was 1.69 gha. The highest EF per capita was observed in 2015 (2.11 gha), whereas the EF per capita in 2014 was 1.84 gha. In 2016, it was 1.74 gha. The percentage annual EF difference with the mean EF is presented in Figure 4. The results show that it is not logical to rely on data for one year for EF assessment as well as interpretation of the sustainability of a society. The EF of 2013 was much lower than that for the other years. The main reason relates to several construction projects such as the Central Services Office, Faculty of Art and Architecture, and renovation of Faculty of Humanities and Social Sciences, which were started in 2014 and continued until 2016.
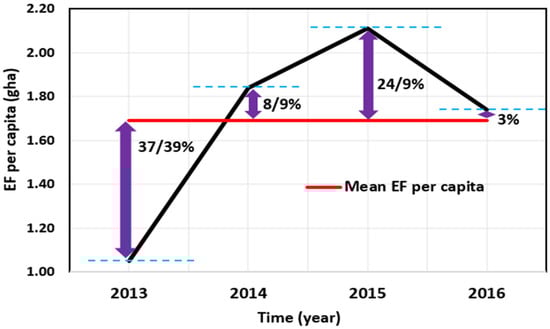
Figure 4.
Ecological footprint per capita of the UOK campus.
Figure 5 presents a detailed breakdown of the mean EF of the UOK campus throughout the study. About 70.73% of the total ecological footprint belonged to fossil fuel energy consumption, followed by waste production (26.87%), food usage (1.28%), and water usage (1.12%) respectively.
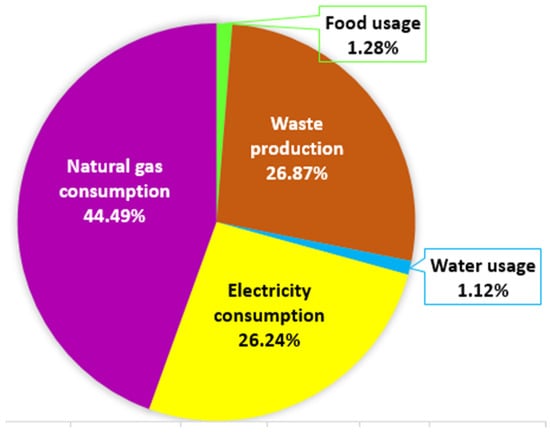
Figure 5.
Percentage of the mean ecological footprint of each component.
The result of electricity and water EF at the building scale over four years, 2013–2016, is presented in Figure 6. It can be observed where and when the electricity and water at the UOK campus had the most and least amount of EF per capita. This analysis does not include the natural gas consumption because the breakdown data of gas consumption at the building scale was not available.
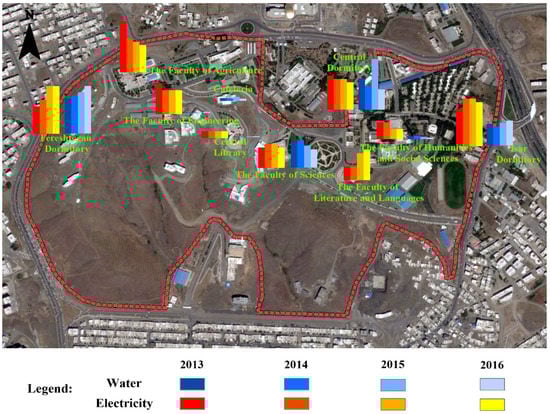
Figure 6.
Annual (2013–2016) ecological footprint breakdown of water and electricity.
The Ecological Footprint Assessment for Food Usage
The food component consisted of meat, fish, rice, vegetable, dairy, and oil usage. The mean (2013–2016) EF of food usage at the UOK was 204 gha (Table 6). Figure 7 shows the six categories of food usage. The highest EF belonged to meat usage (94.13 gha), whereas the lowest EF belonged to oil usage (2.1 gha).
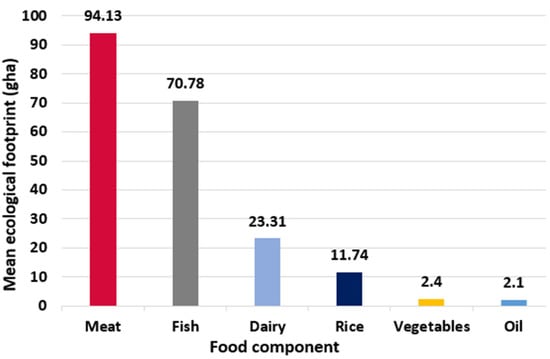
Figure 7.
Mean (2013–2016) ecological footprint of food usage at UOK.
5.2. Mapping the Ecological Footprint Assessment at the UOK Campus
In addition to the campus-scale EF calculation, this index was assessed for each building as well. Figure 8 shows the Ecological Footprint Map (EFM) of the UOK campus, in which the west and east parts of the campus have the highest level of environmental impacts. Therefore, the first step to decrease the EF at the UOK should be commenced with the buildings that are located in the west and east parts of the university campus (i.e., the Isar Dormitory, the Fereshtegan Dormitory, the Central Dormitory and the Faculty of Agriculture and the Faculty of Natural Resources).
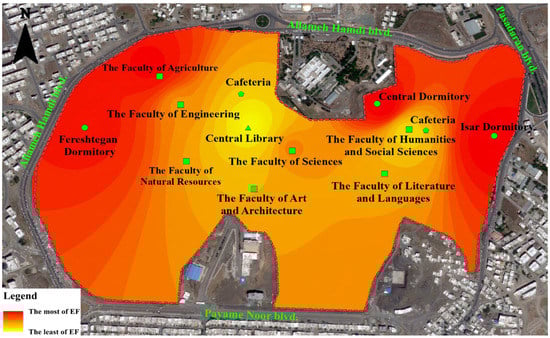
Figure 8.
Ecological footprint map of the UOK campus.
5.3. The Ecological Deficit and the Ecological Remainder at the UOK Campus
The BC per capita (gha) and EF per capita (gha) have been determined for the UOK campus over the study period (2013–2016) and the results are presented in Table 7. The mean BC per capita in the UOK was 0.93 gha, while the mean EF per capita was 1.69 gha. This indicates that the performance of the UOK in terms of a comparison of BC with EF is not desirable because the amount of BC per capita is smaller than the EF per capita. In other words, the amount of R-D was negative (ED). This means that the environmental resources cannot provide a balance between resources consumption or waste production and ecological replenishment at the UOK campus.
Table 7.
Ecological deficit (ED) and ecological remainder (ER) at the UOK campus in 2013‒2016.
5.4. Ecological Footprint Index (EFI), the Sustainability Indicator of the UOK Campus
The sustainability level of the UOK campus was calculated using an Ecological Footprint Index (EFI) and the results are presented in Table 8. The negative EFI shows the dire situation of the campus. Comparing the EFI results of the UOK campus with the sustainability level presented in Table 5 indicates that a sustainable level at the UOK was not obtained at all, in contrast, a strong unsustainability level in 2015 (−1.27) was observed. The best performance was −0.13 in 2013. These results have been attained without considering other components like transportation, paper usage, etc. If these components were considered the results would be worse.
Table 8.
Sustainability level of the UOK campus.
6. Discussion
The EF, as well as the sustainability level (EFI) of the UOK campus, have been determined over four years. The mean EF based on five components, including natural gas and electricity consumption, water and food usage, and waste production were 7512, 4290, 181, 204, and 4297 gha, respectively. Natural gas consumption with 44.49% had the highest portion and water usage with 1.12% had the lowest portion of the total EF at the UOK throughout 2013–2016. According to the results, fossil fuel energy consumption (electricity and gas) had the highest level of environmental impact, followed by waste, food, and water (Figure 5). This research revealed that energy consumption had a major ecological footprint at the UOK campus.
The EF of the UOK campus over four academic years was analyzed and the results such as mean EF per capita (1.69 gha per capita) during this period were compared with other studies. At the UOK, the total EF (16,484 gha) is high in comparison with the EF of most other universities. In some cases, it was five times higher (Figure 9).
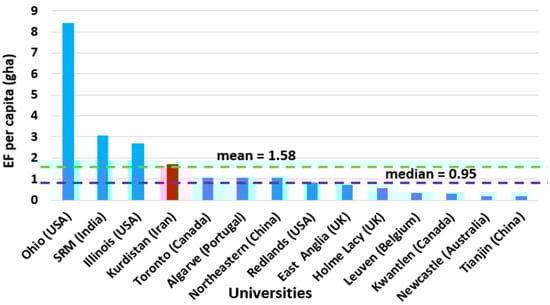
Figure 9.
Comparing the ecological footprint (per capita) of the UOK with other universities.
The EF of fossil fuel energy at the UOK is significantly high (70.73%), whereas at some universities like Tianjin (7.8% of total EF), Leuven (17.83% of total EF), and Kwantlen (28.91% of total EF) it is lower than 30% (Table 1). This indicates that the UOK officials must apply effective plans to decline fossil energy consumption. At Redlands University, Northeastern University, the University of Toronto, Illinois University, the University of Algarve, and the Kurdistan University the energy consumption is the most important component in terms of the total percentage of EF. In other words, at six universities (40% all studied universities) the energy has the largest impact on the environment. Among these universities, the highest and the lowest per capita EF belonged to Ohio State University with 8.66 gha per capita and Tianjin with 0.16 gha per capita respectively. The UOK’s per capita EF was 1.69 gha so that it was larger than the mean EF (1.58 gha per capita) of the fifteen studied universities. In addition, the UOK is the fourth highest university in terms of per capita EF after Ohio State (8.66 gha per capita), Sri Ramaswamy Memorial (SRM) (3.06gha per capita), and Illinois (2.66 gha per capita).
The proportion of the total water EF at the UOK (1.12% of total EF) is low, which is comparable with the performance of the University of East Anglia (0.25% of total EF) and the University of Leuven (0.01 of total EF). However, water EF should be considered as a vital component because freshwater scarcity is one of the fundamental environmental challenges in the world, particularly in semiarid countries such as Iran. It is so important to include water footprint as one of the components of the footprint family [56].
Furthermore, among these fifteen reviewed universities, the EFI was only calculated at Tianjin University and the UOK. The amount of mean EFI at the UOK (−0.82) is considerably lower than at Tianjin University (0.61). It shows that the performance of the University of Kurdistan is radically unsustainable.
In Table 9, we have suggested several recommendations to decline the EFI of the UOK. These recommendations can be extrapolated into other universities in the world. These recommendations may be implemented by officials, faculty members, staff, or students.
Table 9.
Recommendations (action, strategy) to decrease the ecological footprint of the UOK.
7. Conclusions
Global warming and other negative impacts of humans on the environment are the main challenges of the world. Consequently, the concept of sustainable development has been frequently investigated to address these challenges. In recent years, the Ecological Footprint Assessment (EFA) tool has played a significant role in evaluating sustainable development performance, especially in academic institutes. Applying EFA helps the planners to explore which part of a community and to what extent has a higher impact on the environment. This information forms the foundation of future sustainable action plans to diminish the environmental impacts.
Accordingly, this paper focused on the assessment of EF at the UOK campus to explore how the campus performs sustainability development. In the research, the index of EF was studied from 2013 to 2016 based on Gottlieb, Vigoda-Gadot, Haim, and Kissinger’s recommendation to further develop the approach [26]. Comparing with the reviewed studies that evaluated the EF at the campus scale, the authors of this study have assessed the EF of the UOK at the building scale as well as the campus scale.
The methodology for the assessment of the EF was developed in terms of the longer period of the study, data cleaning, visualization, and conducting the assessment simultaneously at both community and individual building levels. Furthermore, the authors developed the EF method by illustrating the Ecological Footprint Map (EFM) for the UOK campus. The map showed that the west and east parts of the campus have the highest level of environmental impacts. The developed method can be replicated in all urban communities as well as universities.
The results show the mean ecological footprint (per capita) of the UOK campus and the EFI were 1.69 gha and −0.82 throughout the study period. It indicates that the UOK ecological performance is unsustainable. A detailed breakdown of the mean EF of the campus was presented throughout the study. Fossil fuel energy consumption, which had the highest total EF (70.73%), should be considered in future sustainability plans of the campus to decrease the UOK’s EF, followed by waste production (26.87%). According to the EF assessment of food usage, meat (94.13 gha) and oil (2.1 gha) usage had the highest and lowest EF respectively.
Among the fifteen reviewed universities, the UOK with an EF per capita of 1.69 was the fourth highest. Furthermore, the UOK had the highest EF (16,484 gha) after Ohio State University, Illinois University, SRM University, and Northeastern University.
Based on the EFA, a range of strategies and actions are suggested to diminish the impact of fossil fuel energy, reduce the water footprint, and decrease the impact of food components on the campus environment.
Author Contributions
Conceptualization, S.V., H.A. and W.L.; methodology, S.V. and H.A.; software, H.A., W.L. and S.M.; validation, S.V., H.A. and W.L.; formal analysis, S.V., H.A., W.L. and S.M.; investigation, S.V., H.A. and W.L.; resources, S.V., W.L. and S.M.; data curation, S.V., H.A. and W.L.; writing—original draft preparation, S.V. and W.L.; writing—review and editing, S.V., H.A., W.L. and S.M.; visualization, S.V. and W.L.; research supervision, H.A. and S.V.; project administration, W.L.; funding acquisition, S.V., H.A., W.L. and S.M. All authors have read and agreed to the published version of the manuscript.
Funding
This research received no external funding.
Institutional Review Board Statement
Not applicable.
Informed Consent Statement
Not applicable.
Data Availability Statement
The collected data can be shared for free in future studies.
Conflicts of Interest
The authors declare no conflict of interest.
References
- United Nations, Department of Economic and Social Affairs, Population Division. World Population Prospects: The 2017 Revision, Key Findings and Advance Tables. 2017. Available online: https://population.un.org/wpp/publications/files/wpp2017_keyfindings.pdf (accessed on 12 February 2021).
- Torregrosa-López, J.I.; Bellver-Navarro, C.G.; Lo Iacono-Ferreira, V.G. Experiences in the use of Ecological Footprint as a sustainability indicator. Cuad. de Biodivers. 2011. [Google Scholar] [CrossRef] [Green Version]
- Alizadeh, H. The Challenge of Sustainable Urban Development in Third World Countries. In Proceedings of the Designing Soundscape for Sustainable Urban Development, Stockholm, Sweden, 30 September–1 October 2010. [Google Scholar]
- Blum, O.; Wackernagel, M. How to Build Lasting Success on Our Finite Planet; Global Footprint Network (GFN) and Schneider Electric, USA. 2020. Available online: https://roscongress.org/upload/medialibrary/6ea/Earth-Overshoot-Day-_-Final.pdf (accessed on 12 February 2021).
- Hoekstra, A.Y.; Chapagain, A.K.; Mekonnen, M.M.; Aldaya, M.M. The Water Footprint Assessment Manual: Setting the Global Standard; Earthscan: London, UK, 2011. [Google Scholar]
- Global Temperature Rise. The Evidence for Rapid Climate Change. 2021. Available online: https://climate.nasa.gov/evidence/ (accessed on 12 February 2021).
- Khan, T. Sustainability accounting courses, Talloires Declaration and academic research. Sustain. Higher Educ. 2013, 14, 42–55. [Google Scholar] [CrossRef]
- Wright, T.S.A. A Tenth Year Anniversary Retrospect: The Effect of the Halifax Declaration on Canadian Signatory Universities. Can. J. Environ. Educ. (CJEE) 2003, 8, 235–248. [Google Scholar]
- Milutinović, S.; Nikolić, V. Rethinking higher education for sustainable development in Serbia: An assessment of Copernicus charter principles in current higher education practices. Clean. Prod. 2014, 62, 107–113. [Google Scholar] [CrossRef]
- Collins, A.; Flynn, A. Engaging with the ecological footprint as a decision-making tool: Process and responses. Local Environ. 2007, 12, 295–312. [Google Scholar] [CrossRef]
- Gottlieb, D.; Kissinger, M.; Vigoda-Gadot, E.; Haim, A. Analyzing the ecological footprint at the institutional scale–The case of an Israeli high-school. Ecol. Indic. 2012, 18, 91–97. [Google Scholar] [CrossRef]
- Liu, H.; Wang, X.; Yang, J.; Zhou, X.; Liu, Y. The ecological footprint evaluation of low carbon campuses based on life cycle assessment: A case study of Tianjin, China. Clean. Prod. 2017, 144, 266–278. [Google Scholar] [CrossRef]
- Wright, E.; Gill, B.; Wallin, P.; Hutchison, K.; Prebble, M. The Ecological Footprint of UEA: Calculation, Analysis and Strategies, ENV 3A20: Global Environmental Change; University of East Anglia: East Anglia, UK, 2009. [Google Scholar]
- Klein-Banai, C.; Theis, T.L. An urban university’s ecological footprint and the effect of climate change. Ecol. Indic. 2011, 11, 857–860. [Google Scholar] [CrossRef] [Green Version]
- Poveda, C.A.; Lipsett, M.G. A review of sustainability assessment and sustainability/environmental rating systems and credit weighting tools. Sustain. Dev. 2011, 4, 36–55. [Google Scholar] [CrossRef]
- Wiedmann, T.; Minx, J. A Definition of ‘Carbon Footprint’. In C. C. Pertsova, Ecological Economics Research Trends; Nova Science Publishers: Hauppauge, NY, USA, 2008; Chapter 1; pp. 1–11. [Google Scholar]
- Hoekstra, A.Y. (Ed.) Virtual water trade. In Proceedings of the International Expert Meeting on Virtual Water Trade, Delft, The Netherlands, 12–13 December 2002; Value of Water Research Report Series No.12; UNESCO-IHE: Delft, The Netherlands, 2003. [Google Scholar]
- Wiedmann, T.O.; Schandl, H.; Lenzen, M.; Moran, D.; Suh, S.; West, J.; Kanemoto, K. The material footprint of nations. Proc. Natl. Acad. Sci. USA 2015, 112, 6271–6276. [Google Scholar] [CrossRef] [Green Version]
- Vaisi, S.; Pilla, F.; McCormac, D.; McCormack, S.J. Towards urban energy density (UED) definition. In Proceedings of the Energy for Sustainability, Sustainable Cities: Designing for People and the Planet, Coimbra, Portugal, 14–15 May 2015. [Google Scholar] [CrossRef]
- Ulucak, R.; Apergis, N. Does convergence really matter for the environment? An application based on club convergence and on the ecological footprint concept for the EU countries. Environ. Sci. Policy 2018, 80, 21–27. [Google Scholar] [CrossRef] [Green Version]
- Syrovátka, M. On sustainability interpretations of the Ecological Footprint. Ecol. Econ. 2020, 169, 106543. [Google Scholar] [CrossRef]
- Wang, X.C.; Zhang, L.; Dzakpasu, M.; Chen, R. Validity and utility of ecological footprint accounting: A state-of-the-art review. Sustain. Cities Soc. 2017, 32, 411–416. [Google Scholar] [CrossRef]
- Ewing, B.; Moore, D.; Goldfinger, S.; Oursler, A.; Reed, A.; Wackernagel, M. The Ecological Footprint Atlas 2010; Global Footprint Network: Oakland, CA, USA, 2010. [Google Scholar]
- Ortegon, K.; Acosta, P. Ecological footprint: A tool for environmental management in educational institutions. Sustain. High. Educ. 2019, 20, 675–690. [Google Scholar] [CrossRef]
- Lenzen, M.; Murray, S.A. A modified ecological footprint method and its application to Australia. Ecol. Econ. 2001, 37, 229–255. [Google Scholar] [CrossRef]
- Gottlieb, D.; Vigoda-Gadot, E.; Haim, A.; Kissinger, M. The ecological footprint as an educational tool for sustainability: A case study analysis in an Israeli public high school. Educ. Dev. 2012, 32, 193–200. [Google Scholar] [CrossRef]
- Hoekstra, A.Y. The Water Footprint of Modern Consumer Society, 2nd ed.; Routledge: London, UK, 2019. [Google Scholar]
- Ferng, J.-J. Nested open systems: An important concept for applying ecological footprint analysis to sustainable development assessment. Ecol. Econ. 2014, 106, 105–111. [Google Scholar] [CrossRef]
- Monfreda, C.; Wackernagel, M.; Deumling, D. Establishing national natural capital accounts based on detailed ecological footprint and biological capacity assessments. Land Use Policy 2004, 21, 231–246. [Google Scholar] [CrossRef]
- Rees, W.E. Ecological footprints and appropriated carrying capacity: What urban economics leaves out. Environ. Urban. 1992, 4, 121–130. [Google Scholar] [CrossRef]
- Barrett, J. Component ecological footprint: Developing sustainable scenarios. Impact Assess. Proj. Apprais. 2001, 19, 107–118. [Google Scholar] [CrossRef]
- Simmons, C.; Lewis, K.; Barrett, J. Two feet-two approaches: A component-based model of ecological footprinting. Ecol. Econ. 2000, 32, 375–380. [Google Scholar] [CrossRef]
- Hoekstra, A.Y. Human appropriation of natural capital: A comparison of ecological footprint and water footprint analysis. Ecol. Econ. 2008, 68, 1963–1974. [Google Scholar] [CrossRef] [Green Version]
- Vaisi, S.; Dyer, D.; Pilla, F. Energy requirement mapping for university campus using CIBSE benchmarks and comparing CIBSE to display energy certificate (DEC) to extract a new criterion. In Proceedings of the Energy Systems Conference, London, UK, 24–25 June 2014. [Google Scholar] [CrossRef]
- Jabbour, C.J.C.; De Castro, R. Evaluating sustainability of an Indian university. Clean. Prod. 2013, 61, 54–58. [Google Scholar] [CrossRef]
- Parvez, N.; Agrawal, A. Assessment of sustainable development in technical higher education institutes of India. Clean. Prod. 2019, 214, 975–994. [Google Scholar] [CrossRef]
- Adjei, R.; Addaney, M.; Danquah, L. The ecological footprint and environmental sustainability of students of a public university in Ghana: Developing ecologically sustainable practices. Int. J. Sustain. High. Educ 2021. ahead-of-print. [Google Scholar] [CrossRef]
- Lambrechts, W.; Van Liedekerke, L. Using ecological footprint analysis in higher education: Campus operations, policy development and educational purposes. Ecol. Indic. 2014, 45, 402–406. [Google Scholar] [CrossRef] [Green Version]
- Flint, K. Institutional ecological footprint analysis-A case study of the University of Newcastle, Australia. Sustain. High. Educ. 2001, 2, 48–62. [Google Scholar] [CrossRef]
- Venetoulis, J. Assessing the ecological impact of a university: The ecological footprint for the University of Redlands. Sustain. High. Educ. 2001, 2, 180–197. [Google Scholar] [CrossRef]
- Dawe, G.F.; Vetter, A.; Martin, S. An overview of ecological footprinting and other tools and their application to the development of sustainability process: Audit and methodology at Holme Lacy College, UK. Sustain. High. Educ. 2004, 5, 340–371. [Google Scholar] [CrossRef]
- Burgess, B.; Lai, J. Ecological Footprint Analysis and Review: Kwantlen University College; Kwantlen University College: Vancouver, BC, Canada, 2006. [Google Scholar]
- Janis, J. Quantifying the Ecological Footprint of the Ohio State University; BSc; Thesis on the School of Environment and Natural Resources. Ph.D. Thesis, The Ohio State University, Columbus, OH, USA, 2007. [Google Scholar]
- Thattai, D. Ecological footprint calculation for a college campus in South India. Environ. Res. Dev. 2007, 2, 237–242. [Google Scholar]
- Li, G.; Wang, Q.; Gu, X.; Liu, J.; Ding, Y.; Liang, G. Application of the componential method for ecological footprint calculation of a Chinese university campus. Ecol. Indic. 2008, 8, 75–78. [Google Scholar] [CrossRef]
- Conway, T.M.; Dalton, C.; Loo, J.; Benakoun, L. Developing ecological footprint scenarios on university campuses. Sustain. High. Educ. 2008, 9, 4–20. [Google Scholar] [CrossRef]
- Bell, I.; Curry, V.; Kuperus, S.; Myers, L.; Walsh, A.; Walton, S. An Ecological Footprint Analysis of the Department of Zoology, University of Otago. Otago Manag. Grad. Rev. 2008, 6, 1–20. [Google Scholar]
- Nunes, L.; Catarino, A.; Teixeira, M.R.; Cuesta, E. Framework for the inter-comparison of ecological footprint of universities. Ecol. Indic. 2013, 32, 276–284. [Google Scholar] [CrossRef]
- Perez-Lopez, J.-B.; Orro, A.; Novales, M. Environmental Impact of Mobility in Higher-Education Institutions: The Case of the Ecological Footprint at the University of A Coruña (Spain). Sustainability 2021, 13, 6190. [Google Scholar] [CrossRef]
- The Forest, Range and Watershed Management Organization. Kurdistan Province. 2016. Available online: https://kordestan.frw.ir/00/Fa/default.aspx/ (accessed on 1 November 2016).
- The Agriculture Jihad Organization. Kurdistan Province. 2016. Available online: http://kurdistan.agri-jahad.ir/HomePage.aspx?TabID=4953&Site=douranportal&Lang=fa-IR/ (accessed on 1 November 2016).
- Solís-Guzmán, J.; Marrero, M.; Ramírez-de-Arellano, A. Methodology for determining the ecological footprint of the construction of residential buildings in Andalusia (Spain). Ecol. Indic. 2013, 25, 239–249. [Google Scholar] [CrossRef]
- Stechbart, M.; Wilson, J. Province of Ontario Ecological Footprint and Biocapacity Analysis; Global Footprint Network: Oakland, CA, USA, 2010. [Google Scholar]
- Wackernagel, M.; Yount, J.D. The ecological footprint: An indicator of progress toward regional sustainability. Environ. Monit. Assess. 1998, 51, 511–529. [Google Scholar] [CrossRef]
- Wackernagel, M.; Onisto, L.; Bello, P.; Linares, A.C.; Falfán, I.S.L.; García, J.M.; Guerrero, A.I.S.; Guerrero, M.G.S. National natural capital accounting with the ecological footprint concept. Ecol. Econ. 1999, 29, 375–390. [Google Scholar] [CrossRef]
- Galli, A.; Wiedmann, T.; Ercin, E.; Knoblauch, D.; Ewing, B.; Giljum, S. Integrating ecological, carbon and water footprint into a “footprint family” of indicators: Definition and role in tracking human pressure on the planet. Ecol. Indic. 2012, 16, 100–112. [Google Scholar] [CrossRef]
Publisher’s Note: MDPI stays neutral with regard to jurisdictional claims in published maps and institutional affiliations. |
© 2021 by the authors. Licensee MDPI, Basel, Switzerland. This article is an open access article distributed under the terms and conditions of the Creative Commons Attribution (CC BY) license (https://creativecommons.org/licenses/by/4.0/).