Environmental DNA and Specific Primers for Detecting the Invasive Species Ectopleura crocea (Hydrozoa: Anthoathecata) in Seawater Samples


Abstract
1. Introduction
2. Materials and Methods
2.1. Sample Collection
2.2. Molecular Identification of E. crocea
2.2.1. DNA Extraction, Amplification, and Sequencing
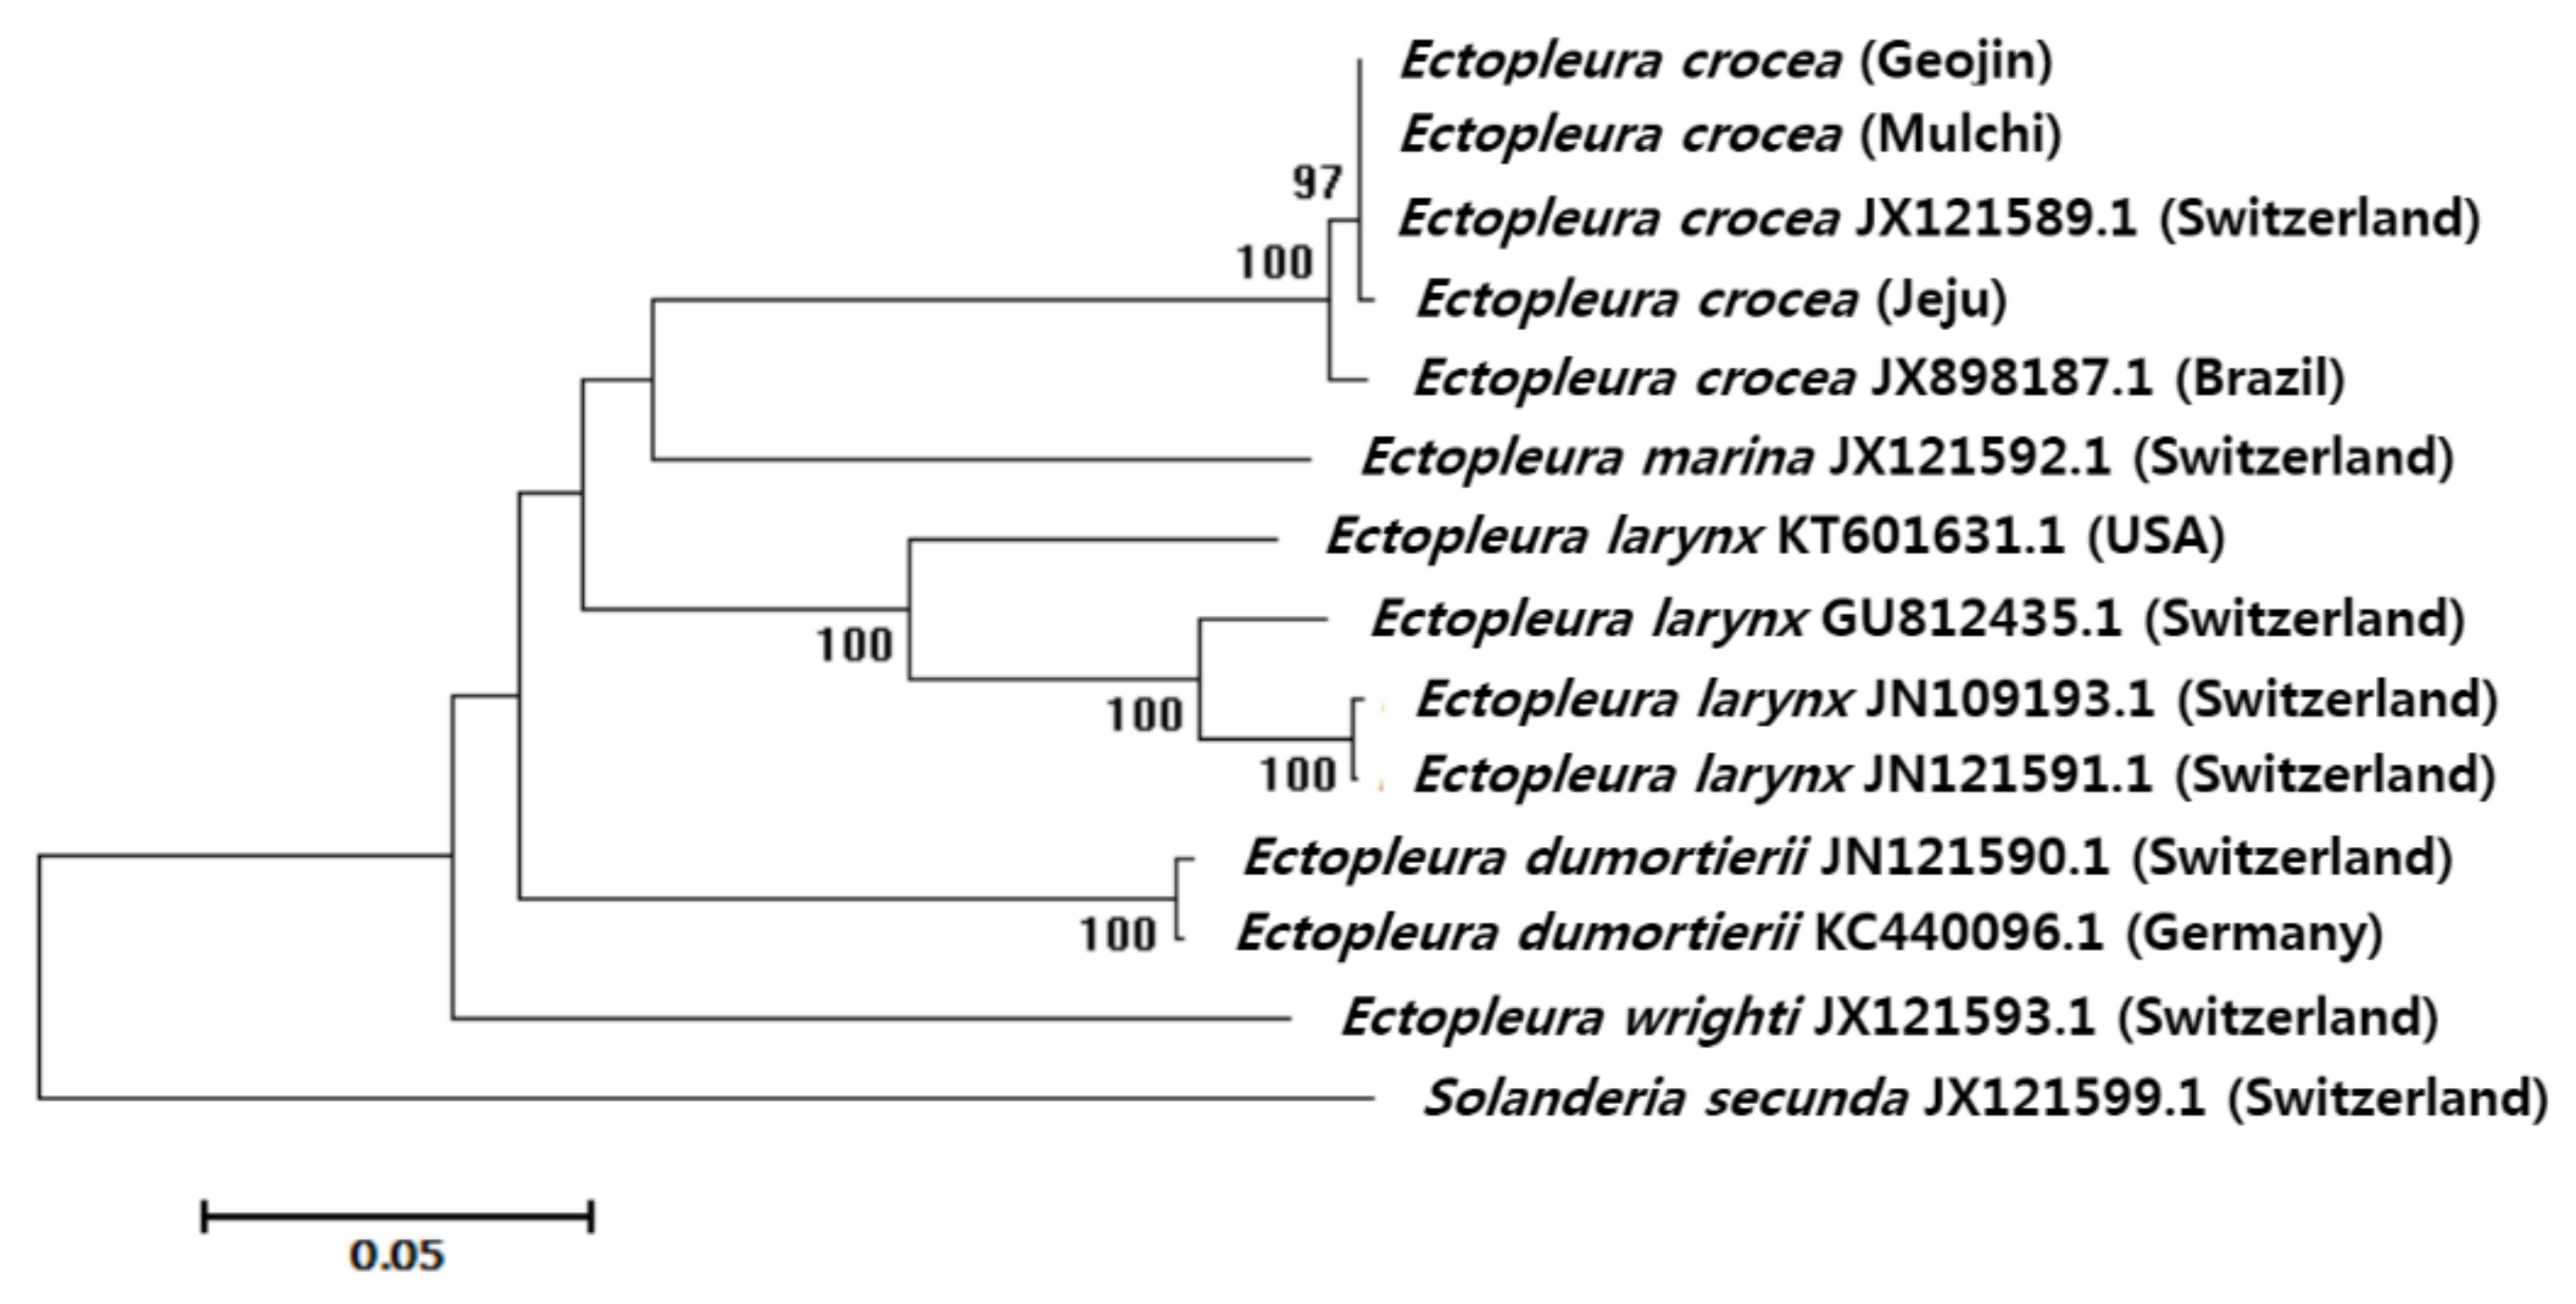
2.2.2. Sequence and Phylogenetic Analyses
2.3. Species-Specific Primers and eDNA
2.3.1. E. crocea-Specific Primers and Probe Design
2.3.2. Collection and Isolation of eDNA
2.3.3. eDNA Amplification
3. Results
4. Discussion
Author Contributions
Funding
Conflicts of Interest
Appendix A

| Phylum | Class | Species | Accession Number |
|---|---|---|---|
| Porifera | Demospongiae | Amphimedon compressa | EU237474 |
| Aplysina fulva | EU237476 | ||
| Callyspongia plicifera | EU237477 | ||
| Chondrilla nucula | EU237478 | ||
| Halisarca dujardini | EU237483 | ||
| Hippospongia lachne | EU237484 | ||
| Igernella notabilis | EU237485 | ||
| Iotrochota birotulata | EU237486 | ||
| Plakinastrella onkodes | EU237487 | ||
| Topsentia ophiraphidites | EU237482 | ||
| Vaceletia sp. | EU237489 | ||
| Xestospongia muta | EU237490 | ||
| Cnidaria | Hydrozoa | Clava multicornis | JN700935, NC 016465 |
| Craspedacusta sowerbyi | JN593332, NC 018537 | ||
| Cubaia aphrodite | JN700942, NC 016467 | ||
| Hydra magnipapillata | NC 011221 | ||
| Hydra oligactis | EU237491, NC 010214 | ||
| Hydra sinensis | JX089978, NC 021406 | ||
| Hydra vulgaris | HM369413 | ||
| Hydra vulgaris | HM369414 | ||
| Laomedea flexuosa | JN700945, NC 016463 | ||
| Turritopsis dohrnii | KT020766, KT899097, NC 031213 | ||
| Scyphozoa | Aurelia aurita | DQ787873, HQ694729, NC 008446 | |
| Aurelia sp. | LC005413, LC005414 | ||
| Cassiopea frondosa | JN700936, NC 016466 | ||
| Chrysaora quinquecirrha | HQ694730, NC 020459 | ||
| Craspedacusta sowerbyi | JN593332 | ||
| Haliclystus antarcticus | KU947038, NC 030337 | ||
| Anthozoa | Alveopora allingi | AB907079 | |
| Alveopora catalai | AB907081 | ||
| Alveopora excelsa | AB907085 | ||
| Alveopora japonica | AB907087 | ||
| Alveopora sp. | KJ634271 | ||
| Alveopora spongiosa | AB907093 | ||
| Alveopora tizardi | AB907096 | ||
| Alveopora verrilliana | AB907097 | ||
| Arthropoda | Hexanauplia | Acasta sulcata | KJ754818, NC 029168 |
| Amphibalanus amphitrite | KF588709, NC 024525 | ||
| Armatobalanus allium | KJ754817, NC 029167 | ||
| Balanus balanus | KM660676, NC 026466 | ||
| Capitulum mitella | AB167462 | ||
| Chelonibia testudinaria | KJ754819, NC 029169 | ||
| Chthamalus antennatus | KP294312, NC 026730 | ||
| Epopella plicata | KM008743, NC 033393 | ||
| Lepas anserifera | KP294311, NC 026576 | ||
| Lepas australis | KM017964, NC 025295 | ||
| Megabalanus ajax | KF501046, NC 024636 | ||
| Megabalanus volcano | AB167539, NC 006293 | ||
| Pollicipes mitella | AY514042 | ||
| Pollicipes polymerus | AY456188, NC 005936 | ||
| Striatobalanus amaryllis | KF493890, NC 024526 | ||
| Tetraclita japonica | AB126701, NC 008974 | ||
| Tetraclita serrata | KJ434948, NC 029154 | ||
| Tetraclitella divisa | KJ754822, NC 029170 | ||
| Bryozoa | Gymnolaemata | Bugula dentata | KC129718 |
| Bugula flabellata | AY061749 | ||
| Bugula fulva | KC129719 | ||
| Bugula migottoi | KC129720 | ||
| Bugula neritina | AY690838, KC129722, KC129735, KC129735, KC129754, KC129822 | ||
| Bugula stolonifera | KC129849 | ||
| Bugula turrita | KC129850 | ||
| Celleporella hyalina | JQ839275, JQ839276, NC 018344 | ||
| Flustra foliacea | JQ061319, NC 016722 | ||
| Flustrellidra hispida | DQ157889, NC 008192 | ||
| Membranipora grandicella | NC 018355 | ||
| Tubulipora flabellaris | EU563937 | ||
| Watersipora subtorquata | EU365892, NC 011820 | ||
| Echinodermata | Crinoidea | Antedon mediterranea | AM404181, NC 010692 |
| Florometra serratissima | NC 001878 | ||
| Neogymnocrinus richeri | DQ068951, NC 007689 | ||
| Phanogenia gracilis | DQ068952, NC 007690 | ||
| Asteroidea | Acanthaster brevispinus | AB231476, NC 007789 | |
| Acanthaster planci | AB231475, NC 007788 | ||
| Aphelasterias japonica | NC 025766 | ||
| Asterias amurensis | AB183559, NC 006665 | ||
| Astropecten polyacanthus | AB183560, NC 006666 | ||
| Luidia quinalia | AB183558 | ||
| Patiria pectinifera | D16387 | ||
| Ophiuroidea | Amphipholis squamata | FN562578, NC 013876 | |
| Astrospartus mediterraneus | FN562580, NC 013878 | ||
| Astrospartus mediterraneus | NC 013878 | ||
| Ophiacantha linea | NC 023254 | ||
| Ophiocomina nigra | FN562577, NC 013874 | ||
| Ophiopholis aculeata | AF314589, NC 005334 | ||
| Ophiura albida | AM404180, NC 010691 | ||
| Ophiura lutkeni | AY184223, NC 005930 | ||
| Echinoidea | Arbacia lixula | NC 001770 | |
| Echinocardium cordatum | NC 013881 | ||
| Heliocidaris crassispina | NC 023774 | ||
| Hemicentrotus pulcherrimus | NC 023771 | ||
| Loxechinus albus | JX888466 | ||
| Mesocentrotus franciscanus | NC 024177 | ||
| Mesocentrotus nudus | NC 020771 | ||
| Nacospatangus alta | NC 023255 | ||
| Paracentrotus lividus | J04815 | ||
| Pseudocentrotus depressus | KC490913, NC 023773 | ||
| Sterechinus neumayeri | NC 027063 | ||
| Strongylocentrotus droebachiensis | EU054306, NC 009940 | ||
| Strongylocentrotus intermedius | KC490912, NC 023772 | ||
| Strongylocentrotus pallidus | NC 009941 | ||
| Strongylocentrotus purpuratus | NC 001453 | ||
| Temnopleurus hardwickii | NC 026200 | ||
| Holothuroidea | Apostichopus japonicus | EU294194 | |
| Balanoglossus clavigerus | NC 013877 | ||
| Cucumaria miniata | AY182376 | ||
| Holothuria forskali | NC 013884 | ||
| Holothuria scabra | NC 027086 | ||
| Parastichopus californicus | NC 026727 | ||
| Parastichopus nigripunctatus | NC 013432 | ||
| Parastichopus parvimensis | NC 029699 | ||
| Peniagone sp. | KF915304 | ||
| Stichopus horrens | HQ000092, NC 014454 | ||
| Chordata | Ascidiacea | Aplidium conicum | FN313538, NC 013584 |
| Aplidium tabarquensis | HF548555 | ||
| Ascidiella aspersa | HF548561, NC 021469 | ||
| Botrylloides leachii | HF548553, HG931921, NC 024103 | ||
| Botrylloides nigrum | HF548559, NC 021467 | ||
| Botrylloides pizoni | HF548554, HG931922, NC 024104 | ||
| Botrylloides violaceus | HF548552, NC 024256 | ||
| Botryllus schlosseri | FM177702, HF548550, HF548551, HG931923, NC 021463 | ||
| Ciona intestinalis | AJ517314, NC 004447 | ||
| Ciona intestinalis type B | AM292218, NC 017929 | ||
| Ciona savignyi | AB079784, NC 004570 | ||
| Clavelina lepadiformis | AM292603, FJ839918, NC 012887 | ||
| Clavelina phlegraea | AM292604, NC 024105 | ||
| Didemnum vexillum | KM259616, KM259617, NC 026107 | ||
| Diplosoma listerianum | FN313539, NC 013556 | ||
| Halocynthia roretzi | AB024528, NC 002177 | ||
| Halocynthia spinosa | HF548558, NC 021466 | ||
| Herdmania momus | AM292602, FN296153, NC 013561 | ||
| Microcosmus sulcatus | AM292321, NC 013752 | ||
| Phallusia fumigata | NC 009834 | ||
| Phallusia mammillata | AM292320, NC 009833 | ||
| Polycarpa mytiligera | HF548556, NC 021464 | ||
| Pyura gangelion | HF548557, NC 021465 | ||
| Rhodosoma turcicum | HF548560, NC 021468 | ||
| Styela clava | HG931920 | ||
| Styela plicata | AM292601, NC 013565 |
| 1 | 2 | 3 | 4 | 5 | 6 | 7 | 8 | 9 | 10 | 11 | 12 | 13 | 14 | |
|---|---|---|---|---|---|---|---|---|---|---|---|---|---|---|
| Ectopleura crocea (Geojin) | - | 0.000 | 0.002 | 0.000 | 0.004 | 0.019 | 0.019 | 0.020 | 0.020 | 0.020 | 0.019 | 0.018 | 0.022 | 0.029 |
| Ectopleura crocea (Mulchi) | 0.000 | - | 0.002 | 0.000 | 0.004 | 0.019 | 0.019 | 0.020 | 0.020 | 0.020 | 0.019 | 0.018 | 0.022 | 0.029 |
| Ectopleura crocea (Jeju) | 0.002 | 0.002 | - | 0.002 | 0.004 | 0.019 | 0.019 | 0.020 | 0.020 | 0.020 | 0.019 | 0.018 | 0.021 | 0.029 |
| Ectopleura crocea JX121589.1 (Switzerland) | 0.000 | 0.000 | 0.002 | - | 0.004 | 0.019 | 0.019 | 0.020 | 0.020 | 0.020 | 0.019 | 0.018 | 0.022 | 0.029 |
| Ectopleura crocea JX898187.1 (Brazil) | 0.009 | 0.009 | 0.011 | 0.009 | - | 0.019 | 0.019 | 0.020 | 0.021 | 0.021 | 0.019 | 0.018 | 0.021 | 0.029 |
| Ectopleura dumortierii JX121590.1 (Switzerland) | 0.190 | 0.190 | 0.192 | 0.190 | 0.187 | - | 0.002 | 0.020 | 0.020 | 0.020 | 0.020 | 0.020 | 0.020 | 0.028 |
| Ectopleura dumortierii KC440096.1 (Germany) | 0.187 | 0.187 | 0.190 | 0.187 | 0.185 | 0.003 | - | 0.020 | 0.020 | 0.020 | 0.021 | 0.020 | 0.020 | 0.028 |
| Ectopleura larynx GU812435.1 (Switzerland) | 0.199 | 0.199 | 0.197 | 0.199 | 0.207 | 0.195 | 0.192 | - | 0.009 | 0.008 | 0.014 | 0.020 | 0.021 | 0.028 |
| Ectopleura larynx JN109193.1 (Switzerland) | 0.204 | 0.204 | 0.202 | 0.204 | 0.211 | 0.192 | 0.195 | 0.038 | - | 0.002 | 0.014 | 0.021 | 0.020 | 0.029 |
| Ectopleura larynx JX121591.1 (Switzerland) | 0.204 | 0.204 | 0.202 | 0.204 | 0.211 | 0.192 | 0.195 | 0.036 | 0.002 | - | 0.014 | 0.020 | 0.020 | 0.029 |
| Ectopleura larynx KT601631.1 (USA) | 0.190 | 0.190 | 0.192 | 0.190 | 0.192 | 0.201 | 0.204 | 0.103 | 0.104 | 0.102 | - | 0.018 | 0.021 | 0.028 |
| Ectopleura marina JX121592.1 (Switzerland) | 0.176 | 0.176 | 0.179 | 0.176 | 0.176 | 0.218 | 0.215 | 0.187 | 0.198 | 0.196 | 0.170 | - | 0.022 | 0.027 |
| Ectopleura wrighti JX121593.1 (Switzerland) | 0.232 | 0.232 | 0.229 | 0.232 | 0.229 | 0.201 | 0.196 | 0.212 | 0.204 | 0.207 | 0.206 | 0.211 | - | 0.029 |
| Solanderia secunda JX121599.1 (Switzerland) | 0.347 | 0.347 | 0.350 | 0.347 | 0.350 | 0.328 | 0.323 | 0.323 | 0.340 | 0.337 | 0.329 | 0.318 | 0.334 | - |
References
- Rees, H.C.; Maddison, B.C.; Middleditch, D.J.; Patmore, J.R.; Gough, K.C. Review: The detection of aquatic animal species using environmental DNA—A review of eDNA as a survey tool in ecology. J. Appl. Ecol. 2014, 51, 1450–1459. [Google Scholar] [CrossRef]
- Foote, A.D.; Thomsen, P.F.; Sveegaard, S.; Wahlberg, M.; Kielgast, J.; Kyhn, L.A.; Salling, A.B.; Galatius, A.; Orlando, L.; Gilbert, M.T.P. Investigating the potential use of environmental DNA (eDNA) for genetic monitoring of marine mammals. PLoS ONE 2012, 7, e41781. [Google Scholar] [CrossRef] [PubMed]
- Thomsen, P.F.; Kielgast, J.; Iversen, L.L.; Møller, P.R.; Rasmussen, M.; Willerslev, E. Detection of a diverse marine fish fauna using environmental DNA from seawater samples. PLoS ONE 2012, 7, e41732. [Google Scholar] [CrossRef] [PubMed]
- Kelly, R.P.; Port, J.A.; Yamahara, K.M.; Crowder, L.B. Using environmental DNA to census marine fishes in a large mesocosm. PLoS ONE 2014, 9, e86175. [Google Scholar] [CrossRef]
- Taberlet, P.; Coissac, E.; Pompanon, F.; Brochmann, C.; Willerslev, E. Towards next-generation biodiversity assessment using DNA metabarcoding. Mol. Ecol. 2012, 21, 2045–2050. [Google Scholar] [CrossRef] [PubMed]
- Jerde, C.L.; Mahon, A.R.; Chadderton, W.L.; Lodge, D.M. “Sight-unseen” detection of rare aquatic species using environmental DNA. Conserv. Lett. 2011, 4, 150–157. [Google Scholar] [CrossRef]
- Dejean, T.; Valentini, A.; Miquel, C.; Taberlet, P.; Bellemain, E.; Miaud, C. Improved detection of an alien invasive species through environmental DNA barcoding: The example of the American bullfrog Lithobates catesbeianus. J. Appl. Ecol. 2012, 49, 953–959. [Google Scholar] [CrossRef]
- Wilcox, T.M.; McKelvey, K.S.; Young, M.K.; Jane, S.F.; Lowe, W.H.; Whiteley, A.R.; Schwartz, M.K. Robust detection of rare species using environmental DNA: The importance of primer specificity. PLoS ONE 2013, 8, e59520. [Google Scholar] [CrossRef] [PubMed]
- Ardura, A.; Zaiko, A.; Martinez, J.L.; Samulioviene, A.; Semenova, A.; Garcia-Vazquez, E. eDNA and specific primers for early detection of invasive species–a case study on the bivalve Rangia cuneata, currently spreading in Europe. Mar. Environ. Res. 2015, 112, 48–55. [Google Scholar] [CrossRef]
- Ikeda, K.; Doi, H.; Tanaka, K.; Kawai, T.; Negishi, J. Using environmental DNA to detect an endangered crayfish Cambaroides japonicas in streams. Conserv. Genet. 2016, 8, 231–234. [Google Scholar] [CrossRef]
- DiBattista, J.D.; Roberts, M.B.; Bouwmeester, J.; Bowen, B.W.; Coker, D.J.; Lozano-Cortés, D.F.; Choat, J.H.; Gaither, M.R.; Hobbs, J.A.; Khalil, M.T.; et al. A review of contemporary patterns of endemism for shallow water reef fauna in the Red Sea. J. Biogeogr. 2016, 43, 423–439. [Google Scholar] [CrossRef]
- Gurevitch, J.; Padilla, D.K. Are invasive species a major cause of extinctions? Trends Ecol. Evol. 2004, 19, 470–474. [Google Scholar] [CrossRef] [PubMed]
- Bax, N.; Williamson, A.; Aguero, M.; Gonzalez, E.; Geeves, W. Marine invasive alien species: A threat to global biodiversity. Marine Policy 2003, 27, 313–323. [Google Scholar] [CrossRef]
- Vander Zanden, M.J.; Hansen, G.J.A.; Higgins, S.N.; Kornis, M.S. A pound of prevention, plus a pound of cure: Early detection and eradication of invasive species in the Laurentian Great Lakes. J. Great Lakes Res. 2010, 36, 199–205. [Google Scholar] [CrossRef]
- Comtet, T.; Sandionigi, A.; Viard, F.; Casiraghi, M. DNA (meta) barcoding of biological invasions: A powerful tool to elucidate invasion processes and help managing aliens. Biol. Invasions 2015, 17, 905–922. [Google Scholar] [CrossRef]
- Ficetola, G.F.; Miaud, C.; Pompanon, F.; Taberlet, P. Species detection using environmental DNA from water samples. Biol. Lett. 2008, 4, 423–425. [Google Scholar] [CrossRef]
- Gotelli, N.J.; Colwell, R.K. Quantifying biodiversity: Procedures and pitfalls in the measurement and comparison of species richness. Ecol. Lett. 2001, 4, 379–391. [Google Scholar] [CrossRef]
- Darling, J.A.; Mahon, A.R. From molecules to management: Adopting DNA-based methods for monitoring biological invasions in aquatic environments. Environ. Res. 2011, 111, 978–988. [Google Scholar] [CrossRef]
- Goldberg, C.S.; Turner, C.R.; Deiner, K.; Klymus, K.E.; Thomsen, P.F.; Murphy, M.A.; Spear, S.F.; McKee, A.; Oyler-McCance, S.J.; Cornman, R.S.; et al. Critical considerations for the application of environmental DNA methods to detect aquatic species. Methods Ecol. Evol. 2016, 7, 1299–1307. [Google Scholar] [CrossRef]
- Hajibabaei, M.; Smith, M.A.; Janzen, D.H.; Rodriguez, J.J.; Whitfield, J.B.; Hebert, P.D.N. A minimalist barcode can identify a specimen whose DNA is degraded. Mol. Ecol. Notes 2006, 6, 959–964. [Google Scholar] [CrossRef]
- Bohmann, K.; Evans, A.; Gilbert, M.T.P.; Carvalho, G.R.; Creer, S.; Knapp, M.; Yu, D.W.; De Bruyn, M. Environmental DNA for wildlife biology and biodiversity monitoring. Trends. Ecol. Evol. 2014, 29, 358–367. [Google Scholar] [CrossRef] [PubMed]
- Valentini, A.; Taberlet, P.; Miaud, C.; Civade, R.; Herder, J.; Thomsen, P.F.; Bellemain, E.; Besnard, A.; Coissac, E.; Boyer, F.; et al. Next-generation monitoring of aquatic biodiversity using environmental DNA metabarcoding. Mol. Ecol. 2016, 25, 929–942. [Google Scholar] [CrossRef]
- Goldberg, C.S.; Pilliod, D.S.; Arkle, R.S.; Waits, L.P. Molecular detection of vertebrates in stream water: A demonstration using rocky mountain tailed frogs and Idaho giant salamanders. PLoS ONE 2011, 6, e22746. [Google Scholar] [CrossRef]
- Piaggio, A.J.; Engeman, R.M.; Hopken, M.W.; Humphrey, J.S.; Keacher, K.L.; Bruce, W.E.; Avery, M.L. Detecting an elusive invasive species: A diagnostic PCR to detect Burmese python in Florida waters and an assessment of persistence of environmental DNA. Mol. Ecol. Resour. 2014, 14, 374–380. [Google Scholar] [CrossRef] [PubMed]
- Davy, C.M.; Kidd, A.G.; Wilson, C.C. Development and validation of environmental DNA (eDNA) markers for detection of freshwater turtles. PLoS ONE 2015, 10, e0130965. [Google Scholar] [CrossRef] [PubMed]
- Goldberg, C.S.; Sepulveda, A.; Ray, A.; Baumgardt, J.; Waits, L.P. Environmental DNA as a new method for early detection of New Zealand mudsnails (Potamopyrgus antipodarum). Freshw. Sci. 2013, 32, 792–800. [Google Scholar] [CrossRef]
- Xia, Z.; Zhan, A.; Gao, Y.; Zhang, L.; Haffner, G.D.; MacIsaac, H.J. Early detection of a highly invasive bivalve based on environmental DNA (eDNA). Biol. Invasions 2017, 20, 437–447. [Google Scholar] [CrossRef]
- Wood, S.A.; Pochon, X.; Ming, W.; von Ammon, U.; Woods, C.; Carter, M.; Smith, M.; Inglis, G.; Zaiko, A. Considerations for incorporating real-time PCR assays into routine marine biosecurity surveillance programmes: A case study targeting the Mediterranean fanworm (Sabella spallanzanii) and club tunicate (Styela clava). Genome 2019, 62, 137–146. [Google Scholar] [CrossRef]
- Kim, P.; Kim, D.; Yoon, T.J.; Shin, S. Early detection of marine invasive species, Bugula neritina (Bryozoa: Cheilostomatida), using species-specific primers and environmental DNA analysis in Korea. Mar. Environ. Res. 2018, 139, 1–10. [Google Scholar] [CrossRef]
- Lesser, M.P.; Shumway, S.E.; Cucci, T.; Smith, J. Impact of fouling organisms on mussel rope culture: Interspecific competition for food among suspension-feeding invertebrates. J. Exp. Mar. Biol. Ecol. 1992, 165, 91–102. [Google Scholar] [CrossRef]
- De Sa, F.S.; Nalesso, R.C.; Paresgue, K. Fouling organisms on Perna perna mussels: Is it worth removing them? Braz. J. Oceanogr. 2007, 55, 155–161. [Google Scholar] [CrossRef]
- McKindsey, C.W.; Lecuona, M.; Huot, M.; Weise, A.M. Biodeposit production and benthic loading by farmed mussels and associated tunicate epifauna in Prince Edward Island. Aquaculture 2009, 295, 44–51. [Google Scholar] [CrossRef]
- Braithwaite, R.A.; McEvoy, L.A. Marine biofouling on fish farms and its remediation. Adv. Mar. Biol. 2005, 47, 215–252. [Google Scholar] [CrossRef] [PubMed]
- De Nys, R.; Guenther, J. The impact and control of biofouling in marine finfish aquaculture. In Advances in Marine Antifouling Coatings and Technologies; Hellio, C., Yebra, D., Eds.; Woodhead: Cambridge, MA, USA, 2009; pp. 177–221. [Google Scholar] [CrossRef]
- Dürr, S.; Watson, D.I. Biofouling and antifouling in aquaculture. In Biofouling; Dürr, S., Thomason, J.C., Eds.; Wiley-Blackwell: Oxford, UK, 2010; pp. 267–287. [Google Scholar]
- Mills, C.E.; Marques, A.C.; Migotto, A.E.; Calder, D.R. Hydrozoa: Polyps, hydromedusae, and siphonophora. In The Light and Smith Manual: Intertidal Invertebrates from Central California to Oregon; Carlton, J.T., Ed.; University of California Press: Berkley, CA, USA, 2007; pp. 118–167. [Google Scholar]
- Fitridge, I.; Keough, M.J. Ruinous resident: The hydroid Ectopleura crocea negatively affects suspended culture of the mussel Mytilus galloprovincialis. Biofouling 2013, 29, 119–131. [Google Scholar] [CrossRef]
- Fitridge, I. The ecology of hydroids (Hydrozoa: Cnidaria) in Port Phillip Bay, Australia, and their impacts as fouling species in longline mussel culture. PhD thesis, Department of Zoology, The University of Melbourne, Melbourne, Australia, 2011. [Google Scholar]
- Fitridge, I.; Dempster, T.; Guenther, J.; de Nys, R. The impact and control of biofouling in marine aquaculture: A review. Biofouling 2012, 28, 49–669. [Google Scholar] [CrossRef]
- Rho, B.J. Studies on the marine hydroid in Korea. J. Korean Res. Inst. Better Liv., Ewha Womans Univ. 1969, 2, 161–174. [Google Scholar]
- Folmer, O.; Black, M.; Hoeh, W.; Lutz, R.; Vrijenhoek, R. DNA primers for amplification of mitochondrial cytochrome c oxidase subunit I from diverse metazoan invertebrates. Mol. Mar. Biol. Biotechnol. 1994, 3, 294–299. [Google Scholar]
- Hall, T.A. BioEdit: A user-friendly biological sequence alignment editor and analysis program for Windows 95/98/NT. Nucleic Acids Symp. Series 1999, 41, 95–98. [Google Scholar]
- Thompson, J.D.; Gibson, T.J.; Plewniak, F.; Jeanmougin, F.; Higgins, D.G. The CLUSTAL X windows interface: Flexible strategies for multiple sequence alignment aided by quality analysis tools. Nucleic Acids Res. 1997, 25, 4876–4882. [Google Scholar] [CrossRef]
- Kumar, S.; Stecher, G.; Tamura, K. MEGA7: Molecular evolutionary genetics analysis version 7.0 for bigger datasets. Mol. Biol. Evol. 2016, 33, 1870–1874. [Google Scholar] [CrossRef]
- Kimura, M. A simple method for estimating evolutionary rates of base substitutions through comparative studies of nucleotide sequences. J. Mol. Evol. 1980, 16, 111–120. [Google Scholar] [CrossRef] [PubMed]
- Collins, R.A.; Boykin, L.M.; Cruickshank, R.H.; Armstrong, K.F. Barcoding’s next top model: An evaluation of nucleotide substitution models for specimen identification. Methods Ecol. Evol. 2012, 3, 457–465. [Google Scholar] [CrossRef]
- Takahara, T.; Minamoto, T.; Yamanaka, H.; Doi, H.; Kawabata, Z. Estimation of fish biomass using environmental DNA. PLoS ONE 2012, 7, e35868. [Google Scholar] [CrossRef] [PubMed]
- Turner, C.R.; Barnes, M.A.; Xu, C.C.; Jones, S.E.; Jerde, C.L.; Lodge, D.M. Particle size distribution and optimal capture of aqueous macrobial eDNA. Methods Ecol. Evol. 2014, 5, 676–684. [Google Scholar] [CrossRef]
- Smith, C.J.; Nedwell, D.B.; Dong, L.F.; Osborn, A.M. Evaluation of quantitative polymerase chain reaction-based approaches for determining gene copy and gene transcript numbers in environmental samples. Environ. Microbiol. 2006, 8, 804–815. [Google Scholar] [CrossRef]
- Zhang, A.N.; Mao, Y.; Zhang, T. Development of quantitative real-time PCR assays for different clades of “Candidatus accumulibacter”. Sci. Rep. 2016, 6, 23993. [Google Scholar] [CrossRef][Green Version]
- Rasmussen, R.P. Quantification on the light cycler. In Rapid Cycle Real-time PCR; Meuer, S., Wittwe, R.C., Nakagawara, K.I., Eds.; Springer: Berlin/Heidelberg, Germany, 2011; pp. 21–34. [Google Scholar]
- Darling, J.A.; Blum, M.J. DNA-based methods for monitoring invasive species: A review and prospectus. Biol. Invasions 2007, 9, 751–765. [Google Scholar] [CrossRef]
- Blaxter, M.L. The promise of a DNA taxonomy. Philos. Trans.Roy. Soc. Lond. Ser. B-Biol. Sci. 2004, 359, 669–679. [Google Scholar] [CrossRef]
- Hebert, P.D.N.; Gregory, T.R. The promise of DNA barcoding for taxonomy. Syst. Biol. 2005, 54, 852–859. [Google Scholar] [CrossRef]
- Mikkelsen, N.T.; Schander, C.; Willassen, E. Local scale DNA barcoding of bivalves (Mollusca): A case study. Zool. Scr. 2007, 36, 455–463. [Google Scholar] [CrossRef]
- Go’mez, A.; Wright, P.J.; Lunt, D.H.; Cancino, J.M.; Carvalho, G.R.; Hughes, R.N. Mating trials validate the use of DNA barcoding to reveal cryptic speciation of a marine bryozoan taxon. Proc. R. Soc. B 2007, 274, 199–207. [Google Scholar] [CrossRef] [PubMed]
- Moura, C.J.; Harris, D.J.; Cunha, M.R.; Rogers, A.D. DNA barcoding reveals cryptic diversity in marine hydroids (Cnidaria, Hydrozoa) from coastal and deep-sea environments. Zool. Scr. 2007, 37, 93–108. [Google Scholar] [CrossRef]
- Ward, R.D.; Holmes, B.H.; O’hara, T.D. DNA barcoding discriminates echinoderm species. Mol. Ecol. Resour. 2008, 8, 1202–1211. [Google Scholar] [CrossRef] [PubMed]
- Jennings, R.M.; Bucklin, A.; Ossenbrugger, H.; Hopcroft, R.R. Species diversity of planktonic gastropods (Pteropoda and Heteropoda) from six ocean regions based on DNA barcode analysis. Deep-Sea Res. PT. II 2010, 57, 2199–2210. [Google Scholar] [CrossRef]
- Van de Vossenberg, B.T.L.H.; Ibanez-Justicia, A.; Metz-Verschure, E.; van Veen, E.J.; Bruil-Dieters, M.L.; Scholte, E.J. Real-time PCR Tests in Dutch Exotic Mosquito Surveys; Implementation of Aedes aegypti and Aedes albopictus Identification Tests, and the Development of Tests for the Identification of Aedes atropalpus and Aedes japonicus japonicus (Diptera: Culicidae). J. Med. Entomol. 2015, 52, 336–350. [Google Scholar] [CrossRef]
- Barnes, M.A.; Turner, C.T.; Jerde, C.L.; Renshaw, M.A.; Chadderton, W.L.; Lodge, D.M. Environmental conditions influence eDNA persistence in aquatic systems. Environ. Sci. Technol. 2014, 48, 1819–1827. [Google Scholar] [CrossRef]
- Strickler, K.M.; Fremier, A.K.; Goldberg, C.S. Quantifying effects of UV-B, temperature, and pH on eDNA degradation in aquatic microcosms. Biol. Conserv. 2015, 183, 85–92. [Google Scholar] [CrossRef]
- Thomsen, P.F.; Willerslev, E. Environmental DNA—An emerging tool in conservation for monitoring past and present biodiversity. Biol. Conserv. 2015, 183, 4–18. [Google Scholar] [CrossRef]
- Schneider, J.; Valentini, A.; Dejean, T.; Montarsi, F.; Taberlet, P.; Glaizot, O.; Fumagalli, L. Detection of invasive mosquito vectors using environmental DNA (eDNA) from water samples. PLoS ONE 2015, 11, e0162493. [Google Scholar] [CrossRef]
- Inui, R.; Akamatsu, Y.; Kanno, K.; Yamanaka, H.; Takahara, T.; Minamoto, T. Environmental DNA analysis for estimating the abundance and biomass of stream fish. Freshw. Biol. 2017, 62, 30–39. [Google Scholar] [CrossRef]
- Huber, I.; Block, A.; Sebah, D.; Debode, F.; Morisset, D.; Grohmann, L. Development and validation of duplex, triplex, and pentaplex real-time PCR screening assays for the detection of genetically modified organisms in food and feed. J. Agric. Food Chem. 2013, 61, 10293–10301. [Google Scholar] [CrossRef] [PubMed]
- Eichmiller, J.J.; Bajer, P.G.; Sorensen, P.W. The relationship between the distribution of common carp and their environmental DNA in a small lake. PLoS ONE 2014, 9, e112611. [Google Scholar] [CrossRef] [PubMed]
- Matsunaga, K.; Togashi, K. A simple method for discriminating Bursaphelenchus xylophilus and B. mucronatus by species-specific polymerase chain reaction primer pairs. Nematology 2004, 6, 273–277. [Google Scholar] [CrossRef]
- Thomsen, P.F.; Møller, P.R.; Sigsgaard, E.E.; Knudsen, S.W.; Jørgensen, O.A.; Willerslev, E. Environmental DNA from seawater samples correlate with trawl catches of subarctic, deepwater fishes. PLoS One 2016, 11, e0165252. [Google Scholar] [CrossRef] [PubMed]
 ;
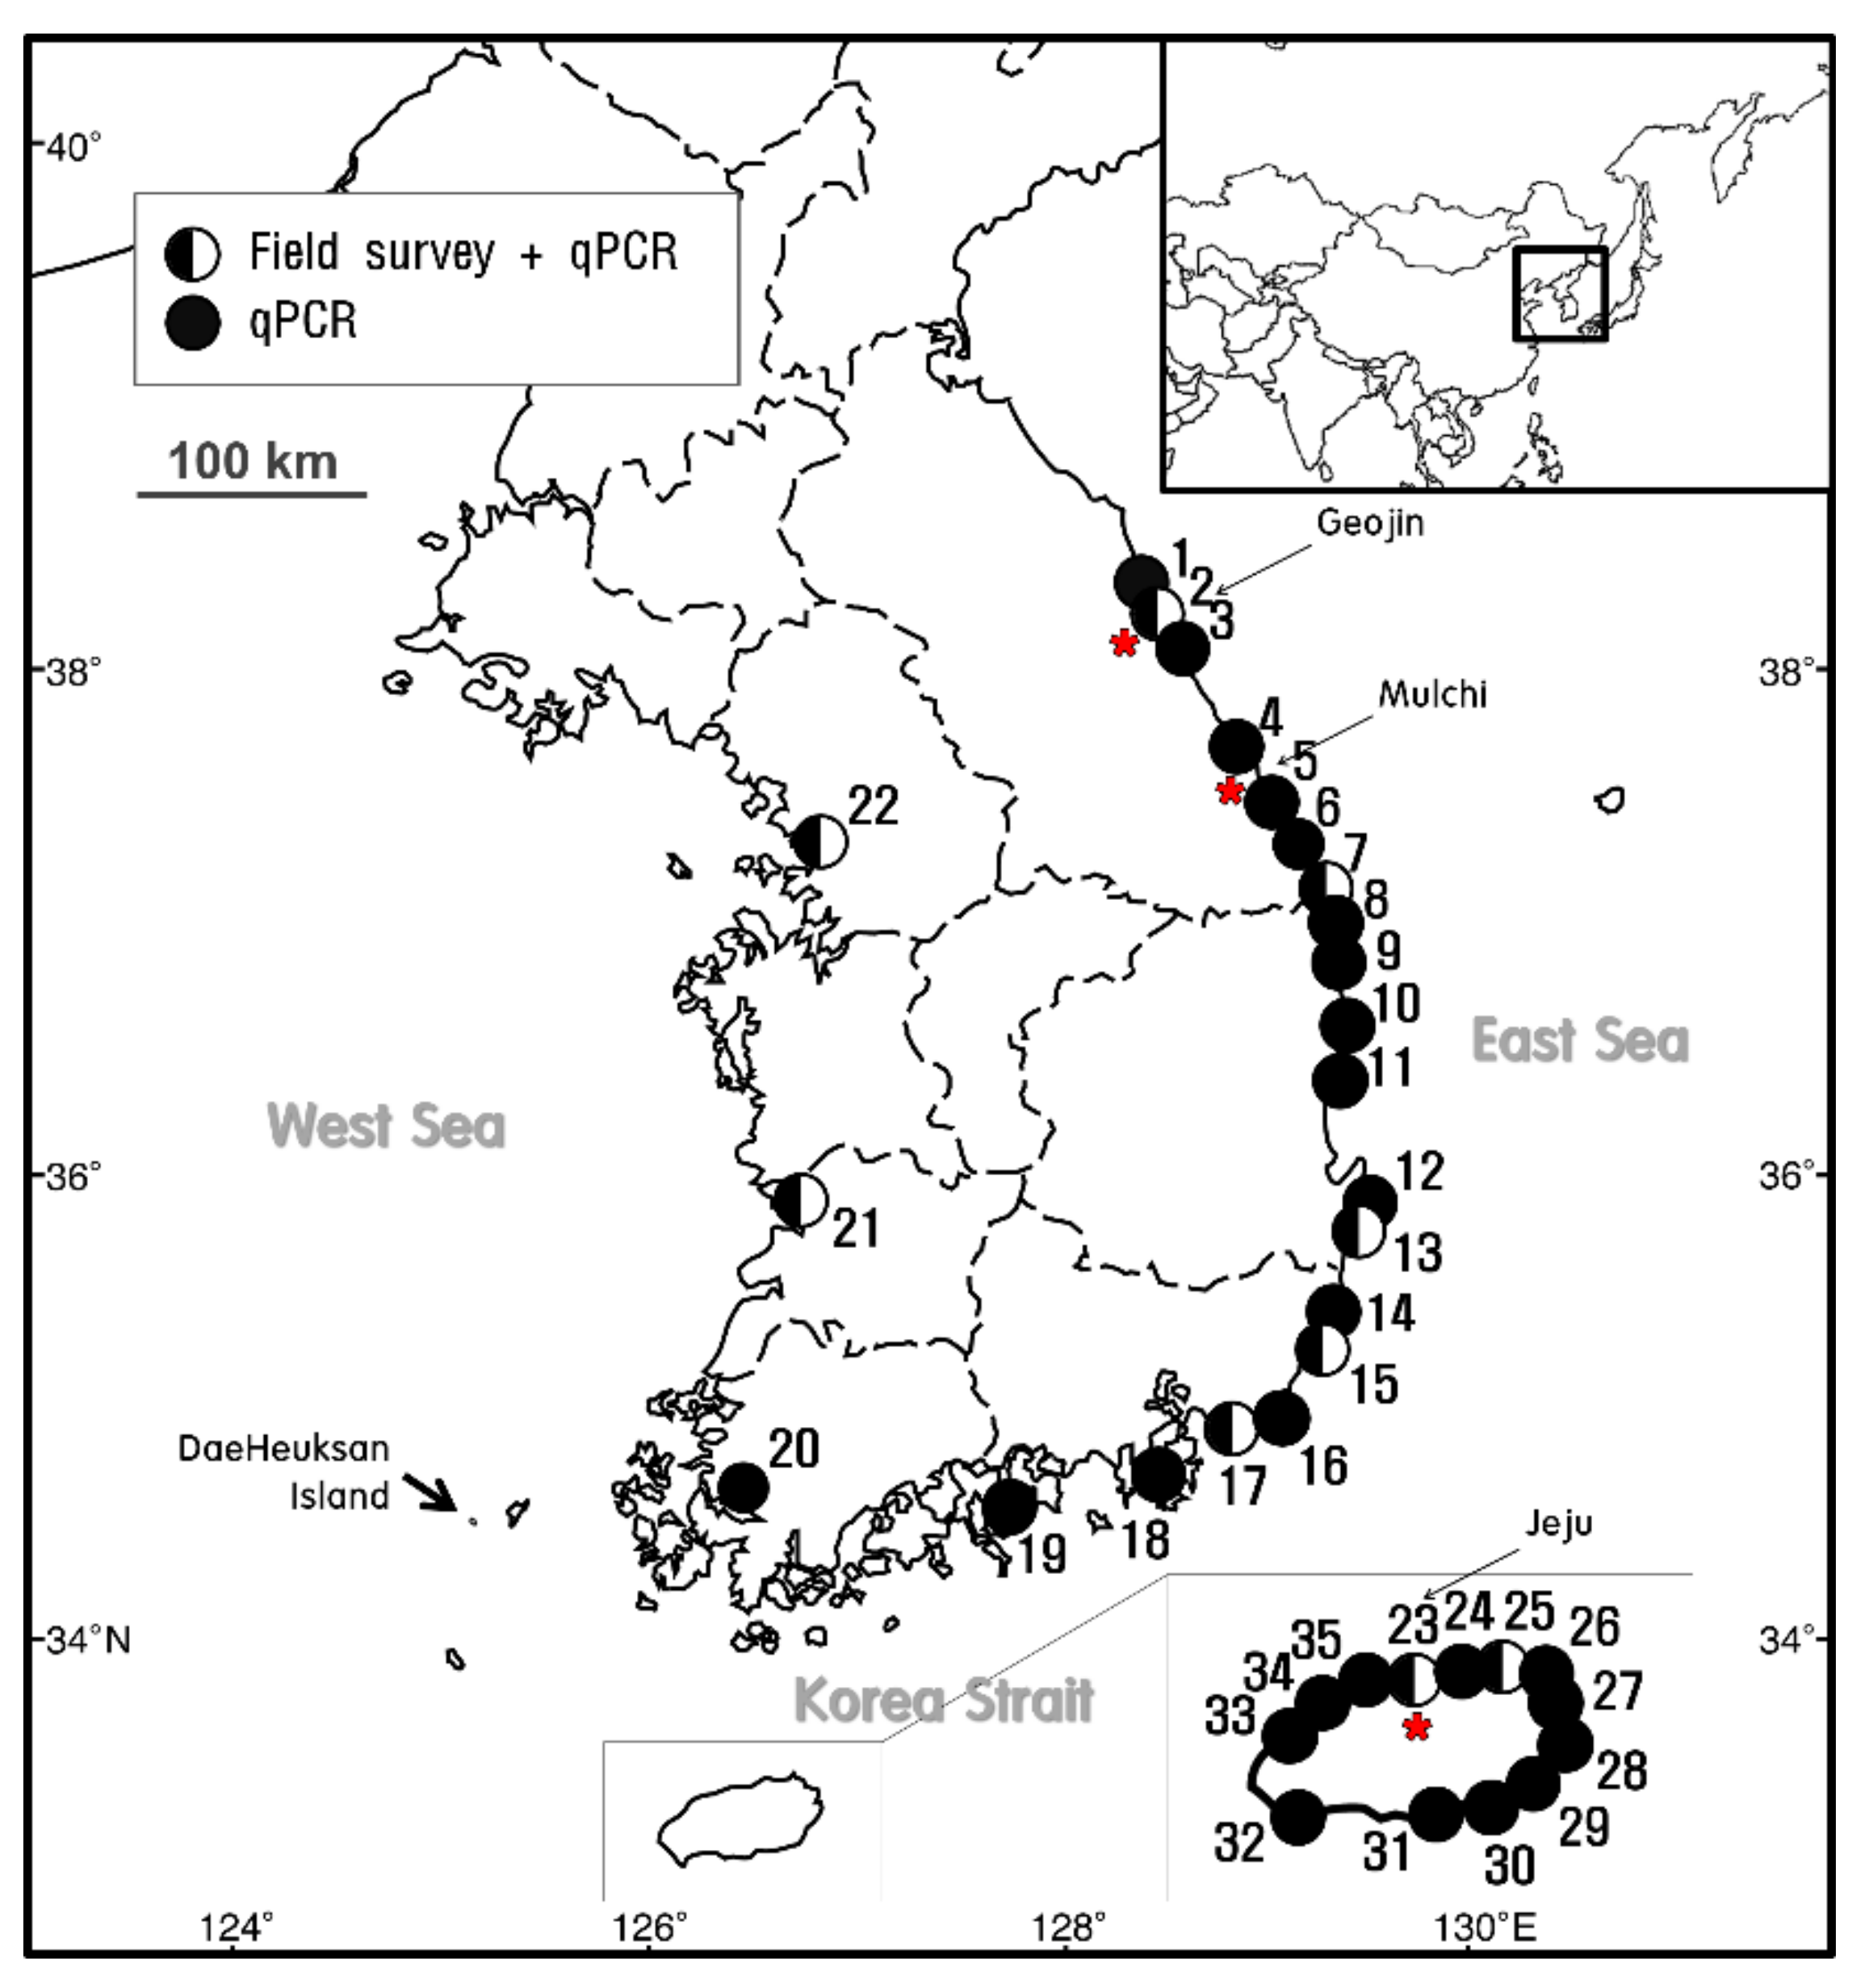
;  indicates the sites at which E. crocea was detected using qPCR analysis alone. The star (
 ) indicates the sampling sites for the molecular analysis.
; indicates the sites at which E. crocea was detected using qPCR analysis alone. The star () indicates the sampling sites for the molecular analysis.
) indicates the sampling sites for the molecular analysis.
; indicates the sites at which E. crocea was detected using qPCR analysis alone. The star () indicates the sampling sites for the molecular analysis.


| Primer & Probe | Sequence | Source |
|---|---|---|
| LCO1490 | 5ʹ-GGTCAACAAATCATAAAGATATTGG-3ʹ | Folmer et al. (1994) [41] |
| HCO2198 | 5ʹ-TAA ACTTCAGGGTGACCAAAAAATCA-3ʹ | |
| EcCr_SF | 5ʹ-TCTTTACTAGGAGATGACCATCTC-3ʹ | In this study |
| EcCr_SR | 5ʹ-AGTCAGAAACTTAARTTATTAAGT-3ʹ | |
| EcCr Probe | 5ʹ-6-Fam-TGCCAGTTTTAATTGGTGGATTTGG-BHQ-1-3ʹ |
| Taxon | Date | Location |
|---|---|---|
| Phylum CNIDARIA | - | - |
| Class Hydrozoa | - | - |
| Ectopleura crocea | 2016 | Geojin |
| 2016 | Mulchi | |
| 2016 | Jeju | |
| Bougainvillia ramosa | 2016 | Incheon |
| Campanularia hincksii | 2016 | Yeosu |
| Obelia dichotoma | 2016 | Gunsan |
| Obelia longissimi | 2016 | Mokpo |
| Laomedea calceolifera | 2017 | Busan |
| Phylum CHORDATA | - | - |
| Class Ascidiacea | - | - |
| Ascidiella aspersa | 2017 | Chuksan |
| Herdmania momus | 2016 | Seongsanpo |
| Phylum BRYOZOA | - | - |
| Class Gymnolaemata | - | - |
| Bugula neritina | 2016 | Anmok |
| Tricellaria occidentalis | 2016 | Ulsan |
| Watersipora subtorquata | 2016 | Jongdal |
| Phylum ECHINODERMATA | - | - |
| Class Crinoidea | - | - |
| Antedon serrata | 2009 | Busan |
| Heliometra glacialis | 2016 | Daejin |
| Class Asteroidea | - | - |
| Patiria pectinifera | 2016 | Juckbyeon |
| Asterias amurensis | 2016 | Dadaepo |
| Class Ophiuroidea | - | - |
| Ophiactis savignyi | 2016 | Dodu |
| Ophiopholis mirabilis | 2016 | Gampo |
| Class Echinoidea | - | - |
| Temnopleurus hardwickii | 2016 | Mipo |
| Prionocidaris japonica | 2012 | Aewol |
| Class Holothuroidea | - | - |
| Eupentacta chronhjelmi | 2016 | Tongyeong |
| Protankyra bidentata | 2015 | Incheon |
| Number | Region | Location | Latitude | Longitude |
|---|---|---|---|---|
| 1 | East Sea | Daejin | 38°29′56.61″N | 128°25′34.18″E |
| 2 | Geojin | 38°26′53.14″N | 128°27′46.37″E | |
| 3 | Gonghyunjin | 38°21′22.38″N | 128°30′43.26″E | |
| 4 | Jangsa | 38°13′35.24″N | 128°35′16.66″E | |
| 5 | Jumunjin | 37°53′31.41″N | 128°49′47.61″E | |
| 6 | Sacheon | 37°50′11.44″N | 128°52′42.30″E | |
| 7 | Mukho | 37°33′15.38″N | 129°07′06.64″E | |
| 8 | Donghae | 37°29′21.30″N | 129°07′23.35″E | |
| 9 | Imwon | 37°13′46.03″N | 129°20′45.80″E | |
| 10 | Jukbyeon | 37°03′17.32″N | 129°25′26.30″E | |
| 11 | Chuksan | 36°30′33.25″N | 129°26′54.35″E | |
| 12 | Guryongpo | 35°59′22.58″N | 129°33′19.97″E | |
| 13 | Yangpo | 35°52′56.34″N | 129°31′35.13″E | |
| 14 | Korea Strait | Ulsan | 35°31′09.47″N | 129°22′24.47″E |
| 15 | Bangeojin | 35°29′05.79″N | 129°25′44.76″E | |
| 16 | Daebyeon | 35°13′29.29″N | 129°13′41.95″E | |
| 17 | Busan | 35°07′02.60″N | 129°02′55.49″E | |
| 18 | Kwangyang | 34°54′55.32″N | 127°40′52.40″E | |
| 19 | Tongyeong | 34°50′23.05″N | 128°25′12.58″E | |
| 20 | Mokpo | 34°46′51.50″N | 126°22′59.76″E | |
| 21 | Yellow Sea | Bieung | 35°56′11.21″N | 126°31′38.01″E |
| 22 | Incheon | 37°27′34.05″N | 126°37′32.32″E | |
| 23 | Jeju Island | Jeju | 33°31′13.94″N | 126°32′11.91″E |
| 24 | Jocheon | 33°32′26.53″N | 126°38′08.00″E | |
| 25 | Bukchon | 33°33′10.65″N | 126°41′55.92″E | |
| 26 | Gimnyeong | 33°33′30.54″N | 126°44′11.94″E | |
| 27 | Jongdal | 33°28′23.88″N | 126°56′00.78″E | |
| 28 | Seongsanpo | 33°28′22.41″N | 126°56′04.58″E | |
| 29 | Pyoseon | 33°19′30.34″N | 126°50′47.13″E | |
| 30 | Wimi | 33°16′18.15″N | 126°39′48.39″E | |
| 31 | Seogwipo | 33°14′23.44″N | 126°33′52.28″E | |
| 32 | Moseulpo | 33°12′58.15″N | 126°15′01.93″E | |
| 33 | Hallim | 33°24′44.97″N | 126°15′20.51″E | |
| 34 | Aewol | 33°28′54.67″N | 126°19′58.14″E | |
| 35 | Dodu | 33°30′27.14″N | 126°27′55.53″E |
© 2020 by the authors. Licensee MDPI, Basel, Switzerland. This article is an open access article distributed under the terms and conditions of the Creative Commons Attribution (CC BY) license (http://creativecommons.org/licenses/by/4.0/).
Share and Cite
Kim, P.; Yoon, T.J.; Shin, S. Environmental DNA and Specific Primers for Detecting the Invasive Species Ectopleura crocea (Hydrozoa: Anthoathecata) in Seawater Samples. Sustainability 2020, 12, 2360. https://doi.org/10.3390/su12062360
Kim P, Yoon TJ, Shin S. Environmental DNA and Specific Primers for Detecting the Invasive Species Ectopleura crocea (Hydrozoa: Anthoathecata) in Seawater Samples. Sustainability. 2020; 12(6):2360. https://doi.org/10.3390/su12062360
Chicago/Turabian StyleKim, Philjae, Tae Joong Yoon, and Sook Shin. 2020. "Environmental DNA and Specific Primers for Detecting the Invasive Species Ectopleura crocea (Hydrozoa: Anthoathecata) in Seawater Samples" Sustainability 12, no. 6: 2360. https://doi.org/10.3390/su12062360
APA StyleKim, P., Yoon, T. J., & Shin, S. (2020). Environmental DNA and Specific Primers for Detecting the Invasive Species Ectopleura crocea (Hydrozoa: Anthoathecata) in Seawater Samples. Sustainability, 12(6), 2360. https://doi.org/10.3390/su12062360