Article

Climate Change Implications for Water Availability: A Case Study of Barcelona City

by
Edwar Forero-Ortiz
1,2,*,
Eduardo Martínez-Gomariz
1,2 and
Robert Monjo
3
1
Cetaqua, Water Technology Centre. Carretera d’Esplugues, 75, Cornellà de Llobregat, 08940 Barcelona, Spain
2
FLUMEN Research Institute, Universitat Politècnica de Catalunya, Calle del Gran Capità, 6, 08034 Barcelona, Spain
3
FIC- Climate Research Foundation, 28013 Madrid, Spain
*
Author to whom correspondence should be addressed.
Sustainability 2020, 12(5), 1779; https://doi.org/10.3390/su12051779
Submission received: 30 January 2020 / Revised: 22 February 2020 / Accepted: 26 February 2020 / Published: 27 February 2020

Abstract

:
Barcelona city has a strong dependence on the Ter and Llobregat reservoir system to provide drinking water. One main concern for the next century is a potential water scarcity triggered by a severe and persistent rainfall shortage. This is one of the climate-driven impacts studied within the EU funded project RESCCUE. To evaluate potential drought scenarios, the Hydrologiska Byråns Vattenbalansavdelning (HBV) hydrological model reproduces the water contributions by month that have reached the reservoirs, regarding the accumulated rainfall over each sub-basin, representing the available historical-observed water levels. For future scenarios, we adjusted the input data set using climate projections of rainfall time series data of the project RESCCUE. Local outputs from 9 different climate models were applied to simulate river basins’ responses to reservoirs’ incoming water volume. Analyzing these results, we obtained average trends of the models for each scenario, hypothetical extreme values, and quantification for changes in water availability. Future water availability scenarios for Barcelona central water sources showed a mean decrease close to 11% in comparison with the period 1971–2015, considering the representative concentration pathway 8.5 (RCP8.5) climate change scenario in the year 2100. This research forecasts a slight downward trend in water availability from rainfall contributions from the mid-21st century. This planned future behavior does not mean that the annual water contributions are getting lower than the current ones, but rather, identifies an escalation in the frequency of drought cycles.

1. Introduction

Climate change estimates to affect all spheres of human activity in the natural environment, including water resources. Defined as a shortage in rainfall over an extended period, a season or more, drought affects both human activities and the environmental balance [1]. A significant proportion of the human population is currently experiencing restrictions on access to drinking water due to drought events, a vulnerable component of the natural and social action chains [2].
Increases in drought events’ frequency and severity are forecast under the impact of climate change [3], examples include events in China (1991–1996), East Africa (2010–2011), United States of America (2011–2012), Australia (2013–2016), and Catalonia, Spain (2006–2008) [4]. Water resource availability shortage threatens urban areas due to factors such as rapid urbanization, increased water use, lack of climate change adaptation policies, and repeated drought events [5]; drought has historically affected 35% of the population hit by natural hazards [1].
Globally, the drinking water requirement for cities has increased due to rapid population growth in cities, pollution of water sources, stress on groundwater sources, and the impact of extreme weather conditions [5]. Researchers concur that drought events will be intense due to lower rainfall and higher evapotranspiration in some areas of Europe, above all impacting Spain [6,7]. Therefore, understanding the complexity of drought events is essential for the city of Barcelona in facing the next century, associated with rainfall shortage. However, drought is a slow process of shortage accumulation, and the sharpness of drought episodes is not only related to current rainfall, but much more related to the cumulative impact of previous hydrological balances.
One of the criteria for proper reservoir management as part of a water supply system is the rigorous design and implementation of the guidelines of reservoir operation along with environmental planning, allowing management to have the tools to cope with growing climate change influence on water scarcity [8]. Reservoir operation is “a large-scale multi-objective optimization problem” [9]. Therefore, this paper contributes to the understanding of the hydrological process in the Barcelona water supply reservoir system under climate change influence, as one of the factors involved in this process.
Barcelona and its metropolitan area dependent on the Ter and Llobregat reservoir system to provide the water demand throughout the year. According to the Catalonian river basin management plan [10], a document from Catalan Water Agency (ACA, Catalonian water resources administrator), Barcelona uses mainly Llobregat river water (38%), and Ter river water (55%), while for the remaining 7%–8% it employs groundwater. Both basins have their higher part controlled by reservoirs which modulate the required water resources. Barcelona is far from these reservoirs, but the drought situation depends on their stored water volumes.
When these volumes are lower than threshold levels (less than 30% of water stocks in the reservoirs) as set by the Drought Plan from the ACA [11], a drought contingency triggers concerning water use restrictions for activities such as irrigation, leisure, industrial purposes, etc., as happened in 2007 and 2008. Beyond environmental and social impacts generated by Barcelona 2006 and 2008 extreme drought events, a study estimated drought impacts valued at 1605 million euros, half a point of Catalonia’s GDP [12].
Catalonian droughts’ knowledge is most of all based on drought events’ variability studies, either historically avoiding any future SPI (standardized precipitation index) and SPEI (standardized precipitation–evaporation index) indicators projection [13], or assessing climate change effects without considering the representative concentration pathways (RCPs) presented in the Intergovernmental Panel on Climate Change (IPCC) fifth assessment report [14].
Gallart et al. [15] estimated trends for the rivers’ discharge in the Ter–Llobregat system analyzing their historical records. However, this approach did not attempt to consider the contextual factors that influence the availability of water resources in the future for the Ter Llobregat system. The research would have been relevant if a forecast had been considered, introducing a future water resources scenario.
The Drought Plan (Alert and eventual drought exceptional action plan) developed by the Catalonian government (Generalitat de Catalunya) and the ACA in 2016, proposes a Ter–Llobregat water resources evolution. This research applied the SIMGES hydrological model with the multivariate periodic autoregressive (MPAR) stochastic model, based on 68 years of historical monthly flow contribution contributions series and comparing them with the generated synthetic series for a 500-year return period.
Likewise, a synthetic series was designed to analyze critical episodes of drought and estimating probabilities of occurrence by extrapolating historical climatic conditions [11]. Therefore, this study focused on understanding how climate change plays a role in Barcelona’s drought events as one of the significant nature-based concerns for the next century [10,16,17].
Our research aim is broadening future drought events’ knowledge, considering climate change impacts. We defined the design and implementation of a model for water amounts reservoir balance at a month scale, analyzing basins rainfall. This paper, as a first of its two-fold aim, represents observed reservoir water levels implementing the HBV (Hydrologiska Byråns Vattenbalansavdelning) hydrological model and studied the application and validation of the SIMGES model and the HBV model as appropriate tools to forecast drought frequency for Barcelona’s case. After the historical model calibration and validation process, we obtained rainfall projections using nine Earth system models (ESM) and two representative concentration pathways’ (RCP) scenarios—RCP4.5 and RCP8.5—belonging to the fifth Coupled Model Intercomparison Project (CMIP5), provided by the Spanish Climate Research Foundation (FIC, accordingly to the Spanish acronym).
Second, we integrated these rainfall outputs within the hydrological model to simulate reservoir volumes as watershed responses, developing 30 different storage patterns. Outcomes of the models were analyzed to get average trends and extreme values for each scenario to estimate a single water availability trend for both reservoirs, to understand and analyze the water resource availability in Barcelona in the near future under different climate change situations. Our study outcomes provide additional support to plan water utility improvements, to evaluate extreme case scenarios, and to assess hazards related to water scarcity in further research.

2. Materials and Methods

2.1. Hydrological Model Background: Description and Setup

Drought, under a hydrological viewpoint, as usual, indicates below-normal levels of flow from lakes, streams, and reservoirs or groundwater with generally accepted indicators, such as the standardized runoff index (SRI), the surface water supply index (SWSI), the groundwater resources index (GRI), among others [4]. Precipitation patterns and changes in the precipitation–runoff relationship as essential variables to define drought which allows the assessment and simplification of climate change impact on urban water availability [3].
The study used precipitation pattern analysis to gain insight into rainfall influence over reservoirs’ water availability. Simulations of the water volume at each reservoir applied HBV, an integrated hydrological modeling system, developed at the Swedish Meteorological Hydrological Institute. The model relies on three different reservoir modules: one that simulates the behavior of the soil; the second, the upper reservoir and, finally, the lower reservoir that accounts for the groundwater base flow [18].
Some researchers have highlighted [19,20] how the HBV model is accurate, reproducing present and future water processes in the Llobregat basin. Thus, the HBV model is suitable to simulate the reservoirs’ contributions over the Llobregat and Ter’s basin. The model requires the physical properties of the basin as well as the climatic inputs, including precipitation, temperature, and potential evapotranspiration. The time scale for the input data was day-to-day. Detailed discussion on the hydrological model’s internal functioning falls outside the scope of this paper.
Using the Thornthwaite formula (ETPraw) gave us an estimation of potential evapotranspiration. Then, we applied a correction to get a better adjustment to the results obtained according to two parameters, using the Penman evapotranspiration as a reference. The evapotranspiration calibration process with two meteorological stations data in Llobregat and Ter basins computed Penman evapotranspiration (ETP) equation according to data availability.

2.2. Model Calibration, Validation, and Sensitivity Analysis

Table 1 describes the seven calibrated parameters applied to characterize each rainfall event introduced into the model sub-basin. These are all conceptual parameters, not easy to estimate from basin physical properties. The choice of the seven calibration parameters followed a preliminary data analysis, checking their values’ availability and validity for a monthly time-step; in addition, according to local conditions, snow-related parameters were discarded.
A Montecarlo simulation was conducted examining 10,000 combinations where there was an available gauge station to calibrate the parameters at each basin, setting the established objective function as accurately as possible (Nash-coefficient, Equation (1)), at a daily timescale if conceivable, in addition, relating with monthly volumes used as a reference, based on the obtained hydrographs when the information was available. Validation of water volume contribution data used ACA’s water contribution estimations from the Aquatool SIMGES module developed by IIAMA [21].
N a s h   c o e f f c i e n t = 1 t = 1 T Q m t Q o t 2 t = 1 T Q o t Q 0 ¯ 2 ,
where   Q m t = s i m u l a t e d   d i s c h a r g e ,   Q o t = o b s e r v e d   d i s c h a r g e ,   a n d   Q 0 ¯ = m e a n   o b s e r v e d   d i s c h a r g e s . Nash-Sutcliffe efficiency ranges from −∞ to 1. The closer to 1 the coefficient is, the more accurate the model is. An efficiency equal to 0 means that the approximation is as good as the mean of the observed data. Results are acceptable when positive values are higher than 0.2.

2.3. Framework for Assessing Future Water Resources Allocation

To define some potential situations, the representation of reservoir water contribution depends on the rainfall of the sub-basins over each dam. Outcomes include average trends of the models for each scenario, hypothetical extreme values, and the quantification of a possible number of times that reservoir systems could encounter warning events. Reservoir volumes relate to the ACA’s 1999–2018 historical data and since 2006 climate model forecasting. Therefore, the historical data range was 1999–2005 and projections cover 2006 to 2100. Rainfall time-series projections from 9 distinct climate models (see Section 3.2) were employed to simulate reservoir input volumes’ behavior. The outcomes of these nine models were averaged to find a single trend for each system obtaining four trends, two for each reservoir (RCP4.5 and RCP8.5).

3. A Case Study for Barcelona City

3.1. The Study Area

The Llobregat and Ter rivers and other small basins (defined as the Ter–Llobregat system) supply the Barcelona metropolitan area with drinking water. Llobregat river provides about 38%, and the Ter river supplies 55% of raw water for water drinking treatment plants for Barcelona [22,23]. The coupled basins’ total drainage area is 4957 km2, with a surface elevation variation from almost 2500 m (pre-Pyrenean mountain range) to the sea level, as Figure 1 shows.
A seasonal rainfall variability phenomenon in the two river basins led to water demand-supply fluctuations. Despite this infrastructure, water resource management is complex and involves groundwater extraction from aquifers and seawater desalination in extraordinary drought events [24].
Some key aspects of each sub-basin over the Llobregat and Ter river basins (see Figure 2) can be listed as follows:
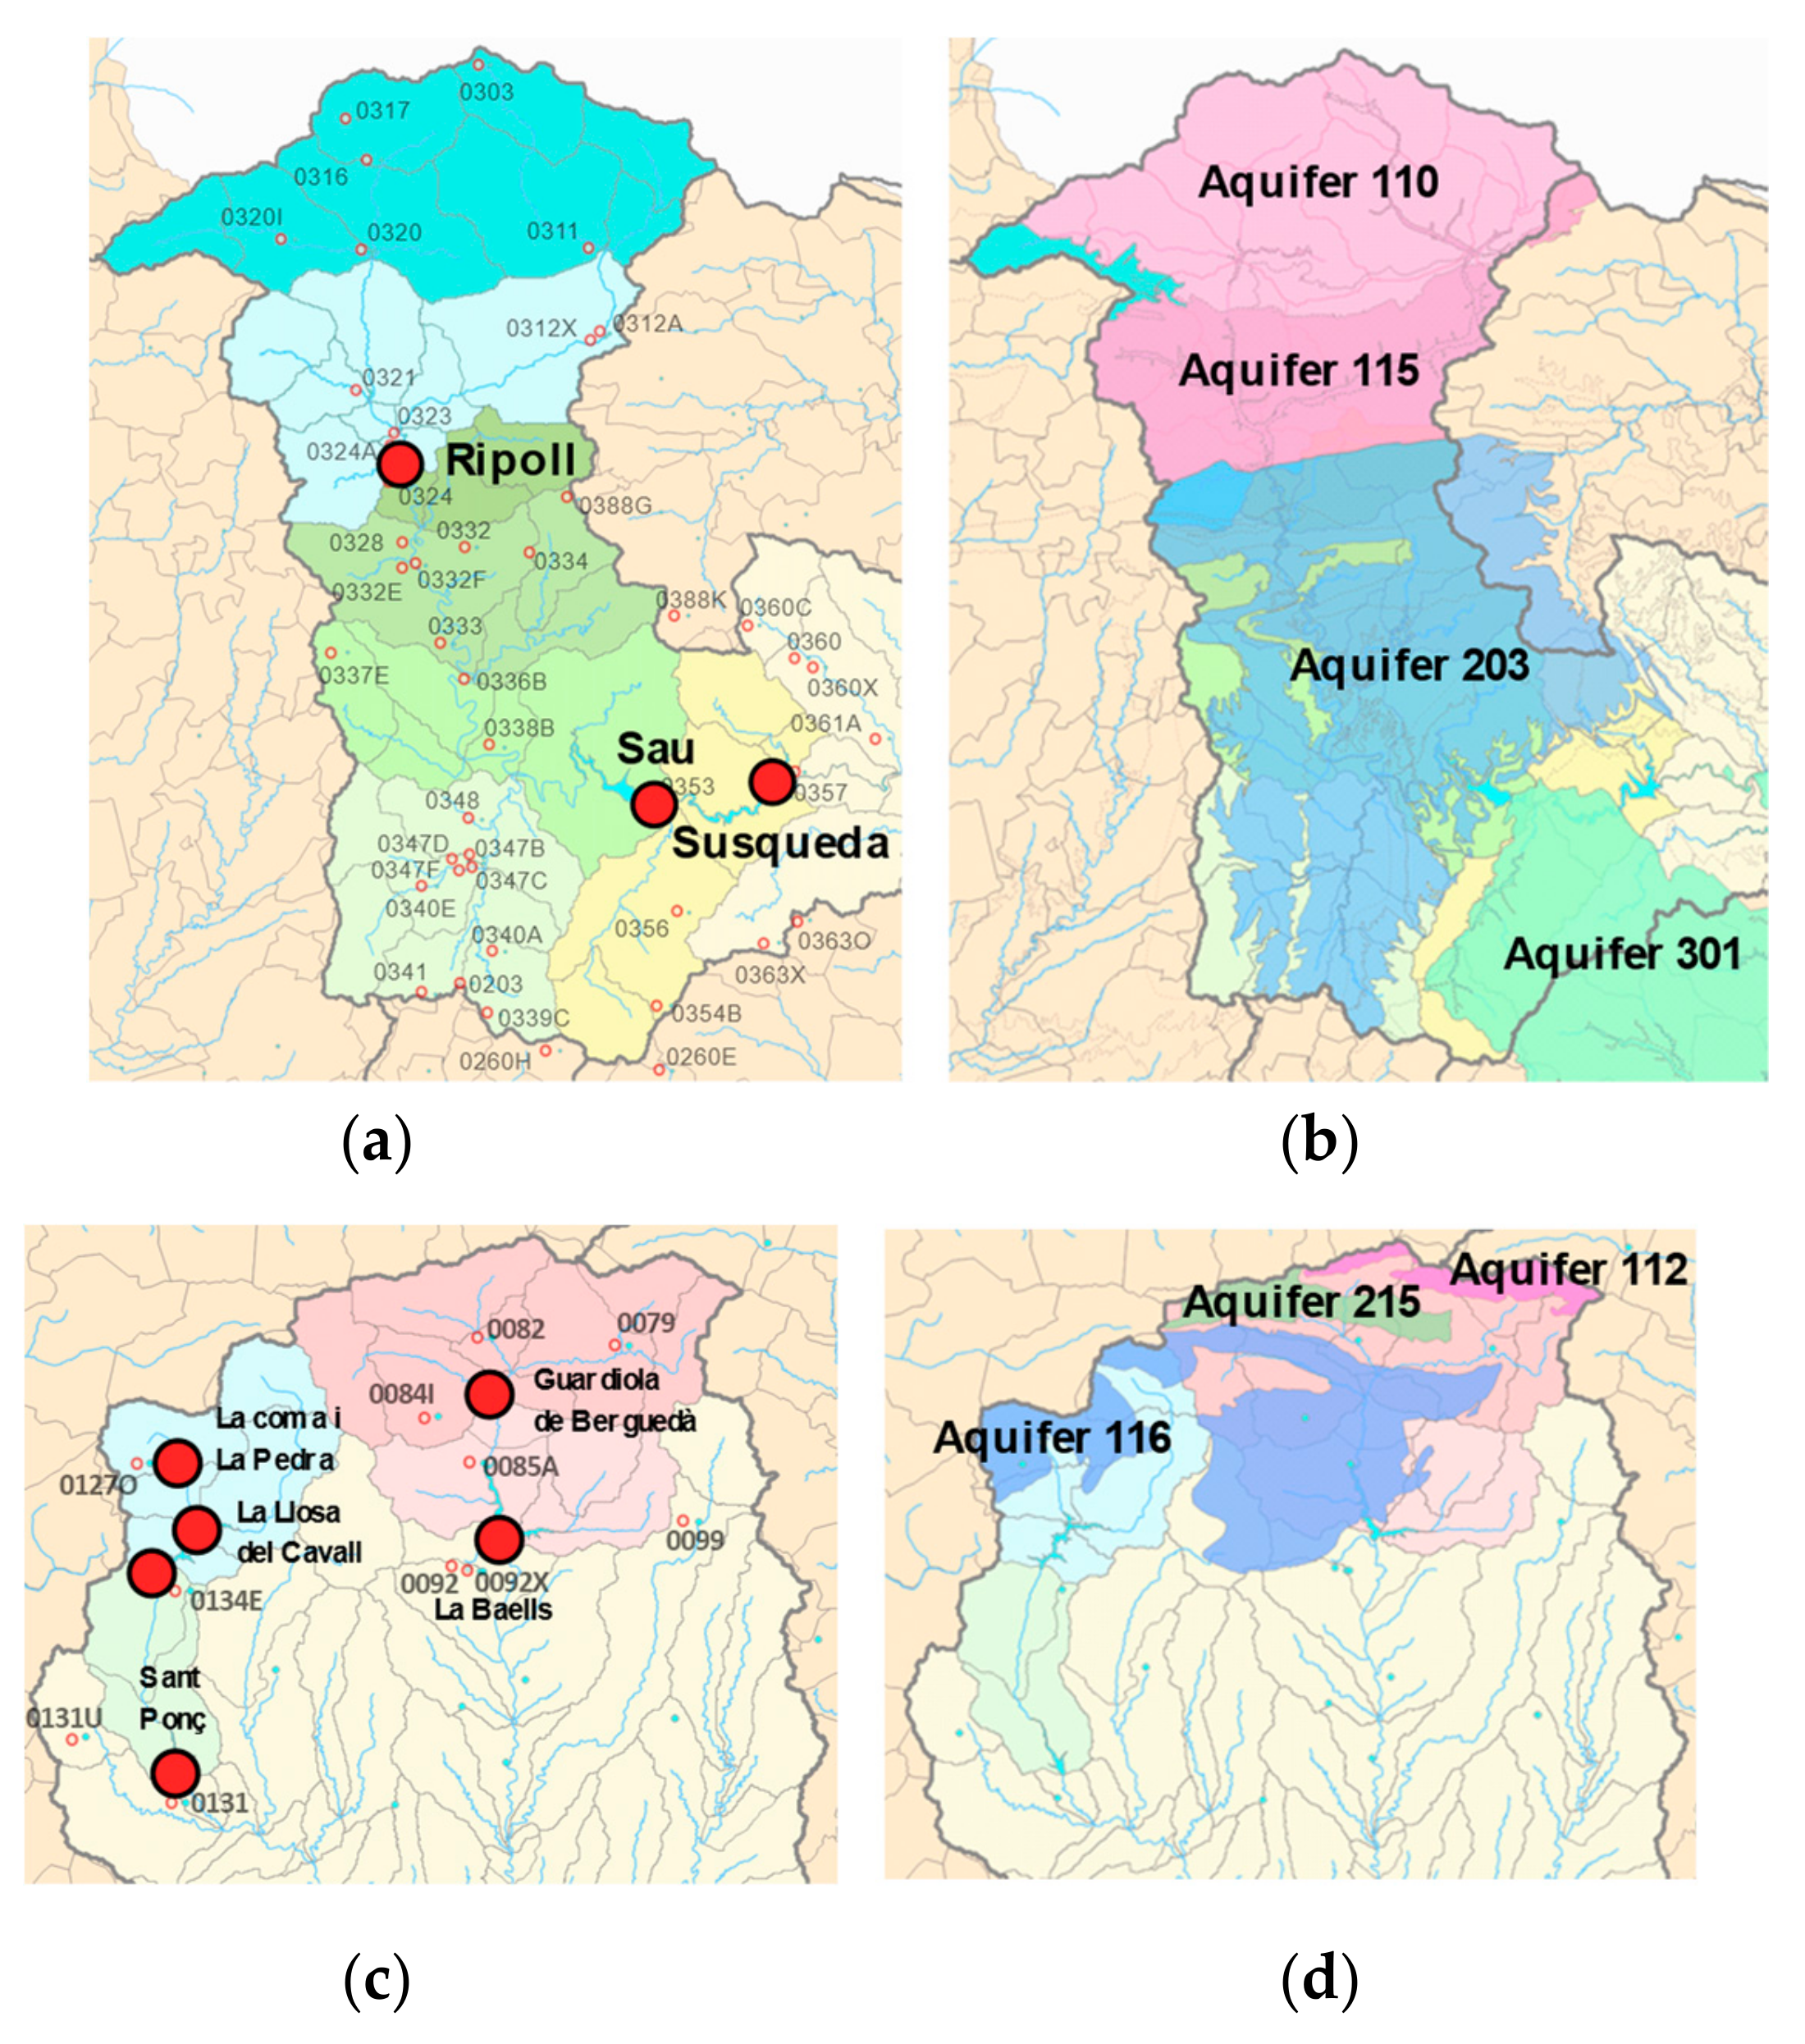
  • La Baells: Llobregat river basin divides into four sub-basins. Those contained in Guardiola de Berguedà zone include aquifers 112 and 115, with an area of low permeability. This sub-basin catches the flow from the upstream sub-basins and adds its contribution.
  • La Llosa del Cavall: Four different sub-basins constitute this Llobregat river basin. La Coma i La Pedra y La Llosa del Cavall represent a part of aquifer 116, with two additional sub-basins of low permeability downstream.
  • Sant Ponç: Two sub-basins define the basin part of the Llobregat river. In this case, there is no aquifer over the area.
  • Sau: This Ter river basin is divided into six different areas. Those located within the region up to the Ripoll gauge station correspond to the upper aquifers 110 and 115, which represent 75% of the total contribution reaching the Sau reservoir. Sub-basins’ simulation was with the same properties but with different precipitation and temperature data.
  • Susqueda: It considers one sub-basin of Ter river catchment. Besides, it employs a setting of aquifer 203 parameters for month-by-month water contributions.

3.2. Data

Research data was from three main sources. Rainfall and temperature records were from the Spanish Meteorological State Agency (AEMET), considering all available stations. Forty-four weather stations provide Ter basin 1980–2015 rainfall records, and eleven weather stations contribute Llobregat basin records. Each zone drawn with the same color represents an area with equal rainfall estimation by the Thiessen polygon method (Figure 2).
The calibration of the HBV model discharge results uses data from stream gauging stations of the ACA managed upper basins. As it is not possible to use gauging stations data in basin lower zones, we calibrated the ACA hydrological simulated data with the historical calibrated upper zone discharge data and compared the computed values against the HBV model dataset.
In addition to the observed data, downscaled climate-model outputs were collected from the Climate Research Foundation database [25], as shown in Table 2. These local time series are outputs from a statistical downscaling method of Ribalaygua et al. [26] based on analog stratification and transfer functions. Data include local simulations of ERA-Interim reanalysis and nine CMIP5 models under both historical experiments (1951–2005) and future projections (2006–2100) under RCP4.5 and RCP8.5.

4. Results

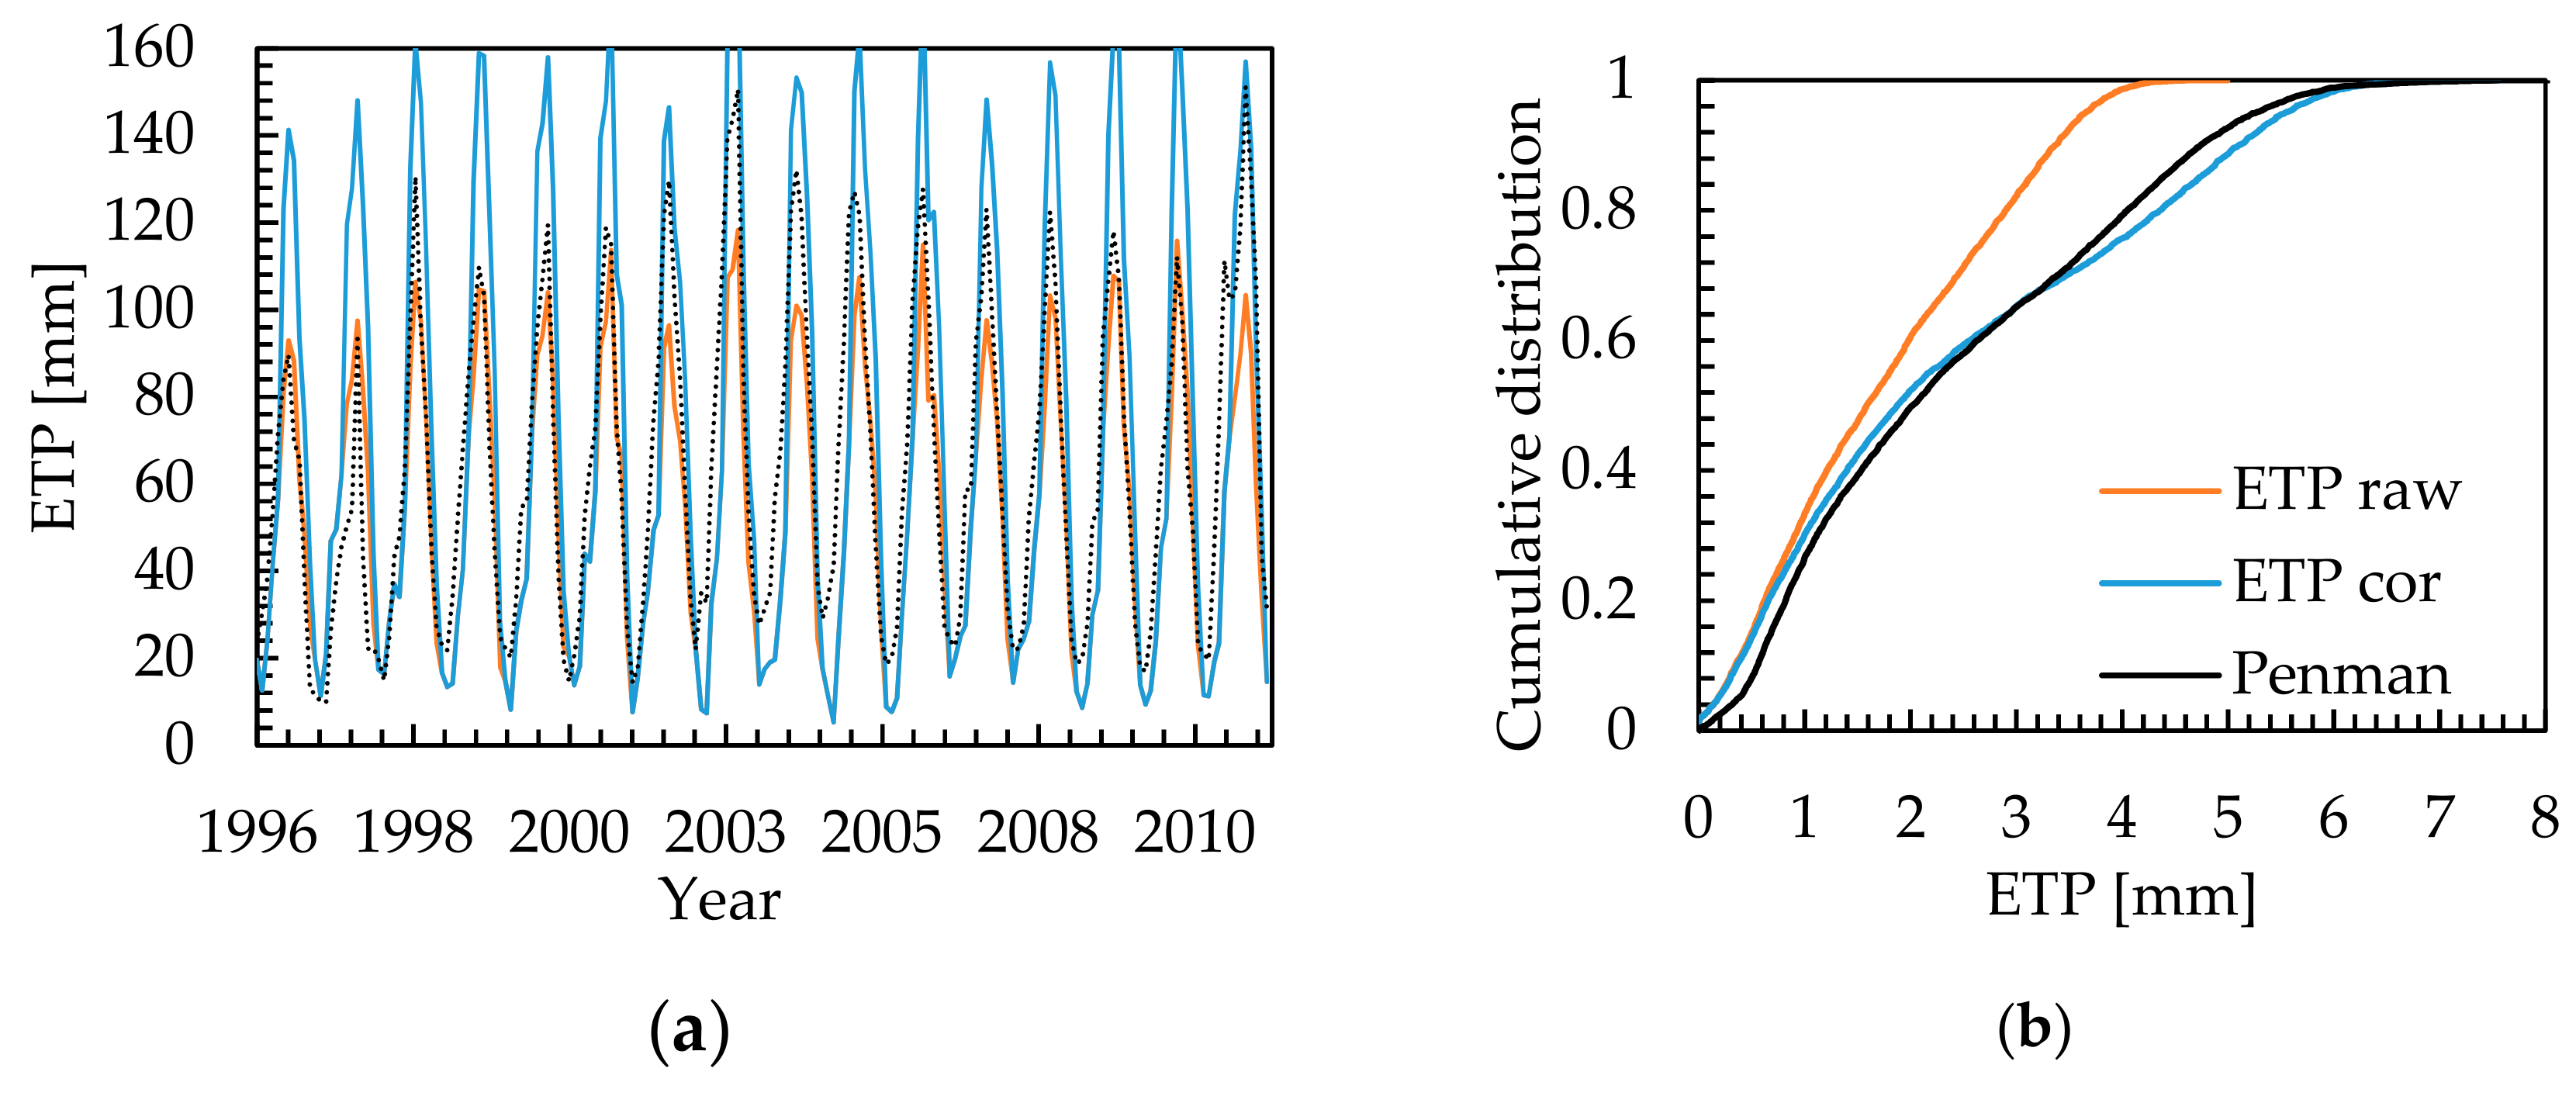
4.1. Evapotranspiration Calibration

The calibration process worked with two temperature stations’ data (0085A for Llobregat basin and 0353 for Ter basin, see Figure 2), where the required data for computing Penman ETP was available. Over the Llobregat’s temperature stations, we applied a correction with the 0085A station dataset. Likewise, for Ter’s upper-temperature stations. Correction obtained with 0353 station dataset was applied at the downstream Ter’s sub-basins due to its geographic location. Figure 3 shows the results at both stations. The left-hand side graph displays the considered monthly evapotranspiration, and the right-hand side one, its cumulative distribution.
To measure the efficiency of the correction, we computed the mean square error (MSE) for the Thornthwaite ETP, raw and corrected. Water volume contributions were checked for each season, and so, the ETP correction may change somewhat from one season to another.

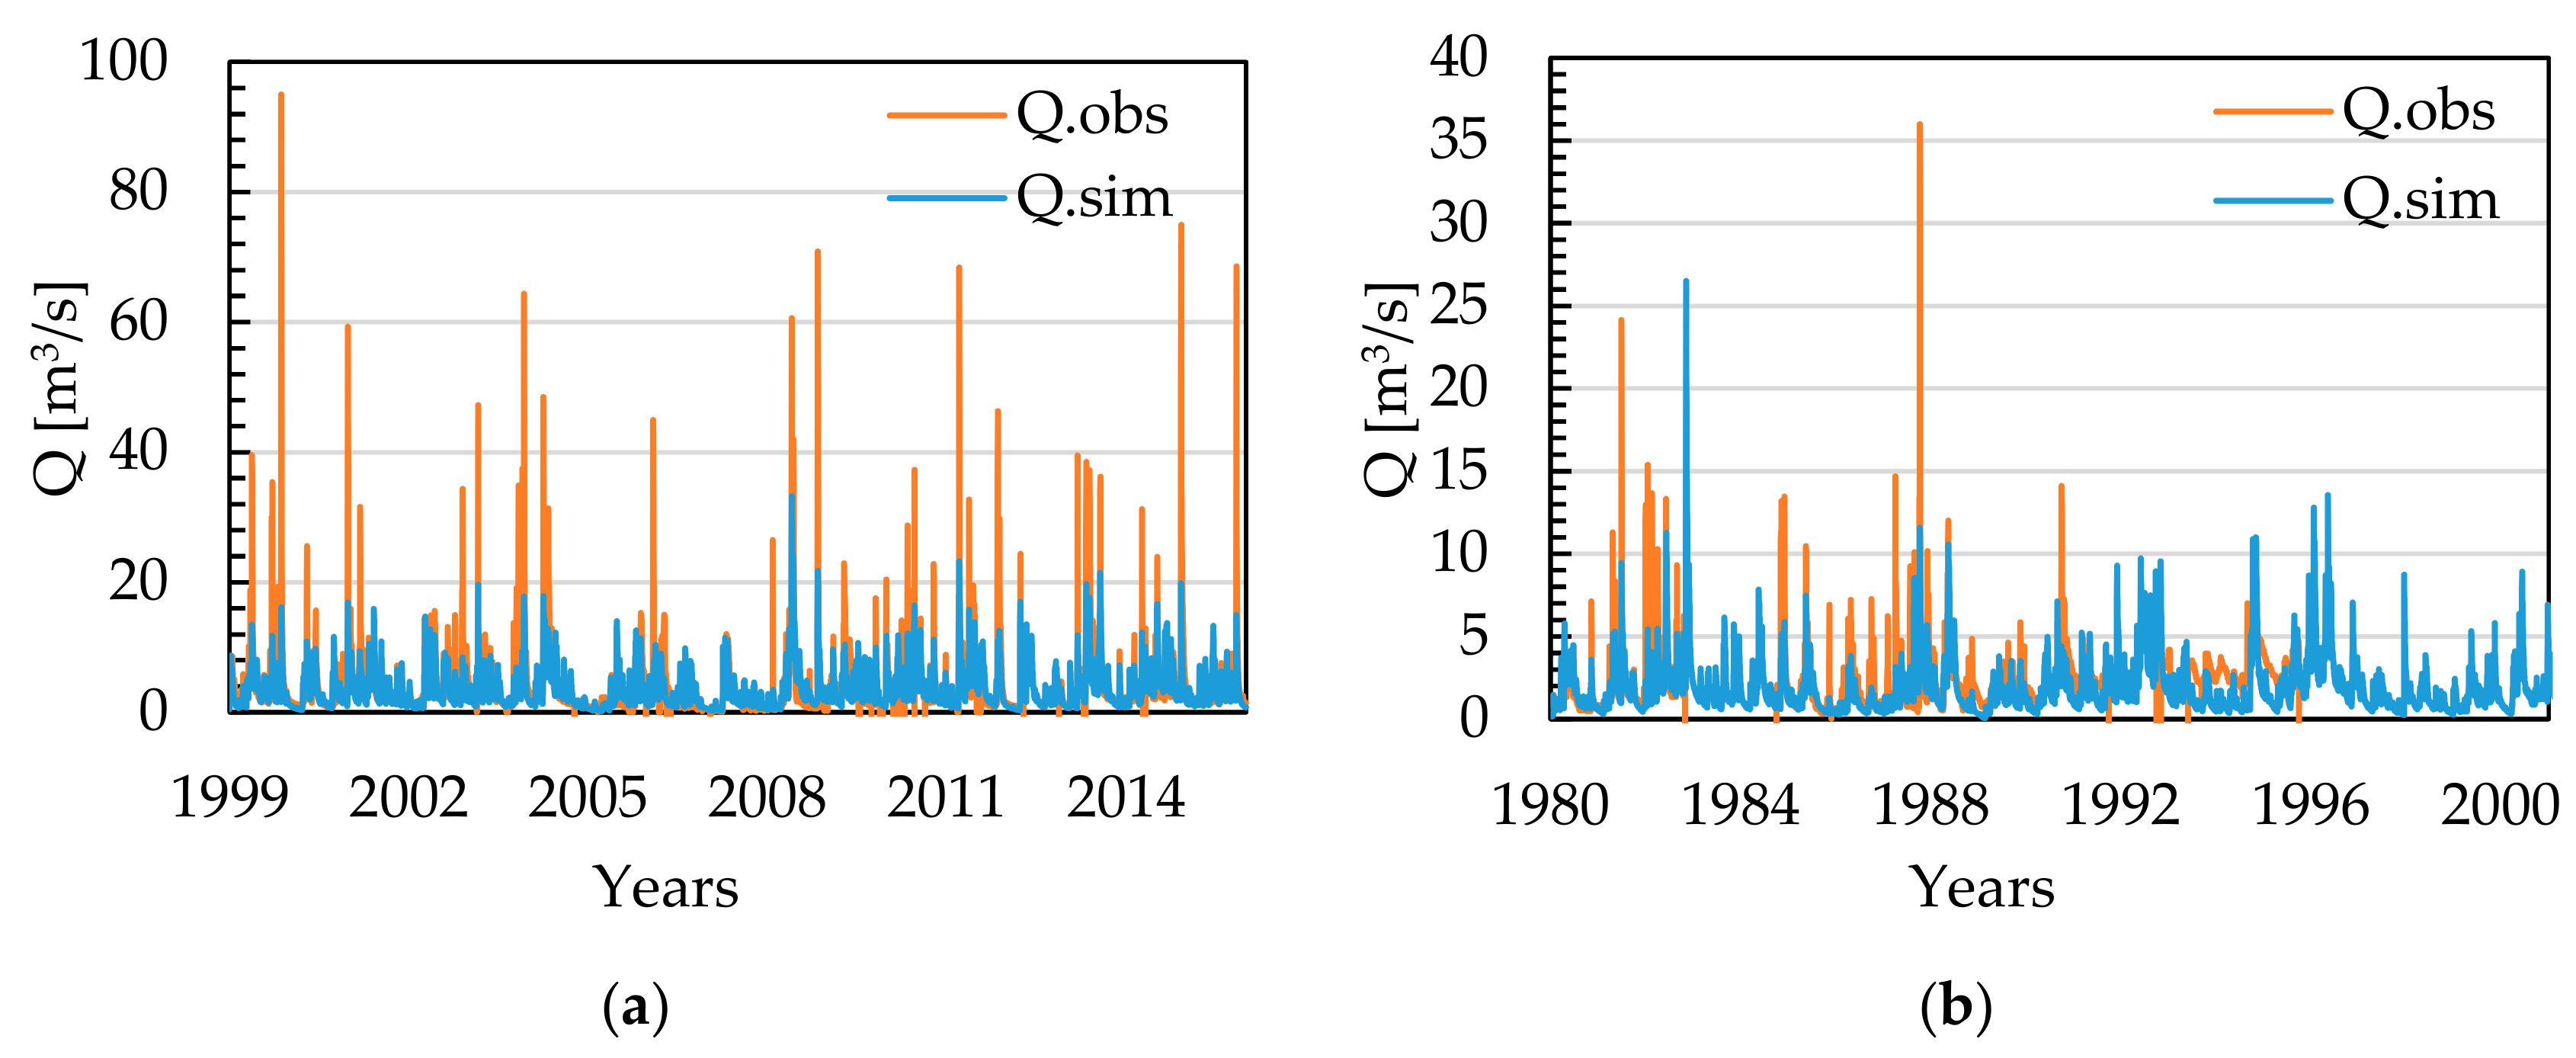
4.2. Calibration and Validation of Hydrological Parameters

Figure 4 presents the response hydrographs at the locations where stream gauging stations provide records. These stations include EA078 in the la Baells sub-basin, EA087 and EA021 in the La Llosa del Cavall sub-basin and EA033 in the Sau sub-basin.
Figure 4a shows how response hydrograph performs a good base flows simulation but decreases accuracy in peak flows simulation. Nevertheless, the Nash-coefficient equal to 0.42 was enough to reproduce the behavior of the A78 sub-basin. Peak flows were undershot, but it was preferable to underestimate these contributions as a safety factor, considering weather station scarcity in this area, which directly influences the rainfall time series. Analyzing the response, the approximation was precise enough to reproduce the behavior of this sub-basin. In Figure 4b, the Nash coefficient in this basin was 0.30, which returns a satisfactory outcome. The main differences were gathered from 1990, when the available records had quality issues, as the frequency of the measurements increased to 4–7 days.
In the rest of the basins, two verifications reviewed the results. We compared monthly contributions for each season, and the water contributions were correlated applying a linear regression of the HBV and SIMGES models. Evaluation through the R2 coefficient as shown in Figure 5 verifies whether the distribution is similar among HBV and SIMGES volumes. In addition, we checked the Nash-coefficient with each reservoir’s computed contributions for all seasons. Table 3 presents the calculated Nash-coefficients.
Subsequently, the total contributions from 1980–2013 were analyzed to check if the total volume of water available to serve the demand was the same, regarding the distribution by year at each reservoir unit for the HBV, and the SIMGES model used as a reference, as Figure 6 illustrates.
The outcomes from both models were similar. The main difference came from the distribution over the year, in particular during summer months, when SIMGES contributions were critical. One of the main reasons to explain this difference may come from the two time-series input models. Recognizing that both datasets are different, the results cannot be the same. Outcomes were similar, ensuring the representation created with the HBV model achieved a reasonable resemblance with the historical dataset.

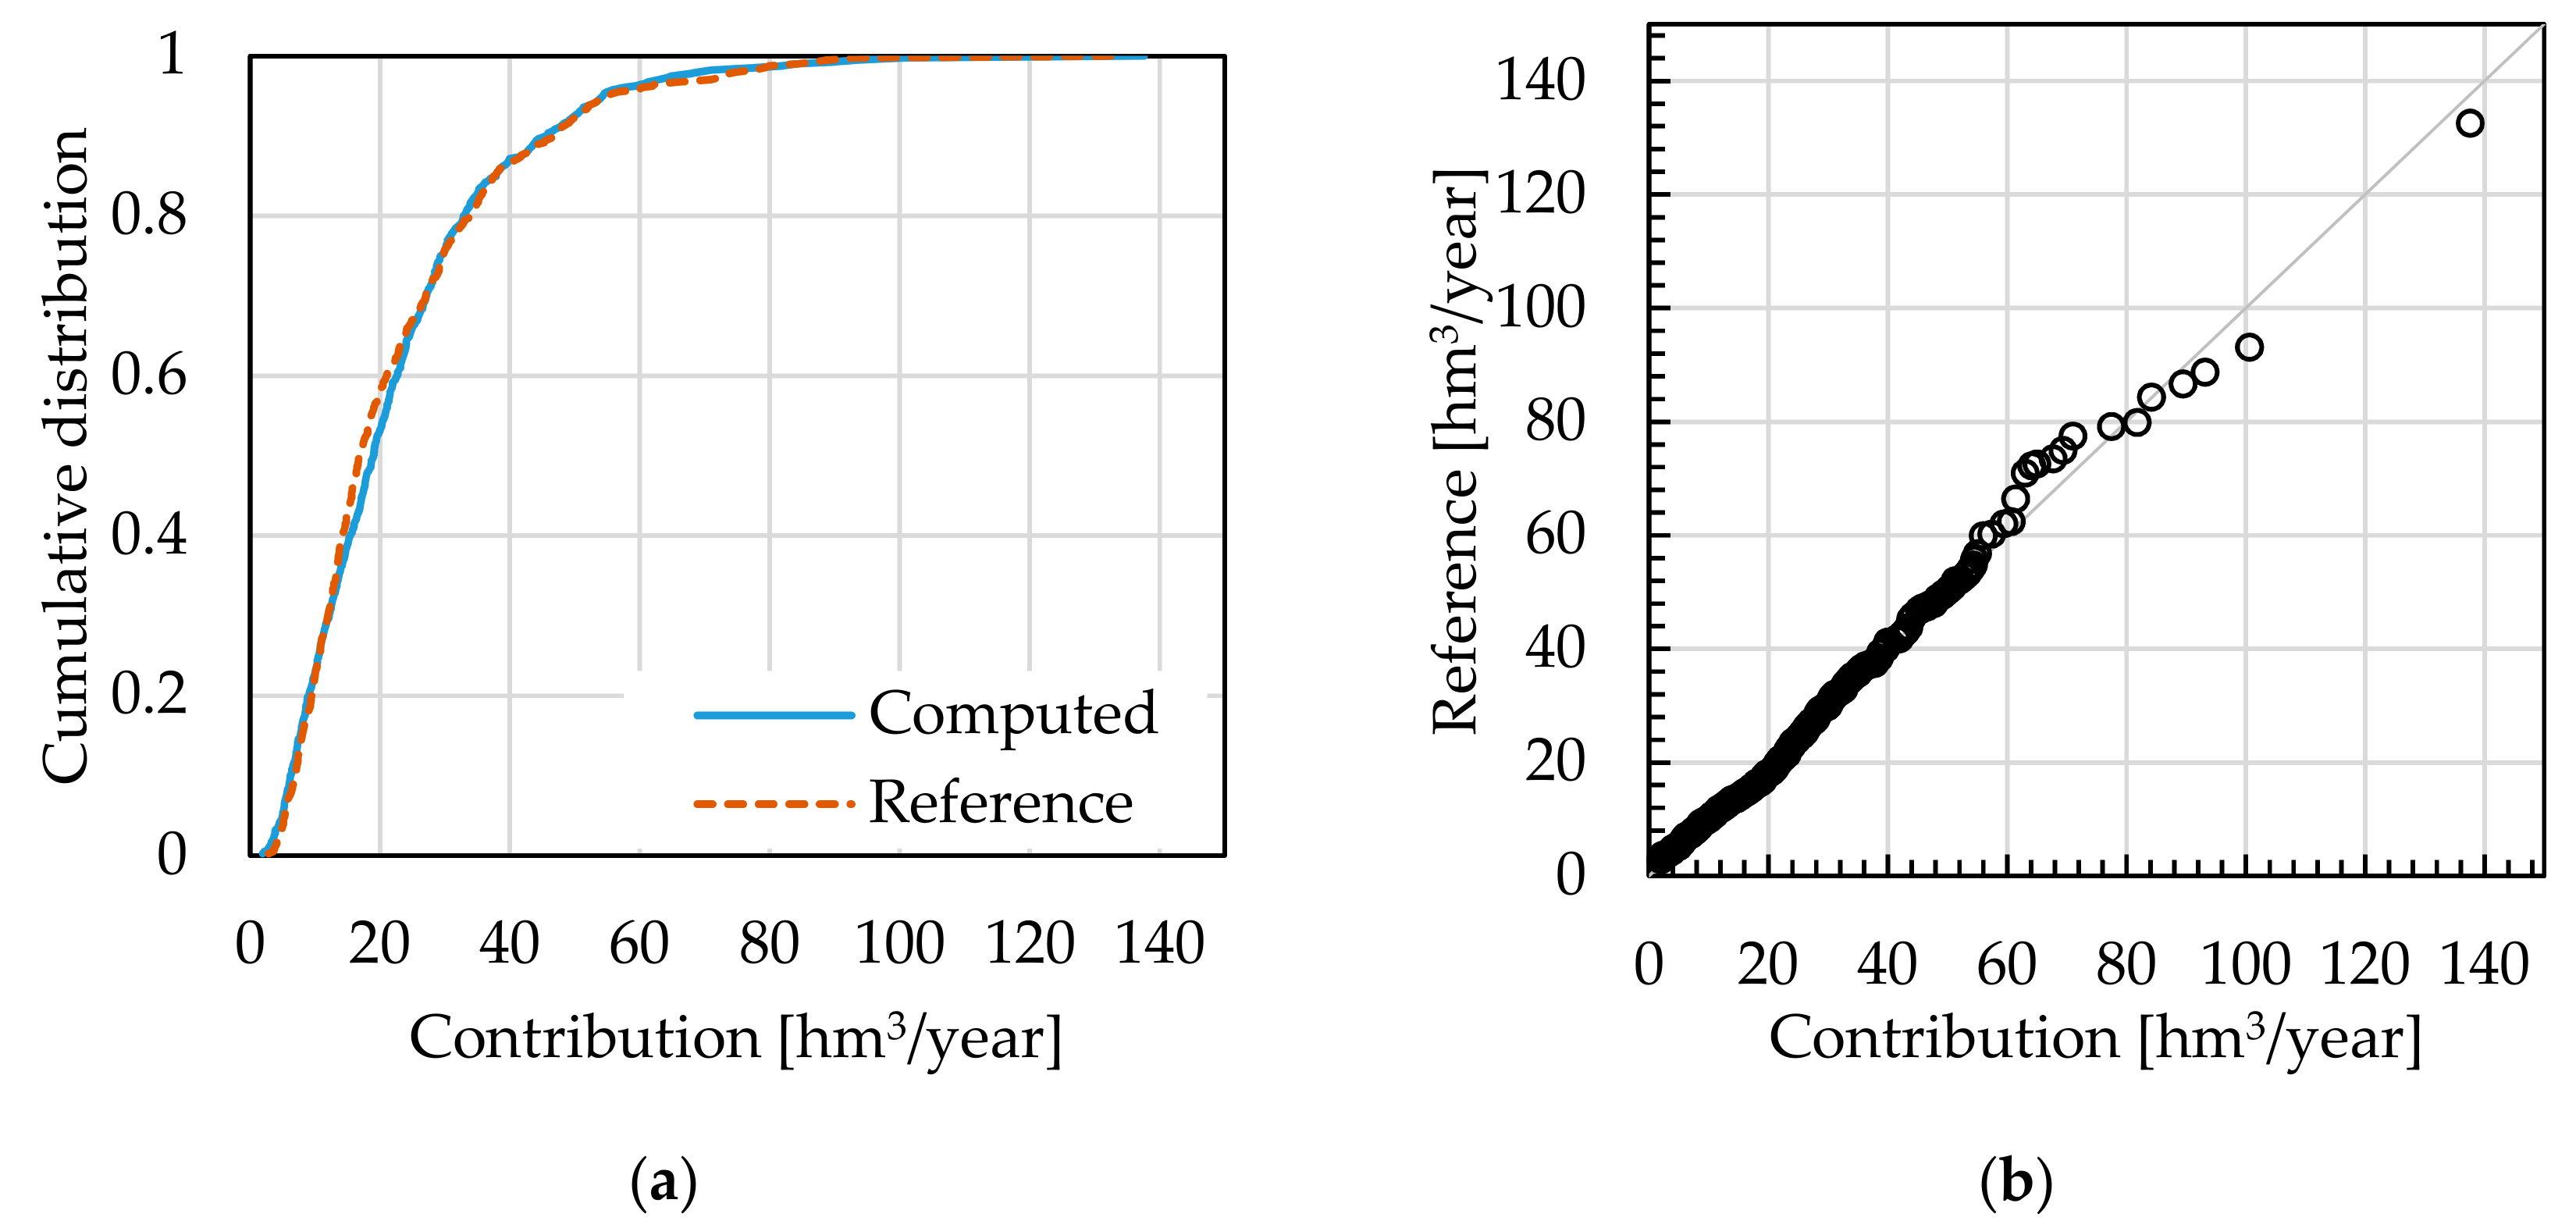
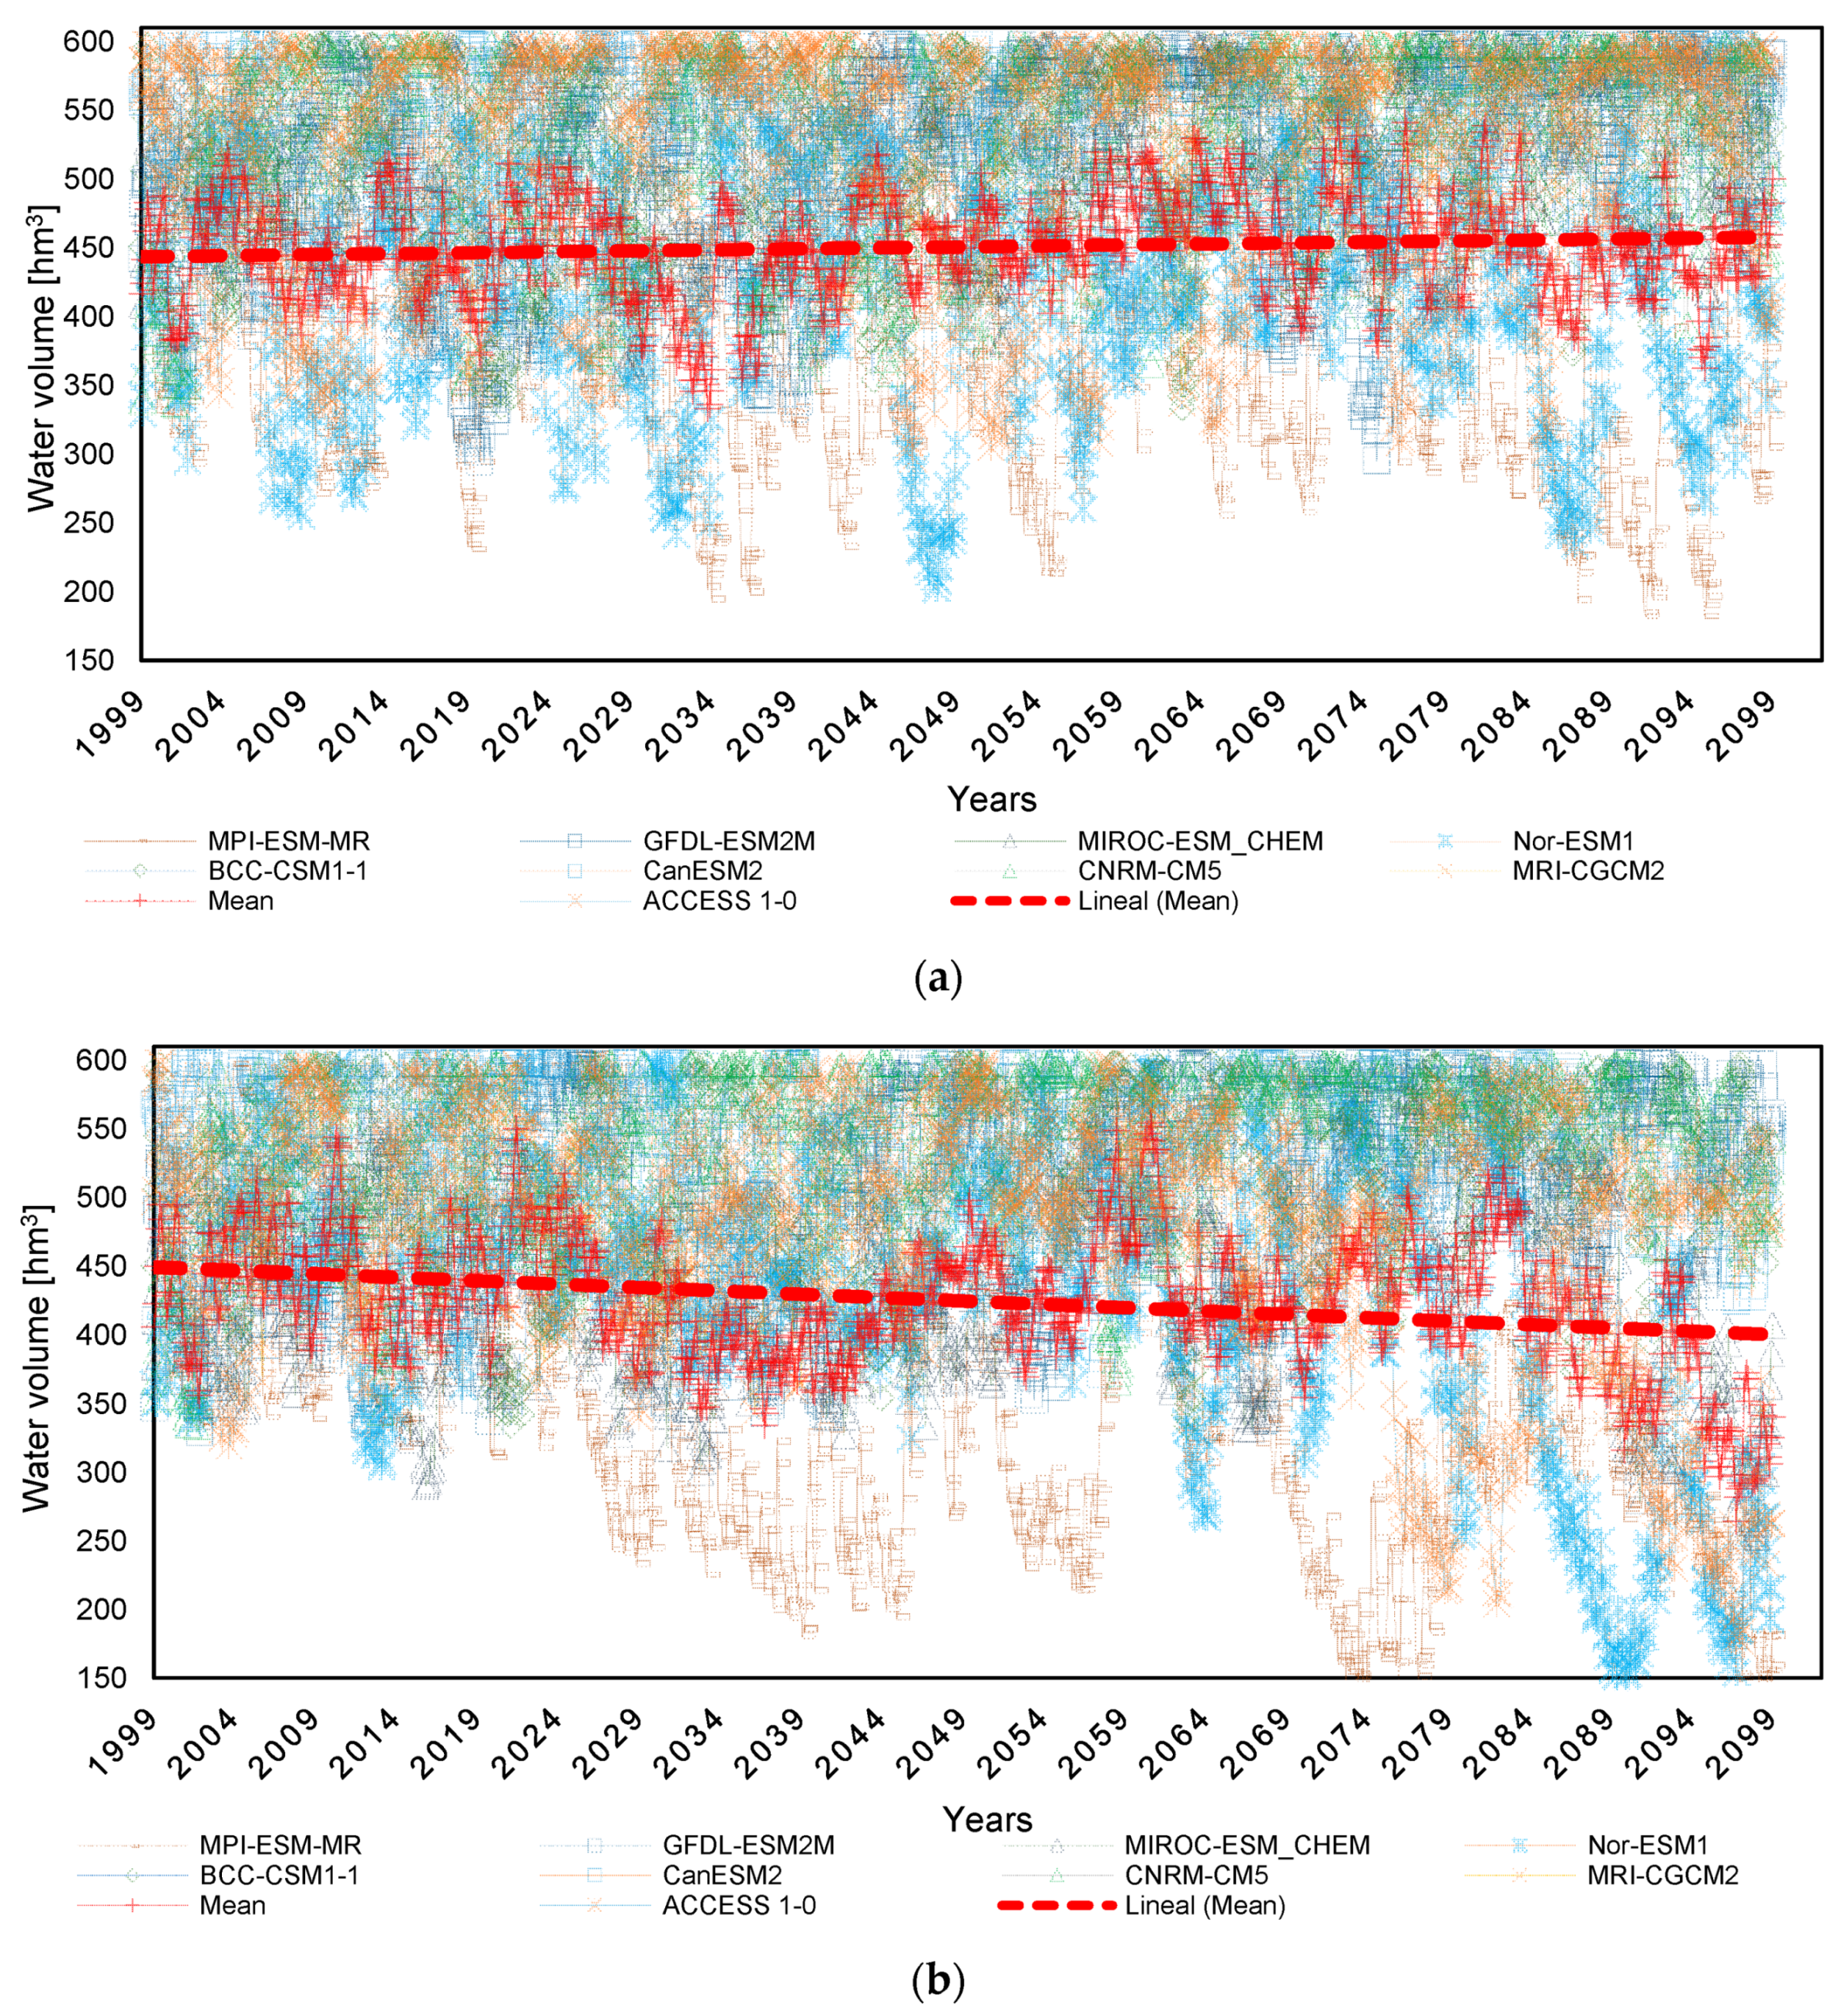
4.3. Simulations under Future Rainfall Conditions

Reservoir volumes results were from historical data provided by ACA. Results of the projections indicated that not all the climate models were adversely predictive: some of them forecasted rainfall increase (volume), while others estimated a reduction. Figure 7 shows some models forecasting severe drought situations in the RCP8.5 scenario, compared with the RCP4.5 scenario, which showed water scarcity, according to a few models for Ter and Llobregat reservoirs. According to projections, it is expected that in both systems for the RCP8.5 scenario, at least one drought episode is expected with the 20-years return period.
Model trends and extreme values were plotted to represent the magnitude of future situations and to consider all the possible climate model variables evolution during the 21st century. An implication of the negative trend, as for the RCP8.5 in the reservoir system, is the possibility that a long-term alternative resource will be necessary to preserve reservoir equilibrium. Regression analysis predicts the combined behavior of both systems as a joint water reservoir system. In particular, the analysis of the joint system allows studying the link among the most challenging climate change scenario (RCP8.5) and the predicted water resources availability and bypass any analysis bias.
Figure 7 displays the intercorrelations of the nine performed models, providing a behavior trend-line of the reservoir system water volume. An average trend of these model outputs forecasts an 11.1% decrease in the system water availability, applying the RCP8.5 scenario for the year 2100. Such water availability variations will have city-scale consequences for social-economic conditions and ecosystems.

5. Discussion

Turning now to the assessment on the applicability of the SIMGES and HBV models as appropriate tools to forecast drought frequency, some factors play a role in determining why the HBV model underestimated the water contribution, as shown in Figure 4, for the first calibration and validation step. The main reason that can be argued to explain this may come from the precipitation records. At high areas, such as this one, convective storms may occur over a localized area not covered by any meteorological station. In any case, the HBV contributions were on the security side. SIMGES model contributions apply in ACA Water Management Plan were closer to HBV computed values. Thus, the response of the HBV model is reasonable.
Analyzing Table 3 outcomes for each season, it is observed how the winter and autumn volume contributions present the best correlation to the SIMGES model. Throughout the spring and summer periods, the dispersion of the results was high. However, the Nash-coefficients were satisfactory for the most significant reservoirs: La Baells, Sau, and Susqueda. La Llosa del Cavall and Sant Ponç reservoirs could not have been simulating with the same precision, notwithstanding, its contribution to the total water reserves was 13% and 4%. Hence, their contribution to the entire system was small in comparison with the other dams.
On the question of understanding and analyzing the water resource availability in Barcelona in the future under different climate change situations, this study found that the water availability would drop in this 21st century for the reservoir system. By 2019–2050, the models average predicts a 9% decrease in surface water volume availability over the reservoir system. However, by 2019–2100, due to precipitation reduction and warming-enhanced evaporation, Climate Change effects, the models average predicts an 11% decrease with a remarkably high consensus among analyzed models for the RCP8.5 scenario, as shown in Figure 7.
The results obtained herein are consistent with Barcelona regional and Barcelona city council results [10], estimating in the year 2050, a 12% surface water resources decrease. Table 4 compares the summary statistics for the water resources availability forecast, comparing other studies for the reservoir system.
These results are consonant with related studies [17], finding that according to valid data control models and detailing low-heterogeneity results, Llobregat river discharges will decrease, in a 2% scale for years 2070–2100.
Our approach in this paper explored the water availability of the principal sources providing about 92% of contemporary water demand. Due to practical constraints, a full discussion of adaptation measures coping with water availability shortage lies beyond the scope of this study. Catalonian Drought Plan documents designate some current adaptation measures [11,37]. They relate an increase in alternative water sources and a decrease in drinking water consumption, such as the planning and implementation of water reclamation and reuse, desalination as a technical option to increase the drinking water availability, to increase groundwater extraction, and to decrease consumption (stronger for agriculture, breeding, and recreative uses).
However, these solutions have significant technical, legal, political, and economic hurdles. In the case of the existing desalination plant, its maximum potential for water production is 60 Hm3/year, an amount that could meet the current and future water shortages set in this study, nevertheless, the average unit cost of desalinated water production (€ 0.58/m3) cost four times more than the cost of potable water production in the drinking water treatment plant (€ 0.14/m3) [24,38].

6. Conclusions

Drought model outcomes cannot predict future conditions for a fact. Still, these results will aid researchers and stakeholders to have an idea concerning the order of magnitude of eventual future drought episodes. The associated uncertainty in climate model variables does not allow them to be used to define a single future path, even though the results can be valuable to design future system improvements and investments.
Overall, these results highlight that under the RCP8.5 scenario, cyclic drought episodes are expected to occur every twenty years with more than one year of drought state persistency. Further research can evaluate climate change impacts, updating models forecast every 5/10 years, to estimate a most reliable behavior forecasting. For the water supply side, renewable water resources are influenced by anthropogenic factors, precipitation, temperature, and other climate variables fluctuations, yet, we dismiss these variations in this study scope.
This study combined hydrological models and the latest greenhouse gas concentration scenarios to synthesize the proposed behavior of water sources in Barcelona. We showed that climate change is likely to affect local and regional water scarcity modestly. Moreover, this research forecasts a water-availability slightly downward trend from the middle of the 21st century. This proposed behavior does not mean that the annual water contributions are ever lower than the current ones. We identified an increase in drought cycle frequency, following a reduction in the average water availability, even in years of hydrological ascent.
By contrast, these reductions lead to a trend (i.e., the one conditioning the water supply system capacity) alleviated by a constant alternative source with the same magnitude and adding specific support when extreme events occur. With regard to the research methods, some limitations need to be acknowledged. After defining how the expected water availability decreases in the system, it is necessary to consider that these analyses do not consider the future growth of water demand or any new planned infrastructure. Likewise, this study does not consider variations in land-use future states. The reservoir watershed has undergone a revegetalization process since 1997, as assorted researches carried out in Catalonia indicates a farmland abandonment process and the resulting increase in forest mass [39]; as a result, we consider these land-use conditions will remain stable in the future.
Further research is expected to have a better understanding of the mechanisms underlying Barcelona reservoirs’ management yielding an effective and sustainable water supply scheme, in conjunction with other hydrological involved processes. Adaptation measures studies, which take these variables into account, will need to be undertaken.

Author Contributions

E.F.-O.: Conceptualization, Methodology, Software, Formal analysis, Investigation, Data curation, Writing—original draft preparation. E.M.-G.: Conceptualization, Validation, Resources, Writing—review and editing; Supervision, Project administration. R.M.: Investigation, Methodology, Visualization, Data curation, Resources. All authors have read and agreed to the published version of the manuscript.

Funding

This research was funded by the RESCCUE project, which is sponsored by the European Union’s Horizon 2020 research and innovation program under grant agreement No. 700174, whose support is gratefully recognized.

Acknowledgments

The contents of this research are a part of the findings of the project RESCCUE, which has obtained funding from the EU H2020 (grant agreement n. 700174). Re-use of the knowledge enclosed in this paper for commercial and/or non-commercial purposes is allowed and free of charge, on the requirements of compliance by the re-user of the research, not distortion of the original meaning or information of this research and the non-liability of the project RESCCUE partners for any consequence stemming from the re-use. The project RESCCUE partners do not accept any liability for the errors, consequences, or omissions herein contained.

Conflicts of Interest

The authors declare no conflict of interest. The funders had no role in the design of the study; in the collection, analyses, or interpretation of data; in the writing of the manuscript, or in the decision to publish the results.

References

  1. Chen, L.; Guo, S. Copulas and its Application in Hydrology and Water Resources; Springer: Singapore, 2019; ISBN 9789811305733. [Google Scholar]
  2. Grillakis, M.G. Increase in severe and extreme soil moisture droughts for Europe under climate change. Sci. Total Environ. 2019, 660, 1245–1255. [Google Scholar] [CrossRef]
  3. Tian, W.; Liu, X.; Liu, C.; Bai, P. Investigation and simulations of changes in the relationship of precipitation-runoff in drought years. J. Hydrol. 2018, 565, 95–105. [Google Scholar] [CrossRef]
  4. Hao, Z.; Hao, F.; Singh, V.P.; Sun, A.Y.; Xia, Y. Probabilistic prediction of hydrologic drought using a conditional probability approach based on the meta-Gaussian model. J. Hydrol. 2016, 542, 772–780. [Google Scholar] [CrossRef]
  5. Singh, S.; Sharma, V.K. Urban Droughts in India: Case Study of Delhi; Springer: Singapore, 2019; ISBN 9789811089466. [Google Scholar]
  6. Roudier, P.; Andersson, J.C.M.; Donnelly, C.; Feyen, L.; Greuell, W.; Ludwig, F. Projections of future floods and hydrological droughts in Europe under a +2°C global warming. Clim. Change 2016, 135, 341–355. [Google Scholar] [CrossRef] [Green Version]
  7. Koutroulis, A.G.; Papadimitriou, L.V.; Grillakis, M.G.; Tsanis, I.K.; Wyser, K.; Betts, R.A. Freshwater vulnerability under high end climate change. A pan-European assessment. Sci. Total Environ. 2018, 613–614, 271–286. [Google Scholar] [CrossRef] [PubMed]
  8. Iglesias, A.; de Garrote, L.; Cancelliere, A.; Cubillo, F.; Wilhite, D. Coping with Drought Risk in Agriculture and Water Supply Systems Drought Management and Policy Development in the Mediterranean; Springer: Dordrecht, Netherlands, 2009; ISBN 9781402090448. [Google Scholar]
  9. Anand, J.; Gosain, A.K.; Khosa, R. Optimisation of multipurpose reservoir operation by coupling soil and water assessment tool (SWAT) and genetic algorithm for optimal operating policy (case study: Ganga River Basin). Sustainability 2018, 10, 1660. [Google Scholar] [CrossRef] [Green Version]
  10. Barcelona Regional; Ajuntament de Barcelona Cicle de L’Aigua - Estudi dels Impactes del Camvi Climàtic a Barcelona. Available online: http://www3.amb.cat/repositori/PSAMB/Canvi_clima.pdf (accessed on 19 November 2019).
  11. Generalitat de Catalunya; Agència Catalana de L’Aigua; Molist, J. Pla especial d’actuació en situació d’alerta i eventual sequera. Informe de sostenabilitat ambiental. Available online: http://aca.gencat.cat/web/.content/30_Plans_i_programes/30_Pla_sequera/bloc1/04_pes_Isa_ca.pdf (accessed on 7 November 2019).
  12. Martin-Ortega, J.; González-Eguino, M.; Markandya, A. The costs of drought: The 2007/2008 case of Barcelona. Water Policy 2012, 14, 539–560. [Google Scholar] [CrossRef]
  13. Coll, J.R.; Aguilar, E.; Prohom, M.; Sigró, J. Variabilidad y tendencias a largo plazo de las sequías en Barcelona (1787-2014). Cuad. Investig. Geogr. 2016, 42, 29–48. [Google Scholar] [CrossRef] [Green Version]
  14. Pascual, D.; Pla, E.; Lopez-Bustins, J.A.; Retana, J.; Terradas, J. Impacts du changement climatique sur les ressources en eau dans le bassin méditerranéen: Une étude de cas en Catalogne, Espagne. Hydrol. Sci. J. 2015, 60, 2132–2147. [Google Scholar] [CrossRef] [Green Version]
  15. Gallart, F.; Delgado, J.; Beatson, S.J.V.; Posner, H.; Llorens, P.; Marcé, R. Analysing the effect of global change on the historical trends of water resources in the headwaters of the Llobregat and Ter river basins (Catalonia, Spain). Phys. Chem. Earth 2011, 36, 655–661. [Google Scholar] [CrossRef]
  16. Barcelona Regional. Ajuntament de Barcelona Estratègia Delta del Llobregat. Available online: https://ajuntament.barcelona.cat/economiatreball/sites/default/files/documents/MemoriaESTRATEGIADELTA_A4_completa.pdf (accessed on 18 September 2019).
  17. Agència Catalana de l’Aigua Aigua i Canvi Cimàtic. Diagnosi dels Impactes Previstos a Catalunya. Available online: http://www.gencat.cat/mediamb/publicacions/monografies/aigua_canvi_climatic.pdf (accessed on 25 September 2019).
  18. Seibert, J.; Vis, M.J.P. Teaching hydrological modeling with a user-friendly catchment-runoff-model software package. Hydrol. Earth Syst. Sci. 2012, 16, 3315–3325. [Google Scholar] [CrossRef] [Green Version]
  19. Versini, P.A.; Pouget, L.; McEnnis, S.; Custodio, E.; Escaler, I. Climate change impact on water resources availability: Case study of the Llobregat River basin (Spain). Hydrol. Sci. J. 2016, 61, 2496–2508. [Google Scholar] [CrossRef]
  20. Velasco, M.; Versini, P.A.; Cabello, A.; Barrera-Escoda, A. Assessment of flash floods taking into account climate change scenarios in the Llobregat River basin. Nat. Hazards Earth Syst. Sci. 2013, 13, 3145–3156. [Google Scholar] [CrossRef]
  21. Andreu, J.; Solera, A. Methodology for the analysis of drought mitigation measures in water resources systems. Drought Manag. Plan. Water Resour. 2006, 133–168. [Google Scholar]
  22. Céspedes, R.; Lacorte, S.; Ginebreda, A.; Barceló, D. Chemical monitoring and occurrence of alkylphenols, alkylphenol ethoxylates, alcohol ethoxylates, phthalates and benzothiazoles in sewage treatment plants and receiving waters along the ter River basin (Catalonia, N.E. Spain). Anal. Bioanal. Chem. 2006, 385, 992–1000. [Google Scholar] [CrossRef]
  23. Honey-Rosés, J.; Acuña, V.; Bardina, M.; Brozović, N.; Marcé, R.; Munné, A.; Sabater, S.; Termes, M.; Valero, F.; Vega, À.; et al. Examining the demand for ecosystem services: The value of stream restoration for drinking water treatment managers in the Llobregat river, Spain. Ecol. Econ. 2013, 90, 196–205. [Google Scholar] [CrossRef]
  24. Pouget, L.; Escaler, I.; Guiu, R.; Mc Ennis, S.; Versini, P.A. Global Change adaptation in water resources management: The Water Change project. Sci. Total Environ. 2012, 440, 186–193. [Google Scholar] [CrossRef]
  25. Climate Research Foundation (FIC). Downscaled climate model outputs of the RESCCUE project. Available online: https://www.ficlima.org/intercambio/indexed/RESCCUE/ (accessed on 19 November 2019).
  26. Ribalaygua, J.; Torres, L.; Portoles, J.; Monjo, R.; Gaitan, E.; Pino, M. Description and validation of a two-step analogue/regression downscaling method. Theor. Appl. Climatol. 2013, 114, 253–269. [Google Scholar] [CrossRef]
  27. Bi, D.; Dix, M.; Marsland, S.J.; O’Farrell, S.; Rashid, H.; Uotila, P.; Hirst, A.C.; Kowalczyk, E.; Golebiewski, M.; Sullivan, A.; et al. The ACCESS coupled model: Description, control climate and evaluation. Aust. Meteorol. Ocean. J 2013, 63, 41–64. [Google Scholar] [CrossRef]
  28. Xiao-Ge, X.; Tong-Wen, W.; Jie, Z. Introduction of CMIP5 Experiments Carried out with the Climate System Models of Beijing Climate Center. Adv. Clim. Chang. Res. 2013, 4, 41–49. [Google Scholar] [CrossRef]
  29. Chylek, P.; Li, J.; Dubey, M.K.; Wang, M.; Lesins, G. Observed and model simulated 20th century Arctic temperature variability: Canadian Earth System Model CanESM2. Atmos. Chem. Phys. Discuss. 2011, 11, 22893–22907. [Google Scholar] [CrossRef]
  30. Voldoire, A.; Sanchez-Gomez, E.; y Mélia, D.; Decharme, B.; Cassou, C.; Sénési, S.; Valcke, S.; Beau, I.; Alias, A.; Chevallier, M.; et al. The CNRM-CM5.1 global climate model: Description and basic evaluation. Clim. Dyn. 2013, 40, 2091–2121. [Google Scholar] [CrossRef]
  31. Dunne, J. GFDL’s ESM2 Global Coupled Climate-Carbon Earth System Models. Part I: Physical Formulation and Baseline Simulation Characteristics. J. Clim. 2012, 25, 6646–6665. [Google Scholar] [CrossRef] [Green Version]
  32. Watanabe, S.; Hajima, T.; Sudo, K.; Nagashima, T.; Takemura, T.; Okajima, H.; Nozawa, T.; Kawase, H.; Abe, M.; Yokohata, T.; et al. MIROC-ESM 2010: Model description and basic results of CMIP5-20c3m experiments. Geosci. Model Dev. 2011, 4, 845. [Google Scholar] [CrossRef] [Green Version]
  33. Marsland, S.J.; Haak, H.; Jungclaus, J.H.; Latif, M.; Röske, F. The Max-Planck-Institute global ocean/sea ice model with orthogonal curvilinear coordinates. Ocean Model. 2003, 5, 91–127. [Google Scholar] [CrossRef] [Green Version]
  34. Yukimoto, S.; Yoshimura, H.; Hosaka, M.; Sakami, T.; Tsujino, H.; Hirabara, M.; Tanaka, T.; Deushi, M.; Obata, A.; Nakano, H.; et al. Meteorological Research Institute-Earth System Model Version 1 (MRI-ESM1)—Model Description. Tech. Reports Meteorol. Res. Inst. 2011, 64, 1–96. [Google Scholar]
  35. Bentsen, M.; Bethke, I.; Debernard, J.B.; Iversen, T.; Kirkevåg, A.; Seland, Ø.; Drange, H.; Roelandt, C.; Seierstad, I.A.; Hoose, C.; et al. The Norwegian Earth System Model, NorESM1-M – Part 1: Description and basic evaluation of the physical climate. Geosci. Model Dev. 2013, 6, 687–720. [Google Scholar] [CrossRef] [Green Version]
  36. Iversen, T.; Bentsen, M.; Bethke, I.; Debernard, J.; Kirkevåg, A.; Seland, Ø.; Drange, H.; Kristjansson, J.; Medhaug, I.; Sand, M.; et al. The Norwegian Earth System Model, NorESM1-M - Part 2: Climate response and scenario projections. Geosci. Model Dev. 2013, 6, 389. [Google Scholar] [CrossRef] [Green Version]
  37. Agència catalana de l’aigua Pla especial d’actuació en situació d’alerta i eventual sequera Districte de conca fluvial de Catalunya. 2009.
  38. Cetaqua Identification of impacts and definition of adaptation measures. Available online: https://climate-adapt.eea.europa.eu/metadata/projects/medium-and-long-term-water-resources-modelling-as-a-tool-for-planning-and-global-change-adaptation-application-to-the-llobregat-basin (accessed on 12 October 2019).
  39. Duran, X.; Picó, M.J.; Reales, L. El Cambio Climático en cataluña. Resumen ejecutivo del Tercer informe sobre el cambio climático en Cataluña; Institut d’Estudis Catalans y Generalitat de Catalunya: Barcelona, Spain, 2017; ISBN 9788439396208. [Google Scholar]
Figure 1. Location of the involved reservoirs, rivers, catchments, and morphology of the study area.
Sustainability 12 01779 g001
Figure 2. (a) Division of sub-basins for the reservoir system on the Ter river; (b) Aquifers in the Ter river basin; (c) Division of sub-basins for the reservoir system on the Llobregat river; (d) Aquifers in the Llobregat river basin. The red dots indicate the placement of the meteorological stations in the Ter and Llobregat basins. The large red circles with black edge indicate gauging stations that are named as the sub-basin where they are located.
Sustainability 12 01779 g002
Figure 3. (a) Potential evapotranspiration calibration: Monthly ETP and (b) distribution of daily ETP at 0085A for the Llobregat basin; (c) Potential evapotranspiration calibration: Monthly ETP and (d) distribution of daily ETP at 0353 for the Ter basin.
Sustainability 12 01779 g003aSustainability 12 01779 g003b
Figure 4. Observed (obs) and computed (sim) response hydrograph: (a) La Baells station; (b) La Llosa del Cavall station.
Sustainability 12 01779 g004
Figure 5. (a) La Baells monthly reservoir contribution during winter months, comparison of Hydrologiska Byråns Vattenbalansavdelning (HBV) and SIMGES outputs; (b) Comparison analysis of the two contributions. The black line corresponds to a simple linear regression.
Sustainability 12 01779 g005
Figure 6. Complete Ter–Llobregat system: available water volumes comparison in years 1980–2013: (a) Water contributions data distribution for HBV and SIMGES models. The closer the lines are, the more similar they are. (b) To assess how similar they are, this shows the correlation between the two distributions. As the values are distributed along the reference line (slope 1.00), their correspondence is valid.
Sustainability 12 01779 g006
Figure 7. Results summary figure showing range and average water volume outcomes for every representative concentration pathway (RCP) scenario, for the Llobregat and Ter joint system towards the 21st century. The red-spotted line provides a linear trend estimation. (a) Results for the RCP8.5 scenario, (b) Results for the RCP4.5 scenario.
Sustainability 12 01779 g007
Table 1. The calibrated Hydrologiska Byråns Vattenbalansavdelning (HBV) model parameters for the Llobregat and Ter river basins.
HBV Model ParameterDescription {Unit}
βA shape coefficient that determines the precipitation contribution to the runoff
FCField capacity {mm}
LPLimit above Actual Evapotranspiration (AET) reaches ETP
K1Recession coefficient
K2Recession coefficient
UZLThreshold parameter {mm}
PercPercolation ratio
Table 2. Available Coupled Model Intercomparison Project 5 (CMIP5) climate models with outputs at a daily timescale. The table shows the responsible institution, climate model version, references, and spatial resolution for the atmospheric general circulation model (GCM).
InstitutionCMIP5 ModelSourceResolution (Lon × Lat)
Commonwealth Scientific and Industrial Research Organisation (CSIRO), Bureau of Meteorology (BOM)ACCESS1-0[27]1.87°×1.25°
Beijing Climate Center (BCC)BCC-CSM1-1[28]2.8°×2.8°
Canadian Centre for Climate Modelling and Analysis (CC-CMA)CanESM2[29]2.8°×2.8°
National Center for Meteorological Research, Météo-France and CNRS laboratory (CNRM-CERFACS)CNRM-CM5[30]1.4°×1.4°
Geophysical Fluid Dynamics Laboratory (GFDL)GFDL-ESM2M[31]2°×2.5°
Japan Agency for Marine-Earth Science and Technology (JAMSTEC), Atmosphere and Ocean Research Institute, the University of Tokyo (AORI), Japan National Institute for Environmental Studies (NIES)MIROC-ESM-CHEM[32]1.4°×1.4°
Max Planck Institute for Meteorology (MPI-M)MPI-ESM-MR[33]1.8°×1.8°
Meteorological Research Institute, Japan Meteorological Agency (MRI)MRI-CGCM3[34]1.2°×1.2°
Norwegian Climate Centre (NCC)NorESM1-M[35,36]2.5°×1.9°
Table 3. Nash-coefficient for each reservoir at a monthly time scale, for each season and considering the historical analyzed records (1980–2013).
Nash-CoefficientWinterSpringSummerAutumnTotal
La Baells0.850.670.510.890.79
La Llosa del Cavall0.720.600.440.220.49
Sant Ponç0.600.100.100.620.33
Llobregat’s Contribution0.850.640.550.870.79
Sau0.820.810.750.690.77
Susqueda0.590.310.320.410.42
Ter’s Contribution0.850.830.770.730.80
Table 4. Comparison of the summary statistics for the forecast of the water resources’ availability for the Ter and Llobregat reservoir system.
StudyMean Expected Reduction by 2050Mean Expected Reduction by 2100
Climate change impacts study in Barcelona—water cycle [10]12%No Data
RESCCUE Project9%11%
Water and climate change. Diagnosis of the impacts predicted in Catalonia [17,37]7%–15% according to diverse scenariosNo Data

