Urban Resilience to Flooding: Triangulation of Methods for Hazard Identification in Urban Areas


Abstract
1. Introduction
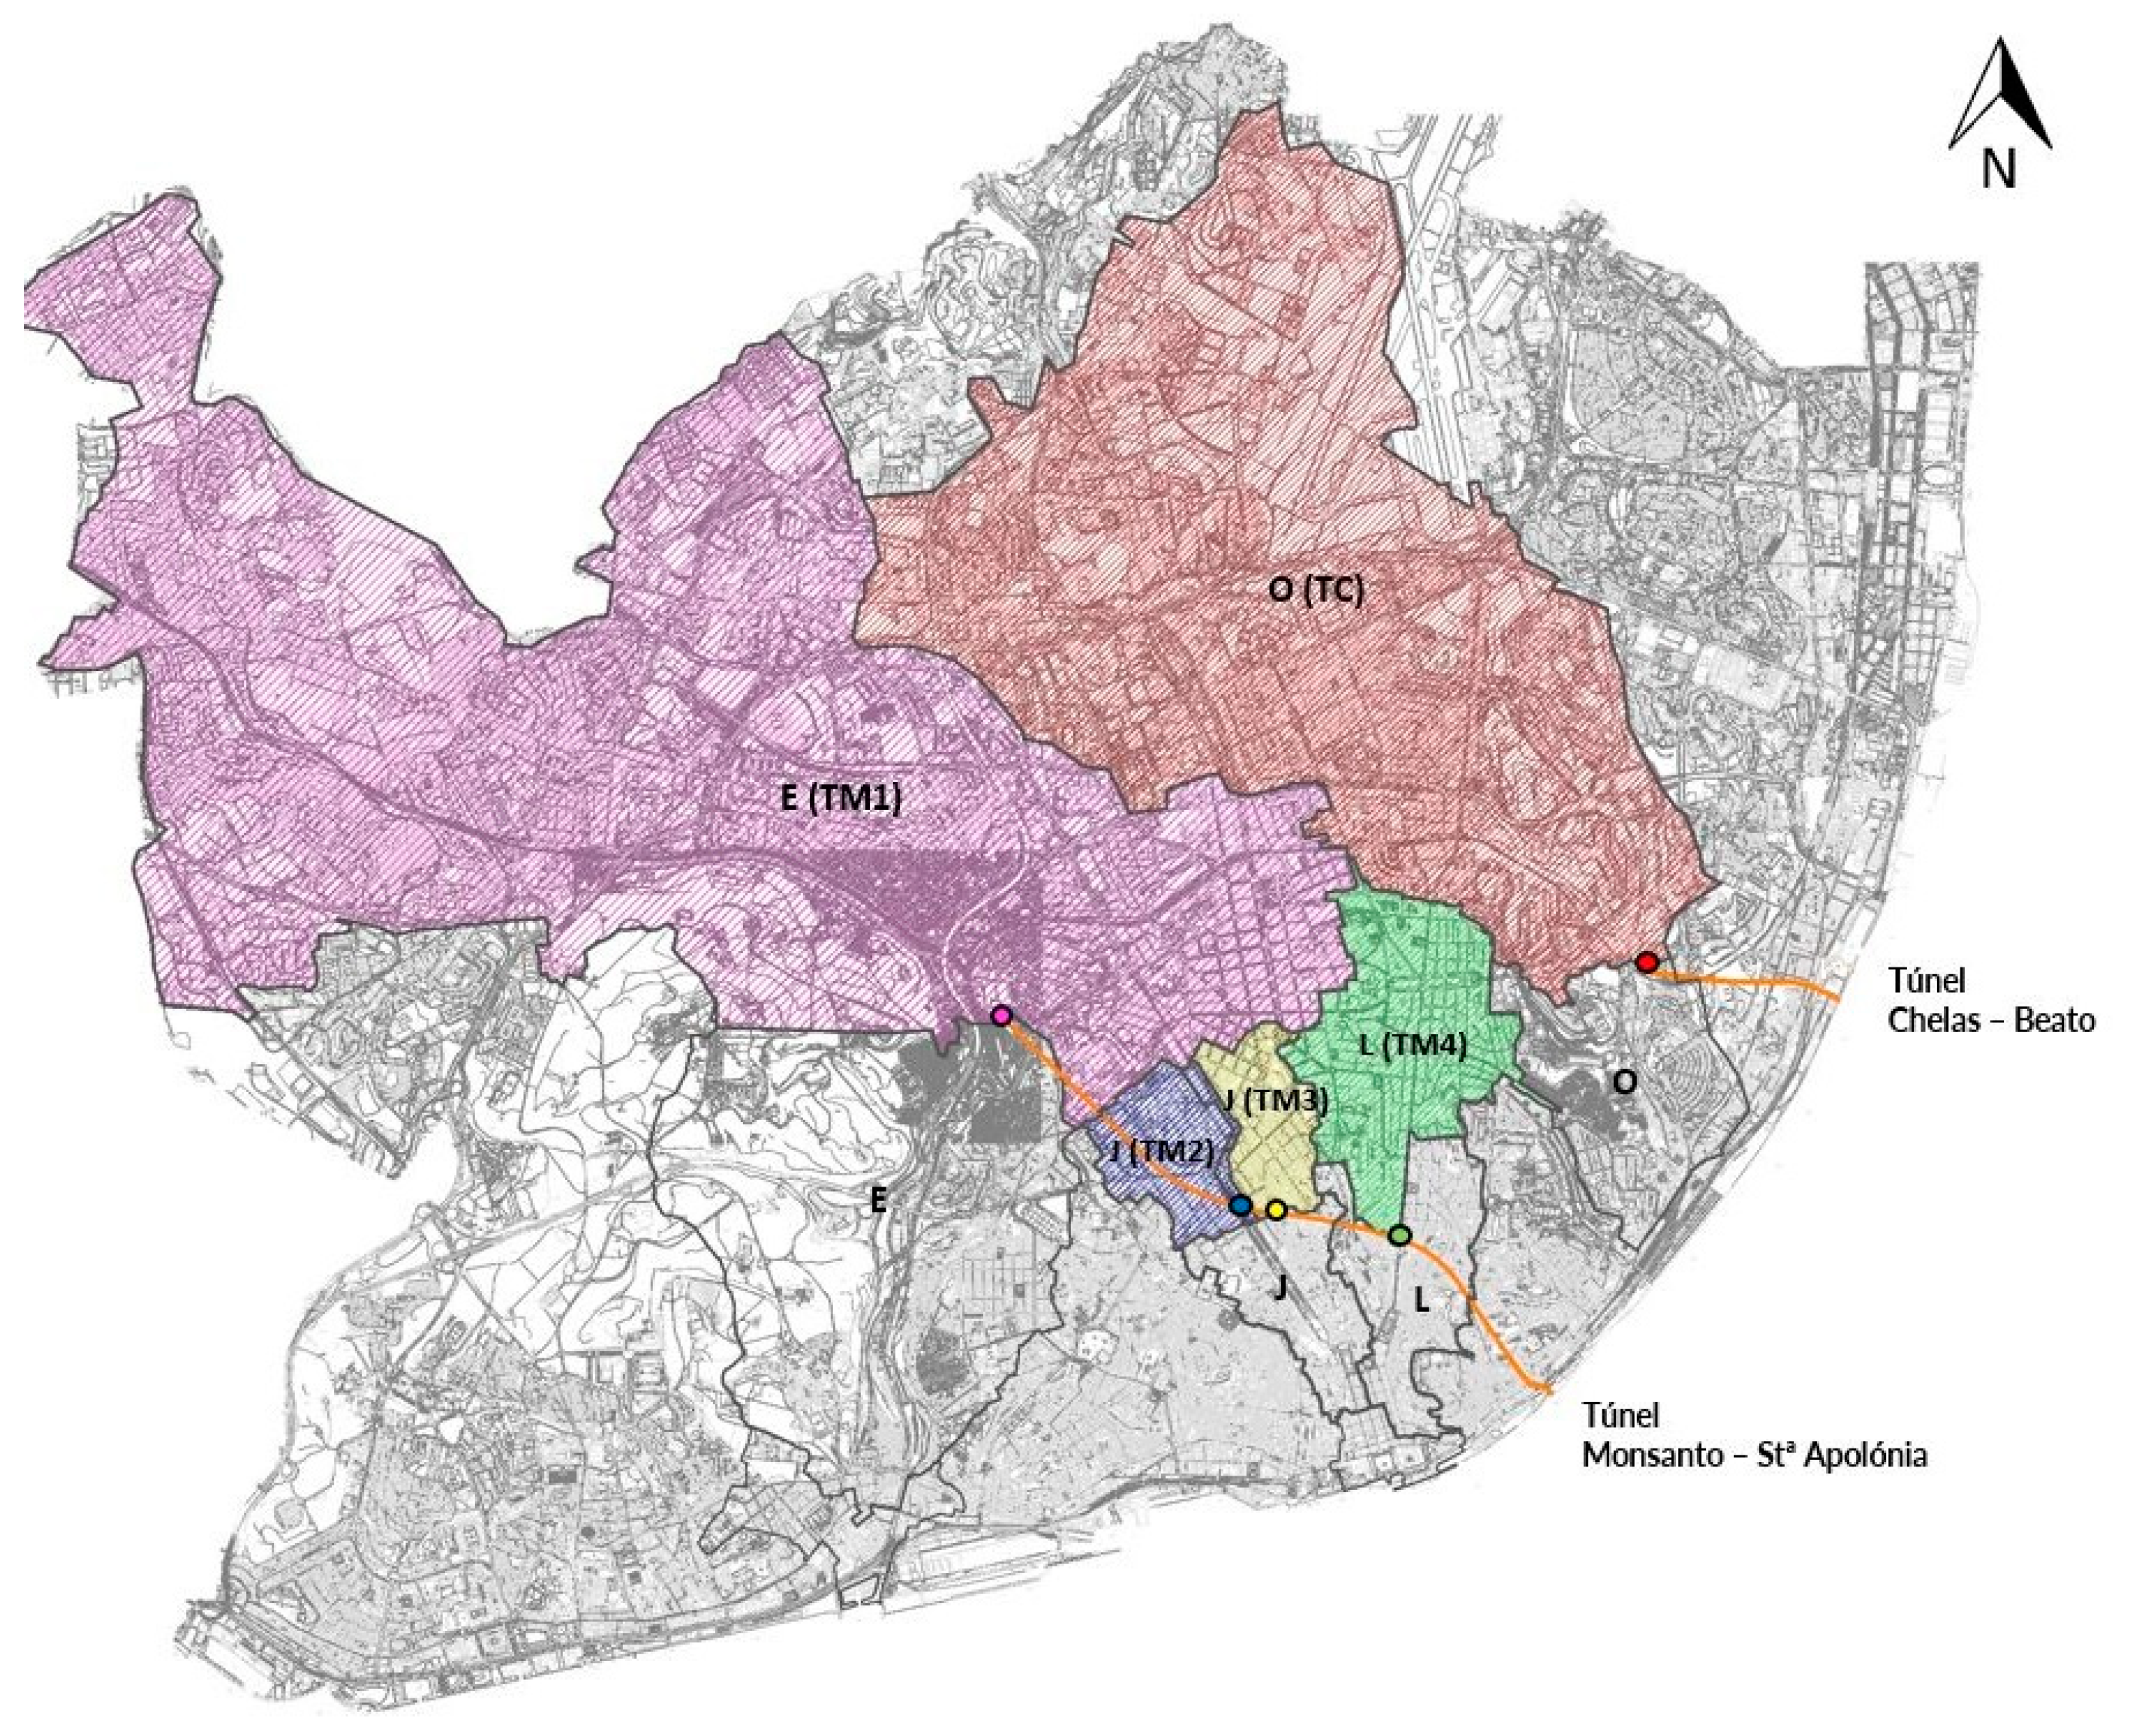
2. Lisbon City Overview
3. Methodology and Data
3.1. Methodology Main Steps
- (i)
- Identification of flood related hazards, risk factors and risks using the selected affected sectors as case studies, namely, electricity supply, urban mobility and wastes collection.
- (ii)
- Selection of metrics for hazards characterization and mapping.
- (iii)
- Selection of representative scenarios to characterize current and future situations.
- (iv)
- Mapping of hazards and calculation of metrics to support further work on resilience assessment using GIS.
3.2. Tools and Data to Support Risk Identification
3.3. Selection of Metrics for Hazards Characterization and Mapping
3.4. Selection of Representative Scenarios
3.5. Mapping of Hazards and Data for Calculation of Global Metrics for Resilience Assessment
4. Results and Discussion
4.1. Preliminary Interdependencies Matrix
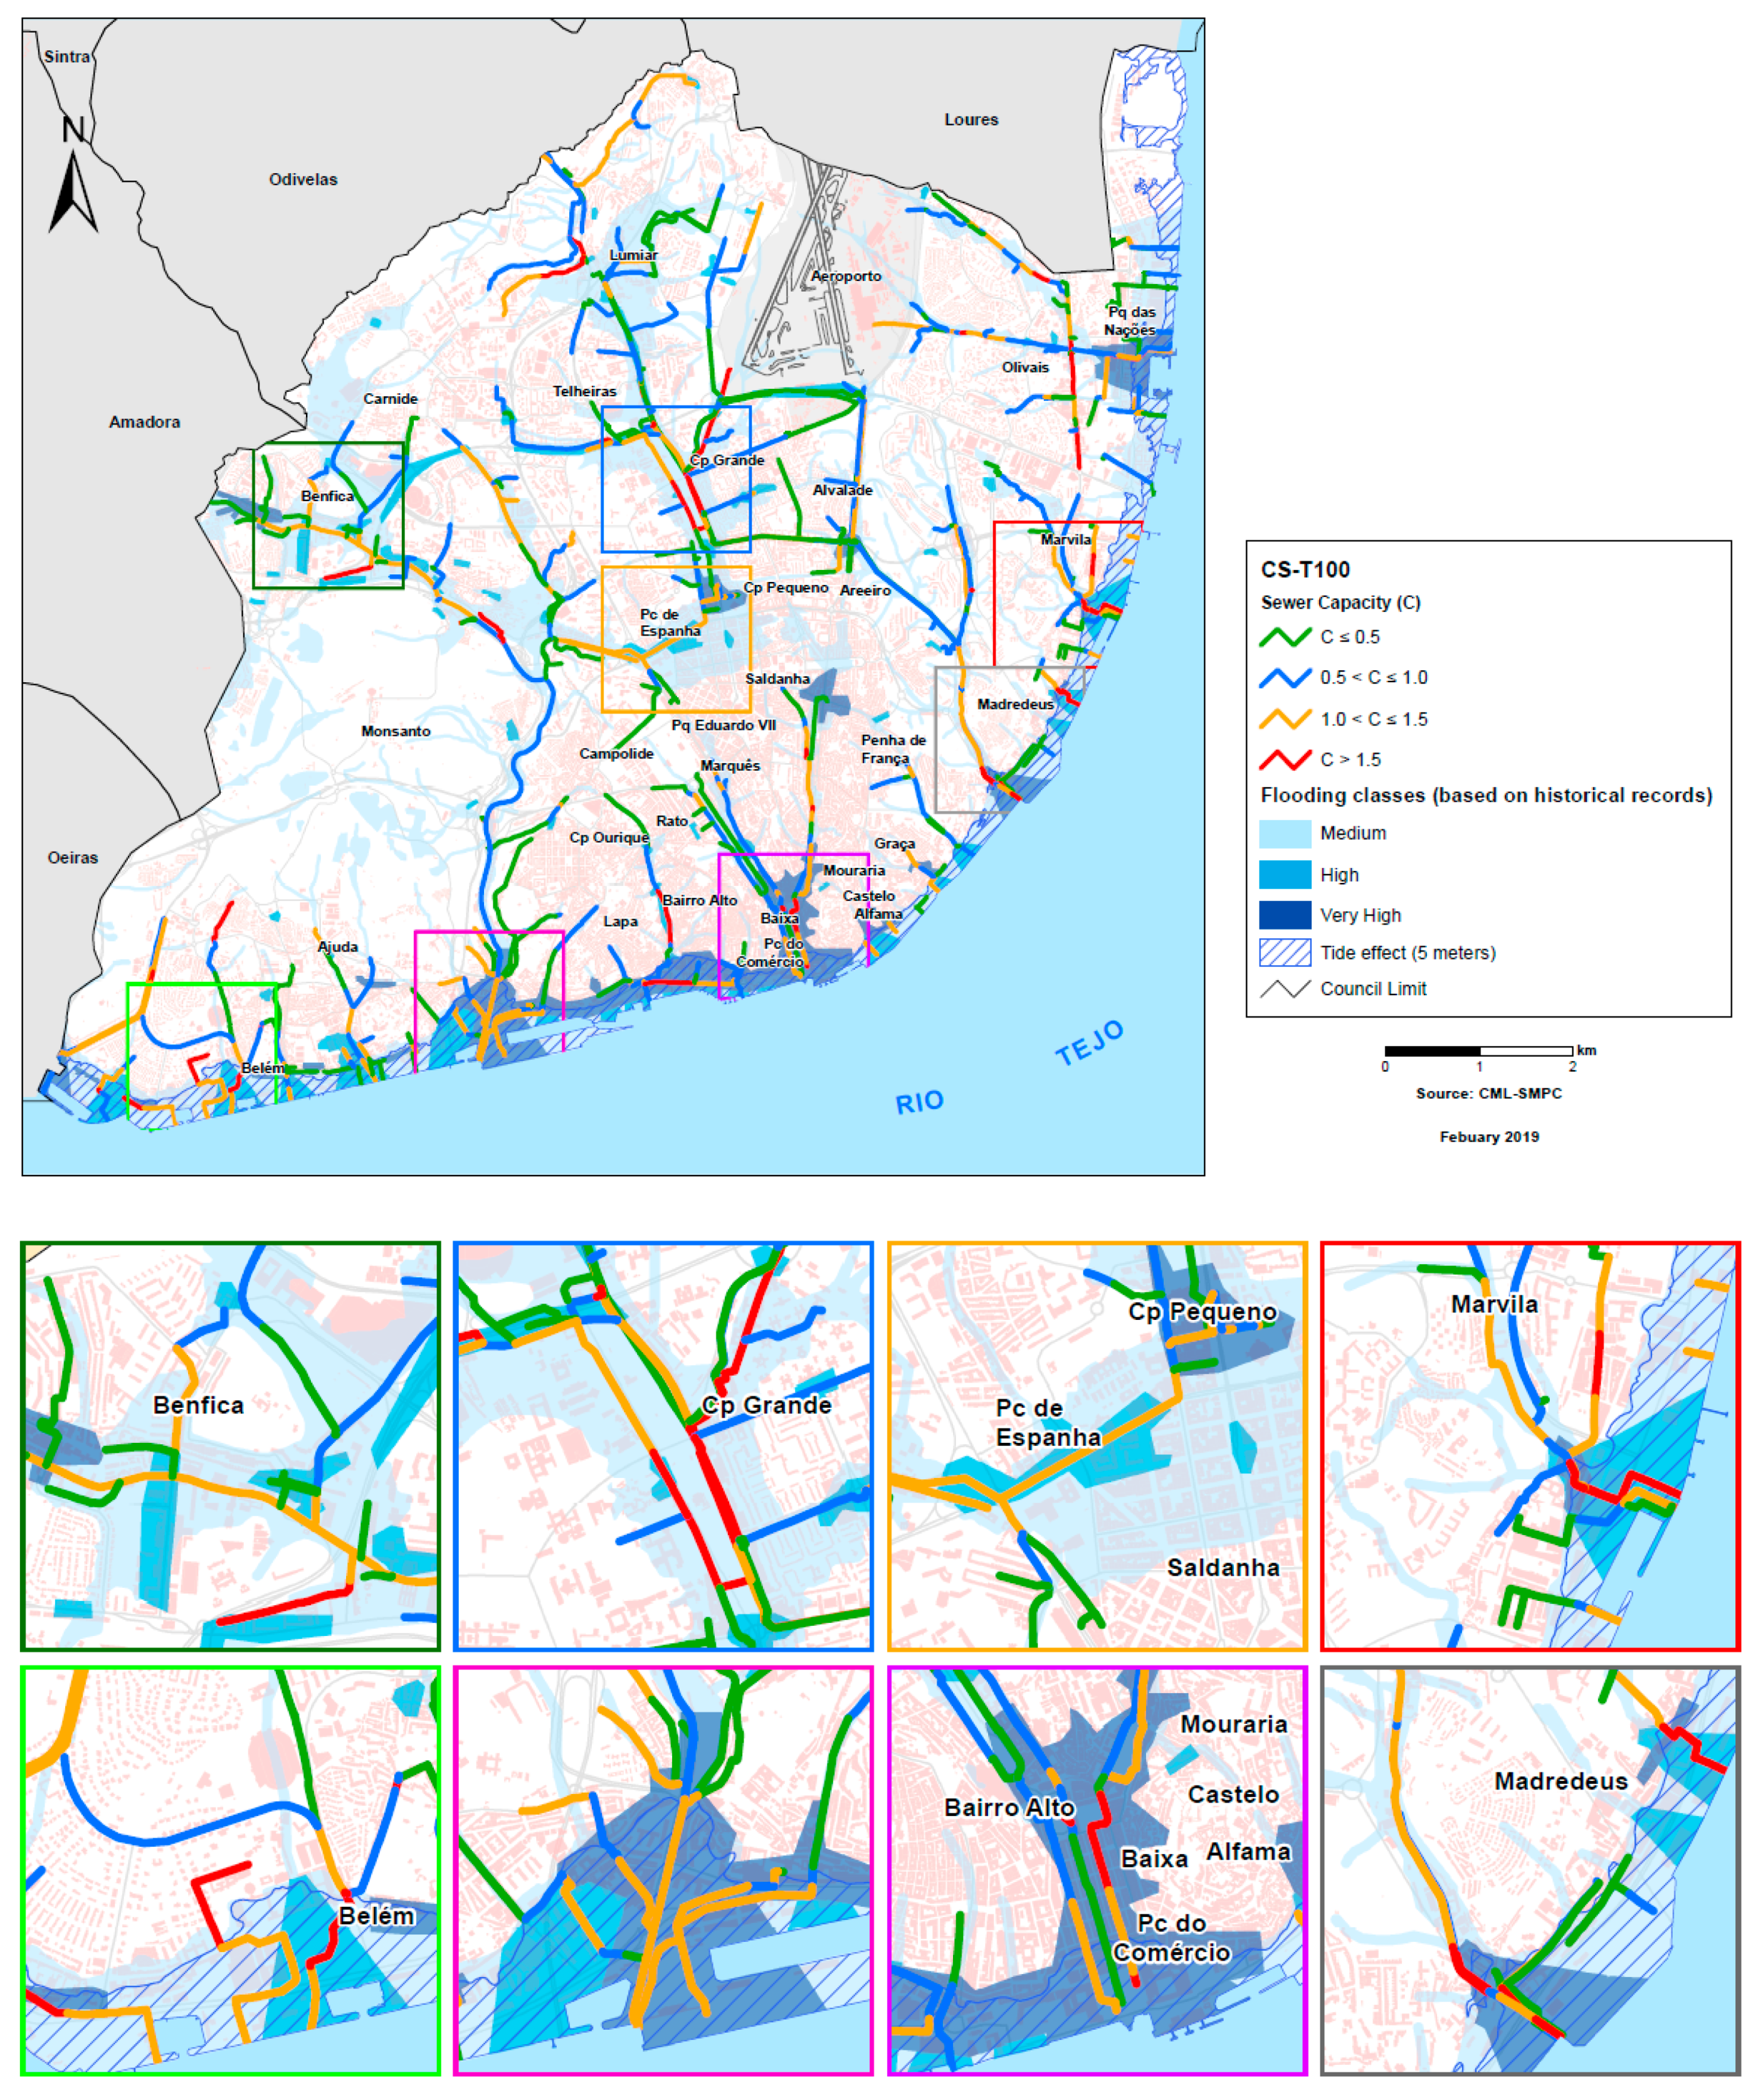
4.2. Main Results for Processing of Flooding Historical Records and Comparison with CS Simulation Results
4.3. Main Results for Current Situation and Business as Usual with Climate Change
4.4. Main Results for Selected Adaptation Strategies and Climate Change Scenarios
5. Final Remarks
Author Contributions
Funding
Acknowledgments
Conflicts of Interest
References
- UN. Transforming Our World: The 2030 Agenda for Sustainable Development. A/RES/70/1 United Nations. 2015. Available online: https://sustainabledevelopment.un.org/content/documents/2125203020Agenda20for20Sustainable20Development20web.pdf (accessed on 10 January 2020).
- Rogers, C.D.F. Engineering future liveable, resilient, sustainable cities using foresight. Proc. Inst. Civ. Eng. Civ. Eng. 2018, 171, 3–9. [Google Scholar] [CrossRef]
- Elmqvist, T.; Andersson, E.; Frantzeskaki, N.; McPhearson, T.; Olsson, P.; Gaffney, O.; Folke, C. Sustainability and resilience for transformation in the urban century. Nat. Sustain. 2019, 2, 267–273. [Google Scholar] [CrossRef]
- IPCC. Global Warming of 1.5 °C. Summary for Policymakers; Intergovernmental Panel on Climate Change: Geneva, Switzerland, 2018. [Google Scholar]
- WEF. The Global Risks Report 2019, 14th ed.; World Economic Forum: Geneva, Switzerland, 2019. [Google Scholar]
- UN-Habitat City Resilience Profiling Programme. Guide to the City Resilience Profiling Tool. United Nations Human Settlements Programme (UN-Habitat). 2018. Available online: http://urbanresiliencehub.org/wp-content/uploads/2018/07/CRPT-Guide-18.07-Pages.pdf (accessed on 24 September 2018).
- IPCC. 5th Assessment Report; Intergovernmental Panel on Climate Change: Geneva, Switzerland, 2014. [Google Scholar]
- Kachali, H.; Storsjö, I.; Haavisto, I.; Kovács, G. Inter-sectoral preparedness and mitigation for networked risks and cascading effects. Int. J. Disaster Risk Reduct. 2018, 30, 281–291. [Google Scholar] [CrossRef]
- Serre, D.; Heinzlef, C. Assessing and mapping urban resilience to floods with respect to cascading effects through critical infrastructure networks. Int. J. Disaster Risk Reduct. 2018, 30, 235–243. [Google Scholar] [CrossRef]
- Velasco, M.; Russo, B.; Martínez, M.; Malgrat, P.; Monjo, R.; Djordjevic, S.; Fontanals, I.; Vela, S.; Cardoso, M.A.; Buskute, A. The RESCCUE Project: RESilience to cope with Climate Change in Urban arEas–a multisectorial approach focusing on water–The RESCCUE Project. Water 2018, 10, 1356. [Google Scholar] [CrossRef]
- Pearson, J.; Punzo, G.; Mayfield, M.; Brighty, G.; Parsons, A.; Collins, P.; Jeavons, S.; Tagg, A. Flood resilience: consolidating knowledge between and within critical infrastructure sectors. Environ. Syst. Decis. 2018, 38, 318–329. [Google Scholar] [CrossRef]
- Burns, P.; Hope, D.; Roorda, J. Managing infrastructure for the next generation. Autom. Constr. 1999, 8, 689–703. [Google Scholar] [CrossRef]
- Pregnolato, M.; Ford, A.; Glenis, V.; Wilkinson, S.; Dawson, R. Impact of Climate Change on Disruption to Urban Transport Networks from Pluvial Flooding. J. Infrastruct. Syst. 2017, 23, 1–13. [Google Scholar] [CrossRef]
- Otto, A.; Kellerman, P.; Thieken, A.H.; Costa, M.M.; Carmona, M.; Bubeck, P. Risk reduction partnerships in railway transport infrastructure in an alpine environment. Int. J. Disaster Risk Reduct. 2019, 33, 385–397. [Google Scholar] [CrossRef]
- Martínez, E.; Gómez, M.; Russo, B.; Djordjevic, S. A new experiments-based methodology to define the stability threshold for any vehicle exposed to flooding. Urban Water J. 2017, 14, 930–939. [Google Scholar] [CrossRef]
- Martínez, E.; Russo, B.; Gómez, M.; Plumed, A. An approach to the modeling of stability of waste containers during urban flooding. J. Flood Risk Manag. 2020, 13, 1–18. [Google Scholar] [CrossRef]
- Hammond, M.J.; Chen, A.S.; Djordjević, S.; Butler DMark, O. Urban flood impact assessment: A state-of-the-art review. Urban Water J. 2015, 12, 14–29. [Google Scholar] [CrossRef]
- Rosenzweig, B.R.; McPhillips, L.; Chang, H.; Cheng, C.; Welty, C.; Matsler, M.; Iwaniec, D.; Davidson, C.I. Pluvial flood risk and opportunities for resilience. Wires Water 2018, 5, 1–18. [Google Scholar] [CrossRef]
- Evans, B.; Chen, A.; Djordjevic, S.; Webber, J.; Almeida, M.C.; Morais, M.; Telhado, M.J.; Silva, I.; Duarte, N.; Martínez-Gomariz, E.; et al. Impact Assessments of Multiple Hazards in Case Study Areas with Adaptation Strategies; RESCCUE Project: Barcelona, Spain, 2020. [Google Scholar]
- INE. Censos 2011 Resultados Definitivos–Portugal. In Census 2011 Definitive Results; National Statistics Institute: Lisbon, Portugal, 2012. [Google Scholar]
- CML. The economy of Lisbon in numbers 2014 (A economia de Lisboa em números 2014). Available online: http://observatorio-lisboa.eapn.pt/ficheiro/Lisboa_em_numeros_2014_final_01.pdf (accessed on 20 April 2017).
- Telhado, M.J.; Baltazar, S.; Fernandes, F.; Cardoso, M.A.; Almeida, M.C.; Vieira, P.V. Lisbon Municipality Contribution to the Demonstration of the WCSP, RIDB, RRDB, GIS Applications for Risk Assessment in Lisbon; PREPARED project: Nieuwegein, The Netherlands, 2014. [Google Scholar]
- The Rockfeller Foundation. Cities Taking Action. How the 100RC Network is Building Urban Resilience. 2017. Available online: http://100resilientcities.org/wp-content/uploads/2017/07/WEB_170720_Summit-report_100rc-1.pdf (accessed on 1 February 2020).
- Silva, M.M.; Costa, J.P. Urban Flood Adaptation through Public Space Retrofits: The Case of Lisbon (Portugal). Sustainability 2017, 9, 816. [Google Scholar] [CrossRef]
- Turner, S.F.; Cardinal, L.B.; Burton, R.M. Research Design for Mixed Methods: A Triangulation-based Framework and Roadmap. Organ. Res. Methods 2017, 20, 243–267. [Google Scholar] [CrossRef]
- Jick, T.D. Mixing qualitative and quantitative methods: triangulation in action. Adm. Sci. Quartely 1979, 24, 602–611. [Google Scholar] [CrossRef]
- Duffy, M.E. Methodological triangulation: A vehicle for merging quantitative and qualitative research methods. J. Nurs. Scholarsh. 1987, 19, 130–133. [Google Scholar] [CrossRef] [PubMed]
- Russo, B. (Ed.) Multi-Hazards Assessment Related to Water Cycle Extreme Events for Current Scenario; RESCCUE Project: Barcelona, Spain, 2018. [Google Scholar]
- Russo, B. (Ed.) Multi-hazards Assessment Related to Water Cycle Extreme Events for Future Scenarios (Business as Usual); RESCCUE Project: Barcelona, Spain, 2019. [Google Scholar]
- Huber, W. Storm Water Management Model (SWMM) Bibliography. Athens, Ga: Environmental Research Laboratory, Office of Research and Development; U.S. Environmental Protection Agency: Washington, DC, USA, 1985.
- VAW. BASEMENT–Basic Simulation Environment for Computation of Environmental Flow and Natural Hazard Simulation. Version 2.8; ETH Zurich: Zurich, Switzerland, 2018. [Google Scholar]
- Hosseini, S.; Barker, K.; Ramirez-Marquez, J.E. A review of definitions and measures of system resilience. Reliab. Eng. Syst. Saf. 2016, 145, 47–61. [Google Scholar] [CrossRef]
- Defra, E.A. Flood Risk Assessment Guidance for New Development. Phase 2 Framework and Guidance for Assessing and Managing Flood Risk for New Development–Full Documentation and Tools; Defra and Environment Agency: London, UK, 2005. [Google Scholar]
- Antunes, C.; Catita, C.; Rocha, C. Estudo de Avaliação da Sobrelevação da Maré–Determinação da Cartografia de Inundação e Vulnerabilidade da Área Ribeirinha de Lisboa Afetada Pela Sobrelevação da Maré Como Consequência da Futura Subida do Nível Médio do Mar. Relatório Técnico EMAAC; Câmara Municipal de Lisboa: Lisbon, Portugal, 2017; 46p. [Google Scholar]
- Paradinas, C.; Monjo, R.; Gaitán, E.; Carravilla, C.; Torres, L. Projection of Climate Extremes in the City of Lisbon: A Comparative Study; RESCCUE Project: Barcelona, Spain, 2019. [Google Scholar]
- Hidra, Engidro, Bluefocus. Plano Geral de Drenagem de Lisboa 2016–2030; Câmara Municipal de Lisboa: Lisbon, Portugal, 2015. [Google Scholar]
- Hidra. Tender Documents for the Construction Works of the Drainage Tunnels and Associated Interventions in Lisbon; Câmara Municipal de Lisboa: Lisbon, Portugal, 2018. [Google Scholar]


| Area (Km2) | 85 | Economic indicators (2013) | ||
|---|---|---|---|---|
| Population (2011) (inhab.) | Residents | 547,733 | GDP (millions of euros) | 63,902 |
| Commuters balance | +378,226 | Gross value added GVA (millions of euros) | 56,154 | |
| Disabled (%) | 17.1 | GDP per capita (thousands of euros) | 22.7 | |
| Tourism (2011) | tourists/year | 2,949,579 | Apparent labour productivity (per person employed) (GVA/Employment, 2011) | 41.7 |
| tourist nights/year | 6,789,166 | |||
| Age distribution | <15 years old | 12.9% | Employment indicators, 2011 | |
| >65 years old | 23.9% | Employment (thousands of persons) | 1,385.8 | |
| Land slope | Average: 5.7° | Maximum: 81° | Employment (% country) | 29% |
| Altitude (m) | Minimum: 0 | Maximum: 217 | Water distribution service connections | ≈80,000 |
| Land use values | Consolidated urban | 90% | Wastewater infrastructures | |
| Buildings (n.) | 52,496 | Combined sewer network served area (%) | 73 | |
| Vehicles/day (2012) | 648,615 | Treatment plants | 3 | |
| Service | Stakeholders | Level of Involvement |
|---|---|---|
| Municipality * | Lisbon Municipality (CML) | High |
| Energy supply | Distribution System Operator (EDP D) | High |
| Rain and wastewater systems | CML and ADTA | High |
| Water supply | EPAL | Low |
| Public transport | CML, CARRIS, METRO | Medium |
| Communications | MEO Altice, Vodafone, NOS | Low |
| Data/model | Criteria: Metric, Scale Classes | Scenarios |
|---|---|---|
| Lisbon flooding historical records | Flooded areas: frequency, 3 classes: medium, high, very high | Current situation |
| Citywide 1D GIS based | Use of sewer transport capacity: C = Qwet/Qfull (%), 4 classes, low C ≤ 0.5, moderate 0.5 < C ≤ 1.0, high 1.0 < C ≤ 1.5, very high C > 1.5 | Current situation and climate change |
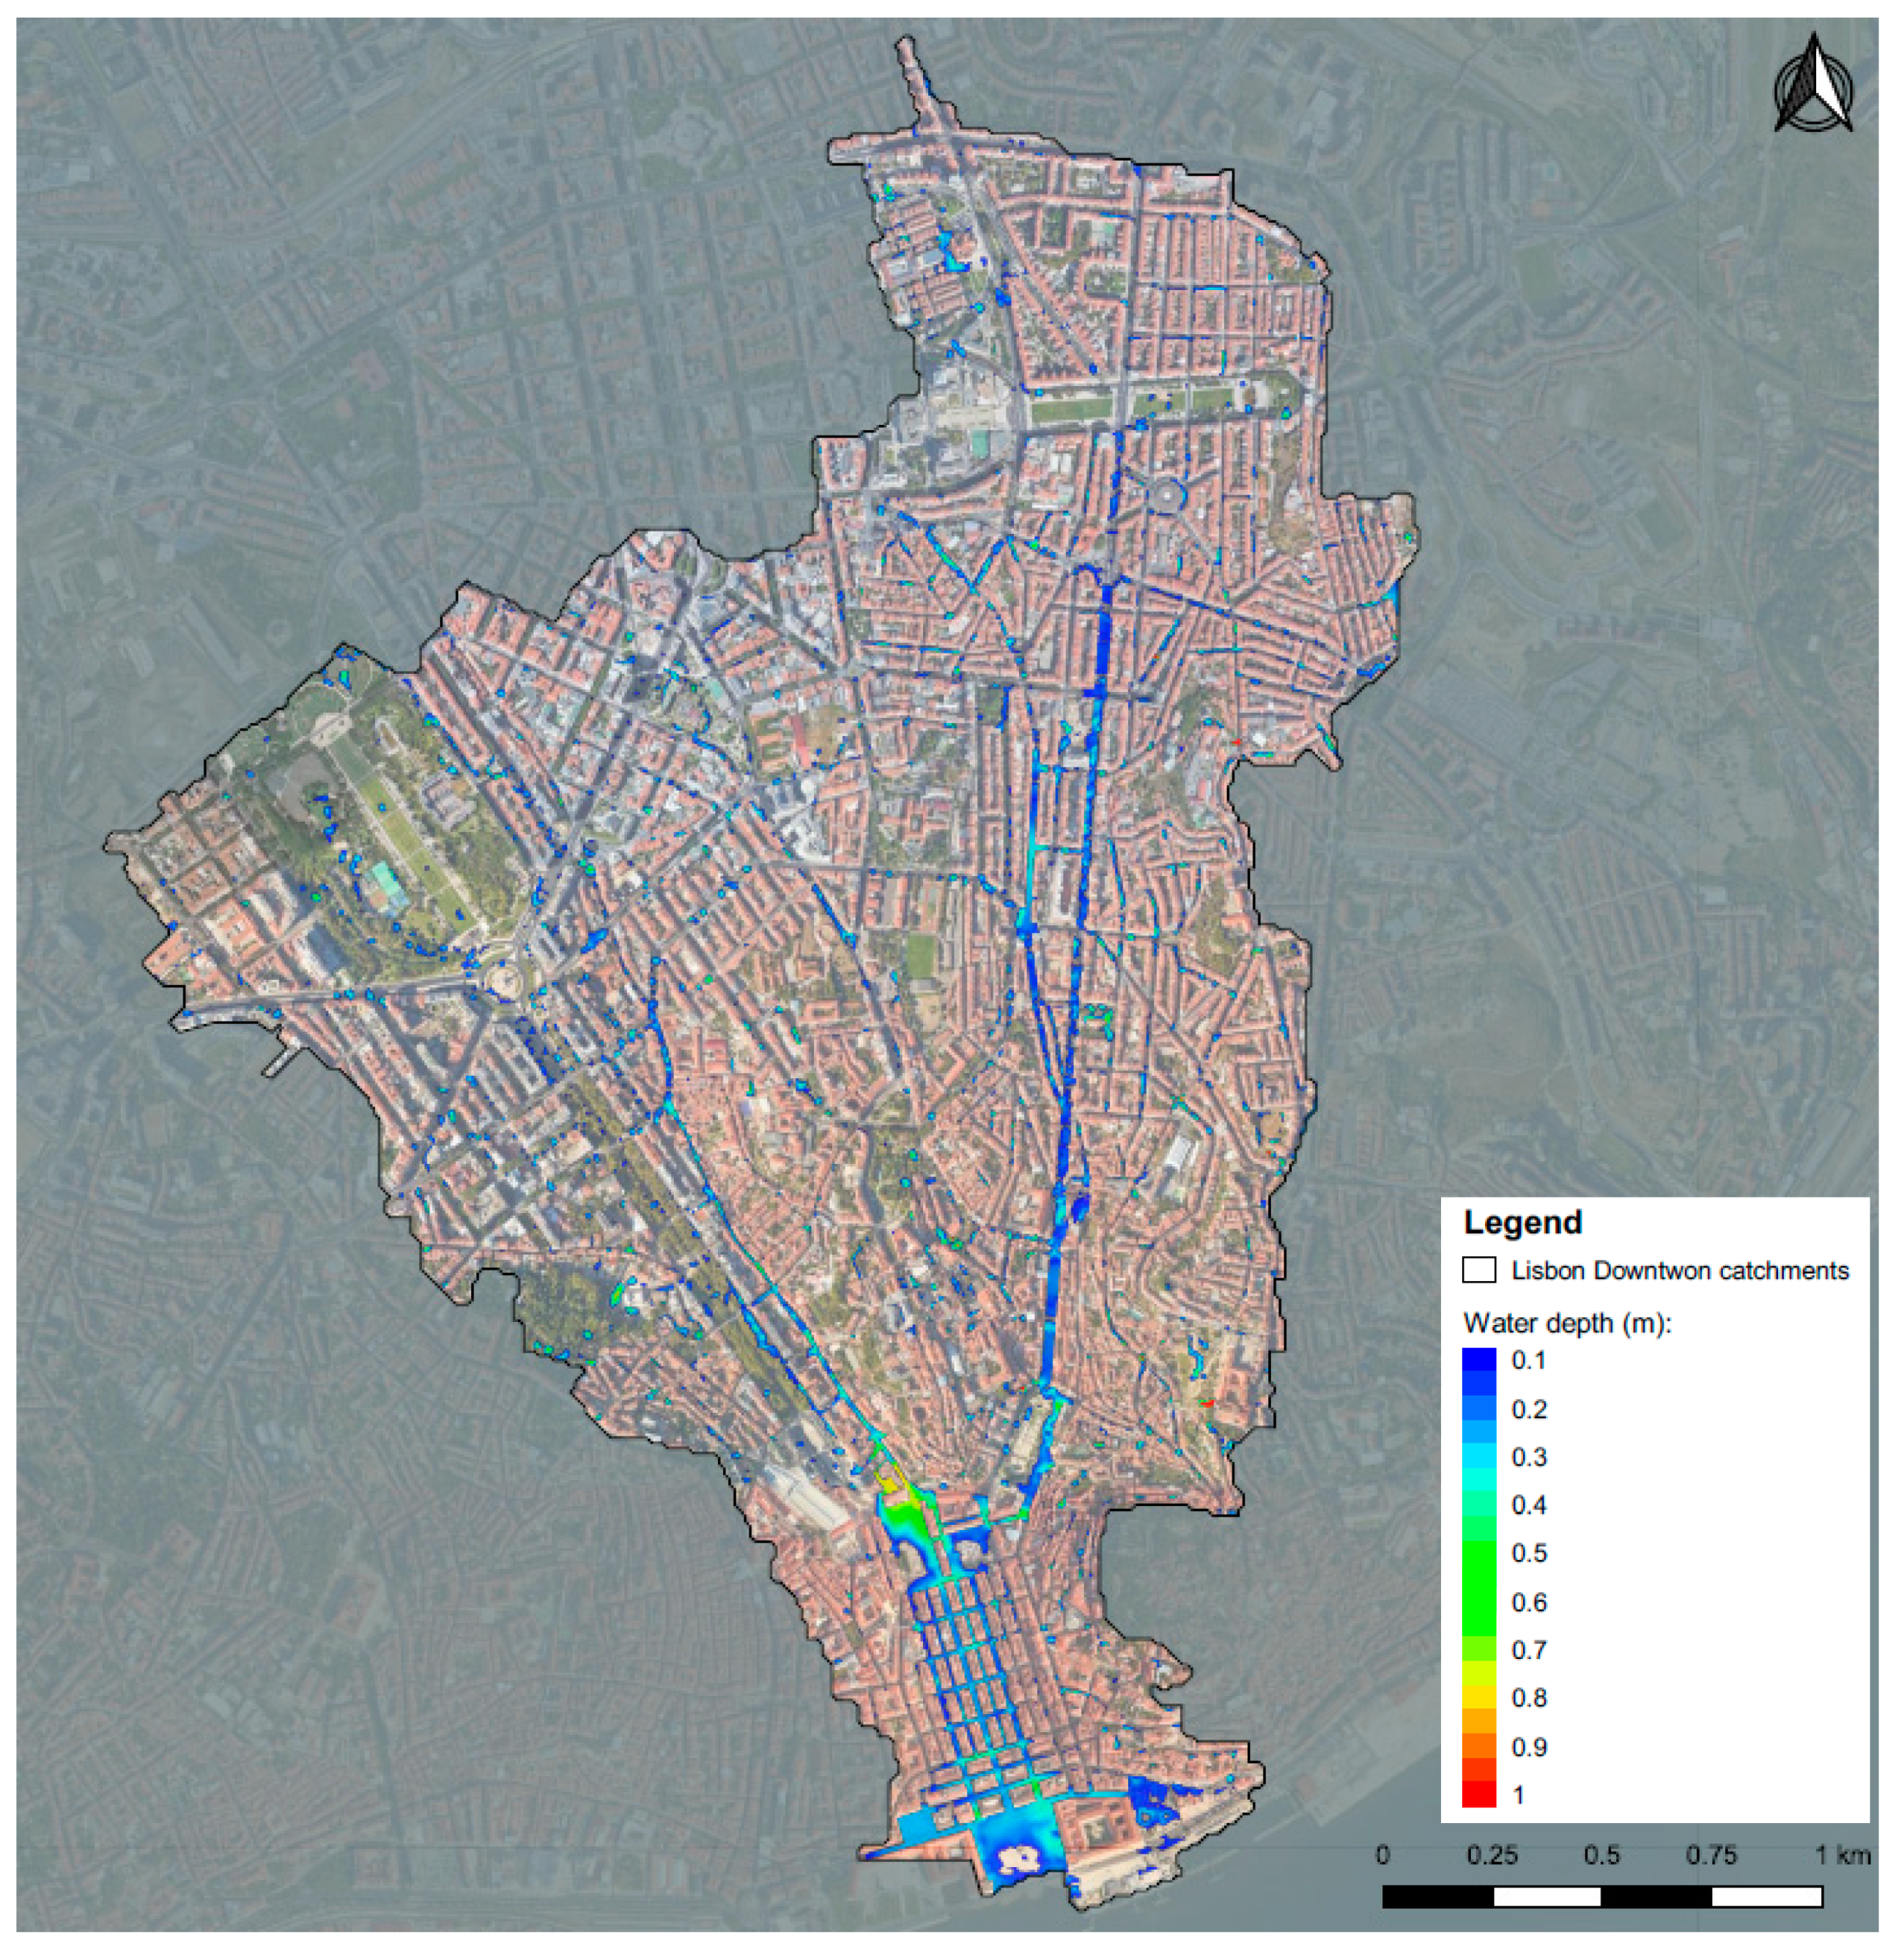
| Downtown catchments J and L 1D/2D CMSB | Water level: water depth, d(m), at critical time, 5 classes: very low d ≤ 0.2, low 0.2 < d ≤ 0.4, moderate 0.4 < d ≤ 0.6, high 0.6 < d ≤ 0.8, very high 0.8 < d ≤ 1.0 Hazard to pedestrians: Flood hazard rating HR=d ×(v+0.5)+DF (d - water depth (m), v - overland flow velocity (m/s), DF - debris factor [33], 4 classes: low HR ≤ 0.75, moderate 0.75 < HR ≤ 1.25, high 1.25 < HR ≤ 2, very high HR > 2 Hazard to vehicles: F(flow depth D, flow velocity) [15], 3 classes: low D ≤ 0.28 and ≤ 0.40, moderate D ≤ 0.28 and 0.40 < ≤ 0.55, high D > 0.28 or >0.55 | |
| Estuary water level | Area as a function of simulated water level available modelling results for the scenarios of estuary water level are from a study promoted by CML [34]. |
| SERVICE|SUBSYSTEM|Component | SERVICE OR INFRASTRUCTURE FAILURE | EXPOSURE TO | POTENTIAL DERIVED RISKS AND CASCADING EFFECTS |
|---|---|---|---|
| Energy | Electricity transport and distribution | Substations, overhead lines, underground cables | Damages, collapse, interruption of energy supply | R: flood W: storms | Water supply: failures of electromechanical and control systems; Urban drainage: failures of pumping and control systems; WWTP: failures of electromechanical elements and control systems; Street lights: failures regarding function and control systems; Communications: cellular towers, central offices, other critical communications for monitoring and controlling electricity delivery |
| Communications | Network and nodes (operational centres) | Damage, collapse, interruption of communications | R: runoff, flood W: storms | Effects on several urban services depending on communications |
| Urban water cycle | Wastewater and rainwater systems | Sewer systems | Limited conveyance capacity, high street runoff (level and velocity), CSOs | SLR; R: Rain: high inflows, runoff | Mobility (road, rail): disturbance and interruptions, flooding of underground infrastructures (metro, train, parking, tunnels); Wastes: overturn, dragging and damage on wastes; Electrical energy: damage to equipment and lines Other: pedestrian ways, parking lots, playgrounds, CSOs |
| Urban water cycle | Wastewater and rainwater systems | Pump stations | Electrical or mechanical failures due to flooding (pumping capacity and CSO), salinity degrading components, excessive inflows | SLR; R: high inflows, runoff, flood | Mobility: traffic disturbances and interruptions; flooding of underground infrastructures (metro, train, parking, tunnels) Receiving water pollution; Recreational uses affected |
| Urban water cycle | Wastewater and rainwater systems | WWTP | Lower treatment efficiency and CSO due to excessive flows and dilution; lower treatment efficiency and corrosion of infrastructures by salt water intrusion | SLR; R: high inflows, flood | Receiving water pollution Recreational uses affected |
| Wastes collection | Cleaning, containers | Container damage, displacement and overturn | R: runoff, flood W: storms | Urban drainage: obstruction of components and surface flows Mobility (road, rail): traffic disturbances and interruptions |
| Mobility | Roadways | Main roads, secondary roads, tunnels | Runoff, flooding and windstorm: disruption, interruption of mobility functions | SLR; R: runoff, flood; W: storms | Several urban services can be affected by cascading effects if maintenance or repair tasks are required during failures |
| Mobility | Roadways |Traffic signs | Wind can generate failures of traffic control systems | R: runoff, flood; W: storms | |
| Mobility | Railways |Surface and underground | Flood and storms can cause interruption of public and private transportation | SLR; R: runoff, flood; W: storms | |
| Mobility | Railways | Traffic signs | Wind can generate failures of traffic control systems | R: runoff, flood W: storms | |
| Green and blue infrastructure and urban equipment | Several components (trees, street lighting) | Collapse of trees Damage and collapse | R: runoff, flood W: storms | Urban drainage: obstruction of components (e.g., inlets, sewers); Electrical energy: damage to equipment and lines; Mobility (road, rail): traffic disturbances and interruptions; Communication: damage to equipment and lines |
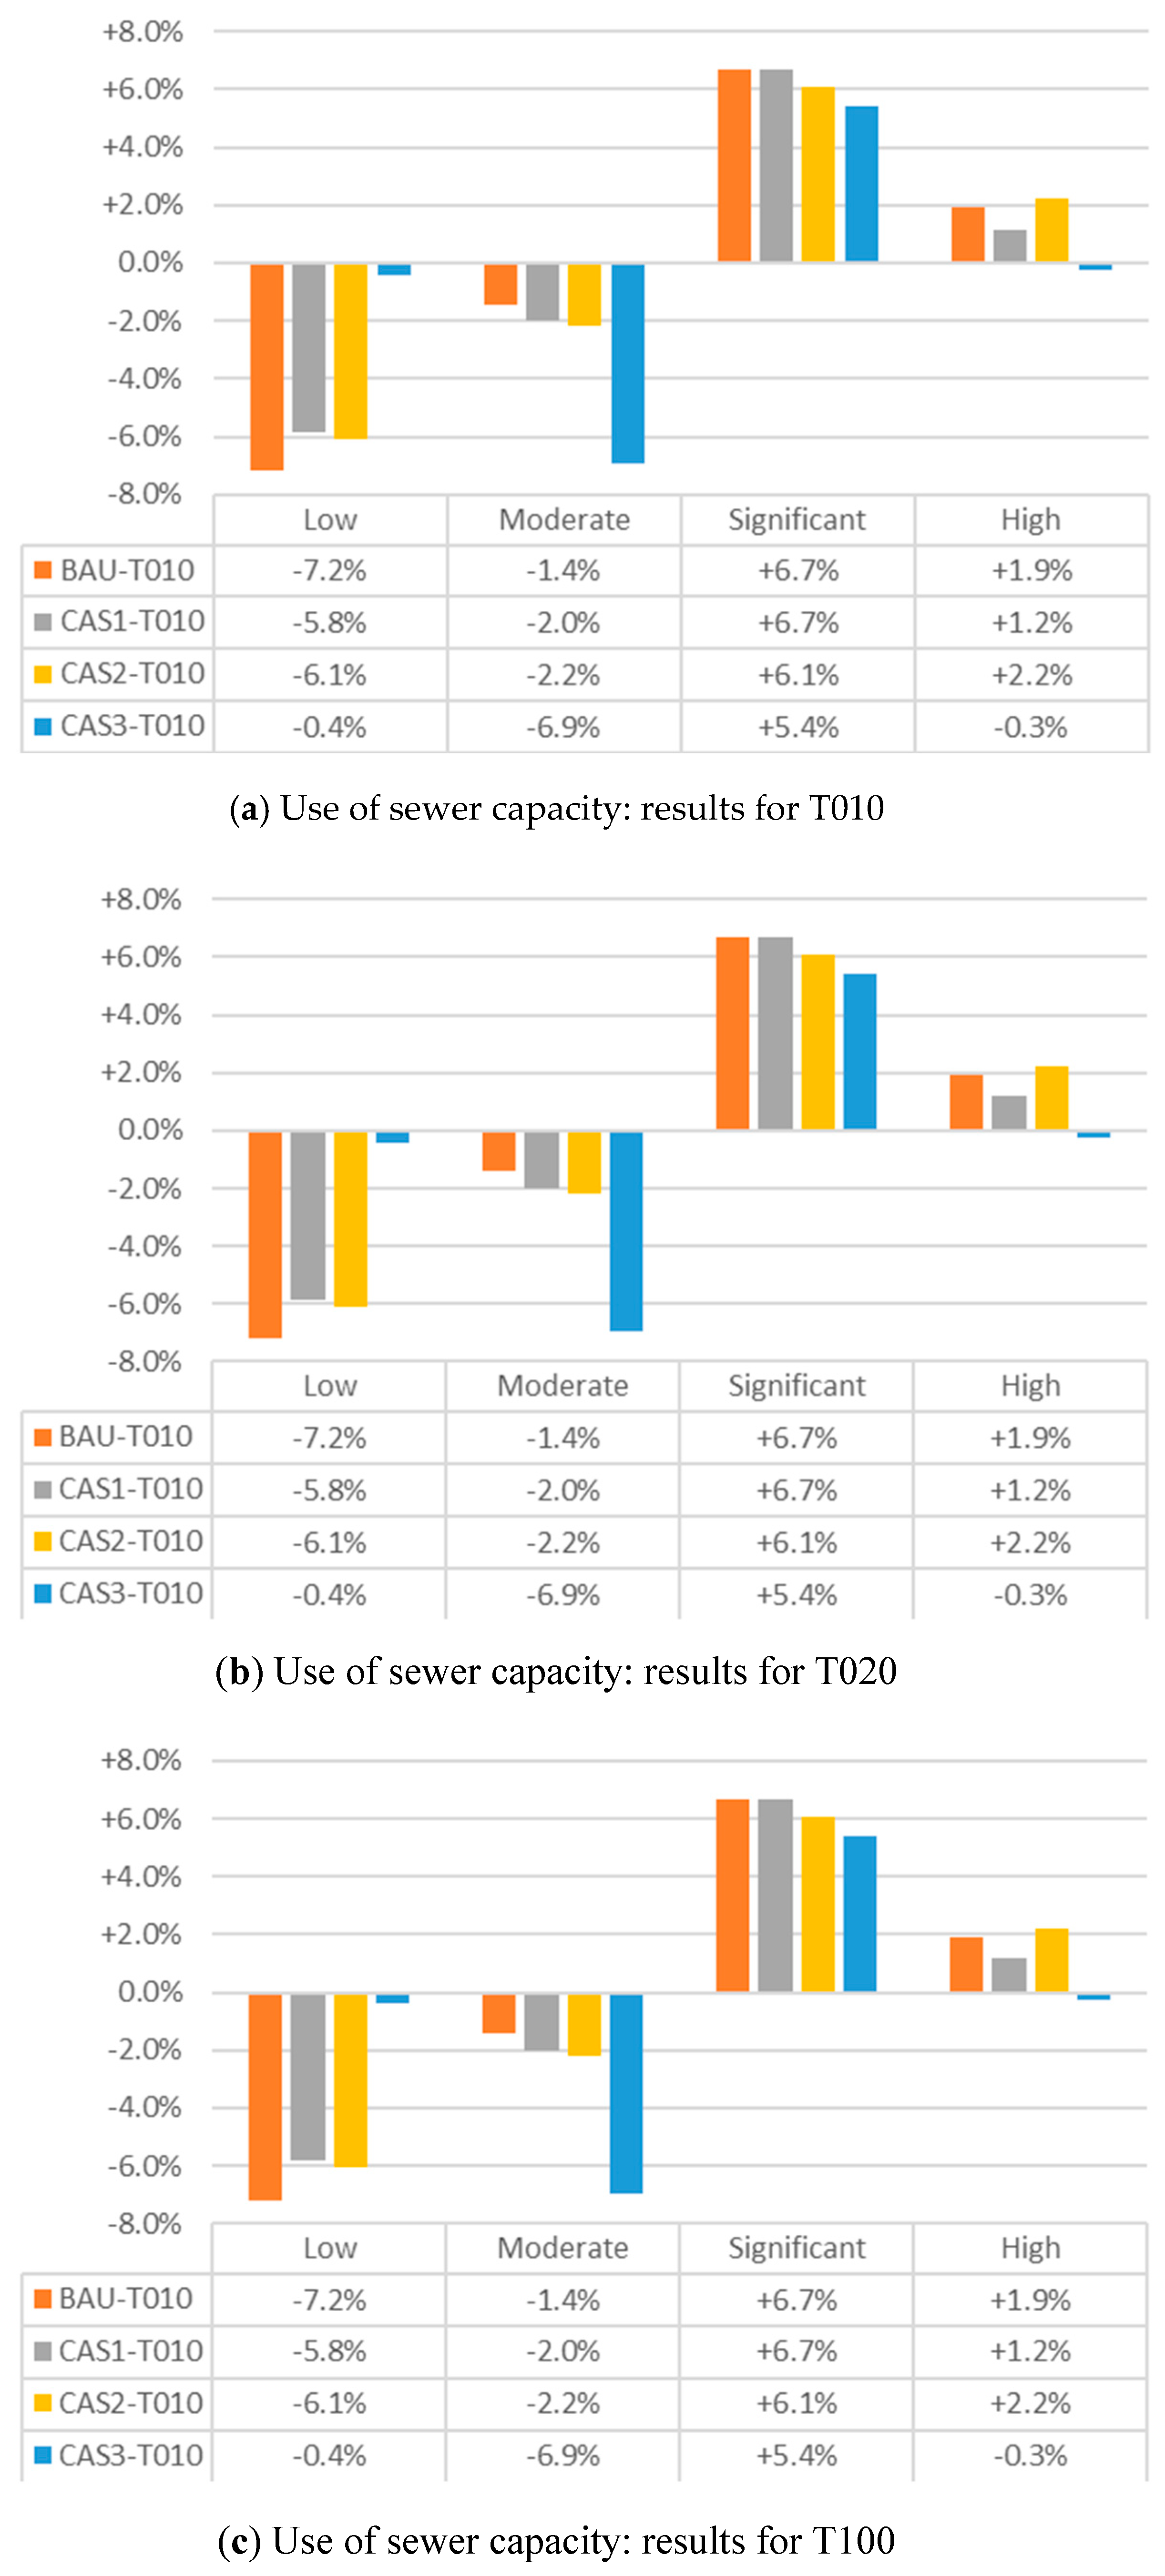
| C Range | Use of Sewer Capacity | Return Period (%(BAU-CS)) | ||
|---|---|---|---|---|
| T010 | T020 | T100 | ||
| C ≤ 0.5 | Low | −7.2 | −9.2 | −8.3 |
| 0.5 < C ≤ 1.0 | Moderate | −1.4 | +1.4 | −1.7 |
| 1.0 < C ≤ 1.5 | High | +6.7 | +5.1 | +0.8 |
| C > 1.5 | Very high | +1.9 | +2.7 | +9.2 |
| Flood Water Level (m) | Hazard Class | T010 (%)* | T020 (%)* | T100 (%)* | ∆ (BAU-CS) (%) | |||||
|---|---|---|---|---|---|---|---|---|---|---|
| CS | BAU | CS | BAU | CS | BAU | T010 | T020 | T100 | ||
| d ≤ 0.2 | Very low | 96.5 | 96.0 | 95.8 | 95.4 | 93.1 | 92.4 | −0.57 | −0.47 | −0.67 |
| 0.2 < d ≤ 0.4 | Low | 2.9 | 3.4 | 3.5 | 3.9 | 5.9 | 6.4 | +0.53 | +0.40 | +0.58 |
| 0.4 < d ≤ 0.6 | Moderate | 0.5 | 0.5 | 0.5 | 0.6 | 0.8 | 0.8 | +0.07 | +0.05 | +0.06 |
| 0.6 < d ≤ 0.8 | High | 0.1 | 0.1 | 0.1 | 0.1 | 0.2 | 0.3 | −0.02 | +0.02 | +0.03 |
| 0.8 < d ≤ 1.0 | Very high | 0.0 | 0.0 | 0.0 | 0.0 | 0.0 | 0.0 | −0.01 | +0.00 | +0.00 |
| HR Range | Hazard Class | T010 (%)* | T020 (%)* | T100 (%)* | ∆ (BAU-CS) (%) | |||||
|---|---|---|---|---|---|---|---|---|---|---|
| CS | BAU | CS | BAU | CS | BAU | T010 | T020 | T100 | ||
| HR ≤ 0.75 | Low | 79.3 | 75.2 | 76.0 | 72.5 | 67.3 | 64.4 | −4.0 | −3.6 | −2.9 |
| 0.75 < HR ≤ 1.25 | Moderate | 18.5 | 21.7 | 20.9 | 23.5 | 26.9 | 28.9 | +3.2 | +2.6 | +2.0 |
| 1.25 < HR ≤ 2 | Significant | 2.2 | 3.0 | 3.0 | 3.9 | 5.7 | 6.6 | +0.8 | +0.9 | +0.8 |
| HR > 2 | Extreme | 0.1 | 0.1 | 0.1 | 0.1 | 0.2 | 0.2 | 0.0 | 0.0 | 0.0 |
| Class Range | Hazard Class | T010 (%)* | T020 (%)* | T100 (%)* | ∆ (BAU-CS) (%) | |||||
|---|---|---|---|---|---|---|---|---|---|---|
| CS | BAU | CS | BAU | CS | BAU | T010 | T020 | T100 | ||
| D ≤ 0.28 and ≤ 0.40 | Low | 80.3 | 76.9 | 77.8 | 74.9 | 70.5 | 68.3 | −3.4 | −2.9 | −2.3 |
| D ≤ 0.28 and 0.40 < ≤ 0.55 | Moderate | 13.2 | 15.2 | 14.5 | 16.0 | 18.1 | 18.9 | +1.9 | +1.5 | +0.8 |
| D > 0.28 or >0.55 | High | 6.5 | 7.9 | 7.7 | 9.0 | 11.3 | 12.8 | +1.4 | +1.4 | +1.5 |
| C Range | Use of Sewer Capacity | Return Period (%(CAS3-CS)) | ||
|---|---|---|---|---|
| T010 | T020 | T100 | ||
| C ≤ 0.5 | Low | +36.0 | +41.3 | +38.3 |
| 0.5 < C ≤ 1.0 | Moderate | −36.6 | −35.1 | −30.6 |
| 1.0 < C ≤ 1.5 | High | +1.4 | −4.4 | −8.3 |
| C > 1.5 | Very high | −0.8 | −1.8 | +0.6 |
© 2020 by the authors. Licensee MDPI, Basel, Switzerland. This article is an open access article distributed under the terms and conditions of the Creative Commons Attribution (CC BY) license (http://creativecommons.org/licenses/by/4.0/).
Share and Cite
Almeida, M.d.C.; Telhado, M.J.; Morais, M.; Barreiro, J.; Lopes, R. Urban Resilience to Flooding: Triangulation of Methods for Hazard Identification in Urban Areas. Sustainability 2020, 12, 2227. https://doi.org/10.3390/su12062227
Almeida MdC, Telhado MJ, Morais M, Barreiro J, Lopes R. Urban Resilience to Flooding: Triangulation of Methods for Hazard Identification in Urban Areas. Sustainability. 2020; 12(6):2227. https://doi.org/10.3390/su12062227
Chicago/Turabian StyleAlmeida, Maria do Céu, Maria João Telhado, Marco Morais, João Barreiro, and Ruth Lopes. 2020. "Urban Resilience to Flooding: Triangulation of Methods for Hazard Identification in Urban Areas" Sustainability 12, no. 6: 2227. https://doi.org/10.3390/su12062227
APA StyleAlmeida, M. d. C., Telhado, M. J., Morais, M., Barreiro, J., & Lopes, R. (2020). Urban Resilience to Flooding: Triangulation of Methods for Hazard Identification in Urban Areas. Sustainability, 12(6), 2227. https://doi.org/10.3390/su12062227