Abstract
This study presents an analysis of the allocation of greenhouse gas emissions based on a comparison of criteria for 66 countries and fairness-based indicators. The academic literature contains very few broad multi-country studies. The large sample of countries included in our analysis has allowed us to make a more comprehensive, holistic comparison than other studies with similar characteristics. The United States and China must make the greatest effort to fight climate change worldwide, but all countries have a responsibility, including some that are not usually analyzed in this type of research.
1. Introduction
Burning fossil fuels has led to an increase in greenhouse gas (GHG) emissions and ushered in a global energy transition [1,2,3,4], which in turn has sparked a profound and growing interest in reducing these emissions due to their devastating effect on our planet. Emission reduction has been the focus of the discussions held in the latest climate summits, particularly the 2015 Paris Summit. The global agreement on climate change signed in Paris in 2015 set out a framework for limiting global warming to well below 2 °C compared to pre-industrial levels [5,6]. The response to this problem was in turn formalized in each state’s commitments to reduce GHG emissions in the framework of the Paris Agreement [7,8]. However, these commitments are incongruous on two levels: first, they are voluntary [9,10]; second, if all were met, the average temperature would increase by 3 °C [10,11]. In Conference of the Parties, COP25, in Madrid, progress was checked against outstanding rules, an assessment of loss and damage was made as per the Warsaw International Mechanism, and commitments were made toward financial support and capacity building [12], but the decision to withdraw from the Paris accord limited the summit success.
Finding the best way to share global emission reductions among all countries is a top priority for researchers [13], given the need to limit the increase in GHG emissions in carbon budgets [14]. In fact, as detailed in the following section, the allocation of emission quotas has received considerable attention in the academic literature, but the scope of the analysis has so far been restricted to limited groups of companies and countries.
Therefore, in this article we propose various GHG emission allocation schemes for a broader sample of countries based on different criteria. The aim of the study is to determine and compare the responsibility of each country studied using various fairness-based indicators. Several authors have compared burden sharing rules at the country level. However, these studies have used other objectives, other allocation methods, or other samples (see, for example, [15,16,17,18,19]). This article, inspired by the proposals presented by Ringius et al. [20] and Winkler et al. [21], is the first of its kind to study the allocation of responsibilities in a larger group of countries.
2. Brief Literature Review
Research into carbon dioxide emissions allocation and convergence is a fertile field that includes literature reviews and meta-analyses, such as Pettersson et al. [22], Zhou and Wang [23], Acar et al. [7], and Payne [24], or more recently, Duro, Giménez-Gómez, and Vilella [25]. The academic literature also includes studies that have addressed emission allocation at the company level, particularly through the game theory approach [26,27,28,29] and linear programming models such as data envelope analysis [30,31,32].
Since the 1990s, a considerable body of literature has focused on emission allocations in each country [23,33]. In this corpus, emissions have variously been allocated by zoning, to a small group of countries [20,21,34,35,36], or by limiting the research to a single country [37,38,39]. Studies on allocations in China ([40,41], for example), Chinese regions [42,43,44,45,46], Chinese cities [8], and Chinese sectors and industries [39,43] are particularly abundant. Other studies have focused on groups of countries, such as North America [44,45,46], Latin America [45], or three high-emission Asian countries—China, Japan, and South Korea (ROK)—by Ma, Cai, Ye, and Gu [47].
In the European Union (EU), since its inception in 2005, the EU Emissions Trading Scheme (EU ETS) has limited the annual aggregate emissions of carbon dioxide by allocating a certain amount of pollution permits. The available evidence [48] suggests that the EU ETS has had a robust negative impact on the carbon emissions, without strong detrimental effects in economic performance. In terms of financial performance of firms, Oestreich and Tsiakas [49] report a large and statistically significant carbon premium in stock returns. However, studies on Europe [50,51,52] and the USA [53,54] are less common, and those presenting a more global, holistic perspective, such as ours, are particularly scarce [55,56].
The academic literature includes various methods or approaches using several different allocation criteria based on two principles: efficiency, namely the economic efficiency of restricting emissions [23], and fairness, namely the fair distribution of emissions liability [20]. Each allocation criterion can be implemented using different indicators [23,37]. According to the latter authors, composite and above all simple indicators are the most common methods used. The indicator approach is almost compulsory, but “it is difficult to reach a consensus on the indicator used since the variation in the allocation results by different indicator methods is rather large” [23]. Therefore, it is probably advisable to use several indicators to enrich the comparison and strengthen the analysis.
3. Methodology and Data
The main obstacle to achieving the global energy transition lies in meeting the Paris Agreement target to reduce global GHG emissions based on the fairness principle. CO2 allocation-based methods are an appropriate conceptual tool for distributing emission of this gas [20] because they are transparent and specifiable with perfect certainty [37].
In order to estimate the capacity to mitigate climate change, we based our analysis on studies that incorporate the fairness principle and the indicator method, which is the most appropriate approach to use when applying the fairness principle [23].
The global emissions budget differs according to whether reductions, growth, or rights are allocated [21]. Since the objective of this study is to allocate reductions, we assume that global emissions will return to 1990 levels by 2050 (target year for the Paris Agreement), which is a 54% reduction. For the empirical study, we used BP’s emissions data and the World Bank’s population and Gross Domestic Product (GDP) data to allocate reductions to 66 countries, representing just over 90% of the global total, through to 2050.
3.1. Simple Indicator
Given the criteria and indicators shown in Table 1, we developed various emission distribution schemes using the formulas put forward by Ringius et al. [20] and Winkler et al. [23].

Table 1.
Selected criteria and indicators.
In the first scheme we use a simple indicator to assess the allocation of emissions between sample countries. A simple indicator can be described as a quantitative or qualitative measure derived from a series of observed facts that can provide the relative position of a country, for example, in any given area [57].
3.2. Historical Responsibility Criterion (HR)
First, we used the HR criterion between 1965 and 2016 to estimate the emission reduction quota for each country according to our global emission reduction budget. This criterion indicates that emission reduction is allocated according to the level of accumulated emissions over a period of time [23]. Ridgley [34] used several criteria, including HR (in terms of global and per capita emissions), to distribute the burden of emissions among 11 world regions (Africa, China, Latin America, the Middle East/North Africa, Eastern and Western OECD (Organization for Economic Co-operation and Development), the United States, South Asia, Southeast Asia, and the former USSR). Their results indicate that the greatest burden of responsibility lies with the United States. Later, Winkler et al. [16] applied this and other criteria to six developing countries (China, India, Brazil, South Africa, Argentina, and Nigeria), and concluded that in absolute terms the largest emissions reduction quota should be allocated to China.
In our case, the participation of country i in the distribution of emissions reduction (Xi) is calculated using the following formula:
3.3. Ability to Pay Criterion
Secondly, we use the ability to pay criterion (according to this criterion, the emission reduction allocation is linked to the country’s wealth [34]) The GDP of country i as a percentage of total world GDP in 2016 is a simple indicator to mitigate climate change. According to this criterion, the richest countries would have to shoulder a greater burden than poor countries when it comes to reducing emissions [23]. On a regional scale, Rose and Zhang [37] and Zhou et al. [38] used this criterion to assign CO2 emission permits to different regions of the United States and China, respectively. The same criterion was also used in the aforementioned studies by Ridgley [34] and Winkler et al. [21] and yielded the same results after applying the HR criteria: in the first case, the largest reductions correspond to the United States, and in the second to China. In this document, the participation of country i in the distribution of emissions reduction (Xi) is calculated using the following formula:
3.4. Composite Indicator
In the first schemes we use a composite indicator to distribute emissions reductions among a sample of countries. The distribution of emission reductions has been made on the basis of the countries available in the BP yearbook [59], as it includes information from a broad set of regions and countries, as well as emissions data after 1965. A synthetic or composite indicator is an aggregate index of simple indicators and is obtained by weighting these indicators according to their relative importance in the index. Thus, while a simple indicator refers to a single dimension or magnitude, a composite indicator refers to several multidimensional concepts [57].
In this study, we used the composite indicator method based on one of the proposals made by Ringius et al. [20], who used three specific formulas each with a group of indicators, to allocate GHG emission reductions to some OECD member countries (except Australia, Austria, Belgium, Canada, Denmark, Finland, France, Germany, Greece, Ireland, Italy, Japan, Luxembourg, The Netherlands, New Zealand, Norway, Portugal, Spain, Sweden, Switzerland, Turkey, the United Kingdom, and the United States). Using Formula 2 , they found that the greatest reduction in emissions as a percentage of the total reduction of all OECD countries would correspond to the United States. In this document, the participation of country i in the distribution of emissions reduction (Xi) is calculated from an index based on this formula. Thus, two general GHG emission reduction allocation schemes are analyzed using the composite indicator method.
The first scheme (Formula 1) obeys the four criteria mentioned in Table 1: egalitarianism (population), ability to pay (GDP), current responsibility (current emissions), and historical responsibility (emissions accumulated between 1965 and 2016). In our case, Xi is the percentage participation of country i in the distribution of emissions reduction. Ei is the CO2 emissions of country i as a percentage of the world total in 2016. EHi is the cumulative CO2 emissions of country i as a percentage of the world total between 1965 and 2016. Pi is the population of country i as a percentage of the world total in 2016, and Gi is the US$ GDP of country i as a percentage of the world total. In this study, a single aggregation method has been used: each indicator is weighted at 0.25 and considered to be equally relevant.
The second scheme (Equation (2) obeys three criteria: egalitarianism (population), ability to pay (GDP), and current responsibility (current emissions). As in the previous case, Xi is the percentage participation of country i in the distribution of emissions reduction. Ei is the CO2 emissions of country i as a percentage of the world total in 2016. Pi is the population of country i as a percentage of the world total in 2016. Gi is the US$ GDP of country i as a percentage of the world total. The sum of weights (w) is equal to 1. In this study, a single aggregation method has been used: each indicator is weighted at 0.33 and considered to be equally relevant.
4. Results
Table 2 summarizes the emission allocation for the 66 countries studied according to the Formulas 1 and 2. Both formulas coincide in the top 10 countries that must further reduce their emissions: five of them belong to the OECD (the United States, Japan, Germany, United Kingdom, and France), one of them is a candidate for accession (Russia), and the rest are acceding countries with which the organization maintains enhanced cooperation (for example, China and India).
Table 2.
Reductions allocated according to Formula 1 and 2.
Table 3 summarizes the allocation of emissions according to the HR criteria (Formula 3) for the five main CO2 emitters and the country groupings considered in this study. Based on our global reduction budget, the results confirm that the burden falls on OECD countries. This organization accounts for 53% of emissions that must be reduced; therefore, the greatest responsibility, according to the HR criterion, lies with developed countries. Furthermore, the countries made up of the G20 (G8 nations plus other recently industrialized countries), account for more than 81% of the total. On an individual level, the United States heads the list.
Table 3.
Reductions allocated according to the HR criterion * (Formula 3).
Taking only the ability to pay criterion into account (Formula 4), the OECD accounts for 62.76% of emissions that must be reduced to achieve the Paris target. In fact, the reduction quota allocated to the top five countries, which includes many OECD counties accounts for 53.93% of the world total (Table 4). Taking this criterion into account, it is observed that the difference between the US and China is greater than in comparison with the others. The high percentages of North America and the G-20 countries stand out.
Table 4.
Reductions allocated according to the ability to pay criterion * (Formula 4).
The results of the four emission reduction allocation formulas for the United States and China, as the two main emitters, and the groupings of countries analyzed in this document are summarized in Table 5. A comparison between the HR and ability to pay criteria shows that the list is headed to a large extent by the same countries, although the distribution of emission reduction quotas differs: under the second (ability to pay) criterion, the most developed countries (OECD) have to make more significant reductions. It is important to note that, under the criteria of historical responsibility and ability to pay (with a similar participation in the distribution), the United States has to make the greatest commitment to mitigating climate change. It also ranks second according to the fairness criterion measured by the composite indicator approach. China has to make a greater effort, taking into account the HR criterion as well as India and the Russian Federation. On the other hand, Japan is more sensitive to the ability to pay criterion. This highlights that the non-OECD countries have a relatively high reduction in the criterion of historical responsibility that shows their greater participation in global cumulative emissions. Meanwhile, OECD countries have a greater goal of reducing the ability to pay criterion.
Table 5.
Allocated emission reductions according to the different calculations (% of the total).
5. Discussion and Conclusions
The global agreement on climate changes signed in Paris in 2015 set out a framework for limiting global warming to well below 2 °C compared to pre-industrial levels. However, emissions have only increased since then [61] (Figure 1).
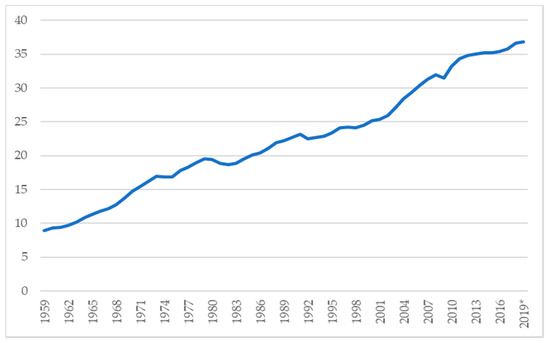
Figure 1.
Evolution of global CO2 emissions from the use of fossil fuels and industrial activity. (Gt CO2). Source: Global Carbon Project [61]. * Forecast.
Our study confirms the findings of earlier authors. Under the criteria of historical responsibility and ability to pay, the United States has to make the greatest commitment to mitigating climate change [34]. Nevertheless, this leadership position is not echoed in its contribution to climate change literature, particularly compared to the number of Chinese studies published. Nevertheless, our analysis differs from previous studies [20,21] insofar as it includes a broader sample of countries.
Our analysis of the responsibility of developed countries shows that according to the HR and ability to pay criteria, the OECD accounts for the highest percentage of emissions that need to be reduced to meet the Paris objective. This has important implications for the OECD as a whole, as it needs to make significant reductions in CO2 emissions to mitigate the problem of climate change. However, using the composite indicator, our results show that the greatest responsibility lies with non-OECD member states. Obviously, these results could change if a different weight is assigned to each indicator.
Although our results show the importance of distributing emissions reduction quotas, they also demonstrate the need for caution when distributing reductions according to composite indicators, and probably explain why many experts choose to use simple indicators.
Our analysis suggests that the United States and China are the greatest contaminators and have the greatest responsibility when it comes to reducing emissions, a situation that highlights the major impact that the United States’ decision to abandon the Paris agreement in 2017 will have on climate change in the future. The United States might not reduce its emissions at all, and its decision to stop contributing to the Global Environment Fund will most likely hinder progress in meeting the Paris Agreement targets [62].
It is imperative that fossil fuel producing countries modify their business models to combat climate change, and all countries in general should realize that increasing the global share of clean energy in the energy consumption structure and restructuring industries would be an effective policy. Theoretical claim problem (a claim problem is a particular distribution problem in which the amount to be distributed, endowment E, is not enough to cover the agents’ claims on it [20]) approaches are impracticable due to the absence of a supra-national authority—a social planner—with the capacity to propose a fair and egalitarian system for allocating resources based on different socially accepted principles [25], and allocation agreements that impose convergence would result in significant international income transfers. It is important to underline the responsibility of each government in achieving higher targets. In fact, the Paris Agreement places special value on voluntary contributions and national circumstances, but some studies have reported that the voluntary mitigation targets expressed in the Intended Nationally Determined Contributions are insufficient [55,63], which further enhances the need of discussing emission allowances of the countries. Our article informs policymakers of more countries about the importance of carbon emissions reduction in order to tackle environmental challenges and Nationally Determined Contributions. In particular for the European countries, the European Commission intends to propose, as part of the Green Deal, to increase the EU’s 2030 target for greenhouse gas emission reductions to at least −50% and towards −55% compared to 1990 levels, in a responsible way. This should be an example to follow by the rest of the countries analyzed in our study
Companies that possess resources of extraordinary importance need to be involved in reducing emissions. They can play a major role in halting global GHG emissions and introducing international global warming policies [64,65]. Taking the Paris goal seriously also involves limiting the use of fossil resources and leaving a percentage of fossil fuel reserves underground [66], since the emissions generated by these fuels are associated with an increase in CO2 levels and global warming. Finally, let us not forget that the Paris Agreement also calls on all states, particularly the principle consumers, to reduce their consumption of fossil resources.
Our study is somewhat exploratory, given the large sample of countries studied, and this is its main limitation. However, it is the first analysis of such a large sample of countries, including some that are not usually analyzed in this type of research (i.e., Slovakia or Portugal). This broader comparison and our new results make an interesting contribution to the study of carbon emission quotas. A clear example of this is India, which in our study is always one of the top-ranking countries in the different indexes used but is not very often analyzed in the academic literature [67]. This also opens new avenues of research and encourages researchers to broaden their geographical approach to obtain more global, comprehensive results.
Author Contributions
L.R.-F., A.B.F.C. and M.B.-C. contributed equally to this work. All authors wrote, reviewed, and commented on the manuscript. All authors have read and agreed to the published version of the manuscript.
Funding
This research received no external funding.
Conflicts of Interest
The authors declare no conflict of interest.
Appendix A. Country Groups Used in the Document
- North America: US (excluding Puerto Rico), Canada, and Mexico.
- South and Central America: Caribbean (including Puerto Rico) and Central and South America.
- Europe: European members of the OECD plus Albania, Bosnia-Herzegovina, Bulgaria, Croatia, Cyprus, Former Yugoslav Republic of Macedonia, Gibraltar, Malta, Romania, Serbia and Montenegro, Slovenia.
- Former Soviet Union: Armenia, Azerbaijan, Belarus, Estonia, Georgia, Kazakhstan, Kyrgyzstan, Latvia, Lithuania, Moldova, Russian Federation, Tajikistan, Turkmenistan, Ukraine, Uzbekistan.
- Europe and Eurasia: All countries listed above under the headings Europe and the Former Soviet Union.
- Asia Pacific: Brunei, Cambodia, China, China Hong Kong SAR*, Indonesia, Japan, Laos, Malaysia, Mongolia, North Korea, Philippines, Singapore, South Asia (Afghanistan, Bangladesh, India, Myanmar, Nepal, Pakistan, and Sri Lanka), South Korea, Taiwan, Thailand, Vietnam, Australia, New Zealand, Papua New Guinea, and Oceania, *Special Administrative Region.
- G8: France, Germany, Italy, Japan, the United Kingdom, the United States, Canada and Russia.
- G20: France, Germany, Italy, Japan, United Kingdom, United States, Canada, Russia, Argentina, Australia, Brazil, China, India, Indonesia, Mexico, Saudi Arabia, South Africa, Republic of Korea, Turkey and the European Union.
- EU: Austria, Belgium, Bulgaria, Croatia, Republic of Cyprus, Czech Republic, Denmark, Estonia, Finland, France, Germany, Greece, Hungary, Ireland, Italy, Latvia, Lithuania, Luxembourg, Malta, The Netherlands, Poland, Portugal, Romania, Slovakia, Slovenia, Spain, and Sweden.
- OECD: Austria, Belgium, Czech Republic, Denmark, Estonia, Finland, France, Germany, Greece, Hungary, Iceland, Ireland, Italy, Latvia, Lithuania, Luxembourg, The Netherlands, Norway, Poland, Portugal, Slovak Republic, Slovenia, Spain, Sweden, Switzerland, and the United Kingdom.
Appendix B. Reductions Allocated According to the Criteria HR Criterion and Reductions Allocated According to the Ability to Pay Criterion
Table A1.
Reductions Allocated According to the Criteria HR Criterion.
Table A1.
Reductions Allocated According to the Criteria HR Criterion.
| Countries/Areas | (Mt CO2) | (% of Total) |
|---|---|---|
| US | 2765.83 | 23.37% |
| China | 1835.75 | 15.51% |
| Russian Federation | 565.24 | 4.78% |
| Japan | 553.86 | 4.68% |
| Germany | 496.61 | 4.20% |
| India | 419.36 | 3.54% |
| United Kingdom | 313.58 | 2.65% |
| Canada | 244.23 | 2.06% |
| France | 209.07 | 1.77% |
| Italy | 202.06 | 1.71% |
| Poland | 187.87 | 1.59% |
| South Korea | 161.58 | 1.37% |
| South Africa | 155.07 | 1.31% |
| Australia | 149.96 | 1.27% |
| Mexico | 148.45 | 1.25% |
| Iran | 135.39 | 1.14% |
| Ukraine | 133.69 | 1.13% |
| Saudi Arabia | 129.27 | 1.09% |
| Brazil | 128.03 | 1.08% |
| Spain | 123.64 | 1.04% |
| The Netherlands | 104.64 | 0.88% |
| Indonesia | 103.78 | 0.88% |
| Turkey | 81.85 | 0.69% |
| Czech Republic | 81.21 | 0.69% |
| Belgium | 69.73 | 0.59% |
| Romania | 66.19 | 0.56% |
| Thailand | 64.06 | 0.54% |
| Argentina | 63.82 | 0.54% |
| Kazakhstan | 60.18 | 0.51% |
| Venezuela | 58.17 | 0.49% |
| United Arab Emirates | 53.00 | 0.45% |
| Egypt | 51.22 | 0.43% |
| Malaysia | 48.71 | 0.41% |
| Singapore | 44.95 | 0.38% |
| Pakistan | 42.19 | 0.36% |
| Greece | 38.06 | 0.32% |
| Uzbekistan | 36.93 | 0.31% |
| Sweden | 36.10 | 0.31% |
| Hungary | 34.03 | 0.29% |
| Bulgaria | 32.16 | 0.27% |
| Algeria | 32.05 | 0.27% |
| Austria | 31.36 | 0.27% |
| Denmark | 31.03 | 0.26% |
| Finland | 28.46 | 0.24% |
| Philippines | 26.85 | 0.23% |
| Colombia | 26.21 | 0.22% |
| Vietnam | 25.30 | 0.21% |
| China Hong Kong SAR | 24.53 | 0.21% |
| Kuwait | 24.07 | 0.20% |
| Slovakia | 22.99 | 0.19% |
| Chile | 22.55 | 0.19% |
| Israel | 22.35 | 0.19% |
| Belarus | 22.13 | 0.19% |
| Switzerland | 21.89 | 0.18% |
| Portugal | 21.11 | 0.18% |
| Ireland | 17.72 | 0.15% |
| Norway | 16.94 | 0.14% |
| Turkmenistan | 15.69 | 0.13% |
| Qatar | 14.45 | 0.12% |
| New Zealand | 14.19 | 0.12% |
| Peru | 13.25 | 0.11% |
| Azerbaijan | 11.80 | 0.10% |
| Bangladesh | 11.69 | 0.10% |
| Ecuador | 8.54 | 0.07% |
| Trinidad & Tobago | 7.81 | 0.07% |
| Lithuania | 5.98 | 0.05% |
| OECD | 6272.30 | 53.00% |
| UE | 2184.98 | 18.46% |
| No OECD | 5561.53 | 47.00% |
| Total top 10 | 7605.59 | 64.27% |
| Total considered | 10,750.46 | 90.85% |
| Rest | 1083.36 | 9.15% |
| Total World | 11,833.82 | 100.00% |
Source: Author, using BP data [50].
Table A2.
Reductions Allocated According to the Ability to Pay Criterion.
Table A2.
Reductions Allocated According to the Ability to Pay Criterion.
| Countries/Areas | (Mt CO2) | (% of Total) |
|---|---|---|
| US | 2905.80 | 24.56% |
| China | 1747.30 | 14.77% |
| Japan | 771.28 | 6.52% |
| Germany | 542.61 | 4.59% |
| United Kingdom | 413.13 | 3.49% |
| France | 384.60 | 3.25% |
| India | 353.20 | 2.98% |
| Italy | 290.03 | 2.45% |
| Brazil | 280.24 | 2.37% |
| Canada | 238.67 | 2.02% |
| South Korea | 220.11 | 1.86% |
| Russian Federation | 200.20 | 1.69% |
| Spain | 192.89 | 1.63% |
| Australia | 187.95 | 1.59% |
| Mexico | 163.34 | 1.38% |
| Indonesia | 145.45 | 1.23% |
| Turkey | 134.91 | 1.14% |
| The Netherlands | 121.26 | 1.02% |
| Switzerland | 104.14 | 0.88% |
| Saudi Arabia | 100.86 | 0.85% |
| Argentina | 85.11 | 0.72% |
| Sweden | 80.47 | 0.68% |
| Poland | 73.54 | 0.62% |
| Belgium | 73.37 | 0.62% |
| Venezuela | 72.21 | 0.61% |
| Iran | 65.37 | 0.55% |
| Thailand | 63.50 | 0.54% |
| Austria | 60.35 | 0.51% |
| Norway | 57.90 | 0.49% |
| United Arab Emirates | 54.41 | 0.46% |
| Egypt | 51.92 | 0.44% |
| Israel | 49.70 | 0.42% |
| China Hong Kong SAR | 49.70 | 0.42% |
| Singapore | 48.52 | 0.41% |
| Denmark | 47.88 | 0.40% |
| Ireland | 47.34 | 0.40% |
| Philippines | 47.34 | 0.40% |
| Malaysia | 46.27 | 0.39% |
| South Africa | 46.15 | 0.39% |
| Colombia | 44.07 | 0.37% |
| Pakistan | 43.52 | 0.37% |
| Chile | 39.05 | 0.33% |
| Finland | 36.68 | 0.31% |
| Bangladesh | 34.55 | 0.29% |
| Vietnam | 32.03 | 0.27% |
| Portugal | 31.95 | 0.27% |
| Czech Republic | 30.77 | 0.26% |
| Peru | 29.99 | 0.25% |
| Greece | 29.58 | 0.25% |
| New Zealand | 29.58 | 0.25% |
| Romania | 29.27 | 0.25% |
| Algeria | 24.81 | 0.21% |
| Qatar | 23.79 | 0.20% |
| Kazakhstan | 21.42 | 0.18% |
| Hungary | 20.12 | 0.17% |
| Kuwait | 17.30 | 0.15% |
| Ecuador | 15.38 | 0.13% |
| Ukraine | 14.55 | 0.12% |
| Slovakia | 14.20 | 0.12% |
| Uzbekistan | 10.49 | 0.09% |
| Bulgaria | 8.28 | 0.07% |
| Belarus | 7.10 | 0.06% |
| Lithuania | 7.10 | 0.06% |
| Azerbaijan | 5.91 | 0.05% |
| Turkmenistan | 5.64 | 0.05% |
| Trinidad & Tobago | 3.42 | 0.03% |
| OECD | 7426.95 | 62.76% |
| UE | 2570.31 | 21.72% |
| No OECD | 4406.87 | 37.24% |
| Total top 10 | 7926.86 | 66.98% |
| Total considered | 11,229.57 | 94.89% |
| Rest | 604,25 | 5.11% |
| Total World | 11,833.82 | 100.00% |
Source: Author, using World Bank data [51].
References
- Grubler, A. Energy transitions research: Insights and cautionary tales. Energy Policy 2012, 50, 8–16. [Google Scholar] [CrossRef]
- Carpintero, Ó. y Riechmann, Pensar la transición: Enseñanzas y estrategias económico-ecológicas. Revista de Economía Crítica 2013, 16, 45–107. [Google Scholar]
- Hancock, K.J.; Vivoda, V. International political economy: A field born of the OPEC crisis returns to its energy roots. Energy Res. Soc. Sci. 2014, 1, 206–216. [Google Scholar] [CrossRef]
- Pan, X.; Teng, F.; Tian, Y.; Wang, G. Countries’ emission allowances towards the low-carbon world: A consistent study. Appl. Energy 2015, 155, 218–228. [Google Scholar] [CrossRef]
- Bataille, C.; Åhman, M.; Neuhoff, K.; Nilsson, L.J.; Fischedick, M.; Lechtenböhmer, S.; Solano-Rodriquez, B.; Denis-Ryan, A.; Stiebert, S.; Waisman, H.; et al. A review of technology and policy deep decarbonization pathway options for making energy-intensive industry production consistent with the Paris Agreement. J. Clean. Prod. 2018, 187, 960–973. [Google Scholar] [CrossRef]
- Bel, G.; Teixidó, J.J. The political economy of the Paris Agreement: Income inequality and climate policy. J. Clean. Prod. 2020, 258, 121002. [Google Scholar] [CrossRef]
- Acar, S.; Söderholm, P.; Brännlund, R. Convergence of per capita carbon dioxide emissions: Implications and meta-analysis. Clim. Policy 2018, 18, 512–525. [Google Scholar] [CrossRef]
- Zhong, Z.; Jiang, L.; Zhou, P. Transnational transfer of carbon emissions embodied in trade: Characteristics and determinants from a spatial perspective. Energy 2018, 147, 858–875. [Google Scholar] [CrossRef]
- Falkner, R. The Paris Agreement and the new logic of international climate politics. Int. Aff. 2016, 92, 1107–1125. [Google Scholar] [CrossRef]
- Nieto, J.; Carpintero, Ó.; Miguel, L.J. Less than 2 °C? An Economic-Environmental Evaluation of the Paris Agreement. Ecol. Econ. 2018, 146, 69–84. [Google Scholar] [CrossRef]
- Viola, E. The Structural Limits of the Paris Agreement and the Need of a Global Coalition for Deep de-Carbonization. In Will the Paris Agreement Save the World? An Analysis and Critique of the Governance Roadmap Set out in COP21; Norwegian Academy on Global Governance: Oslo, Norway, 2016; pp. 47–56. [Google Scholar]
- Chaudhry, S.M.; Ahmed, R.; Shafiullah, M.; Duc Huynh, T.L. The impact of carbon emissions on country risk: Evidence from the G7 economies. J. Environ. Manage. 2020, 265, 110533. [Google Scholar] [CrossRef] [PubMed]
- Gignac, R.; Matthews, H.D. Allocating a 2 C cumulative carbon budget to countries. Environ. Res. Lett. 2015, 10, 075004. [Google Scholar] [CrossRef]
- Xunzhang, P.; Wenying, C.; Clarke, L.E.; Lining, W.; Guannan, L. China’s energy system transformation towards the 2 °C goal: Implications of different effort-sharing principles. Energy Policy 2017, 103, 116–126. [Google Scholar] [CrossRef]
- den Elzen, M.G.J. Exploring Climate Regimes for Differentiation of Future Commitments to Stabilise Greenhouse Gas Concentrations. Integr. Assess. 2002, 3, 343–359. [Google Scholar] [CrossRef]
- Den Elzen, M.G.J.; Lucas, P.L. The FAIR model: A tool to analyse environmental and costs implications of regimes of future commitments. Environ. Model. Assess. 2005, 10, 115–134. [Google Scholar] [CrossRef]
- Ghersi, F.; Hourcade, J.C.; Criqui, P. Viable responses to the equity-responsibility dilemma: A consequentialist view. Clim. Policy 2003, 3. [Google Scholar] [CrossRef]
- Torvanger, A.; Godal, O. An evaluation of pre-kyoto differentiation proposals for national greenhouse gas abatement targets. Int. Environ. Agreem. Polit. Law Econ. 2003, 4, 65–91. [Google Scholar] [CrossRef]
- Hof, A.F.; Den Elzen, M.G.J. The effect of different historical emissions datasets on emission targets of the sectoral mitigation approach Triptych. Clim. Policy 2010, 10, 684–704. [Google Scholar] [CrossRef]
- Ringius, L.; Torvanger, A.; Holtsmark, B. Can multi-criteria rules fairly distribute climate burdens? OECD results from three burden sharing rules. Energy Policy 1998, 26, 777–793. [Google Scholar] [CrossRef]
- Winkler, H.; Spalding-Fecher, R.; Tyani, L. Comparing developing countries under potential carbon allocation schemes. Clim. Policy 2002, 2, 303–318. [Google Scholar] [CrossRef]
- Pettersson, F.; Maddison, D.; Acar, S.; Söderholm, P. Convergence of carbon dioxide emissions: A review of the literature. Int. Rev. Environ. Resour. Econ. 2013, 7, 141–178. [Google Scholar] [CrossRef]
- Zhou, P.; Wang, M. Carbon dioxide emissions allocation: A review. Ecol. Econ. 2016, 125, 47–59. [Google Scholar] [CrossRef]
- Payne, J.E. The convergence of carbon dioxide emissions: A survey of the empirical literature. J. Econ. Stud. 2020. [Google Scholar] [CrossRef]
- Duro, J.A.; Giménez-Gómez, J.M.; Vilella, C. The allocation of CO2 emissions as a claims problem. Energy Econ. 2020, 86, 104652. [Google Scholar] [CrossRef]
- Mackenzie, I.A.; Hanley, N.; Kornienko, T. The optimal initial allocation of pollution permits: A relative performance approach. Environ. Resour. Econ. 2008, 39, 265–282. [Google Scholar] [CrossRef]
- MacKenzie, I.A.; Hanley, N.; Kornienko, T. Using contests to allocate pollution rights. Energy Policy 2009, 37, 2798–2806. [Google Scholar] [CrossRef]
- Liao, Z.; Zhu, X.; Shi, J. Case study on initial allocation of Shanghai carbon emission trading based on Shapley value. J. Clean. Prod. 2015, 103, 338–344. [Google Scholar] [CrossRef]
- Gutiérrez, E.; Llorca, N.; Sánchez-Soriano, J.; Mosquera, M. Sustainable allocation of greenhouse gas emission permits for firms with Leontief technologies. Eur. J. Oper. Res. 2018, 269, 5–15. [Google Scholar] [CrossRef]
- Lozano, S.; Villa, G.; Brännlund, R. Centralised reallocation of emission permits using DEA. Eur. J. Oper. Res. 2009, 193, 752–760. [Google Scholar] [CrossRef]
- Sun, J.; Wu, J.; Liang, L.; Zhong, R.Y.; Huang, G.Q. Allocation of emission permits using DEA: Centralised and individual points of view. Int. J. Prod. Res. 2014, 52, 419–435. [Google Scholar] [CrossRef]
- Lee, C.-Y.; Wang, K.; Sun, W. Allocation of Emissions Permit for China’s Iron and Steel Industry in an Imperfectly Competitive Market: A Nash Equilibrium DEA Method. IEEE Trans. Eng. Manag. 2020, 1–14. [Google Scholar] [CrossRef]
- Ichisugi, Y.; Masui, T.; Karkour, S.; Itsubo, N. Projection of National Carbon Footprint in Japan with Integration of LCA and IAMs. Sustainability 2019, 11, 6875. [Google Scholar] [CrossRef]
- Ridgley, M.A. Fair sharing of greenhouse gas burdens. Energy Policy 1996, 24, 517–529. [Google Scholar] [CrossRef]
- Chakravarty, S.; Chikkatur, A.; De Coninck, H.; Pacala, S.; Socolow, R.; Tavoni, M. Sharing global CO 2 emission reductions among one billion high emitters. Proc. Natl. Acad. Sci. USA 2009, 106, 11884–11888. [Google Scholar] [CrossRef]
- Pan, X.; Teng, F.; Wang, G. Sharing emission space at an equitable basis: Allocation scheme based on the equal cumulative emission per capita principle. Appl. Energy 2014, 113, 1810–1818. [Google Scholar] [CrossRef]
- Rose, A.; Zhang, Z.X. Interregional Burden-Sharing of Greenhouse Gas Mitigation in the United States. SSRN Electron. J. 2005. [Google Scholar] [CrossRef]
- Zhou, P.; Zhang, L.; Zhou, D.Q.; Xia, W.J. Modeling economic performance of interprovincial CO2 emission reduction quota trading in China. Appl. Energy 2013, 112, 1518–1528. [Google Scholar] [CrossRef]
- Yang, B.; Liu, C.; Su, Y.; Jing, X. The allocation of carbon intensity reduction target by 2020 among industrial sectors in China. Sustainability 2017, 9, 148. [Google Scholar] [CrossRef]
- Zhang, J.; Jiang, H.; Liu, G.; Zeng, W. A study on the contribution of industrial restructuring to reduction of carbon emissions in China during the five Five-Year Plan periods. J. Clean. Prod. 2018, 176, 629–635. [Google Scholar] [CrossRef]
- Zhou, X.; Guan, X.; Zhang, M.; Zhou, Y.; Zhou, M. Allocation and simulation study of carbon emission quotas among China’s provinces in 2020. Environ. Sci. Pollut. Res. 2017, 24, 7088–7113. [Google Scholar] [CrossRef]
- Bian, Y.; Yu, Z.; Zeng, X.; Feng, J.; He, C. Achieving China’s long-term carbon emission abatement targets: A perspective from regional disparity. Sustainability 2018, 10, 4244. [Google Scholar] [CrossRef]
- Zhao, R.; Min, N.; Geng, Y.; He, Y. Allocation of carbon emissions among industries/sectors: An emissions intensity reduction constrained approach. J. Clean. Prod. 2017, 142, 3083–3094. [Google Scholar] [CrossRef]
- Baghdadi, L.; Martinez-Zarzoso, I.; Zitouna, H. Are RTA agreements with environmental provisions reducing emissions? J. Int. Econ. 2013, 90, 378–390. [Google Scholar] [CrossRef]
- Apergis, N.; Payne, J.E.; Rayos-Velazquez, M. Carbon Dioxide Emissions Intensity Convergence: Evidence From Central American Countries. Front. Energy Res. 2020, 7. [Google Scholar] [CrossRef]
- Apergis, N.; Payne, J.E. NAFTA and the convergence of CO2 emissions intensity and its determinants. Int. Econ. 2020, 161, 1–9. [Google Scholar] [CrossRef]
- Ma, Z.; Cai, S.; Ye, W.; Gu, A. Linking Emissions Trading Schemes: Economic Valuation of a Joint China–Japan–Korea Carbon Market. Sustainability 2019, 11, 5303. [Google Scholar] [CrossRef]
- Martin, R.; Muuls, M.; Wagner, U.J. The Impact of the European Union Emissions Trading Scheme on Regulated Firms: What Is the Evidence after Ten Years? Rev. Environ. Econ. Policy 2016, 10, 129–148. [Google Scholar] [CrossRef]
- Oestreich, A.M.; Tsiakas, I. Carbon emissions and stock returns: Evidence from the EU Emissions Trading Scheme. J. Bank. Financ. 2015, 58, 294–308. [Google Scholar] [CrossRef]
- Gomes, E.G.; Lins, M.P.E. Modelling undesirable outputs with zero sum gains data envelopment analysis models. J. Oper. Res. Soc. 2008, 59, 616–623. [Google Scholar] [CrossRef]
- Chang, M.-C. Carbon Emission Allocation and Efficiency of EU Countries *. Mod. Econ. 2012, 3, 590–596. [Google Scholar] [CrossRef]
- Cucchiella, F.; D’Adamo, I.; Gastaldi, M.; Miliacca, M. Efficiency and allocation of emission allowances and energy consumption over more sustainable European economies. J. Clean. Prod. 2018, 182, 805–817. [Google Scholar] [CrossRef]
- Apergis, N.; Payne, J.E. Per capita carbon dioxide emissions across U.S. states by sector and fossil fuel source: Evidence from club convergence tests. Energy Econ. 2017, 63, 365–372. [Google Scholar] [CrossRef]
- Apergis, N.; Payne, J.E.; Topcu, M. Some empirics on the convergence of carbon dioxide emissions intensity across US states. Energy Sources, Part B Econ. Plan. Policy 2017, 12, 831–837. [Google Scholar] [CrossRef]
- Sahu, S. Emissions Sharing Observations from a Diverse Range of Countries. Sustainability 2019, 11, 4013. [Google Scholar] [CrossRef]
- Collado, J.R.N.; Wang, H.H.; Tsai, T.Y. Urban informality in the Paris climate agreement: Content analysis of the nationally determined contributions of highly urbanized developing countries. Sustain. 2019, 11, 5228. [Google Scholar] [CrossRef]
- Pérez, F.; Blancas, F.J.; González, M.; Guerrero, F.M.; Lozano, M.; Ruiz, M. Análisis, diseño y comparación de indicadores sintéticos. In Proceedings of the XVI Jornadas ASEPUMA–IV Encuentro Internacional, Cartagena, Colombia, 18–19 September 2008; Volume 16, p. 1. [Google Scholar]
- Van Ruijven, B.J.; Weitzel, M.; den Elzen, M.G.J.; Hof, A.F.; van Vuuren, D.P.; Peterson, S.; Narita, D. Emission allowances and mitigation costs of China and India resulting from different effort-sharing approaches. Energy Policy 2012, 46, 116–134. [Google Scholar] [CrossRef]
- British Petroleum. BP Statistical Review of World Energy—Data Workbook; BP: London, UK, 2017. [Google Scholar]
- World Bank. World Indicators Database; World Bank: Washington, DC, USA, 2018. [Google Scholar]
- Friedlingstein, P.; Jones, M.; O’sullivan, M. Global Carbon Budget 2019. Earth Syst. Sci. Data 2019, 11, 1783–1838. [Google Scholar] [CrossRef]
- Zhang, Y.X.; Chao, Q.C.; Zheng, Q.H.; Huang, L. The withdrawal of the U.S. from the Paris Agreement and its impact on global climate change governance. Adv. Clim. Chang. Res. 2017, 8, 213–219. [Google Scholar] [CrossRef]
- Höhne, N.; Kuramochi, T.; Warnecke, C.; Röser, F.; Fekete, H.; Hagemann, M.; Day, T.; Tewari, R.; Kurdziel, M.; Sterl, S.; et al. The Paris Agreement: Resolving the inconsistency between global goals and national contributions. Clim. Policy 2017, 17, 16–32. [Google Scholar] [CrossRef]
- Kolk, A.; Levy, D. Winds of Change: Corporate Strategy, Climate change and Oil Multinationals. Eur. Manag. J. 2001, 19, 501–509. [Google Scholar] [CrossRef]
- van den Hove, S.; Le Menestrel, M.; de Bettignies, H.C. The oil industry and climate change: Strategies and ethical dilemmas. Clim. Policy 2002, 2, 3–18. [Google Scholar] [CrossRef]
- McGlade, C.; Ekins, P. The geographical distribution of fossil fuels unused when limiting global warming to 2 °C. Nature 2015, 517, 187–190. [Google Scholar] [CrossRef] [PubMed]
- Gadre, R.; Anandarajah, G. Assessing the evolution of India’s power sector to 2050 under different CO2 emissions rights allocation schemes. Energy Sustain. Dev. 2019, 50, 126–138. [Google Scholar] [CrossRef]
© 2020 by the authors. Licensee MDPI, Basel, Switzerland. This article is an open access article distributed under the terms and conditions of the Creative Commons Attribution (CC BY) license (http://creativecommons.org/licenses/by/4.0/).