Abstract
In the conditions of a digitalized and sustainable economy, a smart decision is focused on all demand aspects regarding: the product demand, the quality demand, and the elements of national and international bodies able to ensure the criteria of economic integrity on the European Markets. These aspects represent a set of challenges and indicate the smart component of the management decision assisted by reliable economic models. The present work aims to develop such a model applied to the wheat seed production starting from the study of the specialized literature and using empirical methods. The analysis covers 2016–2020. The main objective of the study is the combination of the information from the observational study to obtain the smart decision model. The study results in the smart model of managerial decision, which represents a real necessity for managers, considering the challenges to which they are subjected. The proposed model in the paper can be used for all types of seeds across the EU and not only. The implementation of the present study by the authors validates the proposed model.
1. Introduction
The European Union (EU) is implementing the 7th Environment Action Program (EAP) in order to support economic development under sustainability. The 7th EAP is coupled with the EU 2020 Biodiversity Strategy. This new document sets targets for 2020 and a European vision by 2050, when the current environmental and biodiversity challenges will be overcome. One of the main goals set by the EU 2020 Biodiversity Strategy is to increase the contribution of agriculture and forestry to maintaining and restoring biodiversity [1,2].
In addition, the European Commission has defined a roadmap for achieving a competitive and low-carbon economy by 2050. This document contains ambitious targets for reducing carbon dioxide emissions. One of these targets is focused on agriculture (see Table 1).

Table 1.
EU-level pollution reduction in agriculture (compared to 1990).
According to the above approach, the EU agriculture has a great importance in supporting sustainable development. European Union represents an important actor of the global agriculture nowadays. The crop production achieved a positive trend during the last three years across the EU (see Figure 1) [4].
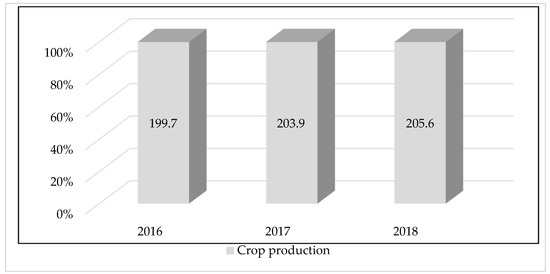
Figure 1.
Evolution of the European crop production (billions euros). Source: authors’ contribution using [4].
In 2018, the EU crop production accounted for 56.3% of the value of total agricultural production. On the other hand, EU is an important player in the international market for agricultural products. During 2015–2019, the EU’s exports of wheat varied from 7.7 to 6.1 million tonnes, while the EU’s imports decreased from 17.3 to 8.6 million tonnes (see Figure 2) [3].
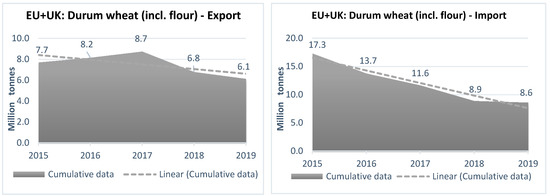
Figure 2.
The EU foreign trade in wheat during 2015–2019 (million tonnes). Source: authors’ contribution using [3].
Romania has maintained its status as an important agricultural producer within the EU [5,6]. As a result, in 2016, Romania ranked first in the EU for sunflower production and second for wheat and corn production, after France, according to data from the National Institute of Statistics.
In 2018, Romanian agriculture ranked 3rd in the EU, after France and Germany, in cereal production (31.9 million tons). Romania achieved 4th rank in the EU, with 10.3 million tons of wheat production [3].
Our research puts into direct connection the EU implication in sustainable development and the agriculture’s impact on it.
There is a great interest motivated by the objectives of the 2030 Joint Agenda [7] regarding the implementation of smart-sustainable solutions in the field of agricultural production, including the achievement of the maximum productive potential with the rational use of resources in order to prevent the degradation of the environment.
Starting from the EU’s specific objectives on sustainability, the sustainable provision of food resources represents a pole of the Community interest, considering the degradation of the global climatic conditions and the impact of the cereal productions through the use of the traditional mechanisms of economically assisted decision. These mentioned premises clearly indicate the opportunity of a well-founded study on a new approach to the smart decision process for maximizing the positive ecological and economic effects related to the sustainable production assurance.
This opportunity can be achieved using and defining the following scientific objectives of the study:
Objective 1: conducting an experimental study on the opportunity to optimize the production decision of a wheat variety based on specific technical-productive indicators;
Objective 2: building a database for the preliminary processing of the smart decision-assisted model;
Objective 3: making a technical evaluation of the smart model based on the outputs resulted from the experimental study and the test conditions established by the authors through the working hypotheses;
Objective 4: quantifying the financial impact by introducing in the model of the economic variables to optimize the decision process;
Objective 5: making an evaluation of the model’s results;
Objective 6: reconsidering the model from the sustainability indicators point of view.
The study of the specialized literature supports our scientific approach in building a new model applied to the sustainable agriculture development. During 2014–2019, many researchers studied the connection between the agriculture development, the final demand of the users for high quality products (bio products) and the world trade sustainability’s condition. A short review of the most significant papers in this area is presented in Table 2.
Table 2.
Literature review.
From the analysis of the specialized literature in agriculture production and sustainability, resides the need to introduce and integrate the concepts of economic sustainability in the food field and to consolidate the economic practices with the productive practices in order to fulfill the social objectives (providing the necessary food for the population) with the economic objectives (obtaining a superior economic yield) and with the European objectives for the creation of the sustainable framework in accordance with the European Horizon 2030 Agenda. The sustainable development means concentrating the research on the best agricultural practices (high-performance technologies and seed material with productive genetic potential) and sustainability by protecting cultivated soils against the land degradation and utilizing the maximized resources. In agriculture, the sustainability is the guarantee of the large agricultural productions, without undermining the resources that depend on productivity.
The cultivation of wheat varieties with wide adaptability to the soil and climate conditions and technological conditions can reduce the risks of crop fluctuation in the unfavorable years. In order to minimize the harvest losses caused by unfavorable soil and climate conditions factors, it is necessary to promote in this area the wheat varieties with good adaptability to such conditions and the application of appropriate modern technologies.
In a world in which the highest yielding varieties are sought on the agricultural market to achieve the highest yields, however, there are constraints on resources, where ecosystems are degraded, due to intensive technologies, treatments and excess fertilizers. It is recommended to develop and apply technological measures that are as environmentally friendly as possible (optimization of the quantities of chemical fertilizers, pesticides and herbicides, using of efficient agricultural machinery and equipment, precision seeders, low energy consumption and diesel), which reduce the negative impact on the environment and to conserve natural resources.
This technical approach indicates the implementation of an assisted decision model under the conditions of using the selection of indicators based on the comparability of the actual performances with those ensured at certification.
2. Materials, Methods and Models
According to the above study’s aims, the present research explains the sustainability approach based on developing, implementing and promoting sustainable practices in Romania. In this regard, eight varieties of autumn wheat, two indigenous and two French were analyzed (Glosa, FDL Miranda, Sorial, Solveig, Litera, Izvor, Apache and Avenue).
The Romanian wheat varieties Glosa and FDL Miranda belong to the maintainer of the National Agricultural Research and Development Institute Fundulea (NARDI Fundulea) and are listed in the Official Variety Catalog in 2005 and 2011 respectively. The wheat variety sown in the field should adapt better to the climatic conditions (to withstand drought and frost conditions) and to the soil on which it is cultivated, acclimating even on soils with low fertility, so that the obtained quality and yield to be as large as possible. The choice of these varieties of wheat must be made taking into account all these factors [24,25].
The research algorithm applied to this study is presented in Figure 3. The scheme respects a logical succession regarding the organization of the research process, considering the complexity of the studied phenomenon that combines the smart elements of the production decision with the smart elements of the economically sustainable decision. We define the smart decision as that decision based on practices and economics, delimited in time and space, by means of a probabilistic selection mechanism. This mechanism is based on the productive and economic efficiency. As a result, the economic agents can achieve the objectives of performance, sustainability and social compliance on the food segment. According to Figure 3, the study methodology covers the research of the models already implemented (but unable to quantify the sustainable development of the wheat production) and presented in Literature review (12 models debated analytically and critically according to Table 2). We can identify the current applicability for a smart decision model, define working hypotheses, the model and its testing through laboratory and field. The research covers the successive results during three calendar years regarding the qualitative yields of the 8 wheat varieties tested on 4 types of soil (soils). The qualitative characteristics of the soils are included in classes 2 and 3 of quality (good, respectively average) and whose PH, varies from neutral to alkaline on the interval 6.9–8.04, reaching differentiated values depending on the study year with the influence of pedoclimatic conditions. These type of lands can be found anywhere in Europe, not only in Romania, in areas with temperate climates. As a result, the analysis methodology is universally valid.
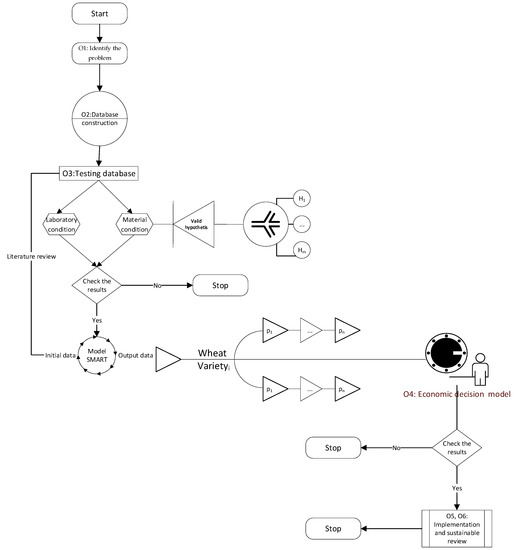
Figure 3.
Scheme of the research algorithm.
The proposed model is completely new for which no precedents have been identified in the literature.
The logic scheme covers the six objectives of the research mentioned above by testing the following working hypotheses:
Hypothese H1:
The methods of determining the quantitative yield of the seed material are directly related to the technical properties specified in the variety accreditation standards.
Hypothese H2:
The impact on the quantitative yield is even greater as the characteristics of the varieties are representative for the whole cultivated lot.
Hypothese H3:
Qualitative factors (humidity and germination) have a high impact on the decision-making process, but the relationship of dependence is lessened by the changes of the soil and climate conditions.
Hypothese H4:
The traceability of the productive yield differs between the indigenous and foreign varieties.
Hypothese H5:
The economically assisted decision function is directly related to the managerial capacity to make decisions on the productive chain, the logistics chain and the distribution chain under sustainability conditions.
Hypothese H6:
In order to ensure the smart optimization of the decision, it is necessary to ensure the traceability of the entire decision-making chain, from the selection of the variety to production, storage and marketing. The vulnerabilities registered in the primary stages propagate directly over the entire business cycle.
In order to test the working hypotheses and to elaborate the SMART model, we define the following functions and parameters. The qualitative characteristics of the seed material with high qualitative impact on the smart decision:
- Let U be the moisture function required to ensure the quality of the production. We can say that there is λt ≠ 0 so that Ut = λtU0, where U0 = the recommended seasonal humidity reached by technical standards; λ = the impact of soil and climate conditions factors (air-soil temperature, air humidity, wind, precipitation and solar brightness).
- Let G be the germination function necessary to ensure the quality of the production. We can say that there is λt ≠ 0 so that Gt = λtG0, with the mention that for identical λt, the direct effect of the impact on the two qualitative characteristics is different (Gt − G0 = IG ≠ IU = Ut − U0).
The factors with average quantitative impacton the smart decision are the mass of 1000 grains in grams and the average of the grains per spice.
- the mass of 1000 grains in grams: all other varieties are recognized as having higher values of 42 g/thousand grains, excepting the Avenue variety whose standard classifies it below 40 g/thousand grains. All selected varieties have humidity below 14% that is considered standard. In the study, the germination capacity exceeds 94% for all analyzed varieties. The mentioned above laboratory tests, respectively the analysis of the mass of 1000 grains, the humidity and the germination capacity were completed with field analyzes, which consisted in determining the average of the wheat per square meter, the average of the grain in the wheat and the production of wheat/ha, per varieties and by type of cultivated sole.
- Average grain in wheat: it exceeds 30 grains for all analyzed varieties.
Indicators with high impact on output through the smart decision prism: these are the production in kg/ha and the average of the ears/m2.
- production in kg/ha: The evaluation of the wheat seed production at the already established control points is done as follows: all the ears within the metric frame are counted; the percentage of large ears, medium ears and small ears is established; the average number of grains/wheat is calculated.Based on the average number of ears/m² and the average number of grains/spice, and having the mass of 1000 grains (MMB), the average wheat production per hectare can be calculated, using the following formula:where: Q (kg/ha) = average production; Nsp = average number of ears per square meter; Nb = average number of grains in wheat.
- the average of the ears/m2: it varies between 400–500 ears/m2 for the Romanian varieties depending on the density at sowing and the used technology; the average of the ears grows, offering a higher density located between 450–600 ears/m2 the French varieties.
The above quantitative and qualitative indicators were calculated based on the tests carried out in 4 agricultural holding companies: Tudor Vladimirescu, Gemenele, Ramnicelu and Movila Miresii from the Romanian South-East NUTS2 region.
The model proposed in this paper is based on the following hypotheses. Let be:
where: fi—the wheat quality score function with high impact (coefficient 1, ) based on the quantifying of the standard deviations from the humidity and germination technical specifications of the catalog;
Siu—humidity recorded on varieties under different soil and climate conditions (time and space); Sig—germination recorded on varieties under different soil and climate conditions (time and space); USTD—the standard humidity recognized as 14%; GSTD—the standard germination recognized as being 94%. And let be:
where: fi—the score quantity function of the wheat assumed to have average impact (coefficient 0.3, αM = 0.3) based on the quantification of the deviations from the average evolution in the field of the indicators with average impact; —the mass of a thousand grains; —average grain in wheat. More, let be:
fi—the score quantity function of the wheat assumed to have high impact (coefficient 1, ) based on the quantification of the deviations from the average evolution in the field of the indicators with average impact;
—production function in tones/ha; —average spikes/sqm;
, such that , where ,
where: —the general productivity coefficient applied to wheat varieties cultivated under different soil and climate conditions, depending on the productive and qualitative yield (assuming the marketability coefficient).
, such that , for p = price at the grain exchange in Constanta (Romania) [26,27].
Based on the collected information through the field and laboratory observational study across the 4 distinct agricultural holding companies and for the 8 wheat varieties during 2016–2018 (see the Appendix A), taking into account the defined above equations, we used the Gretel 2018a software (developed by Alin Cottrell and Riccardo Lucchetti, Wake Forest University) into this new model. We used the function of the least squares method for the wheat variety dependent variable and the regression variables the productive yield (I = η (Q)), the qualitative productive yield I1 = η (Q, U, G) and the economic efficiency support of the smart decision (I2 = η (Q * P, U, G).
| (0.00200) | (12.1) | (11.5) |
| n = 64, R-squared = 0.841 | ||
| (Standard errors in parentheses) | ||
According to the regression equation, it is found that the proposed model has a statistical representativeness of 84% for a number of iterations equal to 64 and a standard error of the regression for variable I2 (economic yield) which tends to 0.
In order to prove the validity of the model, the statistical tests presented below were performed (see Table 3).
Table 3.
Model: OLS, using observations 1–64; Dependent variable: Soy.
Breusch-Pagan test for heteroskedasticity
Null hypothesis: heteroskedasticity is not present
Statistical test: LM = 2.35191
with p-value = P(Hi2(3) > 2.35191) = 0.50265
According to the Q-Q plot for the dependent variable (Figure 4), it is found that the model has a good statistical representativeness.
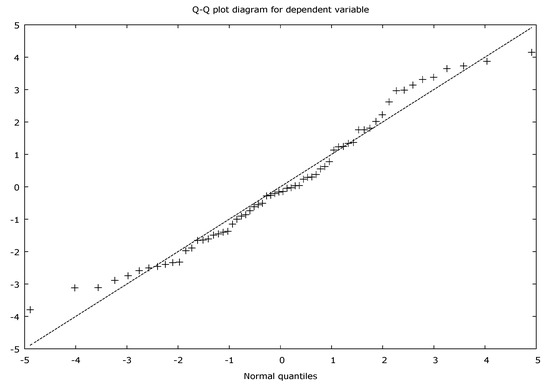
Figure 4.
Q-Q plot diagram for the dependent variable.
The winding test around the trend line is valid, and the heterodesdaticity tested by the Breusch-Pagan test is absent for the proposed model. The p-value for the productive yield and qualitative productive yield regression variables is less than 0.01, which represents a strong dependence of the smart decision on the results of the two types of yield, with the mention that the productive yield is appreciated as more important by the manager than the yield productive quality, p-value being lower for the productive yield.
The forecasted distribution over the 95% confidence interval reveals an average error that extends via 0 (0.0098) and a regression bias that tends to 0 on the uncorrected variant of the standard error (Figure 5).
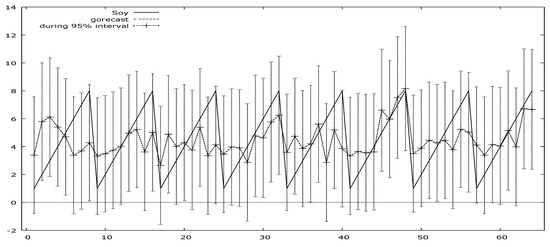
Figure 5.
The forecasted distribution.
For the dependent variable, it is found that the preference over the forecast range is manifested for the 5–8 (French) varieties, with the exception of the Glosa variety, which shows the preference over the 30–50% ranges.
| Forecast evaluation statistics | |
| Average error | 0.0098524 |
| Root Mean Squared Error | 2.0112 |
| Absolute Mean Error | 1.6426 |
| Mean Percentage Error | −38.886 |
| Mean Absolute Percentage Error | 63.212 |
| Theil’s U | 1.756 |
| Bias proportion, UM | 2.3999 × 10⁻⁵ |
| Regression proportion, UR | 0.00037398 |
| Disturbance proportion, UD | 0.9996 |
The application of the Gaussian rule for the evaluated sample, with a turning point on the maximum of the curve, at the beginning of the decreasing slope for a p-value less than 0.15 is noted (Figure 6).
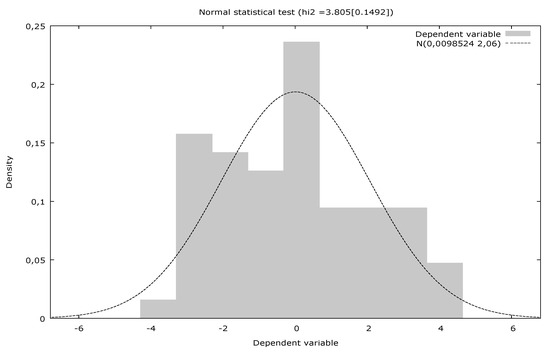
Figure 6.
The Statistical test for normality.
Test for residual normality
The null hypothesis: the error is normally distributed
Statistical test: Hi2(2) = 3.80462
with p-value = 0.149223
The confidence ellipse for the qualitative productive yield compared to the economic yield reflects a Cartesian disturbance with respect to the level 0 of the intersection of the coordinate axes, determined by the point with the coordinates (0.002,−46.4) (see Figure 7).
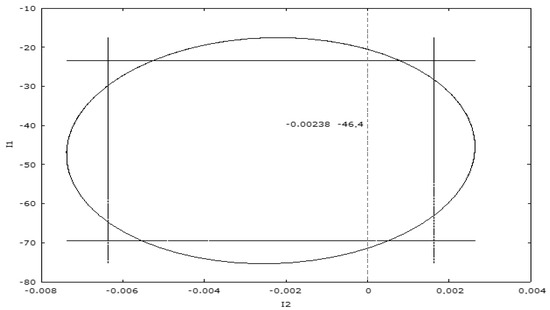
Figure 7.
The Confidential ellipse.
This indicates a suboptimal value of the economic yield in relation to the productive yield, which motivates the managers to refine the markets in order to obtain the economic advantages on the quality gain obtained from the cultivation of the French varieties and the monitoring of the soil and climate conditions in order to ensure the optimum quality level. As a result, the distribution is suboptimal, the highly productive French varieties needing specific conditions to reach the maximum yield.
3. Results
The production technology of wheat seed lots and the results of laboratory analyzes concerned: number of ears/m2, number of grains/spike/, MMB (g), production kg/ha, moisture (%) and germination (%). Along the field research, during the wheat vegetation period, the observations were made on plant development, the degree of twinning, the number of ears/square meter, the number of grains in the ear for each variety, estimating the production.
Within the technology, the eight varieties were sown, with the SUP 29 seed drill in the second half of October. In these experiments, the precursor plant was corn for all varieties in the four areas Gemenele, Tudor Vladimirescu, Rîmnicelu and Movila Miresii. The tillage was carried out immediately after the corn was harvested. Plowing was done with the plow in the aggregate with a star harrow at a depth of 18–22 cm, with the incorporation of plant debris and weeds.
Fertilization was performed uniformly with complex fertilizers containing nutrients, for plants N: P: K, (20-20-0) the most balanced ratio for wheat. The wheat seeds used for sowing belonged to the C1 Certified biological category, and were treated with the fungicide Celest Star 025FS, against pathogens that are transmitted through Tilletia sp. (malura), Fusarium sp. (fusariosis) and Ustilago tritici (embers). Special attention was paid to sowing the eight wheat genotypes Glosa, Litera, Izvor, FDL Miranda, Sorrial, Solveig, Apache, Avenue, in order to avoid mechanical contamination.
The weed control was carried out with the systemic herbicide Sekator Progress in a dose of 0.10 l/hectare, in the spring in post-emergence. Topsin 70 WDG (1kg/hectare) systemic fungicide with preventive and curative effect against and treating Erysiphe graminis (Wheat flour), Puccinia spp. (Wheat rust), Fusarium spp. (Fuzarioza), Helminthori sativum (Tearing of leaves) was treated against pathogens.
The systemic insecticide Mospilan 20SG s.a. was applied against the pests at a dose of 0.1 kg/hectare.
A very important work applied to seed lots is the biological purification, which involves responsibility and consists in removing all not typical plants of the variety from the seed culture, while maintaining the typicality of the variety. The wheat was harvested on varieties, with the Claas Tucano 320 combine, at a humidity of 14% and with great responsibility to avoid mechanical contamination.
The experimental methodology in the laboratory was complex. In the laboratory, each variety of wheat was researched, following the elements of productivity but also quality indices. The analyzes were performed on:
- -
- mass of 1000 grains (MMB), which was determined using SR 6123-1/1999;
- -
- production (kg);
- -
- seed moisture expressed as a percentage (U%), which was determined using SR 6124-1/1999;
- -
- filter germination (BP), expressed as a percentage (G%) determined using SR 1634/1999;
- -
- germination of seeds in Lindhard pots, in a mixture (S) 1: 1 using soil from the four areas, expressed as a percentage (G%) which was determined using SR 1634/1999.
The results of the laboratory analyzes were processed and represented graphically.
The modeling of the obtained experimental data used the Anova analysis and the “t” Test, in which it was proposed to identify the existence of soil influences on some wheat varieties, in terms of number of ears/m², number of grains/ear, mass of one thousand grains (MMB ), germination (G%), humidity (U%) and production, by comparing the averages of several samples.
Statistical and graphical analyzes were performed based on the collected data, which highlighted the existence of differences regarding: number of ears/m2, number of grains/ear, mass of one thousand grains (MMB), germination (G%), humidity (U% ) and production.
The performance projections were made based on the performed analyzes using the methodology of highlighting the dynamics of ears/m2, number of grains/ear, yields, mass of one thousand grains, humidity and germination in each period (2016–2018).
During 2016–2018, all wheat varieties were cultivated on 4 soils (Gemenele, Movila Miresii, Rimnicelu and Tudor Vladimirescu). The results of the qualitative and quantitative analysis are presented in Table 4.
Table 4.
Humidity variation.
From the ranking of the qualitative characteristics for the indicator of seed wheat moisture point of view can be build a specific diagram (see Figure 8).
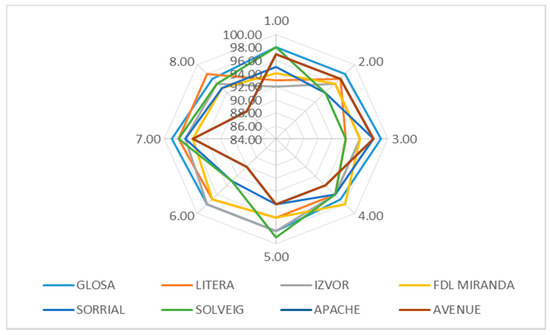
Figure 8.
Diagram of the wheat grain’s humidity/moisture (%).
On the other hand, the seasonal variations influence the maximum production of the Wheat varieties. The disparities related to this indicator are presented in Table 5.
Table 5.
Productivity variation.
Using the production indicator kg/ha, the dedicated diagram becomes (see Figure 9):
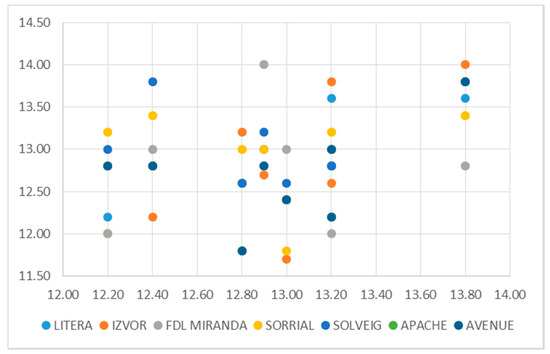
Figure 9.
Productivity diagram (thousand kg per ha).
During the analyzed period 2016–2018, the total production related to the wheat varieties varied according to data in Table 6.
Table 6.
Total production variation.
Using the productive classification for the production indicator (kg), the dedicated diagram will be (see Figure 10):
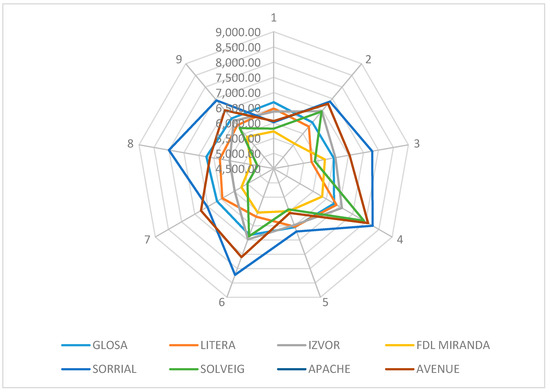
Figure 10.
Production diagram (kg).
The efficiency of the smart economic decision was tested on the marginal distribution of the maximum values calculated by the economic efficiency indicator I2 = η (Q * P, U, G) for each of the 8 analyzed varieties and is proved by the normal distribution test R2 = 43%. This is an asymmetric distribution of the Romanian varieties under the trend axis (type 2 polynomial): y = −5.6189x2 + 114.35x + 986.05 and of the French varieties above, with polarization at maximum point for the SORRIAL variety (see Figure 11).

Figure 11.
Economic efficiency diagram; Source: authors’ contribution.
The standard deviation is 238.38, respectively 14% of the maximum value of the economic efficiency of the SORRIAL variety.
The above analysis supports the smart decision regarding the implementation of the economic sustainable model for wheat seed production not only in Romania.
4. Discussion
The smart sustainable decision based on the above presented algorithm in the methodology chapter is based on all 3 main aspects: ensuring the market needs by optimizing the produced quantities; satisfying the demand by ensuring the quality of the delivered product; and maximizing the economic efficiency by obtaining the maximum possible economic efficiency under the competitive market’s conditions.
The working hypotheses have shown that there is a direct dependence relation between the quantitative factor and the smart decision punctuated in the model by obtaining a minimum p-value quota (hypothesis H1), with the mention that the technical-productive baggage of the seed material represents the reference for obtaining a smart decisions. In this context, the satisfaction of the qualitative demand represents the basic component in the perpetual assurance of the demand, having a loyalty role, a role that the managers are obliged to take into consideration when building the smart decision.
The impact of soil and climate conditions indicators on the humidity and germination of the seed material is very high for the cereal productions. As a result, in some cases, there is a gap between the quantitative decision and the qualitative decision manifested by increasing the p-value amplitude and moving the decision point according to the soil and climate conditions and maximizing the yields from the Sorial variety, cultivated on the 2nd class land with pH = 6.9 neutral, to the Sorial variety, cultivated on class AA land, with pH = 7.4 weak alkaline but in more favorable soil and climate conditions (see the Appendix A). This gap demonstrates H2 and H3 hypotheses.
The aspects related to the production traceability reflect the fact that some indigenous varieties are tested for specific soil and climate conditions and are often easier to exploit than the imported varieties that require monitoring of the soil and climate conditions and adjustments of the treatment during the storage period through specific storage maneuvers (H4).
The assisted economically smart decision moves the critical pole on the fruition of the competitive advantage and disseminates the managers’ options for export to the markets where the price supports the quality of the product (H5).
Throughout the entire chain analyzed when this article was writing, it was found that ensuring the market demand represents the first objective of the managers in the sense of ensuring the production capacity and the adequate storage spaces, the subsequent decisions regarding the quality and the economic efficiency being assisted by specific operations. There are maneuvers performed during storage that maintain the quality of the product but increase costs. In order to ensure the economic efficiency, the Option and Future contracts are used on commodity exchanges to ensure the efficient distribution and sale of production (H6).
5. Conclusions
Following the analysis, there was a special interest expressed by the researchers and the business environment for obtaining a smart decision under sustainability conditions. Taking into consideration the analyzed process, namely the production process for cereals from indigenous and from imports varieties with high productive performances, we consider that the sustainable aspects target the entire production and the distribution chain because higher economic returns can be obtained by reusing cereal wastes (even that there are not quantified in the model) an aspect that complements optional smart decision based on a mix of productivity and economic efficiency.
The authors have developed a new model based on the principles of sustainable economy, which offers managers the option of a smart decision in variable socio-economic conditions, being all the more applicable as the current economic and social inflections generated by climate change and the global health crisis shows strong influence in the food sector and not only.
This study is necessary for the academic environment, because by economic modelling, the structure gives a smart decision model, starting from the already carried out in the domain research, which did not identify a similar model, but especially the business environment, which shows a real interest for optimizing managerial decisions in terms of productivity and economic efficiency on a sustainable basis.
The proposed model has no obvious limitations (other indicators can be added to this model, according to the economic reality). We believe this new indicators, especially economic ones, can be used in order to sustainably support the smart decision.
Author Contributions
Conceptualization, R.V.I., V.M.A., and S.S.; methodology, M.L.Z., R.V.I. and V.M.A.; software, F.O.V. and C.(B.)S.; validation, M.L.Z., V.M.A. and F.O.V. formal analysis, S.S.; investigation, F.O.V. and C.(B.)S.; resources, F.O.V. and C.(B.)S.; data curation M.L.Z.; writing—original draft preparation, M.L.Z. and R.V.I.; writing—review and editing, S.S.; visualization, V.M.A.; supervision, R.I.V.; project administration, S.S. All authors have read and agreed to the published version of the manuscript.
Funding
This work was supported by the project "Excellence, performance and competitiveness in the Research, Development and Innovation activities at "Dunarea de Jos" University of Galati", acronym "EXPERT", financed by the Romanian Ministry of Research and Innovation in the framework of Programme 1—Development of the national research and development system, Sub-programme 1.2—Institutional Performance—Projects for financing excellence in Research, Development and Innovation, Contract no. 14PFE/17.10.2018.
Conflicts of Interest
The authors declare no conflict of interest.
Appendix A
| Year | Holding | Soil | PH | Soy | Nsp | Nb | Q | MMB | U | G | η(Q) | η(Q,U,G) | η(Q*P,U,G) |
| 2017 | 1 | 3 | 4 | 1 | 432 | 34 | 6683 | 45.5 | 12.9 | 98 | 1.00282683 | 1.053971 | 1091.77167 |
| 2017 | 1 | 3 | 4 | 2 | 424 | 34 | 6473 | 44.9 | 13 | 93 | 0.97229077 | 0.97229077 | 975.513912 |
| 2017 | 1 | 3 | 4 | 3 | 472 | 32 | 6373 | 42.2 | 12.7 | 92 | 0.96442481 | 0.95767384 | 946.004585 |
| 2017 | 1 | 3 | 4 | 4 | 430 | 32 | 5724 | 41.6 | 14 | 94 | 0.8669102 | 0.8669102 | 769.140065 |
| 2017 | 1 | 3 | 4 | 5 | 467 | 30 | 6024 | 43 | 13 | 95 | 0.91222687 | 0.93047141 | 868.799764 |
| 2017 | 1 | 3 | 4 | 6 | 410 | 32 | 5812 | 44.3 | 13.2 | 98 | 0.87345115 | 0.91537681 | 824.626349 |
| 2017 | 1 | 3 | 4 | 7 | 421 | 30 | 6062 | 48 | 12.8 | 97 | 0.90811416 | 0.94625496 | 889.110622 |
| 2017 | 1 | 3 | 4 | 8 | 456 | 34 | 6184 | 39.9 | 12 | 95 | 0.92843508 | 0.95628814 | 916.621304 |
| 2017 | 1 | 3 | 4 | 1 | 419 | 34 | 6482 | 45.5 | 13 | 98 | 0.96387719 | 1.01207105 | 1043.07888 |
| 2018 | 1 | 3 | 4 | 2 | 432 | 34 | 6301 | 42.9 | 12.4 | 97 | 0.93984301 | 0.98307579 | 984.903323 |
| 2018 | 1 | 3 | 4 | 3 | 489 | 34 | 6966 | 41.9 | 11.7 | 96 | 1.03916209 | 1.08384606 | 1200.46139 |
| 2018 | 1 | 3 | 4 | 4 | 470 | 30 | 5569 | 39.5 | 13 | 96 | 0.8428058 | 0.86808997 | 768.668493 |
| 2018 | 1 | 3 | 4 | 5 | 603 | 30 | 7380 | 40.8 | 11.8 | 94 | 1.10995887 | 1.13437797 | 1331.10179 |
| 2018 | 1 | 3 | 4 | 6 | 504 | 32 | 6951 | 43.1 | 12.6 | 94 | 1.03924064 | 1.05379001 | 1164.6582 |
| 2018 | 1 | 3 | 4 | 7 | 521 | 30 | 7282 | 46.6 | 12.4 | 97 | 1.0886145 | 1.13869077 | 1318.41945 |
| 2018 | 1 | 3 | 4 | 8 | 596 | 32 | 7590 | 39.8 | 11.8 | 94 | 1.14386507 | 1.1690301 | 1410.79721 |
| 2017 | 2 | 2 | 1 | 1 | 446 | 34 | 6505 | 42.9 | 12.4 | 99 | 0.97496033 | 1.03930771 | 1047.90799 |
| 2017 | 2 | 2 | 1 | 2 | 419 | 32 | 5765 | 43 | 12.8 | 94 | 0.86727108 | 0.87767833 | 784.271416 |
| 2017 | 2 | 2 | 1 | 3 | 477 | 32 | 6564 | 43 | 12.2 | 96 | 0.98427474 | 1.02167718 | 1039.47479 |
| 2017 | 2 | 2 | 1 | 4 | 461 | 32 | 6211 | 42.1 | 13 | 96 | 0.93257925 | 0.96055663 | 924.732667 |
| 2017 | 2 | 2 | 1 | 5 | 614 | 30 | 7792 | 42.3 | 13.4 | 98 | 1.17238209 | 1.22631167 | 1481.09018 |
| 2017 | 2 | 2 | 1 | 6 | 434 | 32 | 5875 | 42.3 | 13.8 | 94 | 0.88438046 | 0.88614922 | 806.949635 |
| 2017 | 2 | 2 | 1 | 7 | 460 | 34 | 7038 | 45 | 12.8 | 98 | 1.04788033 | 1.10237011 | 1202.56453 |
| 2017 | 2 | 2 | 1 | 8 | 408 | 32 | 5366 | 41.1 | 12.4 | 95 | 0.8084866 | 0.82950725 | 689.926065 |
| 2017 | 2 | 2 | 1 | 1 | 467 | 34 | 6796 | 42.8 | 12.2 | 97 | 1.01160332 | 1.06016027 | 1145.57103 |
| 2018 | 2 | 2 | 1 | 2 | 470 | 34 | 6887 | 43.1 | 12.2 | 96 | 1.02508121 | 1.0640343 | 1165.15267 |
| 2018 | 2 | 2 | 1 | 3 | 491 | 34 | 7095 | 42.5 | 12 | 96 | 1.05767846 | 1.0999856 | 1240.89926 |
| 2018 | 2 | 2 | 1 | 4 | 472 | 32 | 6343 | 42 | 12 | 98 | 0.95199216 | 1.00911169 | 1017.72648 |
| 2018 | 2 | 2 | 1 | 5 | 662 | 30 | 8262 | 41.6 | 13.2 | 96 | 1.24402553 | 1.27885824 | 1679.98236 |
| 2018 | 2 | 2 | 1 | 6 | 618 | 32 | 7930 | 40.1 | 13 | 96 | 1.20026431 | 1.23627224 | 1558.77858 |
| 2018 | 2 | 2 | 1 | 7 | 614 | 30 | 8086 | 43.9 | 12.8 | 94 | 1.22901024 | 1.24375836 | 1599.06779 |
| 2018 | 2 | 2 | 1 | 8 | 579 | 32 | 7578 | 40.9 | 11.8 | 92 | 1.1606627 | 1.16298403 | 1401.28178 |
| 2017 | 3 | 3 | 2 | 1 | 449 | 34 | 6549 | 42.9 | 13.2 | 98 | 1.00151488 | 1.0495876 | 1065.43112 |
| 2017 | 3 | 3 | 2 | 2 | 429 | 36 | 6532 | 42.3 | 13.6 | 96 | 0.99648335 | 1.02039895 | 1033.11312 |
| 2017 | 3 | 3 | 2 | 3 | 432 | 34 | 6477 | 44.1 | 13.8 | 98 | 0.98907924 | 1.03062057 | 1034.67606 |
| 2017 | 3 | 3 | 2 | 4 | 430 | 32 | 5986 | 43.5 | 12.8 | 96 | 0.91842317 | 0.94781272 | 879.409072 |
| 2017 | 3 | 3 | 2 | 5 | 477 | 32 | 6700 | 43.9 | 13.2 | 94 | 1.02416601 | 1.03235934 | 1072.10517 |
| 2017 | 3 | 3 | 2 | 6 | 444 | 30 | 5927 | 44.5 | 12.8 | 99 | 0.91041516 | 0.9668609 | 888.240606 |
| 2017 | 3 | 3 | 2 | 7 | 430 | 32 | 6054 | 44 | 13 | 94 | 0.9235459 | 0.93278136 | 875.294042 |
| 2017 | 3 | 3 | 2 | 8 | 513 | 34 | 7081 | 40.6 | 13.6 | 98 | 1.0779267 | 1.12535548 | 1235.13953 |
| 2017 | 3 | 3 | 2 | 1 | 469 | 34 | 6825 | 42.9 | 12.8 | 98 | 1.03911422 | 1.09314816 | 1186.25706 |
| 2018 | 3 | 3 | 2 | 2 | 434 | 34 | 6183 | 42.3 | 12.6 | 97 | 0.9447281 | 0.98629613 | 969.624771 |
| 2018 | 3 | 3 | 2 | 3 | 474 | 34 | 6978 | 44.1 | 13.2 | 98 | 1.06114653 | 1.11208156 | 1233.85672 |
| 2018 | 3 | 3 | 2 | 4 | 435 | 32 | 6041 | 43.5 | 12.6 | 97 | 0.92537896 | 0.96609563 | 927.953211 |
| 2018 | 3 | 3 | 2 | 5 | 654 | 30 | 8220 | 43.9 | 13 | 93 | 1.262339 | 1.262339 | 1649.85183 |
| 2018 | 3 | 3 | 2 | 6 | 580 | 30 | 6870 | 44.5 | 12.6 | 93 | 1.07539852 | 1.07970011 | 1179.38882 |
| 2018 | 3 | 3 | 2 | 7 | 551 | 32 | 7599 | 44 | 11.8 | 90 | 1.18144832 | 1.16018225 | 1401.77976 |
| 2018 | 3 | 3 | 2 | 8 | 526 | 34 | 7225 | 40.6 | 13.2 | 90 | 1.13613272 | 1.09977648 | 1263.39572 |
| 2017 | 4 | 3 | 3 | 1 | 419 | 36 | 6652 | 44.1 | 13.8 | 99 | 1.04615986 | 1.10056017 | 1134.74357 |
| 2017 | 4 | 3 | 3 | 2 | 413 | 36 | 6453 | 43.4 | 13.6 | 98 | 1.0193479 | 1.0641992 | 1064.42801 |
| 2017 | 4 | 3 | 3 | 3 | 415 | 34 | 5983 | 42.4 | 14 | 97 | 0.95159482 | 0.98014266 | 908.949997 |
| 2017 | 4 | 3 | 3 | 4 | 425 | 32 | 5725 | 42.1 | 12.8 | 96 | 0.91165235 | 0.94082522 | 834.86478 |
| 2017 | 4 | 3 | 3 | 5 | 560 | 30 | 7022 | 41.8 | 13.4 | 97 | 1.11525377 | 1.15540291 | 1257.55208 |
| 2017 | 4 | 3 | 3 | 6 | 430 | 30 | 5495 | 42.6 | 13.8 | 98 | 0.88183105 | 0.91886795 | 782.622808 |
| 2017 | 4 | 3 | 3 | 7 | 509 | 32 | 7264 | 44.6 | 13.8 | 96 | 1.14304188 | 1.1681888 | 1315.28714 |
| 2017 | 4 | 3 | 3 | 8 | 384 | 32 | 4927 | 40.1 | 12.6 | 93 | 0.79490515 | 0.79808477 | 609.485364 |
| 2017 | 4 | 3 | 3 | 1 | 435 | 36 | 6749 | 43.1 | 13.2 | 97 | 1.0480941 | 1.08792167 | 1167.43896 |
| 2018 | 4 | 3 | 3 | 2 | 407 | 36 | 6300 | 43 | 12.8 | 98 | 0.98612123 | 1.03739953 | 1039.16311 |
| 2018 | 4 | 3 | 3 | 3 | 417 | 34 | 5969 | 42.1 | 12.6 | 96 | 0.93748427 | 0.96935874 | 919.990269 |
| 2018 | 4 | 3 | 3 | 4 | 422 | 30 | 5266 | 41.6 | 12 | 95 | 0.82557282 | 0.85034001 | 711.984584 |
| 2018 | 4 | 3 | 3 | 5 | 552 | 32 | 8002 | 45.3 | 13 | 95 | 1.18961176 | 1.21340399 | 1543.83574 |
| 2018 | 4 | 3 | 3 | 6 | 435 | 28 | 5042 | 41.4 | 12.8 | 96 | 0.81524067 | 0.84132837 | 674.474442 |
| 2018 | 4 | 3 | 3 | 7 | 484 | 32 | 6628 | 42.8 | 12.2 | 90 | 0.97036846 | 0.94902035 | 1000.12699 |
| 2018 | 4 | 3 | 3 | 8 | 513 | 34 | 6977 | 40 | 12 | 90 | 0.99628657 | 0.97636084 | 1083.11906 |
Where: PH—soil acidity scale; Nsp—average number of ears per square meter; Nb—average number of grains in wheat; Q—production; MMB, U—moisture function; G—germination function; η(Q)—the productive yield; η(Q,U,G)—the qualitative productive yield; η(Q*P,U,G)—the economic efficiency.
References
- European Parliament. European Parliament resolution on our life insurance, our natural capital: An EU biodiversity strategy to 2020 (2011/2307(INI)). Publ. Off. EU 2011, 2020, 17. [Google Scholar]
- Cosmulese, C.G.; Ciubotariu, M. An Overall Analysis on the Implementation of European Funds in Romania. In Proceedings of the International Business Information Management Conference 30th IBIMA, Madrid, Spain, 8–9 November 2017; pp. 5732–5742. [Google Scholar]
- DG Agriculture and Rural Development. “Eurostat,” Comext Data. 2020. Available online: https://ec.europa.eu/info/food-farming-fisheries/farming/facts-and-figures/markets/overviews/market-observatories/crops/cereals-statistics_en (accessed on 19 May 2020).
- Eurostat. Economic Accounts for Agriculture (Values at Current Producer Prices). 2019. Available online: https://appsso.eurostat.ec.europa.eu/nui/show.do?dataset=aact_eaa01&lang=en (accessed on 9 March 2020).
- Bostan, I.; Mates, D.; Grosu, V.; Socoliuc, M. Implications Of Fiscality Over Accounting In Agriculture. Bull. Univ. Agric. Sci. Vet. Med. Cluj-Napoca Hortic. 2008, 65, 53–58. [Google Scholar]
- Cosmulese, C.G. A literature review of articles assessing the extent of compliance with IAS 41. Eur. J. Account. Finianc. Bus. 2019, 20. Available online: http://accounting-management.ro/index.php?pag=showcontent&issue=20&year=2019 (accessed on 19 May 2020).
- United Nations. Transforming our world: The 2030 Agenda for Sustainable Development. United nations general assembly, A/70/L.1. 2015. Available online: https://www.un.org/ga/search/view_doc.asp?symbol=A/RES/70/1&Lang=E (accessed on 21 October 2015).
- Guerry, A.D.; Polasky, S.; Lubchenco, J.; Chaplin-Kramer, R.; Daily, G.C.; Griffin, R.; Ruckelshaus, M.; Bateman, I.J.; Duraiappah, A.; Elmqvist, T.; et al. Natural capital and ecosystem services informing decisions: From promise to practice. Proc. Natl. Acad. Sci. USA 2015, 112, 7348–7355. [Google Scholar] [CrossRef] [PubMed]
- Dace, E.; Muizniece, I.; Blumberga, A.; Kaczala, F. Searching for solutions to mitigate greenhouse gas emissions by agricultural policy decisions—Application of system dynamics modeling for the case of Latvia. Sci. Total Environ. 2015, 527–528, 80–90. [Google Scholar] [CrossRef] [PubMed]
- Wolfert, S.; Ge, L.; Verdouw, C.; Bogaardt, M.-J. Big Data in Smart Farming—A review. Agric. Syst. 2017, 153, 69–80. [Google Scholar] [CrossRef]
- Ďurišová, M.; Tokarčíková, E.; Virlanuta, F.O.; Chodasová, Z. The Corporate Performance Measurement and Its Importance for the Pricing in a Transport Enterprise. Sustainability 2019, 11, 6164. [Google Scholar] [CrossRef]
- Aiello, G.; Giovino, I.; Vallone, M.; Catania, P.; Argento, A. A decision support system based on multisensor data fusion for sustainable greenhouse management. J. Clean. Prod. 2018, 172, 4057–4065. [Google Scholar] [CrossRef]
- Florea, A.-M.; Bercu, F.; Radu, R.I.; Stanciu, S. A Fuzzy Set Qualitative Comparative Analysis (fsQCA) of the Agricultural Cooperatives from South East Region of Romania. Sustainability 2019, 11, 5927. [Google Scholar] [CrossRef]
- Antle, J.M.; Basso, B.; Conant, R.T.; Godfray, H.C.J.; Jones, J.W.; Herrero, M.; Howitt, R.E.; Keating, B.A.; Munoz-Carpena, R.; Rosenzweig, C.; et al. Towards a new generation of agricultural system data, models and knowledge products: Design and improvement. Agric. Syst. 2017, 155, 255–268. [Google Scholar] [CrossRef] [PubMed]
- Yan, B.; Shi, S.; Ye, B.; Zhou, X.; Shi, P. Sustainable development of the fresh agricultural products supply chain through the application of RFID technology. Inf. Technol. Manag. 2015, 16, 67–78. [Google Scholar] [CrossRef]
- Speelman, E.N.; García-Barrios, L.E.; Groot, J.C.J.; Tittonell, P. Gaming for smallholder participation in the design of more sustainable agricultural landscapes. Agric. Syst. 2014, 126, 62–75. [Google Scholar] [CrossRef]
- Triste, L.; Marchand, F.; Debruyne, L.; Meul, M.; Lauwers, L. Reflection on the development process of a sustainability assessment tool: Learning from a Flemish case. Ecol. Soc. 2014, 19, 47. [Google Scholar] [CrossRef]
- Cosmulese, C.G.; Socoliuc, M.; Ciubotariu, M.S.; Mihaila, S.; Grosu, V. An empirical analysis of stakeholders’ expectations and integrated reporting quality. Econ. Res. Ekon. Istraživanja 2019, 32, 3963–3986. [Google Scholar] [CrossRef]
- Gocsik, E.; Saatkamp, H.W.; De Lauwere, C.C.; Lansink, A.O. A Conceptual Approach for a Quantitative Economic Analysis of Farmers’ Decision-Making Regarding Animal Welfare. J. Agric. Environ. Ethics 2014, 27, 287–308. [Google Scholar] [CrossRef]
- Sivertsson, O.; Tell, J. Barriers to business model innovation in Swedish agriculture. Sustainability 2015, 7, 1957–1969. [Google Scholar] [CrossRef]
- Mateş, D.; Grosu, V. Evaluating and recognising biological assets and agricultural activities according to IAS 41. Lucr. Stiintifice Seria Agron. 2008, 51, 457–462. [Google Scholar]
- Ďurišová, M.; Tokarčíková, E.; Kucharčíková, A. The Decomposition of the Result of the Business Transformation Process in the Value Terms. Procedia Econ. Financ. 2015, 30, 213–225, ISSN 2212-5671. [Google Scholar] [CrossRef][Green Version]
- Tadeu, P.; Paiva, T. Gamentship—An Innovative Project to Improve Entrepreneurship Competences. Procedia Soc. Behav. Sci. 2015, 174, 1829–1833, ISSN 1877-0428. [Google Scholar] [CrossRef][Green Version]
- BASF. BASF Agricultural Solutions România. In Cultura Grâului—Când Semănăm Grâul, Tehnologii, Tratamente și Îngrășăminte; Available online: https://www.agro.basf.ro/ro/stiri/fermier-in-romania/cultura-grauluicand-semanam-graul-tratamente-ingrasaminte.html (accessed on 27 April 2017).
- Cotidianul Agricol. Consumatorii și fermierii europeni doresc o producție de alimente mai sustenabi. In Cotidianul Agricol; 2019; Available online: https://www.cotidianulagricol.ro/consumatorii-si-fermierii-europeni-doresc-o-productie-de-alimente-mai-sustenabila/ (accessed on 6 September 2019).
- Elefterie, A. PREȚ GRÂU 2017. Ce oferte primesc fermierii și ce indică BURSELE! In Agrointeligenta; Available online: https://agrointel.ro/85448/pret-grau-2017-ce-oferte-primesc-fermierii-si-ce-indica-bursele/ (accessed on 11 September 2017).
- Agrointeligenta.ro. BURSA CEREALELOR 2018: Prețul grâului ÎN PORTUL CONSTANȚA, similar cu cel din Franța! Informaţiile publicate de Agrointeligența—AGROINTEL.RO pot fi preluate doar în limita a 500 de caractere şi cu citarea în PRIMUL PARAGRAF a sursei cu LINK ACTIV. Orice. In Agrointeligenta; Available online: https://agrointel.ro/99437/bursa-cerealelor-2018-pretul-graului-in-portul-constanta/ (accessed on 22 June 2018).
© 2020 by the authors. Licensee MDPI, Basel, Switzerland. This article is an open access article distributed under the terms and conditions of the Creative Commons Attribution (CC BY) license (http://creativecommons.org/licenses/by/4.0/).