Abstract
Background: Chemical Intolerance (CI), Autism Spectrum Disorder (ASD) and Attention Deficit Hyperactive Disorder (ADHD) are conditions with rising incidence rates not fully explained by greater awareness or changes in diagnostic practices. It is now generally accepted that the interaction between genetic and environmental exposures plays a role in all of these conditions. Prior studies show that these conditions co-occur. This study seeks to explore previous findings using an international sample. Methods: A five-country (N = 5000) stratified panel survey was used to assess self-reported CI in themselves, and ASD and ADHD in their children. A generalized linear model was used to estimate Odds Ratios. Age- and sex-adjusted logistic models used CI as a predictor of ASD and ADHD in separate models. Results: Compared to those classified as Low CI, High levels of CI were associated with greater Odds Ratios (OR) of reporting a child with ASD and ADHD in all countries except Japan. Italy, India, and the USA had over twice the OR of reporting a child with ASD. Mexico had over 1.9 times the OR. The results with ADHD are similar to the ASD results. Conclusions: The results of this study are consistent with two prior U.S. studies, showing an association between ASD and ADHD among women who have CI. However, cross-cultural comparisons, especially prevalence estimates for ASD and ADHD, cannot be interpreted as epidemiologic rates due to serious limitations of the survey methodology. No causal relationship should be inferred from this study.
1. Introduction
Chemical Intolerance (CI) is characterized by individuals presenting with adverse multi-system symptoms that are initiated either by a one-time high-dose exposure or persistent low-dose exposures to environmental toxicants [1,2]. New-onset intolerances are often triggered by subsequent exposures to structurally unrelated chemicals [3,4], foods [5,6], and/or drugs [7]. Symptoms may include combinations of fatigue, headache, mood changes, weakness, rash, dizziness, musculoskeletal pain, gastrointestinal disturbance, cognitive difficulties, and respiratory problems [1,2,8,9].
Different population-based surveys yield differing prevalence estimates depending on whether CI is clinically diagnosed (prevalence estimates between 0.5 and 6.5%) or self-reported (up to ~20+%) [10,11,12,13,14]. Explaining these rates differences points to the diagnostic complexity of CI differences in prevalence, which are thought to be due to, among other things, a lack of a universally accepted case definition and the use of different diagnostic assessment tools [2,15].
The persistent lack of confirmed pathogenic mechanisms and varied non-specific, multi-system symptoms, and/or the wide variety of specific triggers to explain CI has historically led some health practitioners and researchers to accept a psychogenic theory of the condition, or at best, the more neutral descriptive term “medically unexplained symptoms” or “idiopathic environment-associated disease” [16]. There remains an ongoing debate in the literature about whether the symptoms of CI are purely physical (e.g., neurogenic inflammation) or influenced by psychogenic factors (e.g., classical conditioning or hypervigilance). These issues make clear diagnostic pathways difficult and contentious [2,16]. The theories and controversies surrounding CI are well-covered in Zucco and Doty [2]
Linking CI assessment to ongoing studies of neurodegenerative disease biology may eventually resolve the impasse over the psychogenic vs. biological explanations for CI [2]. Addressing the biological aspects of CI is highly relevant because (1) the prevalence of CI has been shown to be increasing globally [17,18,19,20], and (2) the broad social/economic burden is substantial (e.g., reduced workforce participation, disability and financial hardship, social isolation, high healthcare costs) [21,22].
Autism Spectrum Disorder (ASD) and Attention Deficit Hyperactive Disorder (ADHD)
Both ASD and ADHD are common behaviorally defined neurodevelopmental disorders characterized by deficits in language, communication, sensory processing, and social function [23,24]. Prevalence estimates for ASD range from 1 in 30–44 U.S. births, with an estimated global prevalence of 1 per 100 children [25,26,27]. Worldwide, ADHD affects approximately 6% of youth and 2.5% of adults [28]. There is substantial overlap between autism and ADHD, with their co-occurrence estimated to be between 28% and 78% [29]. Other comorbidities include asthma, allergies, diabetes mellitus—immune and metabolic disorders [30,31,32,33,34,35,36].
Over the last 30 years, ASD and ADHD prevalence in the U.S. has undergone substantial increases, which cannot be fully explained by increased awareness, better access to healthcare, broadened diagnostic criteria, and/or better diagnostic practices [37,38]. ASD and ADHD share many biological irregularities with CI. Key mechanisms linking CI to ASD/ADHD involve the limbic and immune system (chronic inflammation) metabolic dysfunction through oxidative stress [39,40,41,42,43,44,45].
Study Purpose: In two different population surveys conducted in the United States, it has previously been reported that CI was associated with over three times the odds of having a child with either ASD or ADHD [46,47]. However, it should be noted that the inherent limitations of these self-reported cross-sectional studies preclude any inference of causality. Notwithstanding, since there is an increasing prevalence of CI, ASD, and ADHD globally, the purpose of this study is to explore this association using an international sample in order to test the universality vs. cultural contingency of the CI–ASD/ADHD link. Confirming this association in this sample would then justify future studies involving the investigation of several unknown potential biological mechanisms, including maternal vulnerabilities, shared endophenotypes, or perhaps as a proxy for environmental load.
2. Materials and Methods
Participants were recruited in 2020 from May 18th to the 20th through Dynata, a global, research-literate, multilingual data collection firm that provides recruitment services for academic and industry researchers (www.dynata.com) (accessed on 1 December 2025). Dynata adheres to the European Society for Opinion and Marketing Research code of conduct. This was an observational cross-sectional stratified panel survey consisting of five countries (the United States, India, Japan, Italy, and Mexico). Dynata performed survey translation, including back-translation, for each country.
Invitations to participate included emails, phone alerts, online banners, and community-site messaging, designed to reach individuals with diverse motivations for participating in research. Weighted randomization was used to assign surveys to participants. A review of the data was performed to ensure that answers were logical and not random responses, with additional logic checks built into the script to ensure participants could not continue if they tried to submit illogical answers. Overuse of item non-responses (e.g., ‘Don’t Know’) were identified and removed from the final data during quality checks.
Our sample was collected through the stratification of approximately equal numbers of participants (N = 1000) across three age bands: 18 to 34 years old, 35 to 54, and 55 and older, and by sex for approximately equal numbers of males and females. Respondents needed to be at least 18 years old. The study’s purpose was explained to participants who were informed that the survey would be anonymous. Consent was obtained online before the survey was administered. This research program was approved by the University of Texas Health Science Center at San Antonio Internal Research Board, protocol number 20220246EX.
Sample survey: The Quick Environmental Exposure Survey Instrument (QEESI) has emerged as a well-validated, widely used instrument for assessing CI [2]. To date, researchers and clinicians in sixteen countries have used the QEESI, which offers high sensitivity and specificity for differentiating individuals with CI from the general population [48,49] (see Palmer et al., [19] for a recent listing of global studies using the QEESI. The QEESI is available at https://tiltresearch.org/self-assessment/) (assessed on 1 December 2025).
Respondents completed two scales (the Chemical Intolerance and Symptom Severity scales) of the Quick Environmental Exposure and Sensitivity Inventory (QEESI)—a 50-item, internationally validated questionnaire designed to assess the symptoms and chemical intolerances of various chemical, food, and drug exposures.
The QEESI consists of 4 scales and one index (Chemical Sensitivity, Symptom Severity, Life Impact, Other Intolerances, Masking Index), but only the Chemical Sensitivity and Symptom Severity scales are typically used to classify CI. The other scales are typically relevant in clinical practice. Each scale contains 10 items that are rated from 0 to 10 on a Likert scale: 0 = “not at all a problem” to 10 = “severe/disabling symptoms”. Total scores for each scale range from 0 to 100. Cut-off criteria for ‘High CI’ were scores ≥ 40 on both the Chemical Exposures and Symptom Severity scales. This is regarded as “very suggestive” of CI. Scores from 20 to 39 on one or both scales are considered “Medium or mid-level CI.” Scores less than 20 on both scales are classified as “Low CI”. These groupings were used for data analysis.
All respondents were asked two questions concerning their children: (1) “Has a doctor or health professional every told you that your child had Autism, Asperger’s disorder, pervasive developmental disorder, or autism spectrum disorder?” and (2) “Has a doctor or health professional every told your that your child has Attention Deficit Hyperactive Disorder or similar learning disability?” Of course, this applied to only those with children (N = 3172), and the number of children in the family was not assessed in this survey. These specific ASD/ADHD questions have been used by the National Institute of Health in other population surveys. Notwithstanding, it is emphasized here that these are parental self-reports regarding their assessment of any one of their children and are not clinically verified diagnoses and are used for associational statistical analysis purposes only, not epidemiological estimates.
Data Quality Control Checks: The 5000 survey records were assessed for data quality (DQ) encompassing completeness, validity, or accuracy concerns; four measures were required to exclude all surveys indicating one or more DQ concerns. Records with these concerns were excluded from the analytic data set. Table 1 presents the data quality exclusions by country. The United States sample had the largest data quality exclusions, whereas Mexico had the fewest.

Table 1.
Data quality (DQ) exclusions by country.
Analysis of the DQ-flagged surveys were shown to be biased toward younger, U.S. males. The DQ-removed data set is 1.2% more female than the complete data set (ranging from 0.27% more female in Italy to 2.6% more female in India). The DQ-removed data set is 1.9% older (larger portion of the 55 and older group). U.S. skewed heavily older, with a 5.2% older population, and Mexico was only 0.46% older. Overall, the percentage of reporting children did not change much between the DQ-removed data set and complete data set. However, India reported having 1.16% less children, while Japan reported 2.2% more reporting children. Although we recognize the potential biases of excluding DQ-flagged surveys, we believe there is greater accuracy by excluding the problematic responses rather than using the whole sample. We have taken this approach to help improve some well-known DQ concerns associated with web-based surveys, including response probabilities and biases [50,51]. Stability and sensitivity analyses with and without the DQ-flagged surveys show negligible impact on the model’s results.
Figure 1 depicts the flow of data exclusions leading to the final analytic data set. Some of the DQ measures might technically be accurate (e.g., “male and breast implants”), but with an abundance of caution, they were excluded. The same could be said for the survey time measure: with a survey containing 40 questions, it is unlikely that a respondent could read and respond accurately to all questions in under two minutes. By omitting any records that violated one or more DQ measures, 604 records were excluded (12.1%)
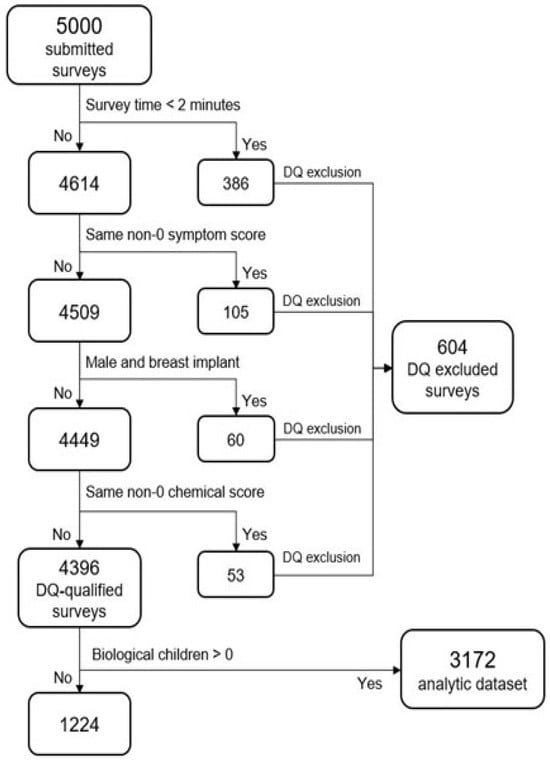
Figure 1.
Data flow exclusions.
QEESI Reliability by Country: Internal consistency of the two QEESI scales (Chemical Intolerance and Symptom Severity) was assessed using Cronbach’s alpha, calculated by country to evaluate scale reliability across cultural contexts.
Statistical Modeling: Although quasi-separation was not identified, low cell sizes for ASD and ADHD were identified by country in the three-level CI grouping in the Low and Medium categories. To alleviate this, CI was used as a binary variable: High CI (coded 1) combined with the Low and Mid CI classes (coded 0). This creates a “High CI” category and a “Low CI” Category with reasonable cell sizes.
A generalized linear model with a binomial distribution and logit link was used to estimate the association between High CI and ASD and ADHD. Because ASD and ADHD have a high comorbidity potential, they were run as outcomes in separate models and, therefore, were not adjusted for each other to avoid confounding. Respondents who reported having no children were excluded from the model. The model follows the functional form in Equation (1):
where Logit(p) = log (P/1−p) represents the odds of y = 1 (ASD or ADHD present) versus y = 0 (condition absent). CI class (High vs. Low) served as the primary binary predictor X1. Additional covariates Xi included age category and sex. Income was not measured due to difficulties in harmonizing an appropriate SES level across countries. ASD and ADHD were used as outcomes in separate models. Given the potential for small-sample bias or separation in logistic models with categorical predictors, all models were estimated using Firth’s penalized likelihood method, which applies a bias-reducing Jeffreys-prior penalty to the score function [52,53]. This approach produces finite and more stable parameter estimates in the presence of spare cells or quasi-complete separation. Firth-adjusted estimates were obtained using the Bias-Adjusted parameterization in JMP 18.2 (SAS Institute) [54].
Logit (p|x) = α + β1X1 + βiXi… + e
To detect an Odds Ratio of at least 2.0, assume that α = 0.05, 95% power, and that other covariates contribute r2 = 0.2; N = 225 is required. With an analytic N = 4396, this study is well-powered to detect smaller effect sizes, notwithstanding some data cells may be too sparse to claim this kind of power.
3. Results
Sample age and sex: For the total sample, Table 2 shows that age and sex categories were reasonably evenly distributed. There were no sex distribution differences across countries. There were, however, significant age distribution differences across countries. India and Mexico reported a greater percentage of younger respondents, and a fewer percentage of those over 65 years old compared to Italy, Japan, and the U.S. Further associated with age was having a child with ASD or ADHD. Reporting to have a child with ASD or ADHD decreased rapidly as age categories increased—with a distinct linear association for India and the U.S (see Supplement Figures S1 and S2 for ASD and ADHD graphs, respectively). This age-group effect was evident across all countries except Japan.
Table 2.
Sample demographics across countries.
QEESI Reliability by Country: The reliability of the QEESI was first presented by Miller and Prihoda (1999) [48,49] In this study, both QEESI scales showed high reliability across all national samples (Table 3). Cronbach’s alpha values for the Chemical Intolerance scale ranged from 0.92 (Mexico) to 0.94 (Japan, USA), and alphas for the Symptom Severity scale ranged from 0.90 (Mexico) to 0.95 (India). These values are similar to previous studies in the USA, Japan [55], Sweden [56] and Denmark [57], and indicate good internal consistency across countries.
Table 3.
Cronbach’s alpha scores for the Chemical Intolerance and Symptom Severity scales by country.
Chemical Intolerance: Figure 2 depicts the distribution of CI across countries. Across all countries, most respondents reported Mid or High CI levels compared to those for Low CI. Across all countries, the reported percentage of High CI is greater than that of Low CI with wider discrepancies in India, Japan, and Italy compared to Mexico and the U.S.
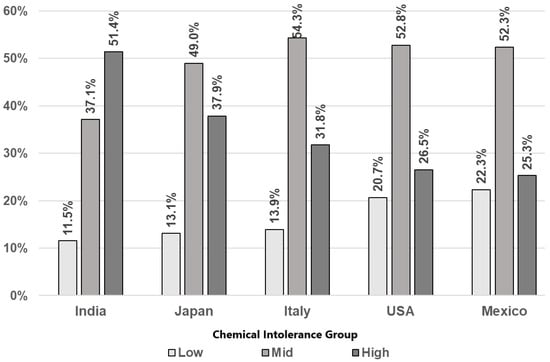
Figure 2.
Rates of Chemical Intolerance class by country.
ASD/ADHD: Figure 3 and Table 4 depict the rates of families reporting at least one child with ASD and ADHD for each country by CI category. Despite a wide range of differing rates between groups, the reported rates of ASD and ADHD show similar patterns across all countries. Those in the highest CI category report higher ASD and ADHD rates than those in the Mid group, which in turn show higher rates than the Low CI group (see Figure 3 and Table 4). This pattern was most pronounced in India, the United States, and Mexico.
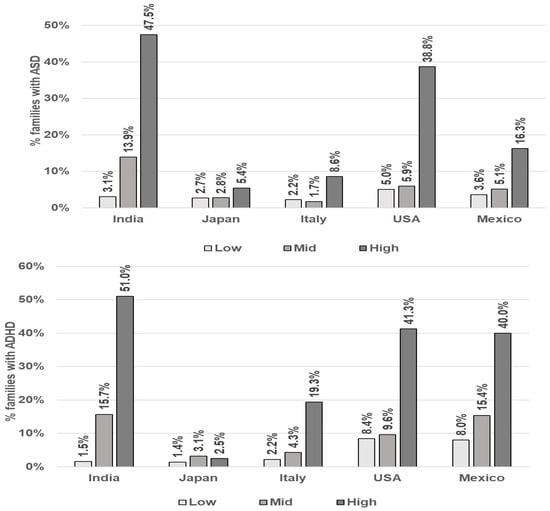
Figure 3.
Rates of parental self-reporting of at least one child with ASD and ADHD by Chemical Intolerance Class and Country.
Table 4.
Rates of maternal self-reports reporting of at least one child with ASD and ADHD by Chemical Intolerance class and country.
Table 5 shows the Odds Ratios (OR) and 95% Confidence Intervals of reporting at least one child with ASD and ADHD as a function of CI by country. The pattern of association between CI category and reporting at least one child with ASD and ADHD are similar. Compared to the Low CI category, the High CI category has significantly greater odds of reporting a child with ASD and ADHD. This was observed in all countries except Japan. Generally, sex is not a significant predictor, and younger-aged respondents have higher odds of reporting at least one child with ASD or ADHD (India, Italy, and the USA). Mexico was the only country showing a significant association between female respondents and reporting at least one child with ASD. The female demographic was not significant in any of the ADHD models.
Table 5.
Odds Ratios for CI predicting parental self-reported family-level ASD and ADHD by country.
Due to the high reporting of at least one child with ASD/ADHD in India, we conducted a sensitivity analysis by removing India from the data set. The sensitivity analysis did not change the p-values for the High CI estimates (p < 0.0001) and only negligibly lowered OR estimates (about −0.2 in ASD, and −0.1 in ADHD).
4. Discussion
The reported rates of CI, ASD, and ADHD varied considerably across countries, and it important to understand that these data cannot be used to estimate actual prevalence. The many methodological and cultural reasons for this are discussed in more depth in the limitations section below. Foremost, due to a failure to collect family size (number of children), the unit of measure of ASD/ADHD is at the family level. This measure is the per family incidence of ASD/ADHD. Secondly, ASD/ADHD were not clinically verified but based solely on parental self-report.
Having CI and child ASD/ADHD all self-reported in the same survey introduces a potential shared method variance and may influence a general tendency to endorse health and environmental problems. This could plausibly account for some of the observed associations.
Notwithstanding, the primary focus of these analyses is the consistent pattern between the degree of CI and its association with ASD/ADHD. In all countries, the High CI severity group had substantially higher odds of reporting a child with ASD/ADHD than the Low CI severity group. These findings are consistent with two prior U.S. studies showing a similar significant association between ASD/ADHD and CI [46,47]. Nevertheless, the associational studies cannot be interpreted as causal associations until proper longitudinal studies are completed.
Study Limitations:
1. We relied on parental self-reports to assess ASD, ADHD and CI. Verified diagnoses should be conducted through expert clinical behavioral observation and interview assessment. It is important to consider this limitation and that the rates reported in this study are family-level rates (that is, at least one child is reported as having ASD/ADHD). This family rate is not comparable to global prevalence estimates (1–2%).
2. Two prior U.S. studies with different survey methodologies demonstrated that those with CI had a 3-fold increased probability for reporting a child with ASD/ADHD. However, the methodologies are not directly comparable. While the current study is the first to demonstrate an association in four other countries, there is no other evidence in the literature to compare this association in other countries with similar methods.
3. It is also likely that other unmeasured confounding factors that influence CI itself contribute to the associations we found with ASD/ADHD in this study. Perhaps the most prominent likely confounder in this study is the failure to adjust for socioeconomic status (SES or education). This exclusion is problematic because it is well-documented that differing levels of SES can affect CI and ASD diagnosis, exposure to environmental chemicals, chronic stress and access to healthcare. The omission of collecting SES and education in our analysis has most likely affected our results. Our data cannot address any effects of a potential spurious relationship with SES. While our results are consistent with prior studies, this study should be considered as another preliminary step in understanding the association between CI and ASD/ADHD
4. The parent-reported family-level ASD rates in this study far exceed global prevalence estimates (1–2%), raising concerns about survey validity. The survey was self-reported for both CI and maternal reports of child ASD/ADHD. This shared method variance could artificially inflate our found association. This could introduce response-style biases due to personality traits, or a respondent’s idea about the intended relationship between variables; for example, consistently using extreme ends of a response scale for all questions or responding to questions based on mood, health anxiety, or hypersensitivities rather than the responding to the specific content of the question.
5. Reliance on an online platform for recruitment is likely to contribute to sampling bias by excluding populations with low education levels or limited digital access. This could undermine the generalizability of findings, particularly in low-resource settings. As described in the Data Quality Control Checks section, precautions were taken to mitigate known data-quality concerns associated with web-based surveys, including response probability and related biases [50,51].
Further, the use of online invitations to participate (emails, phone alerts, online banners, and community-site messaging) rather than pulling from established research panels could lead to a biased pool of respondents who are interested in the subject area of research (CI/ASD/ADHD). As such, respondent interest could have influenced some portions of the family-level reports. Future studies should strongly consider the impact of this influence.
6. Cultural heterogeneity: Back-translation of the survey was performed; however, it is unknown how the distinct cultural norms and symptom-reporting practices in each country affect the results. Cultural validation procedures such as cognitive interviewing were not conducted. For example, Japan’s data reflects specific cultural sampling biases, including a likely social stigma reporting bias. Cross-cultural differences in survey response styles show that Asians tend to respond more modestly and demonstrate more middle-level items on Likert scales then Westerners [58,59,60,61] (as seen in the Supplementary Figure S3).
This assertion was examined in our data using the QEESI item responses. Indeed, we found Japan’s responses to be consistent with Wang et al. [61], where respondents from Japan stand out as choosing middle responses. This cultural phenomenon is depicted in Supplementary Figure S3.
Similarly, among all countries in this study, other unknown cross-cultural reporting biases, sociocultural diagnostic differences, differential base rates, and other measurement artifacts severely limit cross-cultural comparison. Therefore, because ASD prevalence differs drastically by nation, Odds Ratios are not directly comparable without reference to a baseline. Given the limitations, no causal interpretation can be inferred, and cross-cultural generalizability of this study should be conducted cautiously.
7. The cross-sectional design prevents distinguishing whether CI precedes or co-occurs with the recognition of a child’s diagnosis. These confounders and potential interactions have yet to be understood and could be explored in future studies.
Future Directions: Given these limitations presented above, the results of this study cannot be used to understand the biomechanics, directionality of the association, or to directly inform public policy. This will require future studies to utilize carefully planned experimental or clinical trials, rather than survey-based assessments, as in this study. Understanding the causation between the association of CI and ASD/ADHD would require a deeper understanding of the shared biological mechanisms involved.
As such, future studies might investigate plausible multi-omics biomechanisms involving the complexity of gene–environment interactions (G × E) and epigenetic modulation [62], which are now regarded as the most probable explanation for most idiopathic ASD cases [63,64,65]. This is especially pertinent since known autism genes selectively target metabolic clearance proficiency for pesticides, heavy metals, bisphenol A, and phthalates, which are already known as endocrine disruptors and neurotoxins [66]. The biological risks of toxic exposure profiles are multifaceted and synergistic, involving oxidative stress, mitochondrial dysfunction, and systemic immune activation [67,68].
The specific environmental and biological mechanisms underlying ASD, ADHD, and CI remain poorly understood and likely vary substantially across individuals. Therefore, future studies would need to focus on a deeper understanding of the biologically mediated effects of toxic exposures. These kinds of studies would be needed to properly inform public policy or guide regulation of environmental toxicants [69,70].
Our study did not assess indoor or outdoor air quality; nevertheless, based on the broader literature, we feel it important to mention that one potential area for future investigations may involve outdoor air quality. Systematic review studies confirm an association between outdoor air pollution and ASD [71,72,73,74]. Relevant to this, we conducted a post hoc analysis where we investigated the idea that countries with high degrees of air pollution would have higher rates of ASD compared to countries with lower air pollution.
Inspection of Figure 4 shows that India is among the countries with the worst air quality and highest autism rates. India also had the highest CI rates in this study. Interesting, Italy and Japan, which did not report as large of a percentage between CI and ASD as the other countries, ranked among the countries with better air quality and lower rates of ASD. Certainly, interpretation of this ecological data cannot be extrapolated to the individual level [75]. Notwithstanding, based upon the broader IAQ and health literature, the association between CI, ASD/ADHD, and air quality (both indoor and outdoor) warrants further investigation to inform recommendations for public health policy [69,70].
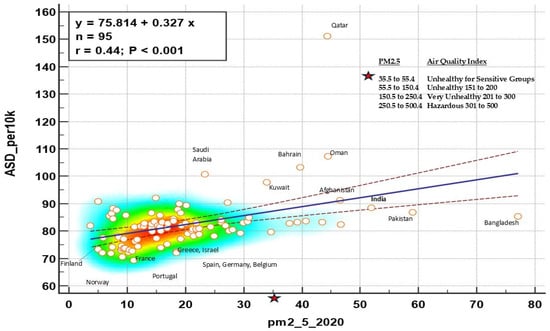
Figure 4.
Global rates of ASD by PM2.5 Air Quality Index. Lines correspond to the regression line with 95% confidence intervals, circles are countries,
Poor indoor air quality (IAQ) may also be considered for future studies. Poor IAQ can lead to oxidative stress and inflammation processes related to neurological and fetal health [76,77,78,79,80,81]. The sources of poor IAQ (PM2.5) are volatile organic compound sources that include cooking with gas, pesticides, personal care/cleaning products, chemicals from new construction materials/furniture, mold, use of incense, candles, and pet allergens. Two recent studies have demonstrated that interventions designed to reduce symptom severity among participants with CI were successful [82,83].
5. Conclusions
This international study is consistent with two prior U.S. studies that also demonstrate increased reported ASD/ADHD rates reported among those with High CI. This similar pattern observed over the countries is the takeaway message of this study. The widely varying rates of CI, ASD, and ADHD by country should not obfuscate this connection between CI and ASD/ADHD. As noted above in the limitations section, there are various methodological issues that prevent us from drawing any conclusions about cross-country prevalence rate comparisons.
This association between CI and ASD/ADHD is not fully understood. There remain key unanswered questions concerning the biological mediating or moderating mechanisms. There are many biological pathways that differ across individuals. During pregnancy and early childhood, all developing organ systems may be vulnerable to a variety of toxic exposures. Though specific mechanisms are unknown, based on broader literature, a precautionary principle may be used as a first intervention step. Whether a mother has CI or not, expecting parents may be advised to reduce toxicant exposure by identifying and limiting household xenobiotics such as chemicals in the air, food, drugs, water, or construction materials that may potentially trigger biological processes underlying CI and ASD/ADHD.
Supplementary Materials
The following supporting information can be downloaded at: https://www.mdpi.com/article/10.3390/jox16010005/s1, Figure S1: Maternal self-reported ASD by age category and country; Figure S2: Maternal self-reported ADHD by age category and country. Figure S3: Frequency of responses on the QEESI Chemical and Symptom Scales by country.
Author Contributions
R.F.P. and D.K. conceived of the project and ran data analysis. R.F.P. and D.K. wrote and edited all manuscript drafts. All authors have read and agreed to the published version of the manuscript.
Funding
This research was funded by the Marylynn Brachman Hoffman Foundation, Fort Worth, TX.
Institutional Review Board Statement
The study was conducted in accordance with the Declaration of Helsinki and approved by the Institutional Review Board of University of Texas Health Science Center at San Antonio Internal Research Board, protocol number 20220246EX on 15 May 2020.
Informed Consent Statement
Informed consent was obtained from all subjects involved in the study.
Data Availability Statement
The data presented in this study are openly available in the UTHSCSA data repository at https://dataverse.tdl.org/dataverse/ci (accessed on 1 December 2025).
Conflicts of Interest
Author David Kattari was employed by the company Kattari Consulting. The remaining author declared that the research was conducted in the absence of any commercial or financial relationships that could be construed as a potential conflict of interest.
List of Abbreviations
| CI | Chemical Intolerance |
| QEESI | Quick Environmental Exposure Survey Instrument |
| BREESI | Brief Environmental Exposure Survey Instrument |
| MCS | Multiple Chemical Sensitivity |
| ASD | Autism Spectrum Disorder |
| ADHD | Attention Deficit Hyperactive Disorder |
| IAQ | Indoor Air Quality |
| G × E | Gene–environment interactions |
References
- Ashford, N.A.; Miller, C.S. Chemical Exposures: Low Levels and High Stakes; Van Nostrand Reinhold: New York, NY, USA, 1991. [Google Scholar]
- Zucco, G.M.; Doty, R.L. Multiple chemical sensitivity. Brain Sci. 2022, 12, 46. [Google Scholar] [CrossRef]
- Rossi, S.; Pitidis, A. Multiple Chemical Sensitivity: Review of the State of the Art in Epidemiology, Diagnosis, and Future Perspectives. J. Occup. Environ. Med. 2018, 60, 138–146. [Google Scholar] [CrossRef]
- Steinemann, A. National prevalence and effects of multiple chemical sensitivities. J. Occup. Environ. Med. 2018, 60, e152–e156. [Google Scholar] [CrossRef]
- Young, E.; Stoneham, M.D.; Petruckevitch, A.; Barton, J.; Rona, R. A population study of food intolerance. Lancet 1994, 343, 1127–1130. [Google Scholar] [CrossRef]
- Rona, R.J.; Keil, T.; Summers, C.; Gislason, D.; Zuidmeer, L.; Sodergren, E.; Sigurdardottir, S.T.; Lindner, T.; Goldhahn, K.; Dahlstrom, J.; et al. The prevalence of food allergy: A meta-analysis. J. Allergy Clin. Immunol. 2007, 120, 638–646. [Google Scholar] [CrossRef]
- Macy, E. Chapter 16–Multiple Drug Intolerance Syndrome. In Drug Allergy Testing; Khan, D.A., Banerji, A., Eds.; Elsevier: Amsterdam, The Netherlands, 2018; pp. 165–168. ISBN 9780323485517. [Google Scholar] [CrossRef]
- Miller, C.S. The compelling anomaly of chemical intolerance. Ann. N. Y. Acad. Sci. 2001, 933, 1–23. [Google Scholar] [CrossRef]
- Genuis, S.J. Sensitivity-related illness: The escalating pandemic of allergy, food intolerance and chemical sensitivity. Sci. Total Environ. 2010, 408, 6047–6061. [Google Scholar] [CrossRef]
- Azuma, K.; Uchiyama, I.; Katoh, T.; Ogata, H.; Arashidani, K.; Kunugita, N. Prevalence and Characteristics of Chemical Intolerance: A Japanese Population-Based Study. Arch. Environ. Occup. Health 2015, 70, 341–353. [Google Scholar] [CrossRef] [PubMed]
- Bell, I.R.; Schwartz, G.E.; Peterson, J.M.; Amend, D. Self-reported illness from chemical odors in young adults without clinical syndromes or occupational exposures. Arch. Environ. Health 1993, 48, 6–13. [Google Scholar] [CrossRef] [PubMed]
- Caress, S.M.; Steinemann, A.C. Prevalence of multiple chemical sensitivities: A population-based study in the southeastern United States. Am. J. Public Health 2004, 94, 746–747. [Google Scholar] [CrossRef] [PubMed]
- Kreutzer, R.; Neutra, R.R.; Lashuay, N. Prevalence of people reporting sensitivities to chemicals in a population-based survey. Am. J. Epidemiol. 1999, 150, 1–12. [Google Scholar] [CrossRef]
- Hempel, S.; Zhang, D.; Robinson, K.A.; Yagyu, S.; Miles, J.; Motala, A.; Tolentino, D.; Akbari, O.; Danz, M.; Johnston, J. Multiple chemical sensitivity (MCS) validity, prevalence, tools and interventions: Systematic review protocol. BMJ Open 2025, 15, e088136. [Google Scholar] [CrossRef]
- Martini, A.; Iavicoli, S.; Corso, L. Multiple Chemical Sensitivity and the Workplace: Current Position and Need for an Occupational Health Surveillance Protocol. Oxidative Med. Cell. Longev. 2013, 2013, 351457. [Google Scholar] [CrossRef]
- Shillaker, J.; Gibson, C.; Churchill, J. Healthcare experiences of people living with medically unexplained symptoms: A systematic review. Br. J. Nurs. 2024, 33, 256–261. [Google Scholar] [CrossRef]
- Rometsch, C.; Mansueto, G.; Maas Genannt Bermpohl, F.; Martin, A.; Cosci, F. Prevalence of functional disorders across Europe: A systematic review and meta-analysis. Eur. J. Epidemiol. 2024, 39, 571–586. [Google Scholar] [CrossRef]
- Steinemann, A. International prevalence of chemical sensitivity, co-prevalences with asthma and autism, and effects from fragranced consumer products. Air Qual. Atmos. Health 2019, 12, 519–527. [Google Scholar] [CrossRef]
- Palmer, R.F.; Walker, T.; Kattari, D.; Rincon, R.; Perales, R.B.; Jaén, C.R.; Grimes, C.; Sundblad, D.R.; Miller, C.S. Validation of a Brief Screening Instrument for Chemical Intolerance in a Large U.S. National Sample. Int. J. Environ. Res. Public Health 2021, 18, 8714. [Google Scholar] [CrossRef]
- Hojo, S.; Mizukoshi, A.; Azuma, K.; Okumura, J.; Ishikawa, S.; Miyata, M.; Mizuki, M.; Ogura, H.; Sakabe, K. Survey on changes in subjective symptoms, onset/trigger factors, allergic diseases, and chemical exposures in the past decade of Japanese patients with multiple chemical sensitivity. Int. J. Hyg. Environ. Health 2018, 221, 1085–1096. [Google Scholar] [CrossRef]
- Driesen, L.; Patton, R.; John, M. The impact of multiple chemical sensitivity on people’s social and occupational functioning; a systematic review of qualitative research studies. J. Psychosom. Res. 2020, 132, 109964. [Google Scholar] [CrossRef] [PubMed]
- Ahrendt Bjerregaard, A.; Schovsbo, S.U.; Gormsen, L.K.; Skovbjerg, S.; Eplov, L.F.; Linneberg, A.; Cedeño-Laurent, J.G.; Jørgensen, T.; Dantoft, T.M. Social economic factors and the risk of multiple chemical sensitivity in a Danish population-based cross-sectional study: Danish Study of Functional Disorders (DanFunD). BMJ Open 2023, 13, e064618, Erratum in BMJ Open 2023, 13, e064618corr1. https://doi.org/10.1136/bmjopen-2022-064618corr1.. [Google Scholar] [CrossRef] [PubMed]
- American Psychiatric Association. Diagnostic and Statistical Manual of Mental Disorders, 5th ed.; American Psychiatric Association: Arlington, VA, USA, 2013. [Google Scholar]
- Bell, A.S. A critical review of ADHD diagnostic criteria: What to address in the DSM-V. J. Atten. Disord. 2011, 15, 3–10. [Google Scholar] [CrossRef]
- Maenner, M.J.; Warren, Z.; Williams, A.R.; Amoakohene, E.; Bakian, A.V.; Bilder, D.A.; Durkin, M.S.; Fitzgerald, R.T.; Furnier, S.M.; Hughes, M.M.; et al. Prevalence and Characteristics of Autism Spectrum Disorder Among Children Aged 8 Years—Autism andDevelopmental Disabilities Monitoring Network, 11 Sites, United States, 2020. MMWR Surveill. Summ. 2023, 72, 1–14. [Google Scholar]
- Li QLi YLiu BChen QXing, X.; Xu, G.; Yang, W. Prevalence of Autism Spectrum Disorder Among Children and Adolescents in the United States from 2019 to 2020. JAMA Pediatr. 2022, 176, 943–945. [Google Scholar] [CrossRef]
- Zeidan, J.; Fombonne, E.; Scorah, J.; Ibrahim, A.; Durkin, M.S.; Saxena, S.; Yusuf, A.; Shih, A.; Elsabbagh, M. Global prevalence of autism: A systematic review update. Autism Res. 2022, 15, 778–790. [Google Scholar] [CrossRef] [PubMed]
- Willcutt, E.G. The prevalence of DSM-IV attention-deficit/hyperactivity disorder: A meta-analytic review. Neurotherapeutics 2012, 9, 490–499. [Google Scholar] [CrossRef] [PubMed]
- Lecavalier, L.; McCracken, C.E.; Aman, M.G.; McDougle, C.J.; McCracken, J.T.; Tierney, E.; Smith, T.; Johnson, C.; King, B.; Handen, B.; et al. An exploration of concomitant psychiatric disorders in children with autism spectrum disorder. Compr. Psychiatry 2019, 88, 57–64. [Google Scholar] [CrossRef] [PubMed]
- Hanć, T. ADHD as a risk factor for obesity. Current state of research. Psychiatr. Pol. 2018, 52, 309–322. [Google Scholar]
- Tistarelli, N.; Fagnani, C.; Troianiello, M.; Stazi, M.A.; Adriani, W. The nature and nurture of ADHD and its comorbidities: A narrative review on twin studies. Neurosci. Biobehav. Rev. 2020, 109, 63–77. [Google Scholar] [CrossRef]
- Ronan, V.; Yeasin, R.; Claud, E.C. Childhood Development and the Microbiome-The Intestinal Microbiota in Maintenance of Health and Development of Disease During Childhood Development. Gastroenterology 2021, 160, 495–506. [Google Scholar] [CrossRef]
- Zeng, Y.; Tang, Y.; Yue, Y.; Li, W.; Qiu, X.; Hu, P.; Tang, J.; Wang, H.; Yang, X.; Qu, Y.; et al. Cumulative evidence for association of parental diabetes mellitus and attention-deficit/hyperactivity disorder. Neurosci. Biobehav. Rev. 2020, 117, 129–139. [Google Scholar] [CrossRef]
- Han, V.X.; Patel, S.; Jones, H.F.; Dale, R.C. Maternal immune activation and neuroinflammation in human neurodevelopmental disorders. Nat. Rev. Neurol. 2021, 17, 564–579. [Google Scholar] [CrossRef]
- Katzman, M.A.; Bilkey, T.S.; Chokka, P.R.; Fallu, A.; Klassen, L.J. Adult ADHD and comorbid disorders: Clinical implications of a dimensional approach. BMC Psychiatry 2017, 17, 302. [Google Scholar] [CrossRef] [PubMed]
- Faraone, S.V.; Banaschewski, T.; Coghill, D.; Zheng, Y.; Biederman, J.; Bellgrove, M.A.; Newcorn, J.H.; Gignac, M.; Al Saud, N.M.; Manor, I.; et al. The World Federation of ADHD International Consensus Statement: 208 Evidence-based conclusions about the disorder. Neurosci. Biobehav. Rev. 2021, 128, 789–818. [Google Scholar] [CrossRef]
- Hertz-Picciotto, I.; Delwiche, L. The rise in autism and the role of age at diagnosis. Epidemiology 2009, 20, 84–90. [Google Scholar] [CrossRef] [PubMed]
- Yoo, H.J. Recent increase in autism and ADHD: True or inflated? J. Korean Med. Sci. 2013, 28, 974–975. [Google Scholar] [CrossRef]
- Meng, Y.; Jia, J.; Ding, Y.; Wang, P.; Wang, Z.; Zhang, R.; He, Z.; Wang, Z.; Zhang, H.; Feng, L.; et al. Characterizing immune and metabolic profiles in autism spectrum disorder through combined transcriptomics-metabonomics analysis. J. Psychiatr. Res. 2025, 190, 92–101. [Google Scholar] [CrossRef] [PubMed]
- State, M.W.; Šestan, N. Neuroscience. The emerging biology of autism spectrum disorders. Science 2012, 337, 1301–1303. [Google Scholar] [CrossRef]
- Marcelli, I.; Capece, U.; Caturano, A. Bridging ADHD and Metabolic Disorders: Insights into Shared Mechanisms and Clinical Implications. Diabetology 2025, 6, 40. [Google Scholar] [CrossRef]
- Kaushal, P.S.; Saran, B.; Bazaz, A.; Tiwari, H. A brief review of limbic system anatomy, function, and its clinical implication. Santosh Univ. J. Health Sci. 2024, 10, 26–32. [Google Scholar] [CrossRef]
- Grace, A.A. Psychostimulant actions on dopamine and limbic system function: Relevance to the pathophysiology and treatment of ADHD. Stimul. Drugs ADHD Basic Clin. Neurosci. 2001, 5, 134–157. [Google Scholar]
- Liu, X.; Lin, J.; Zhang, H.; Khan, N.U.; Zhang, J.; Tang, X.; Cao, X.; Shen, L. Oxidative stress in autism spectrum disorder—Current progress of mechanisms and biomarkers. Front. Psychiatry 2022, 13, 813304. [Google Scholar] [CrossRef]
- Kuźniar-Pałka, A. The role of oxidative stress in autism spectrum disorder pathophysiology, diagnosis and treatment. Biomedicines 2025, 13, 388. [Google Scholar] [CrossRef] [PubMed]
- Heilbrun, L.P.; Palmer, R.F.; Jaen, C.R.; Svoboda, M.D.; Perkins, J.; Miller, C.S. Maternal chemical and drug intolerances: Potential risk factors for autism and attention deficit hyperactivity disorder (ADHD). J. Am. Board Fam. Med. 2015, 28, 461–470. [Google Scholar] [CrossRef]
- Palmer, R.F.; Kattari, D.; Rincon, R.; Miller, C.S. Assessing Chemical Intolerance in Parents Predicts the Risk of Autism and ADHD in Their Children. J. Xenobiotics 2024, 14, 350–367. [Google Scholar] [CrossRef]
- Miller, C.S.; Prihoda, T.J. The Environmental Exposure and Sensitivity Inventory (EESI): A standardized approach for measuring chemical intolerances for research and clinical applications. Toxicol. Ind. Health 1999, 15, 370–385. [Google Scholar] [CrossRef]
- Miller, C.S.; Prihoda, T.J. A controlled comparison of symptoms and chemical intolerances reported by Gulf War veterans, implant recipients and persons with multiple chemical sensitivity. Toxicol. Ind. Health 1999, 15, 386–397. [Google Scholar] [CrossRef]
- Couper, M. Web surveys: A review of issues and approaches. Public Opin. Q. 2000, 64, 464–494. [Google Scholar] [CrossRef]
- Biffignandi, S.; Bethlehem, J. Handbook of Web Surveys; John Wiley & Sons, Inc.: Hoboken, NJ, USA, 2021. [Google Scholar]
- Firth, D. Bias reduction of maximum likelihood estimates. Biometrika 1993, 80, 27–38. [Google Scholar] [CrossRef]
- Heinze, G.; Schemper, M. A solution to the problem of separation in logistic regression. Stat. Med. 2002, 21, 2409–2419. [Google Scholar] [CrossRef] [PubMed]
- JMPR Pro, Version 15.0.0 1989–2019; SAS Institute Inc.: Cary, NC, USA, 2019. Available online: https://www.scirp.org/reference/referencespapers?referenceid=2843737 (accessed on 17 February 2024).
- Hojo, S.; Kumano, H.; Yoshino, H.; Kakuta, K.; Ishikawa, S. Application of Quick Environment Exposure Sensitivity Inventory (QEESI) for Japanese population: Study of reliability and validity of the questionnaire. Toxicol. Ind. Health 2003, 19, 41–49. [Google Scholar] [CrossRef] [PubMed]
- Nordin, S.; Andersson, L. Evaluation of a Swedish version of the Quick Environmental Exposure and Sensitivity Inventory. Int. Arch. Occup. Environ. Health 2010, 83, 95–104. [Google Scholar] [CrossRef]
- Skovbjerg, S.; Berg, N.D.; Elberling, J.; Christensen, K.B. Evaluation of the quick environmental exposure and sensitivity inventory in a Danish population. J. Environ. Public Health 2012, 2012, 304314. [Google Scholar] [CrossRef]
- Hui, C.H.; Triandis, H.C. Effects of culture and response format on extreme response style. J. Cross Cult. Psychol. 1989, 20, 296–309. [Google Scholar] [CrossRef]
- Chun, K.-T.; Campbell, J.B.; Yoo, J.H. Extreme response style in cross-cultural research: A reminder. J. Cross-Cult. Psychol. 1974, 5, 465–480. [Google Scholar] [CrossRef]
- Clarke, I. Extreme response style in cross-cultural research. Int. Mark. Rev. 2001, 18, 301–324. [Google Scholar] [CrossRef]
- Wang, R.; Hempton, B.; Dugan, J.P.; Komives, S.R. Cultural Differences: Why Do Asians Avoid Extreme Responses? Surv. Pract. 2008, 1. [Google Scholar] [CrossRef]
- Cavalli, G.; Heard, E. Advances in epigenetics link genetics to the environment and disease. Nature 2019, 571, 489–499. [Google Scholar] [CrossRef]
- Bhandari, R.; Paliwal, J.K.; Kuhad, A. Neuropsychopathology of Autism Spectrum Disorder: Complex Interplay of Genetic, Epigenetic, and Environmental Factors. Adv. Neurobiol. 2020, 24, 97–141. [Google Scholar]
- Keil-Stietz, K.; Lein, P.J. Gene× environment interactions in autism spectrum disorders. Curr. Top. Dev. Biol. 2023, 152, 221–284. [Google Scholar]
- Lipkin, W.I.; Bresnahan, M.; Susser, E. Cohort-guided insights into gene–environment interactions in autism spectrum disorders. Nat. Rev. Neurol. 2023, 19, 118–125. [Google Scholar] [CrossRef]
- Carter, C.J.; Blizard, R.A. Autism genes are selectively targeted by environmental pollutants including pesticides, heavy metals, bisphenol A, phthalates and many others in food, cosmetics or household products. Neurochem. Int. 2016, 101, 83–109. [Google Scholar] [CrossRef]
- Frye, R.E.; Rincon, N.; McCarty, P.J.; Brister, D.; Scheck, A.C.; Rossignol, D.A. Biomarkers of mitochondrial dysfunction in autism spectrum disorder: A systematic review and meta-analysis. Neurobiol. Dis. 2024, 197, 106520. [Google Scholar] [CrossRef]
- Frye, R.E.; Cakir, J.; Rose, S.; Delhey, L.; Bennuri, S.C.; Tippett, M.; Melnyk, S.; James, S.J.; Palmer, R.F.; Austin, C.; et al. Prenatal air pollution influences neurodevelopment and behavior in autism spectrum disorder by modulating mitochondrial physiology. Mol. Psychiatry 2021, 26, 1561–1577. [Google Scholar] [CrossRef]
- Molot, J.; Sears, M.; Anisman, H. Multiple chemical sensitivity: It’s time to catch up to the science. Neurosci. Biobehav. Rev. 2023, 151, 105227. [Google Scholar] [CrossRef]
- Time for the exposome to shape policy. Nat. Med. 2025, 31, 2823. [CrossRef]
- Chun, H.; Leung, C.; Wen, S.W.; McDonald, J.; Shin, H.H. Maternal exposure to air pollution and risk of autism in children: A systematic review and meta-analysis. Environ. Pollut. 2020, 256, 113307. [Google Scholar] [CrossRef]
- Imbriani, G.; Panico, A.; Grassi, T.; Idolo, A.; Serio, F.; Bagordo, F.; De Filippis, G.; De Giorgi, D.; Antonucci, G.; Piscitelli, P.; et al. Early-Life Exposure to Environmental Air Pollution and Autism Spectrum Disorder: A Review of Available Evidence. Int. J. Environ. Res. Public Health 2021, 18, 1204. [Google Scholar] [CrossRef]
- Ojha, S.K.; Amal, H. Air pollution: An emerging risk factor for autism spectrum disorder. Brain 2024, 1, 4. [Google Scholar] [CrossRef]
- Yang, C.; Zhao, W.; Deng, K.; Zhou, V.; Zhou, X.; Hou, Y. The association between air pollutants and autism spectrum disorders. Environ. Sci. Pollut. Res. 2017, 24, 15949–15958. [Google Scholar] [CrossRef]
- Lin, C.-K.; Chang, Y.-T.; Lee, F.-S.; Chen, S.-T.; Christiani, D. Association between exposure to ambient particulate matters and risks of autism spectrum disorder in children: A systematic review and exposure-response meta-analysis Environ. Res. Lett. 2021, 16, 063003. [Google Scholar] [CrossRef]
- Schwartz, S. The fallacy of the ecological fallacy: The potential misuse of a concept and the consequences. Am J. Public Health 1994, 84, 819–824. [Google Scholar] [CrossRef] [PubMed] [PubMed Central]
- NIEHS. Available online: https://www.niehs.nih.gov/health/topics/agents/indoor-air (accessed on 1 December 2025).
- Maung, T.Z.; Bishop, J.E.; Holt, E.; Turner, A.M.; Pfrang, C. Indoor Air Pollution and the Health of Vulnerable Groups: A Systematic Review Focused on Particulate Matter (PM), Volatile Organic Compounds (VOCs) and Their Effects on Children and People with Pre-Existing Lung Disease. Int. J. Environ. Res. Public Health 2022, 19, 8752. [Google Scholar] [CrossRef]
- Salonen, H.; Salthammer, T.; Castagnoli, E.; Täubel, M.; Morawska, L. Cleaning products: Their chemistry, effects on indoor air quality, and implications for human health. Environ. Int. 2024, 190, 108836. [Google Scholar] [CrossRef] [PubMed]
- Vardoulakis, S.; Giagloglou, E.; Steinle, S.; Davis, A.; Sleeuwenhoek, A.; Galea, K.S.; Dixon, K.; Crawford, J.O. Indoor Exposure to Selected Air Pollutants in the Home Environment: A Systematic Review. Int. J. Environ. Res. Public Health 2020, 17, 8972. [Google Scholar] [CrossRef] [PubMed]
- Kumar, P.; Singh, A.B.; Arora, T.; Singh, S.; Singh, R. Critical review on emerging health effects associated with the indoor air quality and its sustainable management. Sci. Total Environ. 2023, 872, 162163. [Google Scholar] [CrossRef] [PubMed]
- Rincón, R.; Perales, R.; Palmer, R.F.; Forster, J.F.; Hernandez, J.F.; Bayles, B.; Grimes, C.; Jaén, C.R.; Miller, C.S. Environmental house calls can reduce symptoms of chemical intolerance: A demonstration of personalized exposure medicine. Prim. Health Care Res. Dev. 2024, 25, e53. [Google Scholar] [CrossRef]
- Perales, R.B.; Palmer, R.F.; Rincon, R.; Viramontes, J.N.; Walker, T.T.; Jaén, C.R.; Miller, C.S. Does improving indoor air quality lessen symptoms associated with chemical intolerance? Prim. Health Care Res. Dev. 2022, 23, e3. [Google Scholar] [CrossRef]
Disclaimer/Publisher’s Note: The statements, opinions and data contained in all publications are solely those of the individual author(s) and contributor(s) and not of MDPI and/or the editor(s). MDPI and/or the editor(s) disclaim responsibility for any injury to people or property resulting from any ideas, methods, instructions or products referred to in the content. |
© 2026 by the authors. Licensee MDPI, Basel, Switzerland. This article is an open access article distributed under the terms and conditions of the Creative Commons Attribution (CC BY) license.