Abstract
Microplastic pollution is a common problem in the coastal and marine environment, especially in the transferential process through trophic levels. This study analyzed the characteristics of microplastics in the seawater, sediments, and green mussels (Perna viridis) around Sri Racha Bay, Thailand, during the dry and wet season in 2020. This area is a semi-enclosed bay highly affected by extensive green mussel farms and anthropogenic activities. Qualitative and quantitative analysis of microplastics was undertaken using a stereomicroscope and micro-Fourier transform infrared spectrometer (ATR-μ-FT-IR). During the wet season (July), the average abundance of microplastics was found to be relatively higher in water (2.06 ± 1.78 particles/m3) and sediment (69.35 ± 22.29 items/Kg D.W.) than those found in the dry season (April) (0.85 ± 0.25 items/m3 in water and 48.30 ± 28.17 items/Kg D.W.). Overall, the most abundant microplastic polymers were PE, PP, and poly in water, but PE, nylon, and PP in sediments. In green mussels, microplastic counts were 0.15 ± 0.41 and 0.22 ± 0.57 items/individual in the dry and wet season, respectively, and PET, PP, and nylon were the three most abundant. Some inter-specific differences were found, but no evidence for a sampling sites or seasons was highlighted, although the tendency was higher during the wet season. The excessive riverine freshwater discharge transported terrestrial plastic debris into the estuarine system; hence, higher microplastic contamination in surface seawater and sediment was evidenced. The presence of colorants in organisms revealed an anthropogenic origin through the use of a wide array of applications. This study provides thoughtful insights for coastal area management and food-safety planning.
1. Introduction
Plastic debris in aquatic ecosystems has become a serious concern due to its high consumption and the high potential of accumulation by its long degradation time. Eventually, plastic debris can be broken down into smaller particles via photo-oxidative, chemical, and biological mechanisms [1,2,3,4]. These fragments are defined by sizes into nano-plastics (less than a few micrometers), microplastics (approximately less than 5 mm), and mesoplastics. Plastics and microplastics enter the marine and coastal environments by human activities such as fishing, tourism, marine transport, shipping, and industries [5,6] or from land to the sea through river discharge [7,8]. Of these, microplastics are the ones receiving close attention from various researchers due to their potential as a threat to marine lives. Some toxic pollutants can be adsorbed on the microplastic surface once in the marine environment [9,10,11]. Microplastics are likely to be taken up by marine organisms. When microplastics are ingested, additives and adsorbed chemicals can be released and pose potential risks to their health [12,13,14,15,16].
The distribution of microplastics has been reported in marine environments in many regimes, such as in water [17,18,19,20,21,22] and sediments [23,24,25]. Recent studies have shown that microplastics have been detected in a large number from marine species of various geographical areas and trophic levels [26,27,28,29,30,31,32]. Additionally, microplastics may be transferred along marine food webs [33,34]. Consequently, microplastic pollution has potentially threatened marine ecosystems and human health. Thus, it is significant to expand our knowledge of the occurrence, abundance, and effect of microplastics in marine ecosystems.
In Thailand, microplastic pollution has been reported in many areas, such as estuarine water at the Chaopraya River mouth [35], beaches [36,37], sediments in the urban estuary in Phuket Province [38], and marine organisms [31,39,40]. Unfortunately, the degree and evaluation of microplastics in coastal farming areas are rarely established and unclear. This issue needs to be addressed, and the possible transferential pathway of microplastics from surrounding to marine organisms must be determined.
Bivalves have been extensively used as a bio-indicator species for environmental monitoring for pollutants such as heavy metals, microplastics, and persistent organic pollutants due to their immobile nature, immense distribution, high tolerance towards contaminants, and the ability to filter a large volume of seawater. Moreover, bivalves, especially mussels, are directly connected with other marine predators on the higher trophic level, as well as human health. Green mussels (Perna viridis) are selected in this study because of their value economically as highly sought-after seafood in Thailand. Low prices and convenience can lead to a direct transfer of microplastics if green mussels are contaminated. The mussel is a filter feeder; therefore, its activities depend on the environment (water temperature, salinity, and currents) and the concentration of food particles in water. The ability to accumulate various pollutants makes green mussels reliable bio-indicators for marine pollution [41,42,43]. The cultivation of green mussels is highly extensive in Sri Racha Bay or the Sri Racha Coast, Chonburi Province, which is strategically located in the special economic zone of Thailand, namely the Eastern Economic Corridor (EEC). This area has been well-known for green mussel farming in Thailand for decades. The cultivation of green mussels is mainly undertaken by installing sea-floating rafts. While green mussel farming is crowded in marine areas, Sri Racha Bay is also terrestrially densely packed with surrounding land use, including residential areas, industrial zones, recreational spaces, and an entertainment estate. Hence, some previous studies demonstrated the corrosion of coastal water quality and heavy metal contamination around this area [44,45].
This research proposed to investigate the spatial and seasonal accumulation of microplastics in green mussels, seawater, and sediments around Sri Racha Bay. Understanding the microplastic contamination across seawater, coastal sediments, and the uptake in green mussels is the key to evaluating the ecological risk that microplastic pollution poses to ecological functions and human consumers. This study can contribute useful information and knowledge in understanding microplastic distribution in aquatic environments for further developing a coastal management plan.
2. Materials and Methods
2.1. Study Area and Sample Collection
The presence and distribution of microplastics in marine environments around Sri Racha Bay surface waters and sediment were evaluated during two seasons in 2020: April (dry season) and July (rainy or wet season). Samples were collected from 5 sampling stations located about 5 km further offshore and spanned 10 km along the coastline of Sri Racha Bay, Chonburi Province (Figure 1A). The five locations were selected based on different influential factors: location 1 (S1) is impacted by waste from the food factory, location 2 (S2) is the outburst of Sukhrep canal, which runs through coastal community area and starch factory, and location 3 (S3), location 4 (S4), and location 5 (S5) are influenced by community activities in coastal areas.
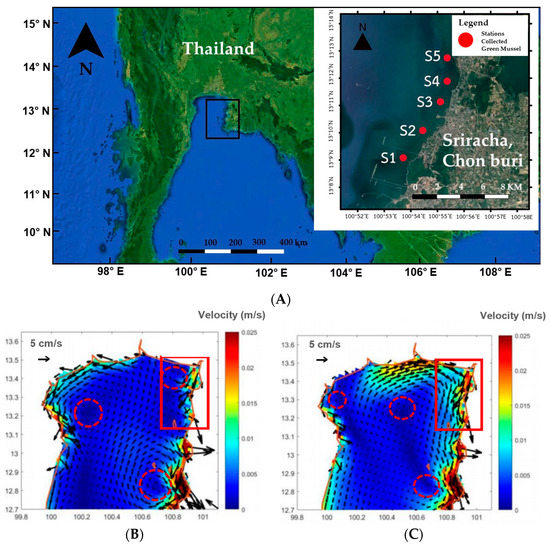
Figure 1.
(A) Sampling sites location in Sri Racha Bay, Thailand (B) Currents around the upper Gulf of Thailand in April (C) Currents around the upper Gulf of Thailand in July (Reprinted with permission from Lamsawat et al., 2020 [46]. 2022, Pakorn Lamsawat). Circles and frames show gyre and study area, respectively.
The hydrodynamics of Sri Racha Bay are complex and influenced by wind and tidal currents. The general trend of the current runs from the north to the south in the dry season and the opposite direction in the rainy season [46] (Figure 1B,C).
The level of microplastics from seawater and sediments also becomes a consideration in choosing the sampling location. A neuston net (75 cm in diameter, 300 cm in length, and 0.35 mm in mesh size), originally designed for sampling of zooplankton, fish larvae, and fish eggs near the sea surface, was used to collect mesoplastics and microplastics. A flowmeter was installed at the mouth of the neuston net to measure the water volume passing through during sampling. The neuston was deployed off the port side. The samplers were towed at a ship’s speed of 2–4 knots for 15 min in the upstream flow direction. Water characteristics, i.e., salinity and temperature, were documented and are listed in Table 1.

Table 1.
Microplastic abundance in seawater and sediments in Sri Racha Bay.
Three replications of sediment samples were taken by a stainless-steel Ekman grab sampler (6″ × 6″ × 6″). About 1–2 kg of wet sediments were collected and immediately kept in a clean container. Sediment samples were wrapped with an aluminum foil and stored in the freezer until further analysis in the laboratory.
A hundred green mussels were collected from each location. All mussels acquired were adult mussels (shell sizes of 2–9 cm) attached to cultivated rope at depths of 2 and 5 m. All green mussels were then stored in iceboxes to be transferred to the laboratory and kept in the freezer for analysis preparation.
2.2. Microplastic Extraction
2.2.1. Sea Water
Sea water samples were treated solely with wet peroxide oxidation to remove organic matter according to [35], with minor modifications. First, each sample was filtered through metal sieves (5 mm and 1 mm) to remove all natural or artificial litter objects with the larger size, and the residual particles on the sieve were stored and rinsed into a 50 mL glass bottle using the distilled water. All residual particles were dried in an oven, sorted using visual identification, and then identified. The filtered water sample was transferred into a 500 mL clean glass beaker. At first, 20 mL of 30% H2O2 was added, and the mixture was stirred by a magnetic stir bar on a hot plate at 60 °C for 30 min to digest the organic matter from the water sample. This step was repeated until the organic matter disappeared in the beaker. For the separation method, a NaCl solution was chosen, and prepared by dissolving 337 g of NaCl in 1000 mL of distilled water. We also performed the floatation method, where separation was achieved based on differences in density to produce samples to be visually analyzed using a stereomicroscope [47]. The NaCl solution was added to increase the density of the aqueous solution. After settling for 4 h, the supernatant was filtered under vacuum through a fiberglass Whatman filter (1.2 um pore size; 47 mm diameter) and nylon (330 μm mesh size). This process was repeated three times to increase the recovery rate of microplastics. The supernatant was filtered under vacuum through a fiberglass Whatman filter (1.2 um pore size; 47 mm diameter) and nylon (330 μm mesh size). This process was repeated three times. Following this, microplastics with filters were kept in an aluminum foil and dried in the oven at 60 °C. Finally, all samples were kept in glass petri dishes and covered with a glass lid for further analysis.
2.2.2. Sediments
Each sediment sample was placed in a glass beaker with deionized water and agitated with a metal spatula to isolate large clumps of sediment. Samples were dried at 60 °C in an oven for 24 h. The dried sample was placed in a glass beaker and 20 mL of 30% H2O2 and 20 mL of 0.05M iron (II) solution were added. The sediment solution was left at room temperature for 5 min, then was placed on a heating magnetic stirrer and heated to 60 °C for 30 min to increase the organic digesting rate. Following this, samples were settled about 4 h or until all visible organic materials disappeared. The separation and filtration processes were performed in the same manner as for the water samples.
2.2.3. Green Mussels
All samples were frozen at −20 °C until further laboratory analysis. Subsequently, after defrosting for 1 h, samples were washed with distilled water to remove large matter. Basic measurements (body length and wet weight) were recorded of each sample without byssus. Following this, each individual sample was dissected in a metal tray using a scalpel, forceps, and scissors. Samples were carefully removed from their shells to prevent contamination, and then immediately placed into clean beakers and covered with aluminum foil to minimize the risk of contamination.
In order to degrade organic matter and enable the detection of microplastic particles, samples were subjected to hydrogen peroxide digestion according to [42], with minor modifications. Initially, each sample was transferred into a 500 mL clean glass beaker. About 20 mL 10% KOH solution was added, and the mixture was stirred for 1 h to increase the organic matter digestion rate. Following this, 20 mL of 30% H2O2 was added, and the mixture was heated on a hot plate at 60 °C with a magnetic stirrer until H2O2 was evaporated. After 24 h, around 100 mL of the filtered NaCl solution was added, and the mixture was stirred for 5 min for density separation. After settling for 4 h, the sample was filtered under vacuum through filters (20 μm pore size; 47 mm diameter). This process was repeated three times to increase the recovery rate of microplastics. The filter was placed in Petri dishes and dried in an oven at 60 °C while being covered in aluminum foil. Finally, all samples were kept in the desiccator for further analysis. During the digestion procedures, three procedural blanks were also run without samples in parallel with samples containing the digestion solutions, and any particles detected in these blanks were characterized as contamination.
2.3. Identification of Microplastics
All potential microplastic particles were subjected to visual examination by the stereomicroscopy and identified by their colors and shapes. All plastic-like items from the samples were sorted and quantified by color (blue, black, white, yellow, red, and transparent), shape (fragments—irregular pieces; pellets—spherical and ovoid debris; fibers—thin and elongated pieces) with a stereomicroscope (Olympus SZ51). Polymer types were identified using a Fourier transform infrared microscopy system (μFT-IR; Spotlight 200i FT-IR microscopy system, PerkinElmer, Waltham, MA, USA) in reflection mode with 30 × 30 μm aperture size, using 24 scans and spectral resolution of 4 cm−1. Each spectrum was recorded after 4 accumulations ranging from 400 to 4000 cm−1. Following this, each obtained spectrum was compared to the polymer database (PerkinElmer Polymer database) and the type of plastic was determined when the research score was higher than 80%. The number of microplastics were expressed as particles/m3 in seawater, particles/Kg D.W. in sediments, and items/individual in mussel.
2.4. Contamination Control
Lab coats and gloves were always worn throughout the microplastic analysis to prevent contamination. Before working, the workplace was cleaned with 70% alcohol; all glassware was rinsed three times with distilled water and covered with aluminum foil before usage. The distilled water and saturated NaCl solution were filtered by a vacuum pump with a WHATMAN® GF/C filter (1.2 μm pore size; 47 mm diameter). For the blank test, 500 mL of filtered NaCl solution without any samples was used, following the extraction and separation procedure detailed above. Following this, the dried filters were observed under the stereomicroscope. There were no microplastics found in the blank-test filters, indicating that there was no microplastic contamination during the laboratory work.
2.5. Statistical Analysis
All results are presented as mean ± standard deviation of the mean (SD). The microplastic abundances in surface seawaters, sediments, and green mussels with the significant differences between the groups (locations and seasons) were determined by ANOVA and t-test (significance level at 0.05). Linear regressions were used to determine the relationship between microplastic in mussels, seawaters, and sediments. Additionally, Pearson correlation was used to determine the relationship between microplastic abundance from seawater and sediment samples, and mussel sizes and microplastic abundances. Statistical significance was accepted at p-value < 0.05. Statistical analyses were performed with SPSS Statistics 27.0 (IBM Corp., New York, NY, USA).
3. Results
3.1. Water
The present study evidenced higher salinity (31.08 ± 1.05 PSU) and water temperature (30.70 ± 0.53 °C) during the dry season and lower salinity (31.09 ± 0.47 PSU) and water temperature (30.38 ± 0.49 °C) during the wet season (Table 1). Microplastics were detected in all locations, but numbers ranged considerably from 0.69 to 1.22 particles/m3 in the dry season and from 0.57 to 5.04 particles/m3 seawater in the wet season. Results showed that average abundance of microplastics in the dry season (0.85 ± 0.25 particles/m3) was lower than that in the wet season (2.06 ± 1.78 particles/m3). The concentration of microplastics was highest at S2 in the dry season and S4 in the wet seasons. The density of microplastics in each station followed a descending order: S2 > S5 > S3 > S4 > S1 in the dry season and S4 > S5 > S1 > S2 > S3 in the wet season. There were eight colors found in the samples. Colors of particles varied widely, but transparent, white, and blue were the most common in water in all locations; meanwhile, red, green, yellow, and grey were observed in fewer contents (Figure 2A).
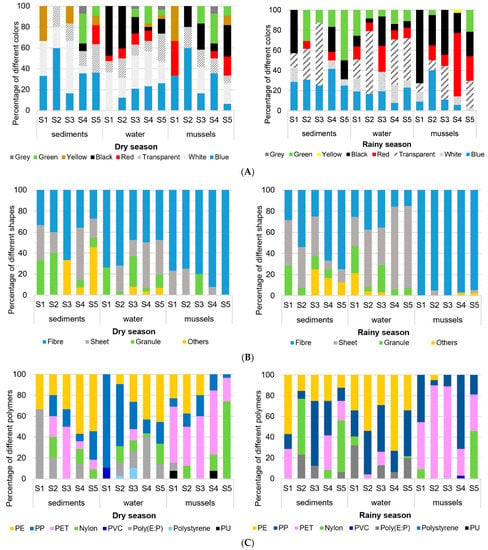
Figure 2.
Seasonal variation in relative composition of microplastics in sediments, water, and green mussels (Perna viridis) in five stations during the dry and rainy season around Sri Racha Bay, Thailand, according to color, shape, and polymer type. (A) Colors (B) Shapes (C) Polymer types.
The majority of identified particles in seawater were dominated by fibers (10.47 to 40.70%), sheets (0 to 55.88%), and granules (2.44 to 44%) (Figure 2B). That no pellets were found in this study suggests there are no primary microplastics in this area. A total of seven polymers were identified from all samples (Figure 2C). Polypropylene (6.45 to 32.85%) and polyethylene (0 to 66.39%) were commonly observed due to their extensive usage and ease of degradation. Others (PET, nylon, polystyrene, and PVC) were less prevalent. Primarily polystyrene was found at S2 and S3, and PVC was found at S1 only in the dry season. Interestingly, the statistic test showed no significant difference between the number of microplastics related to sample location and season.
3.2. Sediments
The number of microplastic particles observed at the different sampling stations in the Sri Racha Bay was presented in Table 1. The items ranged from 18.58 to 86.69 particles/Kg D.W. weight with average of 48.30 ± 28.17 particles/Kg D.W. in the dry season and from 43.34 to 99.07 particles/Kg D.W. with average of 69.35 ± 22.29 particles/Kg D.W. in the wet season. Polyethylene was the most common plastic type. Generally, the highest concentrations of microplastics were found at S4 in the dry season and S5 in the wet season, with concentrations of up to 86.69 and 99.07 items/Kg D.W., respectively.
The colors of the observed microplastics collected were white, transparent, black, grey, red, blue, yellow, and green. Figure 2A shows the proportion of microplastics of different colors varying spatially and seasonally. Blue (35.90% and 30.40%, respectively), transparent (17.95% and 17.90%, respectively), and green (12.82% and 26.80%) were the dominant colors in the dry and rainy (or wet) seasons, while white and yellow were found in low quantities, most of them only in the dry season. The microplastic shapes were mainly fibers, sheets, granules, and infrequent occurrences of other shapes (such as fragment and rod). Figure 2B shows that fibers were the dominant microplastic shape in both seasons (38.46% and 55.36%, respectively). The proportion of sheets in these two seasons was also relatively high (28.21% and 25.0%, respectively).
As shown in Figure 2C, all items were identified using micro-Fourier transform infrared spectrum and classified into five categories: PP, PET, nylon, PE, and Poly (ethylene-co-propylene). The polymer types of the microplastics were diverse in all locations and both seasons, indicating the extents of the microplastic sources. The polymer types of the microplastics detected in the dry season were categorized based on occurrence as PE (46.15%) with the highest proportions, followed by PP (15.38%), PET (15.38%), and poly (12.82%). In the rainy season, nylon (28.6%) was the most frequent, followed by PE (23.2%), and PP (23.2%), and PET (16.1%). The study investigated the different degrees of microplastic pollution because the polymer types and composition were various at the same sampling sites and seasons. This finding might suggest either difference or homogeneity of microplastic sources among sites each season.
In general, microplastics were present across all locations, and no significant differences could be detected between the five sampling sites and between seasons. This result might indicate the spatial homogeneity of microplastic occurrence in the study area.
3.3. Green Mussels
A total of 1000 green mussels (from five stations in two seasons) were analyzed for microplastics. The range (mean ± SD) of length, width, and soft tissue weight of the green mussels were 2.05–9.00 cm (5.55 ± 0.88 cm), 1.43–5.10 cm (2.66 ± 0.37 cm), and 1.01–9.54 g (3.21 ± 1.36 g), respectively. The whole abundance of microplastics found in green mussels was around 0.07 ± 0.19 items/gram of wet weight soft tissues and around 0.19 ± 0.50 items/individual (N = 1000). The average microplastic concentration in the dry season (0.15 ± 0.41 items/individual) was lower than those in the rainy season (0.22 ± 0.57 items/individual). In both seasons, the highest microplastics frequency was observed at S5, while S3 was the slightest (Figure 3a). Microplastic abundances significantly differed statistically among locations (ANOVA: F = 9.816; df = 4, 995; p < 0.01).
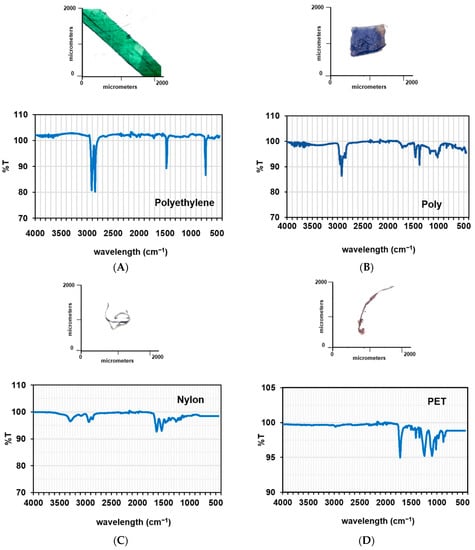
Figure 3.
FT-IR analysis and image of representative microplastics found in Sri Racha Bay. (A) Green sheet in sea water (PE); (B) Blue sheet in sea water (Poly); (C) Green fiber in mussel (Nylon); (D) White fiber in sediments (PET).
All 182 identified microplastics in green mussels were grouped according to color, shape, and polymer type (Figure 2). Spatially and seasonally, the plastics categorized as fiber were the most observed, reaching 94%. Surprisingly, neither collection sample presented contamination by primary source microplastics—pellets. Three most frequently found colors were black (27%), white (25%), and red (23%). Five different types of microplastics were identified. PET, PP, and nylon were the dominant plastics with respective proportions of 45%, 40%, and 24%.
Overall, types of microplastic seemed to be influenced both spatially and seasonally (Figure 2). At S4 and S5, PE particles were absent while other particulars were still present. Additionally, the component of nylon at S5 differed significantly compared to any other sites. This finding hinted the difference of microplastic types in green mussel varied among sampling sites and might provide some explanation as to the site-selecting rationale.
4. Discussion
4.1. Abundance and Characteristics of Microplastics in Surface Seawater
The sampling was conducted at five locations, as shown in Figure 1. The microplastics spread sporadically across area both in sediment and seawater. The abundance of microplastics is relatively low compared with other coastal water areas from the Tolo Harbor, Hongkong [48], Hainan, China [49] and higher than those in the East China Sea [18]; Goiana Estuary, Brazil [50]; Tamar Estuary, Southwest England [51]; or the Japan Sea [52] (Table 2). Therefore, Sri Racha Bay could be classified as moderately microplastic polluted areas. Comparing internally with other crucial mariculture areas, such as Ban Don Bay in the southern part of Thailand [39], microplastic abundance here is significantly lower. These results suggest that the topography and coastal circulation are the essential factors in distributing the microplastics in each area.
All surface seawater samples contained microplastic particles, with concentrations ranging from 0.57 to 5.04 particles m−3; however, there is no significant differences across study sites and between seasons. It should be noted that while there is no difference statistically, the amount of microplastics observed in the rainy season was distinctively high. The hydrodynamic conditions (comparatively high water velocity) and input source from the river discharge (high rainfall) may lead to the distribution in this area during the rainy season. The higher concentration in the rainy season is not unique to here; studies in some estuaries and marginal seas in China [22] also revealed high concentrations. The river runoffs might be the culprit that ties microplastics to coastal water [35,53,54]. This finding provides the rationale for designing sampling that includes seasonal variation for further monitoring.
While there was no statistical difference amongst sites, it should be noted that the abundance of microplastics in the northern part of the bay (station S4 and S5) was higher than in the southern part (station S1, S2, and S3) in the rainy season. In particularly, location S5 is adjacent to the famous tourism beach and seafood factories, and station S4 has a canal that run though a coastal community. This might be the main source of microplastics around these two stations.
Overall, recent studies showed that there are many factors influencing the distribution and abundance of microplastics in water samples, including the human population, wind direction and resulting water currents and waves, entrance of waste waters and sewage, size and shapes of microplastics, shipping, and anthropogenic activities (such as fisheries and industry) in the neighborhood [1,55,56]. Our results found that the reason for microplastic pollution may be caused by the circulation currents produced by tides and wind. Additionally, the water circulation pattern in the upper Gulf of Thailand (GOT) was dominated by river discharge and was distinguished from the circulation in the other parts of the GOT, where it is influenced by the South China Sea waters [57]. Recent studies [58,59] suggested that wind and currents may influence the transportation of the materials in surface seawater as well as the abundance and distribution of microplastics. A previous study on winds and hydrodynamics of the Upper Gulf of Thailand [46] demonstrated that winds mostly blow from the south-west. In Sri Racha Bay, winds may significantly modify surface currents and affect vertical flow changes. The prevailing winds create surface and near-bottom currents, carrying suspended materials from the northern parts (or further northward) towards the south of the bay. Hence, the current directions should be considered as one of the reasons for the lower microplastic abundance in southern stations and the high microplastic abundance in northern stations.
According to polymer types (Figure 2), most microplastics in seawater were PP and PE (67% and 85% in dry and rainy seasons). These polymers are the most common for packing, plastic bags, and material in maricultures. These confirmed that the microplastics in seawater are very closely related to coastal activities like any other anthropogenic stressed areas, such as Jiaozhou Bay [60] and Xincun Lagoon, China [61]. However, the main types of microplastics in Sri Racha Bay differed from Ban Don Bay, where the majority was rayon [39]. It inferred that source of microplastics might be diverse, while having a similar type of mariculture activity.
4.2. Abundance and Characteristics of Microplastics in Sediments
Similar to seawater, microplastics were found sporadically across five stations. The observed microplastics in sediment showed no significant difference seasonally, though those observed microplastic numbers in the rainy season are higher than those in the dry season. In contrast, microplastic abundance were varied significantly amongst location (p < 0.05). As expected, total microplastic concentrations were highest around S4 and S5, but we still cannot be confirm the relation of these observed concentrations to local anthropogenic activities. However, microplastics in sediments are transported more slowly than in water because of the stability of sediments [62]. Additionally, many factors affect the spatial distribution in sediments: source, hydrodynamics, and sediment characteristics [26,63,64]. Therefore the distance from the source might be the main factor affecting the spatial distribution in this area. The low flushing rate may explain this observation. Microplastics floating into such compartments could get trapped around this area because of the rafting patches, eventually settling on the bottom instead of flushing out of this area. This result could explain the higher microplastic concentrations in these stations. Our findings suggest that seasonal variations should elicit caution when monitoring the microplastic abundance in sediments.
Different sampling and analysis processes could make direct comparison difficult and uncertain. Therefore, some studies that have similar methods were selected. Compared with the abundance of microplastics in different regions reported in previous studies as shown in Table 2, the microplastic quantity in the coastal sediment in Sri Racha Bay is lower than those in the Gulf of Thailand [65], an estuary in Phuket [38], and the Tunisian coast [66], whilst distinctively high compared to Tokyo Bay [67]. The abundance was more heightened than in Ban Don Bay, Thailand [39].
Fiber was the dominant shape found in the sediment samples here, followed by sheets and granules. Hence, a high abundance of microfibers in sediment might impact the local benthic fauna in various ways [26,68,69]. Additionally, some microfibers might originate from the rope material used in the fishery activities in the study area [2,18]. FT-IR was performed to identify polymer types of all samples. The majority component of microplastics in sediment is polyethylene, nylon, and PET, possibly originating from food packaging, clothes, and fishing gear, with a variation in proportion during both seasons. Additionally, nylon is used in fishing gear and equipment, such as discarded or abandoned nets, and could also be considered an important microplastic source. Due to its density being higher than seawater, nylon is likely to deposit in sediment. Moreover, the sediment beneath mussel rafts had a more refined texture of mud and silt, with a higher degree of accumulation [70]. Nylon was also detected as forming the majority in sediments in some recent studies [5]. There was no rayon in our study but rayon was the majority in sediments in other areas, such as Phuket [38] and Ban Don Bay [39]. These confirm that the microplastics in sediments are very closely related to coastal activities that agree with other adjacent human activities. Nylon is used in maricultures and since station S3, S4 and S5 are the location for green mussel farms (raft and bamboo-pole culture), the farms could also be considered an important microplastic source together with discarded or abandoned ropes.
Consequently, our results support that microplastic pollutants primarily came from urban and farming activities. Due to the spatial pattern of microplastics in the sediments, the microplastics found here were homogenous. This pattern reflects their relative level of industrialization and urbanization. Hence, the proximity to anthropogenic inputs has been found to be a fundamental determinant of microplastic abundance in this area.
4.3. Abundance and Characteristics of Microplastics in Green Mussels
Green mussels are filter feeders with a filtration rate of about 24–60 L/day; however, the filtration rate also depends on various factors such as body sizes and suspended particles in water [71]. Water is sieved into the body through relevant organs, which enhance the possibility of intaking or ingesting microplastics suspended in water. Thus came the assumption of relating microplastic quantities in the water column to the one found in mussels. Sri Racha Bay is one of the important green mussel (Perna viridis) farming areas using float rafting in Thailand. The average amount of microplastic in green mussels was 0.15 ± 0.41 (45.63 items/Kg wet weight) and 0.22 ± 0.57 particles/individual (70.16 items/Kg wet weight) in the dry and wet seasons, respectively. The level of microplastics in this study was relatively lower than those reported in other studies despite using different methods for analyzing microplastics, such as those for green mussel (Perna viridis) in Ban Don Bay [39]; blue mussel (Mytilus edulis) and Pacific oyster (Crassostrea gigas) from the French Atlantic coast; green mussel in France [72]; and green mussel (Perna viridis) from Phuket [40], as in Table 3. Interestingly, [73] found very high levels of contamination with 34 to 178 items/individual in mussels in Canada, but their work was based on visualization only.
Fiber formed the significant majority of microplastics found in mussel tissues. Consistently with this finding, fibers were the dominant shape category of microplastics in seawater and sediment at the same area. According to previous studies, fiber was the most common shape in mussels [39,42,74,75,76].
In this work, black plastic was the most abundant and was found in all stations in both seasons (Figure 2). The colorful microplastics were about half of them; red ones were predominant (23.08%), followed by green (15.93%), and blue (8.79%). This provides strong evidence of the anthropogenic origin of synthetic materials. The colorant particles observed in this study can have principal sources from the degradation of farming material, such as rope and gallon bottles, that serve as supports for green mussel cultivation [77]. Moreover, colorful microplastics were simply observed by visual inspection during the analysis. According to the color and size of microplastics, it is potentially selected as food by filter-feeding bivalves. Due to varying in microplastic size, i.e., nano- to microplastics, they can be mistaken as prey by various pelagic and benthic marine organisms, including copepods [78], fish [79], and mussels [12]. The abundance of microplastics can be attributed to fishery activities and plastic materials widely used in mussel farms [73].
Table 2.
Microplastic abundance in sea water and sediments in other studies.
Table 2.
Microplastic abundance in sea water and sediments in other studies.
| Study Area | Mean Density (n/m3) in Water | Mean Density (n/Kg D.W) in Sediment | References |
|---|---|---|---|
| East China Sea | 0.167 | Zhao et al., 2014 [18] | |
| Goiana Estuary, Brazil | 0.026 | Lima et al., 2014 [50] | |
| Tamar Estuary, Southwest England | 0.028 | Sadri and Thompson, 2014 [51] | |
| Sea of Japan | 0.004 | Isobe et al., 2015 [52] | |
| Southern Sea of Korea | 1.92–5.51 | Kang et al., 2015 [63] | |
| Northeastern of Qatar | 0.71 | Castillo et al., 2016 [80] | |
| Tolo Harbor, Hongkong | 0.65–13.08 | Tsang et al., 2017 [48] | |
| Coastal waters of Tuscany, Italy | 0.26 | Baini et al., 2018 [81] | |
| Chaopraya River, Thailand | 0.348 ± 0.16 | Sukhsangchan et al., 2020 [35] | |
| 0.610 ± 0.36 | |||
| Hainan, China | 523 | Lin et al., 2022 [49] | |
| Tokyo Bay, Japan | 1900 | Matsuguma et al., 2017 [67] | |
| Tunisian coast | 130.55 ± 65.61 | Jaouani et al., 2022 [66] | |
| Gulf of Thailand | 150.4 ± 86.2 | Wang et al., 2020 [65] | |
| Ban Don Bay, Thailand | 0.63 ± 0.13 × 10³ | 15–35 | Chinfak et al., 2021 [39] |
| 0.28 ± 0.07 | |||
| Phuket (dry season) | 300–900 | Jiwarungrueangkul et al., 2021 [38] | |
| (rainy season) | 33–400 | ||
| Sri Racha Bay, Thailand (dry season) | 0.85 ± 0.25 | 48.30 ± 28.17 | This study |
| (rainy season) | 2.06 ± 1.78 | 69.35 ± 22.29 |
Considering the plastic types, PET was the dominant polymer type for all locations except S5, where nylon was the most abundant. This observation is more convincing in using different materials in green mussel farms along the coastal area. Additionally, no evident influence on microplastic contents could be observed regarding the sampling period.
The statistical tests showed no significant differences between mussels related to the sampling location, and the season. Without statistical basis, some light effects of sampling locations could be evidenced. The anthropogenic pressures of the different sites did not lead to different microplastic contaminations. Though, there is a tendency for a higher number of particles in mussels at locations S4 and S5. Moreover, the contamination of cultivated mussels could be explained by proximity to microplastics from the degradation of plastic materials (PET, PE, PP, Nylon) used in aquaculture as collectors, ropes, nets, and pipes used from the spat collection to on growing steps. However, there were no plastic pellets (primary microplastic) in green mussels but some plastic pallets were found in mussels [42,82].
The correlation between biodata (mussel wet weight, shell length, width length, and gender) and quantities of microplastics had been investigated. There were only the correlation between both the shell length and gender with the microplastic quantities even if with low correlation (r = −0.009 p > 0.05 for weight; r = −0.062 p < 0.05 for length; r = −0.011 p > 0.05 for width; r = 0.154 p < 0.01 for gender). However, the shell length and weight, both are not good indication of age because the growth of the organisms is depended on the local environmental conditions, especially the water quality and the nutrient contents [83]. Many studies suggested no influence of mussel size on microplastic accumulation, such as in mussel in French Atlantic coast [72]; Mediterranean Sea [74], North Sea coasts [24], and blue mussels (Mytilus edulis) on the southwest coast of UK [84]. Otherwise, some previous studies reported sizes of mussels related with microplastic accumulation in farmed and wild mussels along coastal waters of China [42], and green mussels in Thailand [39]. This contrast results might imply that the filtration and feeding rate are not only depended on mussel sizes but also environment factors. Some evidence revealed the efficiency filtration rate of mussels on its size, however filtration, ingestion and absorption also based on the quantities of food in the water and organic contents in water [85]. Higher contents of food (phytoplankton) and organic materials in the water will require lower filtration rates to intake the maximum volume of food, and thus generates faster growth rates [86]. Low salinities influenced from freshwater discharge into the sea sometimes caused a rapid high nutrient loading and then mussel mortality. Salinity and bathymetry are considered to be the important factors affecting the green mussel growth. Hence, our study suggests that mussel shell length may be considered a more reliable indicator of filtration rate and similar suggestion by [87].
Table 3.
Comparison of microplastics in aquatic organisms.
Table 3.
Comparison of microplastics in aquatic organisms.
| Study Area | Density (Items/Ind.) | Species | References |
|---|---|---|---|
| Nova Scotia, Canada | 34–178 | Mytilus edulis | Mathalon and Hill, 2014 [73] |
| New Zealand | 0–0.48 | Perna canaliculus | Webb et al., 2019 [88] |
| China | 1.5–7.6 | Mytilus edulis | Li et al., 2016 [42] |
| Norway | 1.5 (±2.3) | Mytilus spp. | Bråte et al., 2018 [89] |
| Mediterranean Sea | 1.7–2 | Mytilus galloprovincialis | Digka et al., 2018 [90] |
| South Africa | 3.4 | Mytilus galloprovincialis | Sparks, 2020 [76] |
| 5.6 | Choromytilus meridionalis | ||
| 2.9 | Aulyacoma ater | ||
| Ban Don Bay, Thailand | 0.50 ± 0.06 | Perna viridis | Chinfak et al., 2021 [39] |
| 0.13 ± 0.03 | Meretrix lyrata | Chinfak et al., 2021 [39] | |
| Eastern Coast, Thailand | 0.14 | Fish | Phaksopa et al., 2021 [31] |
| Phuket, Thailand | 2.7–5.8 | Perna viridis | Cherdsukjai et al., 2022 [40] |
| Sri Racha Bay, Thailand | 0.15 ± 0.41 | Perna viridis | This study |
| 0.22 ± 0.57 | Perna viridis | This study |
4.4. Dynamics of Microplastics in Sri Racha Bay
The correlation and the transfer path between microplastics in organisms and their living environment are still not well understand. Therefore, we investigated microplastic pollution in the water, sediments, and the mussels in Sri Racha Bay in this study. Some examples of microplastic under the stereo-microscope are shown in Figure 3. Around Sri Racha Bay, there are two types of green mussel culture, namely bamboo-pole and raft culture. This area hosts a relatively moderate human population and has industrial sources, unlike other coastal areas where microplastic abundance has been reported. Sources of microplastics here included those transported through river discharge (agriculture and municipal wastes) and sea-based activities (fisheries, aquaculture, and tourism).
Microplastics were ubiquitous in all samples collected within our study area, reflecting the microplastic pollution of the water and sediment of Sri Racha Bay. The results indicate a low positive correlation between the microplastic abundance of water and sediments with no statistical significance (r = 0.45, p > 0.05). This result is comparable with the study by [91], which suggested no correlation between sediments and water in Poyang Lake. However, the positive correlation in the present study suggests the higher flow rate or sinking rate of microplastics in water and the tremendous potential of sediments holding microplastics in the study area. A snapshot of microplastic pollution level was not representative enough to reflect the overall situation of a whole season. Repeated sampling for at least two years in the same spatial and temporal trends might be needed to corroborate the conclusion.
The pollution levels of microplastics in the sea surface water, sediment, and biota differed significantly. We found no significant correlation between the number of particles in the sediments (waters) and those found within the mussels at our given sites and periods, but did observe a tendency of positive correlation between number of particles in mussels and particles in their surrounding sediment (water) samples (Figure 4.). Our findings were comparable with those described by [92], who found significant correlations between the abundance of microplastics in surface seawater and microplastics with mussel at sampling sites on the coast of China. Therefore, we believe that microplastics may primarily originate from land-based sources, including inputs from residential areas (e.g., garbage from food packaging, fibers in clothing, and household waste) and farming activities (rope and gallon bottles).
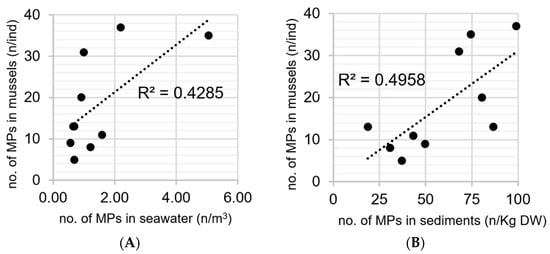
Figure 4.
The number of anthropogenic particles in green mussels compared to those in (A) the overlying seawater (B) the sediment at coastal sites around Sri Racha Bay.
Fibers were the most widespread microplastics found across all environmental media (water, sediment, and soft tissue of green mussels) in our study. Fishery and aquaculture activities are considered potential sources of microplastics. Fishing gear and aquaculture materials, such as plastic ropes, nets, and plastic gallon bottles, are commonly used in this area. Fibers found in the bay may originate from the weathering or fragmentation of these farming materials [2,18,93] or hygiene and cosmetics products and textiles. The bay also received land-based microplastics via discharge, and we theorized that these might be the main contributor to microplastic contamination. Moreover, tidal forcing controlled the amount of microplastics in estuaries [39,93]. As shown in Figure 2, PE, PP, and nylon were found in all surrounding living environments with different proportions. Otherwise, PET, PP, and nylon were the majority of polymer types in green mussel. PE, PP, and nylon are frequently used in aquaculture and fishery in this area. Nylon is usually used in ropes, fishing nets, and cloth. PET and PE are widely used in food packaging, pipes, and plastic containers. The similarity of microplastic compositions (shape and polymer types) between surrounding water and mussels show evidence of the seawater–mussel transfer of microplastics. Therefore, green mussel (Perna viridis) can be used as a good indicator for microplastic pollution around this area.
The levels of microplastic in green mussels tend to be relate with their growing area, considering with microplastic types in water and sediments, as pointed out in other studies [42,82,94]. Most microplastics are less dense than seawater and tend to float at the sea surface. One of the most common types of fiber is nylon, which is used for cultivation materials and has negative or neutral buoyancy. Some pieces are taken up by mussels and some sink into the mid-water column or towards the sediment [3,95]. The study area is a coastal area, which is dominated by tide. Therefore, the tidal current causes fine marine debris on the tidal flat to be constantly suspended in the water column, thereby increasing microplastic levels in seawater [96]. The suspended microplastics in seawater may cause mussels to ingest and accumulate microplastics. Although the level of microplastic contamination is comparable low, it is not claimed to undervalue the potential health risks associated with the consumption of MP-contaminated mussels. This provides basic information for a better understanding of the fate of microplastics within an aquaculture area, and for management actions to address microplastics in this area. Generally, an annual survey should be continued in order to monitor the level of microplastic contamination.
5. Conclusions
To the best of our knowledge, this is the first study of microplastic distribution in the surface water, sediment, and green mussels of the Sri Racha Bay, Thailand. Microplastics were found in all of the water, sediment, and shellfish samples. An abundance of microplastics was found widely in the surface waters and ranged from 0.69 to 1.22 (with average of 0.85 ± 0.25 particles/m3) during the dry season and 0.57 to 5.04 items/m3 (with average of 2.06 ± 1.78 particles/m3) during the wet season, indicating a medium pollution level compared with other coastal area. In the sediments, the abundance ranged from 18.58 to 86.69 (with the average of 48.30 ± 28.17) during the dry season and 43.34 to 99.07 (with the average of 69.35 ± 22.29) items/kg D.W. during the wet season. The concentration of microplastics in green mussels varied from 0.15 ± 0.41 to 0.22 ± 0.57 items/individual, during the dry and wet seasons, respectively, with an average of 0.19 ± 0.50 items/individual. Microplastic abundance in green mussels is negatively correlated with shell length, implying that species with lower length are more likely to have a higher number of microplastics. The microplastic abundance in water and sediments is not influenced by spatial and seasonal variations, whereas the microplastic abundance is lower in the dry season. The spatial trends suggest that microplastic abundance tends to be higher in the northern part. Microplastics in the form of fibers and sheet were the dominant polymer shapes, originating from the secondary microplastics. This study is the first report of microplastic pollution in mussels, seawater, and sediments at the same location in this area. The microplastic abundance in water and sediment is low compared to that which was reported for areas with fewer activities. This should be an incentive for early action to prevent microplastic contamination in Sri Racha Bay from becoming more severe.
Author Contributions
Conceptualization, methodology, data curation, J.P. and R.S.; sample collection, R.S., R.K., K.T. and B.A.; investigation, R.S., R.K. and K.T.; writing—original draft, writing—review and editing, J.P., R.S., S.W. and T.T. All authors have read and agreed to the published version of the manuscript.
Funding
This research received no external funding.
Institutional Review Board Statement
Not applicable.
Informed Consent Statement
Not applicable.
Data Availability Statement
Data sharing is not applicable.
Acknowledgments
The authors would like to thank Sriracha Fisheries Research Station staff for green mussel samples. This work was kindly supported by PTT Global Chemical. We appreciate the provision of Department of Marine Science, Faculty of Fisheries, Kasetsart University. The authors also would like to acknowledge Combating Marine Debris Laboratory members from the Department of Marine Science, Faculty of Fisheries, Kasetsart University.
Conflicts of Interest
The authors declare no conflict of interest.
References
- Ryan, P.G.; Moore, C.J.; Van Franeker, J.A.; Moloney, C.L. Monitoring the abundance of plastic debris in the marine environment. Philos. Trans. R. Soc. B Biol. Sci. 2009, 364, 1999–2012. [Google Scholar] [CrossRef] [PubMed]
- Andrady, A.L. Microplastics in the marine environment. Mar. Pollut. Bull. 2011, 62, 1596–1605. [Google Scholar] [CrossRef] [PubMed]
- Cole, M.; Lindeque, P.; Halsband, C.; Galloway, T.S. Microplastics as contaminants in the marine environment: A review. Mar. Pollut. Bull. 2011, 62, 2588–2597. [Google Scholar] [CrossRef] [PubMed]
- Gewert, B.; Ogonowski, M.; Barth, A.; MacLeod, M. Abundance and composition of near surface microplastics and plastic debris in the Stockholm Archipelago, Baltic Sea. Mar. Pollut. Bull. 2017, 120, 292–302. [Google Scholar] [CrossRef]
- Naji, A.; Esmaili, Z.; Khan, F.R. Plastic debris and microplastics along the beaches of the Strait of Hormuz, Persian Gulf. Mar. Pollut. Bull. 2017, 114, 1057–1062. [Google Scholar] [CrossRef]
- Robin, R.S.; Karthik, R.; Purvaja, R.; Ganguly, D.; Anandavelu, I.; Mugilarasan, M.; Ramesh, R. Holistic assessment of microplastics in various coastal environmental matrices, southwest coast of India. Sci. Total Env. 2020, 703, 134947. [Google Scholar] [CrossRef]
- Moore, C.J. Synthetic polymers in the marine environment: A rapidly increasing, long-term threat. Environ. Res. 2008, 108, 131–139. [Google Scholar] [CrossRef]
- Andrady, A.L. The plastic in microplastics: A review. Mar. Pollut. Bull. 2017, 119, 12–22. [Google Scholar] [CrossRef]
- Prunier, J.; Maurice, L.; Perez, E.; Gigault, J.; Pierson-Wickmann, A.; Davranche, M.; Ter Halle, A. Trace metals in polyethylene debris from the North Atlantic subtropical gyre. Environ. Pollut. 2019, 245, 371–379. [Google Scholar] [CrossRef]
- Massos, A.; Turner, A. Cadmium, lead and bromine in beached microplastics. Environ. Pollut. 2017, 227, 139–145. [Google Scholar] [CrossRef]
- Li, H.; Wang, F.; Li, J.; Deng, S.; Zhang, S. Adsorption of three pesticides on polyethylene microplastics in aqueous solutions: Kinetics, isotherms, thermodynamics, and molecular dynamics simulation. Chemosphere 2021, 264, 128556. [Google Scholar] [CrossRef] [PubMed]
- Browne, M.A.; Dissanayake, A.; Galloway, T.S.; Lowe, D.M.; Thompson, R.C. Ingested microscopic plastic translocate to the circulatory system of the mussel, Mytilus edulis (L.). Env. Sci. Tech. 2008, 42, 5026–5031. [Google Scholar] [CrossRef] [PubMed]
- Browne, M.A.; Niven, S.J.; Galloway, T.S.; Rowland, S.J.; Thompson, R.C. Microplastic moves pollutants and additives to worms, reducing functions linked to health and biodiversity. Curr. Biol. 2013, 23, 2388–2392. [Google Scholar] [CrossRef] [PubMed]
- Rochman, C.M.; Hoh, E.; Kurobe, T.; Teh, S.J. The Ingested plastic transfers hazardous chemicals to fish and induces hepatic stress. Sci. Rep. 2013, 3, 3263. [Google Scholar] [CrossRef]
- Wright, S.L.; Frank, J.; Kelly, F.J. Plastic and human health: A micro issue? Environ. Sci. Technol. 2017, 51, 6634–6647. [Google Scholar] [CrossRef] [PubMed]
- Prinz, N.; Korez, Š. Understanding How microplastics affect marine biota on the cellular level is important for assessing ecosystem function: A review. In YOUMARES 9-The Oceans: Our Research, Our Future; Jungblut, S., Liebich, V., Bode-Dalby, M., Eds.; Springer: Cham, Switzerland, 2020; pp. 101–120. [Google Scholar]
- Doyle, M.; Watson, W.; Bowlin, N.; Sheavly, S. Plastic particles in coastal pelagic ecosystems of the Northeast Pacific ocean. Mar. Environ. Res. 2011, 71, 41–52. [Google Scholar] [CrossRef]
- Zhao, S.; Zhu, L.; Wang, T.; Li, D. Suspended microplastics in the surface water of the Yangtze Estuary System, China: First observations on occurrence, distribution. Mar. Pollut. Bull. 2014, 86, 562–568. [Google Scholar] [CrossRef]
- Aytan, U.; Valente, A.; Senturk, Y.; Usta, R.; Sahin, F.B.E.; Mazlum, R.E.; Agirbas, E. First evaluation of neustonic microplastics in Black Sea waters. Mar. Env. Res. 2016, 119, 22–30. [Google Scholar] [CrossRef]
- Jiang, Y.; Zhao, Y.; Wang, X.; Yang, F.; Chen, M.; Wang, J. Characterization of microplastics in the surface seawater of the South Yellow Sea as affected by season. Sci. Total Env. 2020, 724, 138375. [Google Scholar] [CrossRef]
- Zainuddin, A.H.; Aris, A.Z.; Zaki, M.R.M.; Yusoff, F.M.; Wee, S.Y. Occurrence, potential sources and ecological risk estimation of microplastic towards coastal and estuarine zones in Malaysia. Mar. Pollut. Bull. 2022, 174, 113282. [Google Scholar] [CrossRef]
- Jiang, Y.; Yang, F.; Ul Hassan Kazmi, S.S.; Zhao, Y.; Chen, M.; Wang, J. A review of microplastic pollution in seawater, sediments and organisms of the Chinese coastal and marginal seas. Chemosphere 2022, 286 Pt 1, 131677. [Google Scholar] [CrossRef] [PubMed]
- Vianello, A.; Boldrin, A.; Guerriero, P.; Moschino, V.; Rella, R.; Sturaro, A.; Da Ros, L. Microplastic particles in sediments of lagoon of Venice, Italy: First observations on occurrence, spatial patterns and identification. Estuar. Coast. Shelf Sci. 2013, 130, 54–61. [Google Scholar] [CrossRef]
- Vandermeersch, G.; van Cauwenberghe, L.; Janssen, C.R.; Marques, A.; Granby, K.; Fait, G.; Kotterman, M.J.; Diogène, J.; Bekaert, K.; Robbens, J.; et al. A critical view on microplastic quantification in aquatic organisms. Environ. Res. 2015, 143 Pt B, 46–55. [Google Scholar] [CrossRef] [PubMed]
- Khoironi, A.; Hadiyanto, H.; Anggoro, S.; Sudarno, S. Evaluation of polypropylene plastic degradation and microplastic identification in sediments at tambak lorok coastal area, Semarang Indonesia. Mar. Pollut. Bull. 2020, 151, 110868. [Google Scholar] [CrossRef] [PubMed]
- Wright, S.L.; Thompson, R.C.; Galloway, T.S. The physical impacts of microplastics on marine organisms: A review. Environ. Pollut. 2013, 178, 483–492. [Google Scholar] [CrossRef] [PubMed]
- Cole, M.; Lindeque, P.; Fileman, E.; Halsband, C.; Goodhead, R.; Moger, J.; Galloway, T.S. Microplastic ingestion by zooplankton. Environ. Sci. Technol. 2013, 47, 6646–6655. [Google Scholar] [CrossRef]
- Van Cauwenberghe, L.; Janssen, C.R. Microplastics in bivalves cultured for human consumption. Environ. Pollut. 2014, 193, 65–70. [Google Scholar] [CrossRef]
- Jabeen, K.; Su, L.; Li, J.; Yang, D.; Tong, C.; Mu, J.; Shi, H. Microplastics and mesoplastics in fish from coastal and fresh waters of China. Environ. Pollut. 2017, 221, 141–149. [Google Scholar] [CrossRef]
- Costa, E.; Piazza, V.; Lavorano, S.; Faimali, M.; Garaventa, F.; Gambardella, C. Trophic transfer of microplastics from copepods to jellyfish in the marine environment. Front. Environ. Sci. 2020, 8, 158. [Google Scholar] [CrossRef]
- Phaksopa, J.; Sukhsangchan, R.; Keawsang, R.; Tanapivattanakul, K.; Thamrongnawasawat, T.; Worachananant, S.; Sreesamran, P. Presence and Characterization of Microplastics in Coastal Fish around the Eastern Coast of Thailand. Sustainability 2021, 13, 13110. [Google Scholar] [CrossRef]
- Kibria, G.; Nugegoda, D.; Haroon, A.K.Y. Microplastic pollution and contamination of seafood (including fish, sharks, mussels, oysters, shrimps and seaweeds): A global overview. In Microplastic Pollution Emerging Contaminants and Associated Treatment Technologies; Hashmi, M.Z., Ed.; Springer Nature: Cham, Switzerland, 2022; pp. 277–322. [Google Scholar]
- Farrell, P.; Nelson, K. Trophic level transfer of microplastic: Mytilus edulis (L.) to Carcinus maenas (L.). Environ. Pollut. 2013, 177, 1–3. [Google Scholar] [CrossRef] [PubMed]
- Setälä, O.; Fleming-Lehtinen, V.; Lehtiniemi, M. Ingestion and transfer of microplastics in the planktonic food web. Environ. Pollut. 2014, 185, 77–83. [Google Scholar] [CrossRef] [PubMed]
- Sukhsangchan, R.; Keawsang, R.; Worachananant, S.; Thamrongnawasawat, T.; Phaksopa, J. Suspended microplastics during a tidal cycle in sea-surface waters around Chao Phraya River mouth, Thailand. ScienceAsia 2020, 46, 724–733. [Google Scholar] [CrossRef]
- Pradit, S.; Towatana, P.; Nitiratsuwan, T.; Jualaong, S.; Jirajarus, M.; Sornplang, K.; Noppradit, P.; Darakai, Y. Occurrence of microplastics on beach sediment at Libong, a pristine island in Andaman Sea, Thailand. ScienceAsia 2020, 46, 336–343. [Google Scholar] [CrossRef]
- Jualaong, S.; Pransilpa, M.; Pradit, S.; Towatana, P. Type and Distribution of Microplastics in Beach Sediment along the Coast of the Eastern Gulf of Thailand. J. Mar. Sci. Eng. 2021, 9, 1405. [Google Scholar] [CrossRef]
- Jiwarungrueangkul, T.; Phaksopa, J.; Sompongchaiyakul, P.; Tipmanee, D. Seasonal microplastic variations in estuarine sediments from urban canal on the west coast of Thailand: A case study in Phuket province. Mar. Pollut. Bull. 2021, 68, 112452. [Google Scholar] [CrossRef] [PubMed]
- Chinfak, N.; Sompongchaiyakul, P.; Charoenpong, C.; Shi, H.; Yeemin, T.; Zhang, J. Abundance, composition, and fate of microplastics in water, sediment, and shellfish in the Tapi-Phumduang River system and Bandon Bay, Thailand. Sci. Total Env. 2021, 781, 146700. [Google Scholar] [CrossRef] [PubMed]
- Cherdsukjai, P.; Vongpanich, V.; Akkajit, P. Preliminary Study and First Evidence of Presence of Microplastics in Green Mussel, Perna viridis from Phuket. App. Env. Res. 2022, 44, 28–41. [Google Scholar] [CrossRef]
- Argamino, C.R.; Janairo, J.I.B. Qualitative assessment and management of micro-plastics in Asian green mussels (Perna viridis) cultured in Bacoor Bay, Cavite, Phillipine. EnvironmentAsia 2016, 9, 48–54. [Google Scholar]
- Li, J.; Qu, X.; Su, L.; Zhang, W.; Yang, D.; Kolandhasamy, P.; Li, D.; Shi, H. Microplastics in mussels along the coastal waters of China. Environ. Pollut. 2016, 214, 177–184. [Google Scholar] [CrossRef]
- Li, J.; Lusher, A.L.; Rotchell, J.M.; Deudero, S.; Turra, A.; Bråte, I.L.N.; Sun, C.; Hossain, M.S.; Li, Q.; Kolandhasamy, P.; et al. Using mussel as a global bioindicator of coastal microplastic pollution. Environ. Pollut. 2019, 244, 522–533. [Google Scholar] [CrossRef] [PubMed]
- Cholumpai, V.; Kachanopas-Barnette, P.; Tubmeka, S.; Wu, R.S.S. Contamination of Cadmium and Mercury along the East Coast of the Gulf of Thailand: A Comparative Study Using the Green Mussel (Perna viridis), Artificial Mussel, Water and Sediment. Am. Acad. Sci. Res. J. Eng. Tech. Sci. 2020, 73, 61–75. [Google Scholar]
- Peng-ngeiw, P.; Jaritkhuan, S.; Tunkijjanukij, S. Effect of Green Mussel Raft Culture to Total Organic Matter (TOM) and Flux of Dissolved Inorganic Nitrogen (DIN) in Sriracha Bay, Chon Buri Province. Burapha Sci. J. 2021, 26, 270–284. [Google Scholar]
- Lamsawat, P.; Phaksopa, J.; Sojisuporn, P. Tracking of Floating Objects in the Area of Chao Phraya River Mouth by Using Numerical Model. Burapha Sci. J. 2022, 25, 953–967. [Google Scholar]
- Masura, J.; Baker, J.; Foster, G.; Arthur, C. Laboratory Methods for the Analysis of Microplastics in the Marine Environment: Recommendations for Quantifying Synthetic Particles in Waters and Sediments; NOAA Technical Memorandum NOS-OR&R-48; NOAA: Silver Spring, MD, USA, 2015; pp. 1–39. [Google Scholar]
- Tsang, Y.Y.; Mak, C.W.; Liebich, C.; Lam, S.W.; Sze, E.T.-P.; Chan, K.M. Microplastic pollution in the marine waters and sediments of Hong Kong. Mar. Pollut. Bull. 2017, 115, 20–28. [Google Scholar] [CrossRef]
- Lin, F.; Zhang, Q.; Xie, J.; Lin, Y.; Chen, Y.; Mao, K.; Qin, Y.; Diao, X. Microplastics in biota and surface seawater from tropical aquaculture area in Hainan, China. Gondwana Res. 2022, 108, 41–48. [Google Scholar] [CrossRef]
- Lima, A.R.A.; Costa, M.F.; Barletta, M. Distribution patterns of microplastics within the plankton of a tropical estuary. Environ. Res. 2014, 132, 146–155. [Google Scholar] [CrossRef]
- Sadri, S.S.; Thompson, R.C. On the quantity and composition of floating plastic debris entering and leaving the Tamar Estuary, Southwest England. Mar. Pollut. Bull. 2014, 81, 55–60. [Google Scholar] [CrossRef]
- Isobe, A.; Uchida, K.; Tokai, T.; Iwasaki, S. East Asian seas: A hot spot of pelagic microplastics. Mar. Pollut. Bull. 2015, 101, 618–623. [Google Scholar] [CrossRef]
- Campanale, C.; Stock, F.; Massarelli, C.; Kochleus, C.; Bagnuolo, G.; Reifferscheid, G.; Uricchio, V.F. Microplastics and their possible sources: The example of Ofanto river in southeast Italy. Environ. Pollut. 2020, 258, 113284. [Google Scholar] [CrossRef]
- Malli, A.; Corella-Puertas, E.; Hajjar, C.; Boulay, A.M. Transport mechanisms and fate of microplastics in estuarine compartments: A review. Mar. Pollut. Bull. 2022, 177, 113553. [Google Scholar] [CrossRef] [PubMed]
- Barnes, D.K.; Galgani, F.; Thompson, R.C.; Barlaz, M. Accumulation and fragmentation of plastic debris in global environments. Philos. Trans. R. Soc. B Biol. Sci. 2009, 364, 1985–1998. [Google Scholar] [CrossRef] [PubMed]
- Eerkes-Medrano, D.; Thompson, R.C.; Aldridge, D.C. Microplastics in freshwater systems: A review of the emerging threats, identification of knowledge gaps and prioritisation of research needs. Water Res. 2015, 75, 63–82. [Google Scholar] [CrossRef] [PubMed]
- Higuchi, M.; Anongponyoskun, M.; Phaksopa, J.; Onishi, H. Influence of monsoon-forced Ekman transport on sea surface height in the Gulf of Thailand. Agri. Nat. Res. 2022, 54, 205–210. [Google Scholar]
- Kim, I.S.; Chae, D.H.; Kim, S.K.; Choi, S.; Woo, S.B. Factors influencing the spatial variation of microplastics on high-tidal coastal beaches in Korea. Arch. Environ. Contam. Toxicol. 2015, 69, 299–309. [Google Scholar] [CrossRef]
- Aliabad, M.K.; Nassiri, M.; Kor, K. Microplastics in the surface seawaters of Chabahar Bay, Gulf of Oman (Makran coasts). Mar. Pollut. Bull. 2019, 143, 125–133. [Google Scholar] [CrossRef]
- Zheng, Y.; Li, J.; Cao, W.; Liu, X.; Jiang, F.; Ding, J.; Yin, X.; Sun, C. Distribution characteristics of microplastics in the seawater and sediment: A case study in Jiaozhou Bay, China. Sci. Total Environ. 2019, 674, 27–35. [Google Scholar] [CrossRef] [PubMed]
- Wei, Y.; Ma, W.; Xu, Q.; Sun, C.; Wang, X.; Gao, F. Microplastic Distribution and Influence Factor Analysis of Seawater and Surface Sediments in a Typical Bay with Diverse Functional Areas: A Case Study in Xincun Lagoon, China. Front. Env. Sci. 2022, 10, 1–10. [Google Scholar] [CrossRef]
- Su, L.; Xue, Y.; Li, L.; Yang, D.; Kolandhasamy, P.; Li, D.; Shi, H. Microplastics in Taihu lake, China. Environ. Pollut. 2016, 216, 711–719. [Google Scholar] [CrossRef]
- Kang, J.H.; Kwon, O.Y.; Lee, K.W.; Song, Y.K.; Shim, W.J. Marine neustonic microplastics around the southeastern coast of Korea. Mar. Pollut. Bull. 2015, 96, 304–312. [Google Scholar] [CrossRef]
- Krelling, A.P.; Souza, M.M.; Williams, A.T.; Turra, A. Transboundary movement of marine litter in an estuarine gradient: Evaluating sources and sinks using hydrodynamic modelling and ground truthing estimates. Mar. Pollut. Bull. 2017, 119, 48–63. [Google Scholar] [CrossRef] [PubMed]
- Wang, Y.; Zou, X.; Peng, C.; Qiao, S.; Wang, T.; Yu, W.; Khokiattiwong, S.; Kornkanitnan, N. Occurrence and distribution of microplastics in surface sediments from the Gulf of Thailand. Mar. Pollut. Bull. 2020, 152, 110916. [Google Scholar] [CrossRef] [PubMed]
- Jaouani, R.; Mouneyrac, C.; Châtel, A.; Amiard, F.; Dellali, M.; Beyrem, H.; Michelet, A.; Lagarde, F. Seasonal and spatial distribution of microplastics in sediments by FTIR imaging throughout a continuum lake-lagoon-beach from the Tunisian coast. Sci. Total Env. 2022, 838 Pt 4, 156519. [Google Scholar] [CrossRef] [PubMed]
- Matsuguma, Y.; Takada, H.; Kumata, H.; Kanke, H.; Sakurai, S.; Suzuki, T.; Itoh, M.; Okazaki, Y.; Boonyatumanond, R.; Zakaria, M.P.; et al. Microplastics in sediment cores from Asia and Africa as indicators of temporal trends in plastic pollution. Arch. Environ. Con. Tox. 2017, 73, 230–239. [Google Scholar] [CrossRef] [PubMed]
- Murray, F.; Cowie, P.R. Plastic contamination in the decapod crustacean Nephrops Norvegicus (Linnaeus, 1758). Mar. Pollut. Bull. 2011, 62, 1207–1217. [Google Scholar] [CrossRef] [PubMed]
- Coppock, R.L.; Lindeque, P.K.; Cole, M.; Galloway, T.S.; Näkki, P.; Birgani, H.; Richards, S.; Queirós, A.M. Benthic fauna contribute to microplastic sequestration in coastal sediments. J. Hazard. Mater. 2021, 415, 125583. [Google Scholar] [CrossRef]
- Vichkovitten, T.; Intarachart, A.; Khaodon, K. Impact of Green Mussel (Perna Viridis) Raft-Culture on Benthic Environment in Sriracha Coastal Water, Thailand. GMSARN Int. J. 2017, 11, 116–122. [Google Scholar]
- Luesiri, M.; Boonsanit, P.; Lirdwitayaprasit, T.; Pairohakul, S. Filtration rates of the green-lipped mussel Perna viridis (Linnaeus, 1758) exposed to high concentration of suspended particles. ScienceAsia 2022, 48, 452–458. [Google Scholar] [CrossRef]
- Phuong, N.N.; Poirier, L.; Pham, Q.T.; Lagarde, F.; Zalouk-Vergnoux, A. Factors influencing the microplastic contamination of bivalves from the French Atlantic coast: Location, season and/or mode of life? Mar. Pollut. Bull. 2018, 129, 664–674. [Google Scholar] [CrossRef]
- Mathalon, A.; Hill, P. Microplastic fibers in the intertidal ecosystem surrounding Halifax Harbor, Nova Scotia. Mar. Pollut. Bull. 2014, 81, 69–79. [Google Scholar] [CrossRef]
- De Witte, B.; Devriese, L.; Bekaert, K.; Hoffman, S.; Vandermeersch, G.; Cooreman, K.; Robbens, J. Quality assessment of the blue mussel (Mytilus edulis): Comparison between commercial and wild types. Mar. Pollut. Bull. 2014, 85, 146–155. [Google Scholar] [CrossRef] [PubMed]
- Naidu, S.A. Preliminary study and first evidence of presence of microplastics and colorants in green mussel, Perna viridis (Linnaeus, 1758), from southeast coast of India. Mar. Pollut. Bull. 2019, 140, 416–422. [Google Scholar]
- Sparks, C. Microplastics in Mussels Along the Coast of Cape Town, South Africa. Bull. Environ. Contam. Toxicol. 2020, 104, 423–431. [Google Scholar] [CrossRef]
- Castro, R.O.; Silva, M.L.; Marques, M.R.C.; de Araújo, F.V. Evaluation of microplastics in Jurujuba Cove, Niterói, RJ, Brazil, an area of mussels farming. Mar. Pollut. Bull. 2016, 110, 555–558. [Google Scholar] [CrossRef]
- Lee, K.W.; Shim, W.J.; Kwon, O.Y.; Kang, J.H. Size-dependent effects of micro polystyrene particles in the marine copepod Tigriopus japonicus. Env. Sci. Tech. 2013, 47, 11278–11283. [Google Scholar] [CrossRef] [PubMed]
- Ory, N.C.; Sobral, P.; Ferreira, J.L.; Thiel, M. Amberstripe scad Decapterus muroadsi (Carangidae) fish ingest blue microplastics resembling their copepod prey along the coast of Rapa Nui (Easter Island) in the South Pacific subtropical gyre. Sci. Total Env. 2017, 586, 430–437. [Google Scholar] [CrossRef]
- Castillo, A.B.; Al-Maslamani, I.; Obbard, J.P. Prevalence of microplastics in the marine waters of Qatar. Mar. Pollut. Bull. 2016, 111, 260–267. [Google Scholar] [CrossRef]
- Baini, M.; Fossi, M.C.; Galli, M.; Caliani, I.; Campani, T.; Finoia, M.G.; Panti, C. Abundance and characterization of microplastics in the coastal waters of Tuscany (Italy): The application of the MSFD monitoring protocol in the Mediterranean Sea. Mar. Pollut. Bull. 2018, 133, 543–552. [Google Scholar] [CrossRef]
- Li, J.; Yang, D.; Li, L.; Shi, H. Microplastics in commercial bivalves from China. Environ. Pollut. 2015, 207, 190–195. [Google Scholar] [CrossRef]
- Gosling, E.M. Bivalve Molluscs: Biology, Ecology and Culture; Fishing News Books: Oxford, UK, 2003; p. 443. [Google Scholar]
- Scott, N.; Porter, A.; Santillo, D.; Simpson, H.; Lloyd-Williams, S.; Lewis, C. Particle characteristics of microplastics contaminating the mussel Mytilus edulis and their surrounding environments. Mar. Pollut. Bull. 2019, 146, 125–133. [Google Scholar] [CrossRef]
- Wong, W.; Cheung, S. Seasonal variation in the feeding physiology and scope for growth of green mussels, Perna viridis in estuarine Ma Wan, Hong Kong. J. Mar. Bio. Ass. UK 2003, 83, 543–552. [Google Scholar] [CrossRef]
- Hawkins, A.J.S.; Smith, R.F.M.; Tan, S.H.; Yasinm, Z.B. Suspension-feeding behaviour in tropical bivalve molluscs: Perna viridis, Crassostrea belcheri, Crassostrea iradelei, Saccostrea cucculata and Pinctada margarifera. Mar. Ecol. Prog. Ser. 1998, 166, 173–185. [Google Scholar] [CrossRef]
- Riisgård, H.U.; Larsen, P.S.; Pleissner, D. Allometric equations for maximum filtration rate in blue mussels Mytilus edulis and importance of condition index. Helgol. Mar. Res. 2014, 68, 193–198. [Google Scholar] [CrossRef]
- Webb, S.; Ruffell, H.; Marsden, I.; Pantos, O.; Gaw, S. Microplastics in the New Zealand green lipped mussel Perna canaliculus. Mar. Pollut. Bull. 2019, 149, 110641. [Google Scholar] [CrossRef]
- Bråte, I.L.N.; Hurley, R.; Iversen, K.; Beyer, J.; Thomas, K.V.; Steindal, C.C.; Green, N.W.; Olsen, M.; Lusher, A. Mytilus spp. as sentinels for monitoring microplastic pollution in Norwegian coastal waters: A qualitative and quantitative study. Env. Pollut. 2018, 243, 383–393. [Google Scholar] [CrossRef]
- Digka, N.; Tsangaris, C.; Torre, M.; Anastasopoulou, A.; Zeri, C. Microplastics in mussels and fish from the Northern Ionian Sea. Mar. Pollut. Bull. 2018, 135, 30–40. [Google Scholar] [CrossRef]
- Yuan, W.; Liu, X.; Wang, W.; Di, M.; Wang, J. Microplastic abundance, distribution and composition in water, sediments, and wild fish from Poyang Lake, China. Ecotoxicol. Environ. Saf. 2019, 170, 180–187. [Google Scholar] [CrossRef]
- Qu, X.; Su, L.; Li, H.; Liang, M.; Shi, H. Assessing the relationship between the abundance and properties of microplastics in water and in mussels. Sci. Total Environ. 2018, 621, 679–686. [Google Scholar] [CrossRef]
- Browne, M.A.; Crump, P.; Niven, S.J.; Teuten, E.; Tonkin, A.; Galloway, T.; Thompson, R. Accumulation of microplastic on shorelines woldwide: Sources and sinks. Env. Sci. Tech. 2011, 45, 9175–9179. [Google Scholar] [CrossRef]
- Van Cauwenberghe, L.; Devriese, L.; Galgani, F.; Robbens, J.; Janssen, C.R. Microplastics in sediments: A review of techniques, occurrence and effects. Mar. Environ. Res. 2015, 111, 5–17. [Google Scholar] [CrossRef]
- Andrady, A.L. Persistence of plastic litter in the oceans. In Marine Anthropogenic Litter; Springer: Cham, Switzerland, 2015; pp. 57–72. [Google Scholar]
- Cho, Y.; Shim, W.J.; Jang, M.; Han, G.M.; Hong, S.H. Abundance and characteristics of microplastics in market bivalves from South Korea. Env. Poll. 2019, 245, 1107–1116. [Google Scholar] [CrossRef] [PubMed]
Disclaimer/Publisher’s Note: The statements, opinions and data contained in all publications are solely those of the individual author(s) and contributor(s) and not of MDPI and/or the editor(s). MDPI and/or the editor(s) disclaim responsibility for any injury to people or property resulting from any ideas, methods, instructions or products referred to in the content. |
© 2022 by the authors. Licensee MDPI, Basel, Switzerland. This article is an open access article distributed under the terms and conditions of the Creative Commons Attribution (CC BY) license (https://creativecommons.org/licenses/by/4.0/).