Abstract
While interflow from the slopes can be crucial for water and nutrient availability in low-input farming systems in wetlands in East Africa, very little data exist on hillslope hydrology and associated nutrient transport in deeply weathered saprolites over crystalline rocks. This study aims for a better process understanding of interflow generation and routing in this environment and its contribution to water and nitrate availability at the wetland fringe of a valley bottom wetland in central Uganda. The study was set up as a plot study following a multi-method approach, including interflow trenches, soil analysis, and geo-electrical measurements. We found that interflow generation was related to the undulating subsurface topography and the conductivity of the upper saprolite, while interflow was conducted to the slope toe via small, perched aquifers and preferential flow paths within the saprolite, which are connected during the rainy season. Interflow volumes and nitrate transport were strongly related to the land-use type and rainfall characteristics. As the nitrate delivered from the slopes was quickly lost in the anaerobic environment of the wetland fringe, sustainable agricultural management should focus on the slope toe and the upland positions.
1. Introduction
Extending agricultural production to wetland areas has increasingly become the center of attention in the debate around ensuring food security for a quickly growing population in East Africa and other tropical regions of the world. Compared with the frequently degraded upland areas [1], wetlands are characterized by higher soil fertility and prolonged water availability [2]. The latter is a highly desirable attribute in areas with reoccurring droughts. At the same time, wetlands are very fragile ecosystems that deliver a wide range of ecosystem services besides provisioning services [3]. In the Lake Kyoga basin in Uganda, where this study is situated, already 42% of the wetland area is degraded due to agricultural activities [4]. Hence, the wise use of wetlands, which is based on a sound system understanding, is mandatory to engender sustainable landscape management that will ensure food security and environmental integrity [5].
Hydrology essentially determines the state, i.e., the health, of a wetland [6,7]. Especially channeled valley bottom wetlands, which can be defined as “mostly flat wetland areas located along a valley floor often connected to an (…) adjoining river (…) with a small river channel running through them” [8] (p. 23), are very sensitive to changes in the quality and quantity of their water supply [9]. Depending on the geology, the water supply might be driven mostly by (sub-)surface runoff from the surrounding slopes [10,11,12]. Therefore, a clear view of the catchment hydrology is essential for informed management decisions.
Studies in valley bottom wetlands in Ghana [13], Benin [14], and Burkina Faso [15,16] have shown that the prolonged water availability, as well as the favorable nutrient supply at the wetland fringe, as compared with the upland areas are related to shallow interflow from the slopes adjacent to the wetland. Studies trying to identify the major contributors to plant-available water in wetlands in South Africa produced different results, identifying either surface runoff [12,17] or subsurface flow [10] as the main source of water supply to the wetland. For the deep and highly weathered saprolites in East Africa, though, knowledge on interflow and its connectivity to the wetland is still very limited.
In temperate regions, processes related to interflow generation and routing have been studied for a long time, leading to insights on equilibrium and non-equilibrium flow paths [18,19], the extension of interflow networks with increasing soil moisture [20,21,22], as well as the effect of sub-surface topography on the threshold behavior of interflow generation [20,23,24,25]. The contribution of event water to interflow collected at the slope toe [26,27,28] and the downslope travel distance of interflow [29] have been intensely debated. For saprolitic environments, though, very few insights on interflow generation and routing exist (e.g., [30,31,32]), and previous studies in the area rather focused on groundwater [32,33] or modeled hydrological processes at a catchment scale [34].
In Uganda, still, only 35 % of agricultural households apply any kind of fertilizer [35], and nutrient availability is often a limiting factor for crop growth and food production [36,37]. In these low- and no-input production systems, careful nitrate management, which aims to avoid nitrogen losses from the plant-soil system, is crucial for sustaining food production. In the mostly anaerobic environment of valley bottom wetlands, though, nitrate is easily lost via denitrification, runoff, and leaching [38]. Hence, a clear understanding of the hydrological connectivity and the timing of nitrate inputs from the slopes is fundamental for adapting agricultural management interventions to natural nutrient availability [39].
For many tropical regions, a peak in nitrate inputs from the slopes has been found during the dry-to-wet transition period (e.g., [16,40,41]). Several cycles of drying and rewetting of the soil stimulate the mineralization of organic matter, leading to the release and accumulation of mineral nitrogen [42], a process known as the “Birch” effect [43,44]. With increasing saturation levels, the nitrate can then be subject to denitrification or be washed out from the upland areas and transported toward the wetland fringe.
Generally, nitrate transport depends on source factors (the amount of nitrate present in the soil solution) as well as transport factors [45]. Both are directly related to the amount of water available, while the latter is further determined by the characteristics of water movement in the soil and at the hillslope scale, as further analyzed by [39,46,47,48,49]. In this context, Ref. [50] describes that, in the absence of surface-near perched water tables or at straight or convex hillslopes, nitrate might leach to deeper flow pathways, which can be considered “transient”, i.e., nitrate appears in the stream months later or “permanent”, i.e., nitrate reappears in the stream years later [51].
Therefore, a sound understanding of the hillslope hydrology, as well as of the environmental conditions influencing nitrate mineralization and transport along the slopes, is crucial for comprehensive agricultural management, which considers the entire landscape and the processes within it. This also includes taking the effect of different land use types on nitrate availability in the soil solutions, as well as on the hillslope hydrology, into account, as, e.g., the presence of perennial vegetation was found to increase nitrate uptake [52] and strengthen [42,53,54] or weaken [55,56] interflow processes.
This work aims
- (i)
- to contribute to the understanding of the hillslope hydrology in a deeply weathered saprolite;
- (ii)
- to investigate the effect of rainfall characteristics and different land-use types on the hillslope hydrology and associated nitrate transport; and
- (iii)
- to analyze the relevance of water and nitrate inputs from the surrounding slopes for water and nitrate availability at the fringe of the valley bottom wetland.
Using a multi-method approach in the frame of a plot study, we will show that interflow generation depends on the sub-surface topography and hydraulic conductivity of the upper saprolite and that a quick, as well as a delayed, interflow component develop in the saprolite, which are at least partly fed by event water. While semi-natural vegetation decreases (sub-)surface runoff, rainfall amount and distribution over the rainy season determine interflow volumes and associated nitrate transport. This work will further show that despite a significant inflow of water and nitrate to the wetland fringe, management interventions to keep nitrate in the soil-plant system should rather focus on the slope toe and the upland positions.
2. Materials and Methods
2.1. Study Site
The study site is located in the lower Nasirye catchment, in the Wakiso district in Central Uganda, at 0.5° N and 33° E and at an altitude of 1100 to 1300 masl (see Figure 1). The Nasirye catchment belongs to the Lake Kyoga basin and comprises an area of 33.2 km2, of which 4.5 km2 make up the Namulonge valley bottom wetland [57]. As with most parts of South-Central Uganda, the study site is characterized by an undulating topography with gentle, wavy slopes [58], and wetlands in a network of small, vegetated valley bottoms [59]. The mean annual rainfall is 1170 mm [60], and the climate is characterized by a bi-modal distribution of rainfall, with the long rains occurring from March to May and the short and more variable rains occurring from October to December.
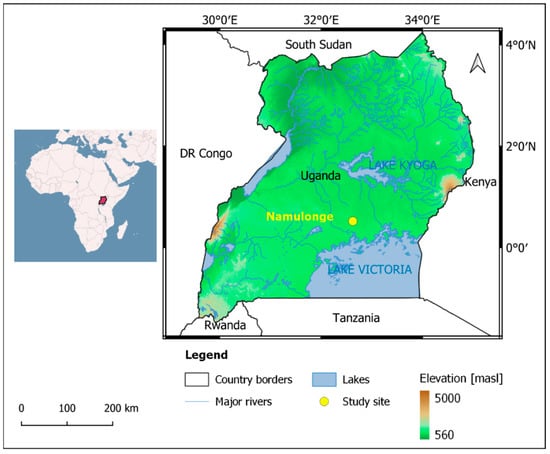
Figure 1.
Topographic map of Uganda and the position of the Namulonge study site.
The geology of the Namulonge study site is characterized by Archean granitoids and orthogneisses, Proterozoic orthoquartzites, and conglomerates, as well as slates, shales, and phyllites [61]. Regionally increased metamorphism led to the formation of porphyroblastic phyllites, which comprise about 50% muscovite that locally appears as coarse flakes [62]. As with most crystalline rocks in Uganda [63], the rocks in the study site are overlain by a thick weathering mantle, which comprises the residual soil, the saprolite, and the saprock [32]. Hydraulic conductivities in the saprolite and saprock are highly variable and decrease with depth. In central Uganda [63], researchers have found an average hydraulic conductivity of 10−4 m/s for the saprock and 10−6 m/s for the saprolite. The thickness of the saprolite varies between 17 and 49 m [64], and the upper part of the saprolite is characterized by the presence of kaolinitic clay minerals as well as sand and gravel as minor components.As the degree of weathering decreases with depth, the lower saprolite contains more primary minerals, and its texture is dominated by the middle-sand fraction [33]. The weathering profile acts as a semi-confined aquifer due to the lower hydraulic conductivity in the clay-rich upper saprolite and the higher conductivity in the sandy lower saprolite [33,65]. Nevertheless, preferential flow paths might be present in the upper saprolite, due to root penetration and cracks or because of the presence of interconnected sand veins. The quaternary alluvial sediments in the valley bottom are comprised of interconnected sand and gravel lenses, which are interbedded with clayey deposits [33].
The dominant soil type in the uplands is Eutric rhodic Nitisols, while the soils in the valley bottom are classified as Eutric umbric Gleysols or Eutric Gleyic Fluvisols along the tributaries of the main stream [34]. The Nasirye catchment belongs to the sub-humid agroecological zone of Lake Victoria Crescent [58]. While the natural vegetation in the valley bottom wetlands is papyrus (Cyperus papyrus) [66], the potential natural vegetation in the upland areas of the Nasirye catchment in Lake Victoria is drier, peripheral semi-evergreen Guineo-Congolian rain forest [67]. Currently, only small patches of natural vegetation can be found in the Nasirye catchment. Most of the area is cultivated by smallholder farmers who grow typical upland crops, such as maize (Zea mays), beans (Phaseolus vulgaris), and sweet potatoes (Ipomoea batatas) at the valley slopes, and rice (Oryza sativa) and taro (Colocasia esculenta) under (near-)saturated conditions in the wetland. A detailed land use map of the catchment can be found in [34].
2.2. Study Design
The study was designed as a plot study comprising three plots of 30 m × 105 m, stretching from the wetland fringe to the mid-slope position (see Figure 2a). Measurements were taken at different slope positions, covering the wetland fringe, the slope toe, the lower slope, and the mid-slope position (Figure 2b). On each plot, a different land-use type was established. While the plot under the bare fallow treatment was kept free of vegetation by weeding and spraying, native vegetation was allowed to grow back on the plot under semi-natural vegetation so that the plot was covered by high perennial grasses and small shrubs. The plot under crop production was left to a local small-scale farmer who cultivated cassava (Manihot esculenta) at the slope toe, sweet potatoes (Impomea batatus) at the lower slope, and maize (Zea mays) intercropped with beans (Phaseolus vulgaris) at the mid-slope position, following local practices and without any fertilizer application. Due to the land rights situation, no bare fallow treatment could be established at the wetland fringe. Instead, taro (Colocasia esculent) was cultivated by a local farmer. For the same reason, no measurement point could be established at the wetland fringe below the plot under semi-natural vegetation.

Figure 2.
(a) Position of the study area along the hill slope transect (W = wetland, ST = slope toe, LS = lower slope, MS = mid-slope, HT = hilltop) and soil profiles along the catena stretching from the wetland fringe to the hilltop (CL = clay loam, L = loam, SL = sandy loam, SCL = sandy clay loam) ((q) indicates that texture was manually determined in the field and not via laser diffraction in the laboratory). The colors are chosen according to qualitative observations in the field. Triangles mark the position of soil sampling points along the catena. (b) Overview of the experimental setup.
2.3. Data Collection and Analysis
As is common in hillslope hydrology, a multi-method approach was followed [68], which comprised geo-electrical measurements, as well as the monitoring of soil moisture and nitrate dynamics in the soil solution, and direct quantification of interflow and surface runoff. In this study, a hillslope-centered approach [68], in which water fluxes are directly studied at the slope, was chosen.
Two-dimensional electrical resistivity imaging surveys (ERT) [69] were conducted and applied in a reconnaissance fashion in order to gain further insights into subsurface structures and to assist in the interpretation of hydrological processes [31]. Measurements were taken along three transects in slope parallel and slope perpendicular directions, using the ABEM SAS 300C terra-meter (ABEM instrument AB, 161 02 Bromma, Sweden) in combination with the ABEM electrode switcher ES464 and multi-core cables to establish a multi-electrode resistivity system. The longest transect covered the entire slope length, starting from the wetland fringe and extending to the hilltop. Measurements were repeated at different electrode spacings of 0.7 m, 2.5 m, and 5 m in order to resolve shallow, as well as deep, structures. Electrodes were arranged following the Wenner array, as two of its attributes are a high signal strength and high resolution of horizontally layered subsurface structures [70]. As drilling results have revealed the presence of a horizontal layer with a high quartzite content, these attributes were desirable to reach a satisfying depth of investigation. Resistivity tomographies were finally derived using the inversion software RES2DInvx64 (ver. 4.8.18) [71].
Physical soil properties, soil moisture, and nitrate content in the soil solution were measured at the different slope positions under each land use type, as shown in Figure 2. Soil texture was determined using a laser diffraction particle size analyzer, Horiba L950 (Horiba Ltd., Kyoto, Japan) and the field saturated conductivity Kfs was measured using a single-ring infiltrometer.
Soil moisture was measured using a profile probe type PR2 [72], which is an FDR (frequency domain reflectometry) device. Measurements were taken at 10, 20, 30, and 40 cm depths every 2–3 days during the rainy season and once a week during the dry season. The soil water content at saturation Θs for each measurement depth was then calculated using the pedotransfer functions introduced by [73] and the correction factors for the effect of the skeletal fraction as described in [74].
For the purpose of nutrient analysis, the soil solution was abstracted using rhizon soil moisture samplers [75] from the upper (0-15 cm depth) and lower topsoil (15–30 cm depth), and the nitrate content was determined in situ using a Nitracheck reflectometer [76] with Merckoquant® test stripes. Sampling took place on the same days as the soil moisture measurements (i.e., every 2–3 days during the rainy season and once a week during the dry season) if the soil moisture could be abstracted. In addition to that, ion exchange resin capsules [77] were installed at every measurement point at the beginning of the rainy season, and nutrients adsorbed by the resin capsules were recovered by sequential shaking of each capsule in three batches of 20 mL 2 M HCl for 20 min, as described in [78], at the end of the season. Nitrate content in the HCl eluates was then photometrically analyzed using a continuous flow analyzer. Such an in situ installation of ion exchange resins provides a reliable index of nutrient bioavailability [79] and has proven to yield valuable results in solute transport studies [80,81].
At the slope toe of each plot, a micro-trench of 2 × 3 m2 was excavated. At the plots under crop production and semi-natural vegetation, water from the matrix, as well as from macropores, was jointly collected in clay-covered gutters of 1.5 m length at a depth of about 30 cm below the surface of the saprolite (see Appendix A). At the plot under bare fallow, the installation of a gutter was not possible, and hence interflow volumes could not be quantified. On the other plots, interflow volumes, as well as the nitrate concentration in the interflow, were determined every 2–3 days during the rainy season and once a week during the dry season. Interflow was collected in a measuring cylinder for 3 × 1 min, and the mean value was then extrapolated to derive the daily interflow volume. Due to static issues, the trenches could not be extended further downwards, so not all the lateral flow could be captured. Nevertheless, qualitative observations of interflow processes at a site are of “considerable pedagogic value” [19], as the dynamics related to land use type, seasonality, and rainfall patterns can be captured, and nutrient contents can be measured.
Surface runoff was collected in steel drums below three confined runoff plots per land-use type at the lower slope position (see Appendix A). The area of each runoff plot comprised 42 m2 until, in April 2017, the area was reduced to 30 m2 per plot in order to reduce runoff volumes and avoid overflow of the collectors. Each collector accommodated 245 L. Due to frequent overflow of the collectors at the plot under bare fallow, the collector volume at each runoff plot was increased to 490 L during the first and second rainy season 2017for this land use type. The runoff coefficient, i.e., the share of rainfall that is converted to surface runoff during a rainfall event, was calculated by dividing the surface runoff generated per unit area by the amount of rainfall received in that area.
In order to conduct a field-based analysis of the hydrological reaction of the different runoff components and the soil moisture to different rainfall conditions, precipitation was measured at the experimental site using a tipping bucket rain gauge with a resolution of 0.2 mm at a 1 min interval (Theodor Friedrichs & Co., Type 7041, Theodor Friedrichs & Co., Ltd., Schenefeld, Germany). For further analysis, the data were summarized to daily values for a 24 h time interval starting at 17:00 h and ending at 17:00 h on the following day, while the data were always assigned to the date at the end of the interval. This time frame was chosen in order to facilitate correlations with the other measurements, i.e., to relate the precipitation received during night hours to the measurements of soil moisture, surface runoff volumes, etc., on the following day. Rainfall intensity was calculated as the maximum amount of rainfall received during 15 min on each day.
A detailed description of the study setup and the methodological approach can be found in [82].
3. Results
3.1. Interflow Processes along the Slope
3.1.1. The “Fill-and-Drain” Mechanism
The ERT results, which are explained in more detail in the following section, revealed an undulating sub-surface topography of the upper saprolite in slope parallel, as well as slope perpendicular, directions (see Figure 3). This was also confirmed by shallow drilling logs. Analyzing Kfs, one could find higher Kfs values in the upper saprolite than in the soil’s B-horizon above it, with the difference being significant at two of the three sampling points (see Table 1). Nevertheless, interflow could only be detected in the trenches at the slope toe, not in the trenches at the lower slope position. Hence, it can be deduced that interflow did not pass along the soil-saprolite interface but was rather conducted towards the slope toe within the saprolite.

Figure 3.
Resistivity tomography with topography at a transect stretching from the wetland to the hilltop (500 m profile length), unit electrode spacing 2.5 m.

Table 1.
Field saturated conductivity (Kfs), coefficient of variation, and soil properties of the sub-soil and the upper saprolite at the mid-slope position of each plot (point 1: crop production; point 2: semi-natural vegetation; point 3: bare fallow).
We hypothesize that interflow generation along the slope is related to what we call the “fill-and-drain” mechanism, following the “fill-and-spill” mechanism described in [83]. Infiltrating water is conducted to the soil–saprolite interface via macropores from termite activity and via matrix flow. The higher Kfs values of the upper saprolite compared with the B-horizon prevent infiltration into the saprolite, and water is conducted to the depressions in the subsurface topography due to capillary diversion [84]. The water then pools in the depressions until the matrix potential is high enough locally to let a complete breakthrough [85] occur so that the water is transmitted to the saprolite (see Figure 4), where it is then transferred to the slope toe, as described in the following section.

Figure 4.
Schematic representation of the “fill-and-drain” mechanism at the soil–saprolite interface. Rainwater is conducted to the soil–saprolite interface via macropores (A) or via matrix flow (B) in the topsoil and subsoil. Infiltrating water is deflected to the depressions in the saprolite topography as a result of capillary diversion (C). When saturated conditions are reached in the depressions, a complete breakthrough occurs, and water is transmitted to the saprolite (D).
3.1.2. Interflow in the Saprolite
The electrical resistivity tomography (see Figure 3) revealed that below what can be interpreted as the soil body, at between 1 m and 6–11 m depth, a highly resistive layer (600–>1000 Ωm) occurred, while resistivities below that layer and down to the bottom of the model section were about 100–400 Ωm. Resistivities in the lower layer fell in the range of resistivities reported in the literature for saprolites in similar geology [86,87,88]. As no change to higher resistivities was detected at the bottom of the profile, it can be assumed that the saprolite was more than 30 m thick, which was confirmed by deep drilling logs sunk in some hundred meters distance by the Ugandan Ministry of Water and Environment. The high resistivities in the upper layer can be explained by a high skeletal content, the Fe2O3 content [89], and the high share of kaolinite clay minerals in this layer [90]. The resistivities encountered in the lower saprolite were an order of magnitude higher than values reported in the literature for saturated saprolitic material [91], and, therefore, no bigger and continuous aquifers seem to be present in the saprolite. During the installation of a water pump, though, a small aquifer was hit at about 27 m depth, which was not resolved by the ERT. Hence, it can be assumed that infiltrating water is conducted to the slope toe via smaller perched aquifers.
Analysis of the interflow dynamics during the year, as well as the event-based measurement, revealed the presence of a delayed, as well as a quick, interflow component. Figure 5 shows the dynamics of interflow from the plot under crop production and semi-natural vegetation in relation to rainfall amount and intensity and mean soil moisture along the slope at 0–20 cm and 20–40 cm depth. Interflow levels remained high over several weeks into the dry season, and the decrease in interflow volumes occurred later than the decrease in soil moisture at the slope, indicating the presence of a delayed interflow component. Interflow volumes increased towards the end of the rainy season and under rainfall conditions, which favor the transmission of rainfall to the saprolite (see Section 3.2), and, thus, the higher water content of the saprolite leads to higher interflow volumes. It can thus be assumed that the small, perched aquifers in the saprolite are connected over the rainy season. The signal of the rainfall conditions during the previous rainy season can still be seen in the following rainy season. In the second rainy season 2016, interflow volumes were still comparable to the previous rainy season, despite the small overall rainfall amount (see Table 2). Hence, transit times can be assumed to be up to several months.
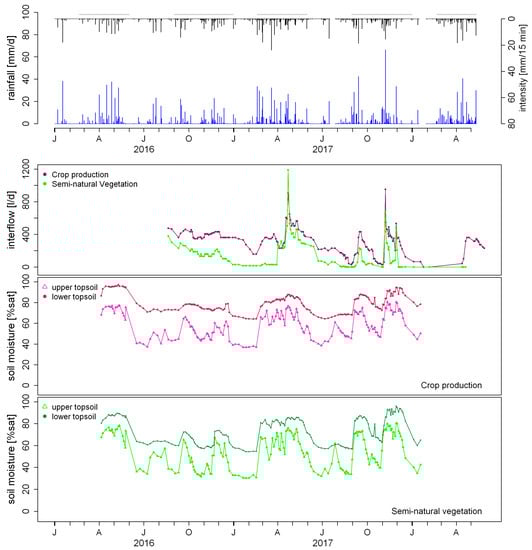
Figure 5.
Interflow at the plot under crop production and the plot under semi-natural vegetation during the investigation period (second panel), related to daily rainfall and max. 15 min. rainfall intensity (blue and black bars in the first panel) and soil moisture dynamics [% sat] at 0–20 cm and 20–40 cm depth under crop production (third panel) and under semi-natural vegetation (fourth panel). Grey bars indicate the duration of the rainy seasons. Timeline labeling “J A J O” refers to January, April, July, October.
Table 2.
Rainfall characteristics and main trends in the soil moisture dynamics during the four rainy seasons in 2016 and 2017.
Nitrate concentrations in the interflow were significantly different between the three land-use types during the rainy but also during the dry season, which again stresses the presence of a strong delayed interflow component. Nevertheless, concentrations were lower and more similar between the three land-use types during the dry season (see Figure 5). Hence, it can be assumed that the interflow water of the delayed interflow component mixes over bigger areas.
The event-based measurement (see Table 3) revealed an increase in interflow volumes of 31% at the plot under crop production and 17 % at the plot under semi-natural vegetation directly after the rainfall event. This fits the high interflow volumes measured on 22 April 2017, just some hours after a rainfall event (see Figure 5), and alludes to the presence of a quick interflow component. During the event-based measurement, the nitrate concentration in the interflow increased by 54% at the plot under crop production, while it decreased by 21% at the plot under semi-natural vegetation. As the nitrate content in the soil solution at the plot under crop production was significantly higher than at the plot under semi-natural vegetation, where nitrate contents in the soil solution were close to the detection limit, the infiltrating water at the plot under crop production leached nitrate from the topsoil causing the increase of nitrate in the interflow, while infiltrating water at the plot under semi-natural vegetation had a diluting effect on the nitrate concentration in the interflow. Hence, there is a contribution of event water to the quick interflow component.
Table 3.
Observations of hydrological parameters related to a single rain storm on 14 November 2017 (7.2 mm, max. intensity 5.2 mm, antecedent precipitation index [92] 16 mm). Measurements were taken before and one hour after the rainfall event.
Interflow water was found to enter the trenches at the slope toe via macropores, and macropores were further detected in the soil as well as in the upper saprolite. Hence, it is likely that the fast interflow component is related to a network of macropores that extends into the saprolite. Nevertheless, it is not known whether this network is continuous. Macropores can also get connected via nodes [20,21,22], which can be pockets of more permeable material connecting macropores in otherwise less permeable sediments or impermeable structures in a highly conductive material, which cause local saturation and, consequently, activation of macropores. As Ref. [33] assumes a high heterogeneity regarding the degree of weathering and hence the hydraulic attributes of the saprolite, a connection of macropores via nodes is quite likely in this environment.
Nitrate concentrations in the interflow at the plot under semi-natural vegetation were higher than in the soil solution at this land-use type (see Figure 7). This supports the hypothesis of a subsurface catchment, which extends beyond the plot limits so that water with a higher nitrate concentration is mixed with the water infiltrated under semi-natural vegetation.
3.2. Effect of Land Use Type and Rainfall Properties on Hillslope Hydrology and Associated Nitrate Transport
3.2.1. Effect of Rainfall Properties
Nitrate transport from the slope to the wetland is related to source factors, i.e., how much nitrate is available in the soil solution, and transport factors, i.e., how much water is available to leach and transport nitrate from and through the soil and the saprolite. Rainfall properties and distribution strongly influenced both.
Figure 6 depicts the runoff coefficients on the three plots during each rainfall event in relation to rainfall amount and intensity, as well as the mean soil moisture of the topsoil. Figure 7 shows the nitrate dynamics in the soil solution related to soil moisture and rainfall properties. Regarding the source factors, soil moisture conditions were the driving factor for the stimulation or inhibition of the mineralization of organic matter and the subsequent nitrification of ammonium at the plots under crop production and under bare fallow in all four rainy seasons.

Figure 6.
Daily rainfall (panel 1) and mean runoff coefficients on the plot under crop production, the plot under semi-natural vegetation, and the plot under bare fallow (panels 2–4, respectively). The dark lines represent the mean soil moisture at the slope under the respective land use type. The black × on top of a runoff bar indicates that the drums overflowed. The first panel depicts precipitation (light blue and blue bars) and rainfall intensity (grey bars). In this panel, the dark blue bars show rainfall amounts on days when surface runoff was generated, while the light blue bars show rainfall amounts when no surface runoff was generated. Timeline labeling “J A J O” refers to January, April, July, October.

Figure 7.
Interflow volumes from the plots under crop production and semi-natural vegetation, as well as rainfall (first panel). Panels two to four show the nitrate concentration in the interflow [mg NO3-N/L, mean nitrate content in the soil solution along the slope in the upper and lower topsoil [kg NO3-N/ha], and mean soil moisture [% sat.] along the slope in the upper and lower topsoil at the plot under crop production (second panel), the plot under semi-natural vegetation (third panel), and the plot under bare fallow (fourth panel). Timeline labeling “J A J O” refers to January, April, July, October.
Generally, the nitrate content in the soil solution followed the pattern described by the Birch effect (high nitrate contents due to high mineralization rates at the onset of the rains, followed by a steep decline due to leaching and denitrification over the rainy season), see Figure 7. Nevertheless, rainfall properties had an impact on the peculiarity of this pattern. As was the case in the first rainy season 2017, rainfall events of high intensity at the beginning of the rainy season resulted in higher surface runoff coefficients (and hence less infiltration) and thus delayed the rewetting of the soil see Figure 6). This effect was more pronounced at the plot under bare fallow due to higher runoff coefficients than at the plot under crop production. Hence, the mineralization of nitrate was delayed at the plot under bare fallow, while favorable conditions for mineralization but not yet leaching of nitrate caused comparably high nitrate contents in the upper topsoil at the plot under crop production. Intra-season wetting and drying cycles of the soil only stimulated nitrification when favorable moisture conditions were reached over several days (see Figure 7). In the second rainy season 2016, soil moisture was generally too low to stimulate the mineralization of organic material, so soil moisture fluctuations during the season did not increase the nitrate content in the soil solution.
Volumes of the delayed interflow component, as well as the persistence of interflow in the dry season, strongly depended on the amount of water conducted to the saprolite during a rainfall event and over the entire season. Hence, the total rainfall amount during the rainy season, as well as the distribution of rainfall over the season, had the strongest impact on interflow generation. Persistent high volumes of interflow were related to longer periods, i.e., several weeks, of reoccurring rainfall events, as can be seen in the first rainy season 2016 and 2017, and, generally, interflow volumes increased towards the end of the rainy season (see Figure 5).
However, smaller rainfall amounts, as well as an uneven distribution of rainfall over the rainy season, resulted in less interflow and a shorter persistence of flow in the dry season. The second rainy season 2017 was characterized by a bi-modal distribution of rainfall, with two single large rainfall events followed by smaller events. While the total amount of rainfall was equal to the first rainy season 2017, there was significantly less interflow (see Table 4), and interflow was not as persistent into the dry season, as less water was conducted to the saprolite due to high runoff coefficients during the big events (see Figure 5 and Figure 6). Furthermore, in the second rainy season 2017, high nitrate concentrations in the interflow at the plot under crop production persisted into the dry season, and the difference between the nitrate concentrations in the interflow at the plot under crop production and semi-natural vegetation was higher than during the other seasons (see Figure 7). Yet, the seasonal nitrate load was lower than during the other seasons (see Table 4). Hence, less sub-surface mixing of interflow water and, consequently, less dilution of event water took place, which alludes to the fact that sub-surface flow networks did not extend and get connected as effectively in the second rainy season 2017 as during the other seasons.
Table 4.
Seasonal input of water and nitrate to the wetland fringe by the interflow in the four rainy seasons in 2016 and 2017. Values embrace the rainy, as well as the following dry season, to account for the delayed component of the interflow.
Interflow volumes increased more slowly at the beginning of the rainy season when the rainfall intensity of the first rainfall events was high and caused a pronounced surface runoff component, as was the case in the first rainy season 2017 (see Figure 5 and Figure 6).
Due to the lack of continuous or event-based measurements, the impact of rainfall characteristics on the quick interflow component and, hence, the activation of preferential flow paths, could not be determined.
Figure 7 relates nitrate transport via the interflow to rainfall characteristics, soil moisture, nitrate availability in the topsoil, and interflow volumes. Nitrate transport via the interflow was most efficient when (a) due to favorable moisture conditions at the beginning of the season, the initial nitrate availability in the soil solution was high, and (b) when the following main rainy season was characterized by equally distributed rainfall events. This becomes evident in the first rainy season 2016 and 2017. Under these conditions, nitrate is easily leached from the soil and transported to the slope toe in the saprolite, where high moisture conditions allow the hydrological connectivity of perched aquifers. At the same time, single events of high magnitude can cause substantial leaching from the entire soil profile and stimulate nitrate transport to the slope toe via interflow (e.g., single events in April, September, and November 2017). The comparably small and sporadic rainfall events in the second rainy season 2016 were not sufficient to leach nitrate from the soil body and activate lateral nitrate transport in the saprolite. Table 4 shows the cumulative water and nitrate inputs by the interflow to the wetland fringe at the plot under semi-natural vegetation and under crop production. It has to be considered, though, that the numbers presented here mainly comprise the delayed component of interflow, as no continuous measurements could be conducted. Thus, actual interflow volumes and nitrate loads can be assumed to be higher, as the event-based measurement described above proves the existence of a pronounced quick interflow component.
3.2.2. Effect of the Land-Use Type
Under the present geological conditions, where interflow is conducted within the saprolite and not close to the soil surface, less water is transmitted to the wetland from a slope under semi-natural vegetation than under crop production, as the high evapotranspiration outweighs the effect of higher infiltration rates.
Due to the dense plant cover, runoff coefficients on the plot under semi-natural vegetation were significantly lower (and hence infiltration of rainfall into the soil was higher) than at the plots under crop production and bare fallow (see Figure 6). Furthermore, the infiltration rate at the soil surface [82] and Kfs of the B-horizon were higher than under the other two land-use types (see Table 1). Nevertheless, higher infiltration rates did not lead to higher degrees of saturation at depth, as the soil moisture content at 40 cm depth was lower under semi-natural vegetation compared with the other two land use types (see Figure 7). Moreover, interflow volumes under semi-natural vegetation were lower than under crop production throughout the study period, and interflow volumes decreased faster at the beginning of the dry season (see Figure 5). The increase in interflow during the event-based measurement was smaller (see Table 3) than under crop production, so the presence of a pronounced fast interflow component under semi-natural vegetation is not expected.
Source and transport factors for nitrate transport from the slope to the wetland are strongly influenced by the land-use type. Overall, the nitrate content in the soil solution, as well as the seasonal cumulative bio-available nitrate, were significantly lower at the plot under semi-natural vegetation than at the plots under crop production and bare fallow and close to the detection limit throughout the experiment (see Figure 7). The analysis of the nitrate dynamics during the single seasons reveals that under crop production and bare fallow, mineralization, leaching, and denitrification dominated at different times at each plot during each season [82]. Hence, nitrate availability in the soil solution was different between these two land-use types in the course of each rainy season, depending on the prevailing rainfall characteristics and the resulting soil moisture conditions.
The influence of the land-use type on nitrate accumulation in the soil solution and nitrate losses from the topsoil on the slopes also depends on the rainfall amount and pattern during the rainy season. Figure 8 shows the cumulative potentially bio-available amount of nitrate in the upper and lower topsoil under the three different land-use types. At the plot under crop production and under bare fallow, soil moisture conditions also affected the total amount of potentially bio-available nitrate in the four rainy seasons. The effect was statistically significant in the second rainy season 2017, when high runoff coefficients on the plot under bare fallow prevented nitrate leaching from the soil, while higher infiltration under crop production caused substantial nitrate losses.

Figure 8.
Seasonal cumulative bio-available nitrate displayed as resin adsorption quantities (RAQ) [μmol/cm2] in the upper (light colors) and lower topsoil (dark colors) at each land-use type (different colors). Values are given for the four rainy seasons in 2016 and 2017.
The nitrate load, as well as the nitrate concentrations in the interflow, were significantly lower and less variable at the plot under semi-natural vegetation than at the plot under crop production due to the limited availability of leachable nitrate in the soil solution (see Figure 7). The data in Table 4 show that the input from the plot under crop production was about four times higher than the input from the plot under semi-natural vegetation in the second rainy season 2016 and the first rainy season 2017. In the second rainy season 2017, there was less input from both plots, but the difference between the two land-use types was even higher, as there were seven times as much nitrate input from the plot under crop production. As described above, there was less mixing of sub-surface waters in this season, and, hence, the signal of the heavy rainfalls was transmitted more directly, leading to a dilution of nitrate in the interflow under semi-natural vegetation while causing intense leaching and, thus high nitrate concentrations and loads in the subsurface runoff under crop production.
Overall, the effect of a dense vegetation cover on source and transport factors superimposed that of variable climatic conditions.
3.3. Water and Nutrient Availability at the Wetland Fringe
3.3.1. Hydrological Connectivity to the Wetland
In the wetland, a shallow aquifer in the wetland soils is separated from an aquifer in the valley sediments, as shown by the geo-electrical measurements, as well as by drilling logs. The extent of low resistivities (10–100 Ωm) below 1 m depth in the ERT profile (see Figure 9) corresponds well to the observed extent of the wetland in the field. The higher resistivities (180–500 Ωm) in the upper 100 cm of this profile section, though, allude to a separation of the shallow aquifer in the wetland soils and the aquifer in the wetland sediments. Drilling logs at the wetland fringe further revealed the presence of a clay loam layer about 110 cm depth (see Appendix B). This layer probably acts as a hydrological barrier separating the two aquifers.

Figure 9.
Electrical resistivity tomography with topography (unit electrode spacing 0.7 m) of a transect stretching from the wetland fringe to the mid-slope position at the plot under crop production.
The interflow water from the slopes contributes to both aquifers as a consequence of the geology at the transition from the upland to the wetland.
Drilling logs revealed that interflow from the saprolite impounded on a layer of horizontally layered muscovite about 180 cm deep at the slope toe, of which the upper boundary is weathered to a dark reddish clay loam (see Figure 10). The saprolitic material above this layer is covered by a colluvial sandy loam layer, both of which show redoximorphic features as the impounded interflow water welled up into these layers. The colluvial sand layer was found to continue into the wetland on top of the clay loam layer, which separates the two aquifers in the wetland. The muscovite layer, on the other hand, meets the valley sediments below the clay loam layer. Hence interflow from the slopes contributes to both aquifers (see Figure 11).

Figure 10.
Soil profiles of the measuring points at the slope toe on the plots under crop production (P10), semi-natural vegetation (P11), and under bare fallow (P12), showing soil color (as qualitatively observed in the field), texture, and skeletal fraction. The soil texture of the lower four horizons at P10 was analyzed manually in the field (q). CL = clay loam, L = loam, SL = sandy loam.

Figure 11.
Schematic representation of the geology at the slope toe and the transition to the wetland. The blue area indicates the presence of interflow above the muscovite layer in the saprolite, and the blue arrows mark its connection and, hence, water passage into the shallow aquifer in the wetland soils, as well as to the aquifer in the valley sediments. Colors were chosen according to field observations where possible. Note that the extent of the different layers is not true to scale. The triangle shows the water table in the saprolite.
In addition to that, infiltrating surface runoff partially feeds into the interflow component at the slope toe. This can be deducted from the moderately positive correlation (Spearman correlation coefficient rho = 0.5) of surface runoff and interflow volumes, as well as of the nitrate load in the interflow and in the surface runoff at the plot under crop production, where nitrate losses via surface runoff were high.
3.3.2. Water and Nutrient Delivery to the Wetland Fringe
Water availability at the wetland fringe is not solely driven by (sub-)surface flow from the slopes. Figure 12 depicts interflow volumes and nitrate loads at the plot under crop production in relation to soil moisture content and nitrate content in the soil solution at the corresponding measurement points at the wetland fringe. Graphical analysis of the time series revealed that high and low interflow volumes did not frequently coincide with respectively high or low soil moisture levels at the wetland fringe. Hence, other sources must have contributed to the water availability at the wetland fringe as well. Correlation analysis revealed no correlation between the soil moisture and water inputs by surface runoff or runoff coefficients. The moderate correlation between interflow volumes and soil moisture at the wetland fringe of rho = 0.7, on the other hand, confirms that interflow contributes to the soil water (and hence the available plant water) at the wetland fringe. Nevertheless, it has to be considered that the soil moisture status at this slope position was at or near saturation throughout the year, so the additional water inputs did not necessarily change the soil moisture status.

Figure 12.
Interflow volumes and associated nitrate load at the plot under crop production (first panel) compared with the nitrate content in the soil solution and the soil moisture dynamics in the upper and lower topsoil of two measurement points in the wetland downslope of the plot under crop production (panels two and three). Timeline labeling “J A J O” refers to January, April, July, October.
Nitrate in the soil solution at the wetland fringe is derived from inputs via inflowing water and not from in-situ mineralization. Correlation analysis revealed a positive correlation of rho = 0.6 between the nitrate content in the soil solution and soil moisture at the wetland fringe, even if soil moisture conditions were mostly too wet to stimulate nitrification. The graphical analysis of the time series showed that higher inputs from the interflow frequently coincided with higher nitrate contents in the soil solution at the wetland fringe (see Figure 12). Nevertheless, the overall correlation between the nitrate input via the interflow and the nitrate content in the soil solution was not significant (rho < 0.3). The low correlation of the nitrate content in the soil solution at the wetland fringe to rainfall amount and intensity (rho < 0.2) further suggests that the quick interflow component, which was not captured by this study, does not significantly drive the nitrate dynamics at the wetland fringe, as high inputs would be expected during intensive rainfall events. Regarding the contribution of the surface runoff, a weak correlation of rho = 0.4 between the nitrate input via surface runoff and the nitrate content in the soil solution at the wetland fringe was detected. Hence, while interflow and surface runoff from the adjacent slope contribute to the nitrate availability, nitrate inputs from other water sources need to be considered as well.
While there is a considerable input of nitrate by interflow and surface runoff from the slope, nitrate is lost quickly from the soil-plant system at the wetland fringe.
The mean seasonal nitrate-N input from the plot under crop production to the wetland fringe was found to be about 30 kg NO3-N/ha, of which 12 kg/ha were delivered by the surface runoff and 17 kg/ha by the interflow. The actual nitrate input from the slopes will exceed this value, as the quick interflow component was not captured in this study, and also, the constructional design of the interflow collection trenches at the slope toe did not allow the capture of the interflow from the entire soil profile. Hence, nitrate inputs from the adjacent slope were equivalent to at least half the seasonal N uptake of rice plants, as Ref. [93] found the seasonal N-uptake of rice plants on unfertilized plots at the wetland fringe of the same wetland to be around 70 kg N/ha. Nevertheless, the nitrate content in the soil solution at the wetland fringe was constantly very low (with a mean value of 0.3 kg NO3-N/ha) and significantly lower than at the upland positions. The same is true for the seasonal, potentially bio-available nitrate captured by the resin capsules (see Figure 13). As the ion exchange resins are regarded to be as strong a competitor for nutrients as plant roots are, it can, hence, be assumed that nitrate inputs from the slope are lost quickly from the soil-plant system at the wetland fringe due to denitrification and leaching under the constantly high soil moisture conditions.

Figure 13.
Seasonal potentially bio-available nitrate as captured by the ion-exchange resins at the wetland fringe and at the upland positions.
4. Discussion
4.1. Hillslope Hydrology and Connectivity to the Wetland
The nitrate inputs from the slope to the wetland fringe, as found in this study, are comparable to those reported from studies in western Africa, even if a direct comparison is difficult due to the different methodological approaches of the studies. Ref. [13], for example, found seasonal nitrate inputs of 32 kg NO3-N/ha from slopes under crop production in an inland valley in Ghana, and Ref. [94] reported inputs of 47 kg NO3-N/ha from slopes under bare fallow and 39 kg NO3-N/ha from slopes under crop production (Cajanus cajan) in an inland valley in Côte d’Ivoire. The characteristic interflow processes, though, differ from those encountered in western Africa. While the presence of an impermeable petro-plinthic horizon, or “curasse”, as frequently found in western Africa, favors interflow generation and routing close to the surface, the higher hydraulic conductivity and the undulating subsurface topography of the upper saprolite in this study caused the transfer of infiltrating rainwater to the deeper saprolite via the “fill-and-drain” mechanism. As a consequence, transit times in the dynamic network of subsurface flow paths within the saprolite are longer, and, other than in the studies from western Africa, no seasonal pattern of nitrate inputs to the wetland via the interflow could be detected.
Nevertheless, further research is needed to prove the hypotheses related to interflow processes and water and nutrient inputs to the wetland fringe in the Namulonge wetland. To prove and further elaborate on the concept of the “fill- and-drain” mechanism, continuous measurements of the matrix potential of the soil above the saprolite are needed, which could show the formation of a saturated layer and the consequent breakthrough and drainage of water to the saprolite. Equally, continuous measurements of the interflow and associated nitrate loads would be needed to capture and quantify water and nutrient inputs by the quick component of the interflow, as currently, these values are most likely underestimated, and peaks due to flushing are missed. Continuous measurements would further improve the process of understanding the impact of variable climatic and soil moisture conditions on preferential flow mechanisms. At the same time, there is some uncertainty related to interflow quantities and the calculation of the cumulative interflow volumes due to the setup of the trenches and the choice of a trench study as such. Ref. [68] points out that trenches must be deep enough to capture all the lateral flow and wide enough to spatially capture varying flow pathways. Due to constructional difficulties and monetary limitations, both criteria were probably not fully met in this study. Furthermore, no lateral subsurface boundary, such as a plastic sheet, etc., was installed. Therefore, the subsurface catchment for each trench remains unknown, which adds uncertainty to area-related statements. (Multi-)tracer and irrigation trials could give further insights into the complexity of interflow processes and shed light on the magnitude of internal storage, flow generation thresholds, and large-scale hydraulic characteristics [28].
In her study on the hydrogeological characteristics of the Namulonge wetland, Ref. [33] differentiated three aquifers in the valley bottom: the aquifer in the wetland soils, the aquifer in the valley sediments, and the deep regional aquifer. From her geochemical analysis, she concluded that the aquifer and vadose zone in the wetland soils and locally also the aquifer in the valley sediments were recharged by lateral fluxes from the slopes, which was confirmed by the results of this study. Ref. [33] further found that the aquifers are locally connected so that positive hydraulic heads might lead to water input from the aquifer in the valley sediments into the aquifer in the wetland soils. This hydraulic head of the aquifer in the valley sediments is not only driven by water input from the interflow but also by water input from the deep aquifer, as well as piston flow from the upper catchment. This explains why soil moisture at the wetland fringe is not well-correlated to water inputs by the interflow. Furthermore, not all peaks in the nitrate content in the soil solution could be explained by the present data on nitrate input from the slopes, and high inputs from the slopes did not always cause a positive response in the nitrate content in the soil solution. Therefore, water and nitrate fluxes from the upstream areas of the wetland probably also had an impact on the nutrient dynamics at the measuring points at the wetland fringe. Further research is needed to analyze the contribution of interflow from the slope and from the upstream areas of the wetland to the different aquifers. Nevertheless, the significant difference between the three measuring points in the wetland, and especially between the two measuring points downslope of the plot under crop production, stresses that, at the same time, small-scale spatial variability is extremely high. Therefore, in situ processes related to mineralization, macropore structure, and other factors impacting flow routing have to be considered as well.
4.2. Influence of the Land-Use Type on Hillslope Hydrology and Nitrate Availability
In the literature, opinions on the effect of perennial vegetation on lateral flow processes differ. Some authors state that there is more lateral subsurface runoff and especially preferential flow under perennial vegetation [53,95] or after the re-cultivation with grassy and shrub-like vegetation [54] due to an increased infiltration via macropores from root channels and soil faunal activity. Nevertheless, other authors describe that lateral flow components are less likely to develop under perennial vegetation [55], which corresponds to the results of this study. They refer to the fact that deeper roots and a denser root network of grasses, trees, and shrubs extract larger volumes of water. Hence, the evapotranspiration is higher, leading to drier conditions and, thus, less lateral flow. Using ArcSWAT and SWATgrid, Ref. [34] modeled the impact of different land management options on the water balance components in the Nasirye catchment. Their results partly correspond to the observations made here. For the ArcSwat, lateral flow decreased under the slope conservation scenario in which afforestation with the tropical highland rainforest of the previously cultivated slopes was simulated. For the SWATgrid, on the other hand, the lateral flow was found to increase under slope conservation. Further research, including a refined modeling approach, would be needed to quantify the effect of land use changes in the catchment on water availability in the wetland so that management practices and crop selection in the wetland, as well as in the upland, can be adjusted accordingly.
Regarding the effect of different land-use types on nitrate availability in the soil solution, the findings presented here agree with the literature in many aspects. Several authors reported a very low nitrate content under grasses and shrubs and under early to mid-successional vegetation [96,97,98]. They explained these low values by high nutrient demands due to high rates of photosynthesis, rapid increase in leaf area and biomass, a dense and extensive root system of grass vegetation, and high turnover rates of nitrates. In contrast, faster nutrient release and accompanying nitrate losses are caused by an accelerated turnover of the labile SOM pool due to tillage, incorporation of crop residues, and the removal of primary vegetation at sites under crop production [39,99]. Ref. [52] also found the nitrate content under bare fallow and under crop production to be strongly associated with soil moisture and rainfall incidence during their research on the dynamics of soil nitrate under bare fallow, grassland, and sorghum crops in semi-arid Kenya. Yet, they constantly detected a higher nitrate content at the plots under bare fallow but could not witness significant leaching processes on either of the plots.
4.3. Management Recommendations
Despite the nitrate inputs via interflow from the slope and in the wetland, nitrate availability in the soil solution at the wetland fringe was very low, as nitrate was quickly lost from the soil–plant system due to denitrification, runoff, and leaching. Therefore, agricultural interventions should focus on maintaining the nitrate in the soil-plant system before it enters the anaerobic wetland environment. Under the current cultivation practices in the upland, agricultural interventions should focus on the slope toe, where the cultivation of nitrate-demanding crops could prevent the loss of nitrogen from the soil–plant system. Nevertheless, the selection of crops should consider a rooting depth that allows the plants to stimulate nutrient fluxes from the interflow in the sandy loam layer towards the plant, as there is no accumulation of nitrate in the topsoil. On the other hand, agricultural management practices should aim at minimizing nitrate losses via leaching from the fields in the upland. This could include the cultivation of perennial crops, such as cassava (Manihot esculenta), as the timing of high nitrate demands of seasonal crops might not match with the highest nitrate availability after the onset of the rains. In addition, a shift to agroforestry should be considered as an alternative land management strategy along the slopes. For one, the cultivation of deep rooting plants, which are able to recover nitrate that was leached from the soil and consequently collected in surface depressions of the upper saprolite, would help to keep the nitrate in the soil–plant system. At the same time, the continuous groundcover and the interruption of surface runoff paths by tree stems would increase the infiltration of rainwater and reduce water and nitrate losses via surface runoff and hence increase the water-use efficiency on the slopes. This is supported by the findings of this study related to the effect of semi-natural vegetation on water and nutrient fluxes along the slope. Nevertheless, the implementation of agroforestry systems could be hindered by the current situation of land tenure, as most of the small-scale farmers in the catchment do not own the land they cultivate and might, therefore, not be able or motivated to engage in long-term land management practices [100].
4.4. Transferability
The extrapolation of the results to other parts of the catchment, as well as general conclusions on the effect of different land-use types, are restricted by the limited spatial coverage of the experiments, as only one hillslope was considered in this study. Due to the high heterogeneity of the saprolite and the role this plays in the development of perched waters, as well as for the activation of preferential flow paths and interflow volumes, the situation might actually vary strongly between different sites. Yet, the trouble of capturing the spatial and temporal variability of preferential lateral flow lies at the heart of hillslope hydrology [101,102] and gets aggravated by the fact that preferential flow paths are as such dynamic and evolve over time [20].
Generally, as most parts of the land surface in East Africa are covered by a thick saprolite [32], the Namulonge wetland can be considered a representative site for valley bottom wetlands in an undulating topography. Hence, processes related to hillslope hydrology and water recharge of the wetland aquifers are indicative of other wetlands in the region as well. Nevertheless, as discussed before, hydrogeological properties of the saprolite are finally responsible for interflow processes and the associated translocation of nutrients along the slopes. Therefore, characteristic processes, as well as water quantities, might vary strongly between different sites and cannot be assumed without previous geological exploration of the site in question. The results of this study stress the importance of a thorough understanding of the local hillslope hydrology to include catchment–wetland interactions in wise land management and agricultural decision-making, which is at the base of enhancing food security in the region. Nevertheless, this study also revealed the complexity of subsurface runoff processes in saprolitic environments. Therefore, further research on interflow processes is needed at the slope-scale to fully understand water pathways within the saprolite. Such knowledge could help to improve existing models of the catchment hydrology in valley bottom wetlands and thus yield the basis for scenario analysis regarding climate change and land-use change impacts on water and nutrient translocation from the slopes to the wetland. Nevertheless, the experiments should further be repeated in other valley bottom wetlands in the region, which are characterized by a similar geology. Such an extension would show whether the results are transferable to valley bottom wetlands in East Africa in general and would allow the exploration of common attributes that are indicative of the prevailing interflow processes.
5. Conclusions
This study extended the existing knowledge on the hillslope hydrology of valley bottom wetlands by focusing on a hillslope that is characterized by interflow processes within a deep saprolite. It showed that depending on the local geology at the transition from the upland to valley sediments, interflow in the deeper saprolite can contribute to the shallow aquifer in the wetland soils, as well as to the aquifer in the valley sediments. The case study of the Namulonge wetland revealed that interflow processes in the saprolite and their contribution to aquifers in the valley bottom wetland are the result of a rather complex combination of subsurface topography, heterogeneous weathering of crystalline rocks, and a certain stratigraphy along the slope and at the slope toe. This stresses the importance of a sound (hydro)-geological exploration of the slopes adjacent to valley bottom wetlands when investigating wetland–catchment interactions and when transferring the results to different sites.
Author Contributions
Conceptualization, C.S., B.D. and M.B.; methodology, C.S., B.D. and M.B.; writing—original draft preparation, C.S.; writing—review and editing, C.S., B.D. and M.B.; supervision, B.D. and M.B.; funding acquisition, B.D. and M.B. All authors have read and agreed to the published version of the manuscript.
Funding
This research was funded by the German Federal Ministry of Education and Research (grant number FKZ: 031A250A-H) and the German Federal Ministry for Economic Cooperation and Development under the auspices of GlobE: Wetlands in East Africa project.
Data Availability Statement
Data is contained within the articleand in [82].
Acknowledgments
We would like to thank the Ugandan National Crop Resources Research Institute (NaCRRI) for granting us access to their research facilities and highly appreciate the assistance given by our country coordinator, Michael Ugen, and by our field assistant, Abdul Kawere, and the entire team in Namulonge, as well as our lab staff, Gabriele Kraus, Camilla Kurth, and Angelika Veits. The support from the Episcopal foundation, Cusanuswerk, is highly appreciated.
Conflicts of Interest
The authors declare no conflict of interest. The funders had no role in the design of the study; in the collection, analyses, or interpretation of data; in the writing of the manuscript; or in the decision to publish the results.
Appendix A
Front view of a micro-trench for interflow collection at the slope toe (a) and setup of the surface runoff plots and runoff collectors at the lower slope position (b).


Appendix B
Soil profiles of the measuring points at the slope toe position. W0 and W1 were located downslope of the plot under agriculture, while point W2 was located downslope of the plot under bare fallow. The upper panel shows the soil color (as observed qualitatively in the field), the skeletal fraction symbolized by the share of the plot area covered by the black circles and the soil texture (CL = clay loam, L = loam, SL = sandy loam). The lower panel displays the clay content in the different soil layers.


References
- Tully, K.; Sullivan, C.; Weil, R.; Sanchez, P. The State of Soil Degradation in Sub-Saharan Africa: Baselines, Trajectories, and Solutions. Sustainability 2015, 7, 6523–6552. [Google Scholar] [CrossRef]
- von der Heyden, C.J.; New, M.G. The Role of a Dambo in the Hydrology of a Catchment and the River Network Downstream. Hydrol. Earth Syst. Sci. 2003, 7, 339–357. [Google Scholar] [CrossRef]
- World Ressources Institute. Ecosystems and Human Well-Being: Wetlands and Water, Synthesis; Millennium Ecosystem Assessment; World Resources Institute: Washington, DC, USA, 2005; ISBN 978-1-56973-597-8. [Google Scholar]
- NEMA. State of Environment Report for Uganda 2018/2019; National Environmental Management Authority: Kampala, Uganda, 2019.
- Ramsar Convention Secreteriat. An Introduction to the Ramsar Convention on Wetlands, 7th ed.; Ramsar Convention Secreteriat: Gland, Switzerland, 2016. [Google Scholar]
- Beuel, S.; Alvarez, M.; Amler, E.; Behn, K.; Kotze, D.; Kreye, C.; Leemhuis, C.; Wagner, K.; Willy, D.K.; Ziegler, S.; et al. A Rapid Assessment of Anthropogenic Disturbances in East African Wetlands. Ecol. Indic. 2016, 67, 684–692. [Google Scholar] [CrossRef]
- Kotze, D.C.; Ellery, W.N.; Macfarlane, D.M.; Jewitt, G.P.W. A Rapid Assessment Method for Coupling Anthropogenic Stressors and Wetland Ecological Condition. Ecol. Indic. 2012, 13, 284–293. [Google Scholar] [CrossRef]
- Ollis, D.; Snaddon, K.; Job, N.; Mbona, N. Classification System for Wetlands and Other Aquatic Ecosystems in South Africa. User Manual: Inland Systems; SANBI Biodiversity Series; South African National Biodiversity Institute: Pretoria, South Africa, 2013; Volume 22, ISBN 978-1-919976-75-4. [Google Scholar]
- Erwin, K.L. Wetlands and Global Climate Change: The Role of Wetland Restoration in a Changing World. Wetl. Ecol Manag. 2009, 17, 71–84. [Google Scholar] [CrossRef]
- McFarlane, M.J. Groundwater Movement and Water Chemistry Associated with Weathering Profiles of the African Surface in Parts of Malawi. In Hydrogeology of Crystalline Basement Aquifers in Africa; Wright, E.P., Burgess, W.G., Eds.; Geological Society Special Publication: London, UK, 1992; Volume 66, pp. 101–129. [Google Scholar]
- Bullock, A. Dambo Hydrology in Southern Africa—Review and Reassessment. J. Hydrol. 1992, 134, 373–396. [Google Scholar] [CrossRef]
- Braun, J.-J.; Dupré, B.; Viers, J.; Ngoupayou, J.R.N.; Bedimo, J.-P.B.; Sigha-Nkamdjou, L.; Freydier, R.; Robain, H.; Nyeck, B.; Bodin, J.; et al. Biogeohydrodynamic in the Forested Humid Tropical Environment: The Case Study of the Nsimi Small Experimental Watershed (South Cameroon). Bull. de la Société Géologique de Fr. 2002, 173, 347–357. [Google Scholar] [CrossRef]
- Asante, M.; Becker, M.; Angulo, C.; Fosu, M.; Dogbe, W. Seasonal Nitrogen Dynamics in Lowland Rice Cropping Systems in Inland Valleys of Northern Ghana. J. Plant Nutr. Soil Sci. 2017, 180, 87–95. [Google Scholar] [CrossRef]
- Giertz, S.; Diekkrüger, B.; Steup, G. Physically-Based Modelling of Hydrological Processes in a Tropical Headwater Catchment (West Africa)-Process Representation and Multi-Criteria Validation. Hydrol. Earth Syst. Sci. Discuss. 2006, 10, 829–847. [Google Scholar] [CrossRef]
- Idrissou, M. Modeling Water Availability for Smallholder Farming in Inland Valleys under Climate and Land Use/Land Cover Change in Dano, Burkina Faso; Rheinische Friedrich Wilhelms Universität Bonn, Institute of Geography: Bonn, Germany, 2020. [Google Scholar]
- Yameogo, P.L.; Becker, M.; Segda, Z. Seasonal Soil Nitrogen Dynamics Affect Yields of Lowland Rice in the Savanna Zone of West Africa. J. Plant Nutr. Soil Sci. 2021, 184, 98–111. [Google Scholar] [CrossRef]
- McCartney, M.P. The Water Budget of a Headwater Catchment Containing a Dambo. Phys. Chem. Earth Part B Hydrol. Ocean. Atmos. 2000, 25, 611–616. [Google Scholar] [CrossRef]
- Beven, K.; Germann, P. Macropores and Water Flow in Soils. Water Resour. Res. 1982, 18, 1311–1325. [Google Scholar] [CrossRef]
- Jarvis, N.; Koestel, J.; Larsbo, M. Understanding Preferential Flow in the Vadose Zone: Recent Advances and Future Prospects. Vadose Zone J. 2016, 15, 1–11. [Google Scholar] [CrossRef]
- Nieber, J.L.; Sidle, R.C. How Do Disconnected Macropores in Sloping Soils Facilitate Preferential Flow? Hydrol. Process. 2010, 24, 1582–1594. [Google Scholar] [CrossRef]
- Noguchi, S.; Tsuboyama, Y.; Sidle, R.C.; Hosoda, I. Morphological Characteristics of Macropores and the Distribution of Preferential Flow Pathways in a Forested Slope Segment. Soil Sci. Soc. Am. J. 1999, 63, 1413–1423. [Google Scholar] [CrossRef]
- Sidle, R.C.; Noguchi, S.; Tsuboyama, Y.; Laursen, K. A Conceptual Model of Preferential Flow Systems in Forested Hillslopes: Evidence of Self-Organization. Hydrol. Process. 2001, 15, 1675–1692. [Google Scholar] [CrossRef]
- Meerveld, H.J.T.; McDonnell, J.J. Threshold Relations in Subsurface Stormflow: 1. A 147-Storm Analysis of the Panola Hillslope. Water Resour. Res. 2006, 42, 1–11. [Google Scholar] [CrossRef]
- Sidle, R.C.; Tsuboyama, Y.; Noguchi, S.; Hosoda, I.; Fujieda, M.; Shimizu, T. Stormflow Generation in Steep Forested Headwaters: A Linked Hydrogeomorphic Paradigm. Hydrol. Process. 2000, 14, 369–385. [Google Scholar] [CrossRef]
- Zehe, E.; Flühler, H. Slope Scale Variation of Flow Patterns in Soil Profiles. J. Hydrol. 2001, 247, 116–132. [Google Scholar] [CrossRef]
- Kirchner, J.W. A Double Paradox in Catchment Hydrology and Geochemistry. Hydrol. Process. 2003, 17, 871–874. [Google Scholar] [CrossRef]
- Van Stempvoort, D.R.; MacKay, D.R.; Koehler, G.; Collins, P.; Brown, S.J. Subsurface Hydrology of Tile-Drained Headwater Catchments: Compatibility of Concepts and Hydrochemistry. Hydrol. Process. 2021, 35, e14342. [Google Scholar] [CrossRef]
- Jackson, C.R.; Du, E.; Klaus, J.; Griffiths, N.A.; Bitew, M.; McDonnell, J.J. Interactions among Hydraulic Conductivity Distributions, Subsurface Topography, and Transport Thresholds Revealed by a Multitracer Hillslope Irrigation Experiment. Water Resour. Res. 2016, 52, 6186–6206. [Google Scholar] [CrossRef]
- Klaus, J.; Jackson, C.R. Interflow Is Not Binary: A Continuous Shallow Perched Layer Does Not Imply Continuous Connectivity. Water Resour. Res. 2018, 54, 5921–5932. [Google Scholar] [CrossRef]
- Kahl, G.; Ingwersen, J.; Nutniyom, P.; Totrakool, S.; Pansombat, K.; Thavornyutikarn, P.; Streck, T. Micro-Trench Experiments on Interflow and Lateral Pesticide Transport in a Sloped Soil in Northern Thailand. J. Environ. Qual. 2007, 36, 1205–1216. [Google Scholar] [CrossRef] [PubMed]
- Wenninger, J.; Uhlenbrook, S.; Lorentz, S.; Leibundgut, C. Identification of Runoff Generation Processes Using Combined Hydrometric, Tracer and Geophysical Methods in a Headwater Catchment in South Africa/Identification Des Processus de Formation Du Débit En Combinat La Méthodes Hydrométrique, Traceur et Géophysiques Dans Un Bassin Versant Sud-Africain. Hydrol. Sci. J. 2008, 53, 65–80. [Google Scholar] [CrossRef]
- Chilton, P.J.; Foster, S.S.D. Hydrogeological Characterisation and Water-Supply Potential of Basement Aquifers in Tropical Africa. HYJO 1995, 3, 36–49. [Google Scholar] [CrossRef]
- Burghof, S. Hydrogeology and Water Quality of Wetlands in East Africa-Case Studies of a Floodplain and a Valley Bottom Wetland; Rheinische Friedrich Wilhelms Universität Bonn, Steinmann Institute for Geology, Mineralogy und Paleontology: Bonn, Germany, 2017. [Google Scholar]
- Gabiri, G.; Leemhuis, C.; Diekkrüger, B.; Näschen, K.; Steinbach, S.; Thonfeld, F. Modelling the Impact of Land Use Management on Water Resources in a Tropical Inland Valley Catchment of Central Uganda, East Africa. Sci. Total Environ. 2019, 653, 1052–1066. [Google Scholar] [CrossRef] [PubMed]
- UBOS (Uganda Bureau of Statistics). Annual Agricultural Survey (AAS) 2021; Uganda Bureau of Statistics: Kampala, Uganda, 2021. [Google Scholar]
- Wairegi, L.W.I.; van Asten, P.J.A.; Tenywa, M.M.; Bekunda, M.A. Abiotic Constraints Override Biotic Constraints in East African Highland Banana Systems. Field Crops Res. 2010, 117, 146–153. [Google Scholar] [CrossRef]
- Senthilkumar, K.; Rodenburg, J.; Dieng, I.; Vandamme, E.; Sillo, F.S.; Johnson, J.-M.; Rajaona, A.; Ramarolahy, J.A.; Gasore, R.; Abera, B.B.; et al. Quantifying Rice Yield Gaps and Their Causes in Eastern and Southern Africa. J. Agron. Crop Sci. 2020, 206, 478–490. [Google Scholar] [CrossRef]
- Mitsch, W.J.; Gosselink, J.G. Wetlands, 5th ed.; John Wiley and Sons, Inc: Hoboken, NJ, USA, 2015; ISBN 978-1-118-67682-0. [Google Scholar]
- Mathers, N.J.; Nash, D.M.; Gangaiya, P. Nitrogen and Phosphorus Exports from High Rainfall Zone Cropping in Australia: Issues and Opportunities for Research. J. Environ. Qual. 2007, 36, 1551–1562. [Google Scholar] [CrossRef]
- Dick, J.; Skiba, U.; Wilson, J. The Effect of Rainfall on NO and N2O Emissions from Ugandan Agroforest Soils. Phyton 2001, 41, 73–80. [Google Scholar]
- Becker, M.; Asch, F.; Maskey, S.L.; Pande, K.R.; Shah, S.C.; Shrestha, S. Effects of Transition Season Management on Soil N Dynamics and System N Balances in Rice–Wheat Rotations of Nepal. Field Crops Res. 2007, 103, 98–108. [Google Scholar] [CrossRef]
- Jarvis, P.; Rey, A.; Petsikos, C.; Wingate, L.; Rayment, M.; Pereira, J.; Banza, J.; David, J.; Miglietta, F.; Borghetti, M.; et al. Drying and Wetting of Mediterranean Soils Stimulates Decomposition and Carbon Dioxide Emission: The “Birch Effect”. Tree Physiol. 2007, 27, 929–940. [Google Scholar] [CrossRef] [PubMed]
- Birch, H.F. Nitrification in Soils after Different Periods of Dryness. Plant Soil 1960, 12, 16. [Google Scholar] [CrossRef]
- Birch, H.F. The Effect of Soil Drying on Humus Decomposition and Nitrogen Availability. Plant Soil 1958, 10, 9–31. [Google Scholar] [CrossRef]
- Kleinman, P.J.A.; Srinivasan, M.S.; Dell, C.J.; Schmidt, J.P.; Sharpley, A.N.; Bryant, R.B. Role of Rainfall Intensity and Hydrology in Nutrient Transport via Surface Runoff. J. Environ. Qual. 2006, 35, 1248–1259. [Google Scholar] [CrossRef]
- Sharma, S.; Chaubey, I. Surface and Subsurface Transport of Nitrate Loss from the Selected Bioenergy Crop Fields: Systematic Review, Analysis and Future Directions. Agriculture 2017, 7, 27. [Google Scholar] [CrossRef]
- Nash, D.; Halliwell, D.; Cox, J. Hydrological Mobilization of Pollutants at the Field/Slope Scale. In Agriculture, Hydrology and Water Quality; Haygarth, P.M., Jarvis, S.C., Eds.; CABI: Wallingford, UK, 2002; pp. 243–264. ISBN 978-0-85199-545-8. [Google Scholar]
- Rusjan, S.; Brilly, M.; Mikoš, M. Flushing of Nitrate from a Forested Watershed: An Insight into Hydrological Nitrate Mobilization Mechanisms through Seasonal High-Frequency Stream Nitrate Dynamics. J. Hydrol. 2008, 354, 187–202. [Google Scholar] [CrossRef]
- Weiler, M.; McDonnell, J.J. Testing Nutrient Flushing Hypotheses at the Hillslope Scale: A Virtual Experiment Approach. J. Hydrol. 2006, 319, 339–356. [Google Scholar] [CrossRef]
- McHale, M.R.; McDonnell, J.J.; Mitchell, M.J.; Cirmo, C.P. A Field-Based Study of Soil Water and Groundwater Nitrate Release in an Adirondack Forested Watershed. Water Resour. Res. 2002, 38, 2.1–2.16. [Google Scholar] [CrossRef]
- Cirmo, C.P.; McDonnell, J.J. Linking the Hydrologic and Biogeochemical Controls of Nitrogen Transport in Near-Stream Zones of Temperate-Forested Catchments: A Review. J. Hydrol. 1997, 199, 88–120. [Google Scholar] [CrossRef]
- Warren, G.P.; Atwal, S.S.; Irungu, J.W. Soil Nitrate Variations under Grass, Sorghum and Bare Fallow in Semi-Arid Kenya. Ex. Agric. 1997, 33, 321–333. [Google Scholar] [CrossRef]
- Yang, Y.; Wendroth, O.; Walton, R.J. Field-Scale Bromide Leaching as Affected by Land Use and Rain Characteristics. Soil Sci. Soc. Am. J. 2013, 77, 1157–1167. [Google Scholar] [CrossRef]
- Ziegler, A.D.; Giambelluca, T.W.; Tran, L.T.; Vana, T.T.; Nullet, M.A.; Fox, J.; Vien, T.D.; Pinthong, J.; Maxwell, J.F.; Evett, S. Hydrological Consequences of Landscape Fragmentation in Mountainous Northern Vietnam: Evidence of Accelerated Overland Flow Generation. J. Hydrol. 2004, 287, 124–146. [Google Scholar] [CrossRef]
- Ribolzi, O.; Lacombe, G.; Pierret, A.; Robain, H.; Sounyafong, P.; de Rouw, A.; Soulileuth, B.; Mouche, E.; Huon, S.; Silvera, N.; et al. Interacting Land Use and Soil Surface Dynamics Control Groundwater Outflow in a Montane Catchment of the Lower Mekong Basin. Agric. Ecosyst. Environ. 2018, 268, 90–102. [Google Scholar] [CrossRef]
- Edwards, W.M.; Shipitalo, M.J.; Traina, S.J.; Edwards, C.A.; Owens, L.B. Role of Lumbricus Terrestris (L.) Burrows on Quality of Infiltrating Water. Soil Biol. Biochem. 1992, 24, 1555–1561. [Google Scholar] [CrossRef]
- Gabiri, G. Multi-Scale Modeling of Water Resources in a Tropical Inland Valley and a Tropical Floodplain Catchment in East Africa; Rheinische Friedrich Wilhelms Universität Bonn, Institute of Geography: Bonn, Germany, 2018. [Google Scholar]
- Miyamoto, K.; Maruyama, A.; Haneishi, Y.; Matsumoto, S.; Asea, G.; Okello, S.; Takagaki, M.; Kikuchi, M. NERICA Cultivation and Its Yield Determinants: The Case of Upland Rice Farmers in Namulonge, Central Uganda. J. Agric. Sci. 2012, 4, 16. [Google Scholar] [CrossRef]
- Nsubuga, F.N.W.; Namutebi, E.N.; Nsubuga-Ssenfuma, M. Water Resources of Uganda: An Assessment and Review. J. Water Resour. Prot. 2014, 6, 1297–1315. [Google Scholar] [CrossRef]
- Nsubuga, F.W.; Olwoch, J.M.; de Rautenbach, C.J.W. Climatic Trends at Namulonge in Uganda: 1947–2009. J. Geogr. Geol. 2011, 3, 119. [Google Scholar] [CrossRef]
- GTK Consortium. Geological Map of Uganda 1:100,000. Sheet 61, Bombo, 2012. Available online: https://shop.geospatial.com/product/4CKQ8D5G052KM1JQB3MY26V011/61-BOMBO-Uganda-1-to-100000-Scale-Geological-Maps (accessed on 5 November 2022).
- Westerhof, A.B.; Härmä, P.; Isabirye, E.; Katto, E.; Koistinen, T.; Kuosmanen, E.; Lehto, T.; Lehtonen, M.I.; Mäkitie, H.; Manninen, T.; et al. Geology and Geodynamic Development of Uganda with Explanation of the 1:1,000,000-Scale Geological Map; Special Paper; Geological Survey of Finland: Espoo, Finland, 2014; ISBN 978-952-217-294-5. [Google Scholar]
- Taylor, R.G.; Howard, K.W.F. Groundwater Recharge in the Victoria Nile Basin of East Africa: Support for the Soil Moisture Balance Approach Using Stable Isotope Tracers and Flow Modelling. J. Hydrol. 1996, 180, 31–53. [Google Scholar] [CrossRef]
- Uganda Ministry of Water and Environment. Unpublished Data.
- Taylor, R.G.; Howard, K.W.F. Post-Palaeozoic Evolution of Weathered Landsurfaces in Uganda by Tectonically Controlled Deep Weathering and Stripping. Geomorphology 1998, 25, 173–192. [Google Scholar] [CrossRef]
- Denny, P. Eastern Africa. In Wetlands of the World, Volume 1: Inventory, Ecology and Management; Whigham, D.F., Dykyjová, D., Hejný, S., Eds.; Kluwer Academic Publishers: Dordrecht, The Netherlands, 1993; pp. 32–46. [Google Scholar]
- van Breugel, P.; Kindt, R.; Lillesø, J.P.G.; Bingham, M.; Demissew, S.; Dudley, C.; Friis, I.; Gachathi, F.; Kalema, J.; Mbago, F.; et al. Potential Natural Vegetation Map of East Africa (Burundi, Ethiopia, Kenya, Malawi, Rwanda, Tanzania, Uganda and Zambia); 2015. Available online: https://vegetationmap4africa.org/About.html (accessed on 11 December 2022).
- Blume, T.; van Meerveld, H.J. From Hillslope to Stream: Methods to Investigate Subsurface Connectivity. WIREs Water 2015, 2, 177–198. [Google Scholar] [CrossRef]
- Everett, M.E. Near-Surface Applied Geophysics; Cambridge University Press: Cambridge, UK, 2013. [Google Scholar]
- Berktold, A. Geoelektrik. In Handbuch zur Erkundung des Untergrundes von Deponien und Altlasten. Band 3: Geophysik; Knödel, K., Krummel, H., Lange, G., Eds.; Springer: Berlin/Heidelberg, Germany, 2005; Volume 3, pp. 71–387. [Google Scholar]
- Loke, M.H. Rapid 2-D Resistivity & IP Inversion Using the Least-Squares Method. Geotomo software sdn bhd: Gelogur, Malaysia, 2018. [Google Scholar]
- Delta-T Devices Ltd PR2 User Manual Version 5.0. Available online: https://www.delta-t.co.uk/wp-content/uploads/2017/02/PR2_user_manual_version_5.0.pdf (accessed on 5 November 2022).
- Rawls, W.J.; Brakensiek, D.L. Prediction of Soil Water Properties for Hydrologic Modeling. In Proceedings of the American Society of Civil Engineers Watershed Management in the Eighties Symposium; ASCE: New York, NY, USA, 1985; pp. 293–299. [Google Scholar]
- Flint, A.L.; Childs, S. Physical Properties of Rock Fragments and Their Effect on Available Water in Skeletal Soils. In Erosion and Productivity of Soils Containing Rock Fragments; John Wiley & Sons Ltd.: Hoboken, NJ, USA, 1984; pp. 91–103. ISBN 978-0-89118-908-4. [Google Scholar]
- Eijkelkamp Rhizon Soil Moisture Samplers Manual. Available online: https://www.royaleijkelkamp.com/media/bbopr10b/m-1921e-rhizons.pdf (accessed on 5 November 2022).
- Eijkelkamp Nitracheck Reflectometer Manual. Available online: https://www.royaleijkelkamp.com/media/zyfoulx4/manual-18-40-nitrachek-reflectometer.pdf (accessed on 5 November 2022).
- Skogley, E.O. The Universal Bioavailability Environment/Soil Test Unibest. Commun. Soil Sci. Plant Anal. 1992, 23, 2225–2246. [Google Scholar] [CrossRef]
- Dobermann, A.; Pampolino, M.F.; Adviento, M.A. Resin Capsules for Onsite Assessment of Soil Nutrient Supply in Lowland Rice Fields. Soil Sci. Soc. Am. J. 1997, 61, 1202–1213. [Google Scholar] [CrossRef]
- Skogley, E.O.; Dobermann, A. Synthetic Ion-Exchange Resins: Soil and Environmental Studies. J. Environ. Qual. 1996, 25, 13–24. [Google Scholar] [CrossRef]
- Li, Z.M.; Skogley, E.O.; Ferguson, A.H. Resin Adsorption for Describing Bromide Transport in Soil under Continuous or Intermittent Unsaturated Water Flow. J. Environ. Qual. 1993, 22, 715–722. [Google Scholar] [CrossRef]
- Pampolino, M.F.; Urushiyama, T.; Hatano, R. Detection of Nitrate Leaching through Bypass Flow Using Pan Lysimeter, Suction Cup, and Resin Capsule. Soil Sci. Plant Nutr. 2000, 46, 703–711. [Google Scholar] [CrossRef]
- Schepp, C. Linking Slopes to the Wetland: Hillslope Hydrology and Associated Nitrate Transport in a Tropical Valley Bottom Wetland; Rheinische Friedrich Wilhelms Universität Bonn, Institute of Geography: Bonn, Germany, 2022. [Google Scholar]
- Meerveld, H.J.T.; McDonnell, J.J. Threshold Relations in Subsurface Stormflow: 2. The Fill and Spill Hypothesis. Water Resour. Res. 2006, 42, 1–11. [Google Scholar] [CrossRef]
- Heilig, A.; Steenhuis, T.S.; Walter, M.T.; Herbert, S.J. Funneled Flow Mechanisms in Layered Soil: Field Investigations. J. Hydrol. 2003, 279, 210–223. [Google Scholar] [CrossRef][Green Version]
- Walter, M.T.; Kim, J.-S.; Steenhuis, T.S.; Parlange, J.-Y.; Heilig, A.; Braddock, R.D.; Selker, J.S.; Boll, J. Funneled Flow Mechanisms in a Sloping Layered Soil: Laboratory Investigation. Water Resour. Res. 2000, 36, 841–849. [Google Scholar] [CrossRef]
- Palacky, G.J. Resistivity Characteristics of Geological Targets. In Electromagnetic Methods in Applied Geophysics; Nabighian, M.N., Ed.; Society of exploration geophysics: Tulsa, OK, USA, 1987; pp. 131–311. [Google Scholar]
- Beauvais, A.; Ritz, M.; Parisot, J.-C.; Dukhan, M.; Bantsimba, C. Analysis of Poorly Stratified Lateritic Terrains Overlying a Granitic Bedrock in West Africa, Using 2-D Electrical Resistivity Tomography. Earth Planet. Sci. Lett. 1999, 173, 413–424. [Google Scholar] [CrossRef]
- Barongo, J.O.; Palacky, G.J. Investigations of Electrical Properties of Weathered Layers in the Yala Area, Western Kenya, Using Resistivity Soundings. Geophysics 1991, 56, 133–138. [Google Scholar] [CrossRef]
- Kižlo, M.; Kanbergs, A. The Causes of the Parameters Changes of Soil Resistivity. Power Electr. Eng. 2009, 25, 43–46. [Google Scholar] [CrossRef]
- McNeill, J.D. Electrical Conductivity of Soils and Rocks. Technical Note T-5; Geonics Ltd.: Mississauga, ON, Canada, 1980. [Google Scholar]
- Anudu, G.K.; Essien, B.I.; Obrike, S.E. Hydrogeophysical Investigation and Estimation of Groundwater Potentials of the Lower Palaeozoic to Precambrian Crystalline Basement Rocks in Keffi Area, North-Central Nigeria, Using Resistivity Methods. Arab J. Geosci. 2014, 7, 311–322. [Google Scholar] [CrossRef]
- McDonnell, J.J.; Owens, I.F.; Stewart, M.K. A Case Study of Shallow Flow Paths in a Steep Zero-Order Basin. JAWRA J. Am. Water Resour. Assoc. 1991, 27, 679–685. [Google Scholar] [CrossRef]
- Grotelüschen, K. Evaluating Rice Performance in Contrasting East African Wetlands Using an Experimental and Modelling Approach; Rheinische Friedrich Wilhelms Universität Bonn: Bonn, Germany, 2021. [Google Scholar]
- Bognonkpe, J.P.I.; Becker, M. Native Soil N Dynamics and Use Efficiency by Lowland Rice as a Function of Slope Management. In Proceedings of the International Agricultural Research: A contribution to crisis prevention. Proceedings of the Deutscher Tropentag 2000; Müllerbader Press: Hohenheim, Germany, 2000; pp. 197–199. [Google Scholar]
- Jarvis, N.J. A Review of Non-Equilibrium Water Flow and Solute Transport in Soil Macropores: Principles, Controlling Factors and Consequences for Water Quality. Eur. J. Soil Sci. 2007, 58, 523–546. [Google Scholar] [CrossRef]
- Dividson, E.A.; Stark, J.M.; Firestone, M.K. Microbial Production and Consumpution of Nitrate in an Annual Grassland. Ecology 1990, 71, 1968–1975. [Google Scholar] [CrossRef]
- Robertson, G.P.; Groffman, P.M. Nitrogen Transformations. In Soil Microbiology, Ecology and Biochemistry; Elsevier: Amsterdam, The Netherlands, 2015; pp. 421–446. ISBN 978-0-12-415955-6. [Google Scholar]
- Szott, L.T.; Palm, C.A.; Buresh, R.J. Ecosystem Fertility and Fallow Function in the Humid and Subhumid Tropics. Agrofor. Syst. 1999, 47, 163–196. [Google Scholar] [CrossRef]
- Zech, W.; Senesi, N.; Guggenberger, G.; Kaiser, K.; Lehmann, J.; Miano, T.N.; Miltner, A.; Schroth, G. Factors Controlling Humification and Mineralization of Soil Organic Matter in the Tropics. Geoderma 1997, 79, 117–161. [Google Scholar] [CrossRef]
- Van Soest, M. The Political Ecology of Malaria-Emerging Dynamics of Wetland Agriculture at the Urban Fringe in Central Uganda; Universtiät zu Köln: Cologne, Germany, 2018. [Google Scholar]
- Angermann, L.; Jackisch, C.; Allroggen, N.; Sprenger, M.; Zehe, E.; Tronicke, J.; Weiler, M.; Blume, T. Form and Function in Hillslope Hydrology: Characterization of Subsurface Flow Based on Response Observations. Hydrol. Earth Syst. Sci. 2017, 21, 3727–3748. [Google Scholar] [CrossRef]
- Beven, K.; Germann, P. Macropores and Water Flow in Soils Revisited. Water Resour. Res. 2013, 49, 3071–3092. [Google Scholar] [CrossRef]
Publisher’s Note: MDPI stays neutral with regard to jurisdictional claims in published maps and institutional affiliations. |
© 2022 by the authors. Licensee MDPI, Basel, Switzerland. This article is an open access article distributed under the terms and conditions of the Creative Commons Attribution (CC BY) license (https://creativecommons.org/licenses/by/4.0/).