1. Introduction
Twin-screw hot melt extrusion (HME) is a continuous process that has been widely used to enhance the solubility of active pharmaceutical ingredients (APIs) [
1,
2]. This process applies heat and shear energy to produce an amorphous solid dispersion (ASD) of an API into a polymer carrier [
3,
4]. As a continuous process, HME has the potential to be used in combination with in-line analytical techniques to enable real time monitoring of product quality. The reader is directed to the following reviews of the principles of pharmaceutical extrusion process, as this is not in the scope of the present article [
5,
6,
7].
In-line process analytical technology (PAT) systems are being increasingly used in the pharmaceutical industry since the release of the FDA’s PAT guidance in 2004 for ‘designing, analysing and controlling manufacturing through timely measurements of critical quality and performance attributes of raw and in-process materials and processes with the goal of ensuring final product quality’ [
8]. NIR and Raman spectroscopy have been extensively used as PAT tools for the characterisation of in-process materials in HME, including determination of polymer composition in polymer mixtures [
9] and quantification of API in a polymer carrier [
10,
11,
12,
13]
More recently, UV-Vis spectroscopy that involves light measurements between wavelengths of 200 and 780 nm in transmission or reflection modes has been used as a PAT tool. Transmittance values can be used to calculate a numerical representation of colour by using the International Commission on Illumination (CIE) colour space called CIELAB [
14]. The CIELAB colour space represents colour on a three-dimensional orthogonal axis formed by the lightness (L*) and two-colour axis. The colours green to red are described by the axis a*, while blue to yellow are represented by axis b* [
14]. Applications of in-line UV-Vis spectroscopy during HME have been reported in the literature for early phase product development [
15], feasibility of API quantification [
16], residence time distribution determination [
17] and monitoring of thermal degradation processes [
18]. This technique tends to be both fast to set up and to provide data that is simple to interpret. The short integration time in the millisecond-range delivers rapid results with high sensitivity.
Traditional approaches to analytical procedure validation are centred around a one-off validation exercise in a controlled set of conditions. The quality by design (QbD) methodology has provided a more systematic and risk-based approach for product and process development [
19,
20]. Currently, this concept has evolved to analytical quality by design (AQbD) that is now being explored by regulators, academia and industry to increase the robustness and promote continuous improvement of analytical procedures [
21,
22,
23]. A recent ICH Q2(R2)/Q14 concept paper proposes the application of AQbD principles to analytical procedure development [
24]. This approach emphasizes the importance of predefined method performance requirements prior to commencing analytical development. These requirements are identified in the initial steps of method development and are summarised by the analytical target profile (ATP). Examples of ATPs can be found in a recent publication by Jackson et al. where they proposed a harmonised approach to the use of the ATP concept [
25]. The ATP is analogous to the quality target product profile (QTPP) and summarises the performance requirements associated with a measurement (e.g., accuracy and precision) on a quality attribute which needs to be met by an analytical procedure.
Continuous manufacturing platforms, such as HME, are ideal for the implementation of in-line analytical technologies using AQbD. In-line PAT can be embedded in quality systems to provide monitoring of quality and to enable the development of control strategies for real time release testing (RTRT). This should be based on an in-depth understanding of the relationship between process parameters, in-process material attributes and product attributes, as described in the European Medicines Agency guideline for RTRT [
26].
The ICH Q2(R1) defines the methodology for validation of analytical procedures, mostly based on HPLC [
27,
28], but it does not provide specific guidance on PAT methods. The revision to ICH Q2 is intended to include validation of spectroscopy techniques reliant on multivariate models [
24]. Alternative validation approaches for spectroscopic techniques have been used and referred to as the ‘accuracy profile’. This validation approach was developed by the Societé Française des Sciences et Techniques Pharmaceutiques (SFSTP) based on trueness and precision. The accuracy profile has been successfully applied to analytical procedure validation of on-line and at-line NIR and in-line Raman in HME processes [
29,
30,
31,
32,
33].
Previous work published by our group reported the benefits of using in-line UV-Vis spectroscopy as a rapid analytical technology with applications in the early phase product development of HME processes [
15]. Following this work, optimisation of the manufacturing process of piroxicam (PRX) in Kollidon
® VA 64 (KOL) was carried out for the intended QTPP of immediate release tablets containing 20 mg of API. The design space for the identified critical process parameters (CPPs) and materials attributes was stablished as: concentration of API in the polymer carrier: 10 ≤ API ≤ 20%
w/
w; barrel and die-temperature range 130–140 °C; API/polymer mixture feed rate 5–10 g/min; and screw speed 200–300 rpm. Based on this information, the process conditions selected to develop the analytical procedure were barrel temperature profile 120–140 °C, die-temperature 140 °C, API/polymer mixture feed rate 7 g/min and screw speed 200 rpm.
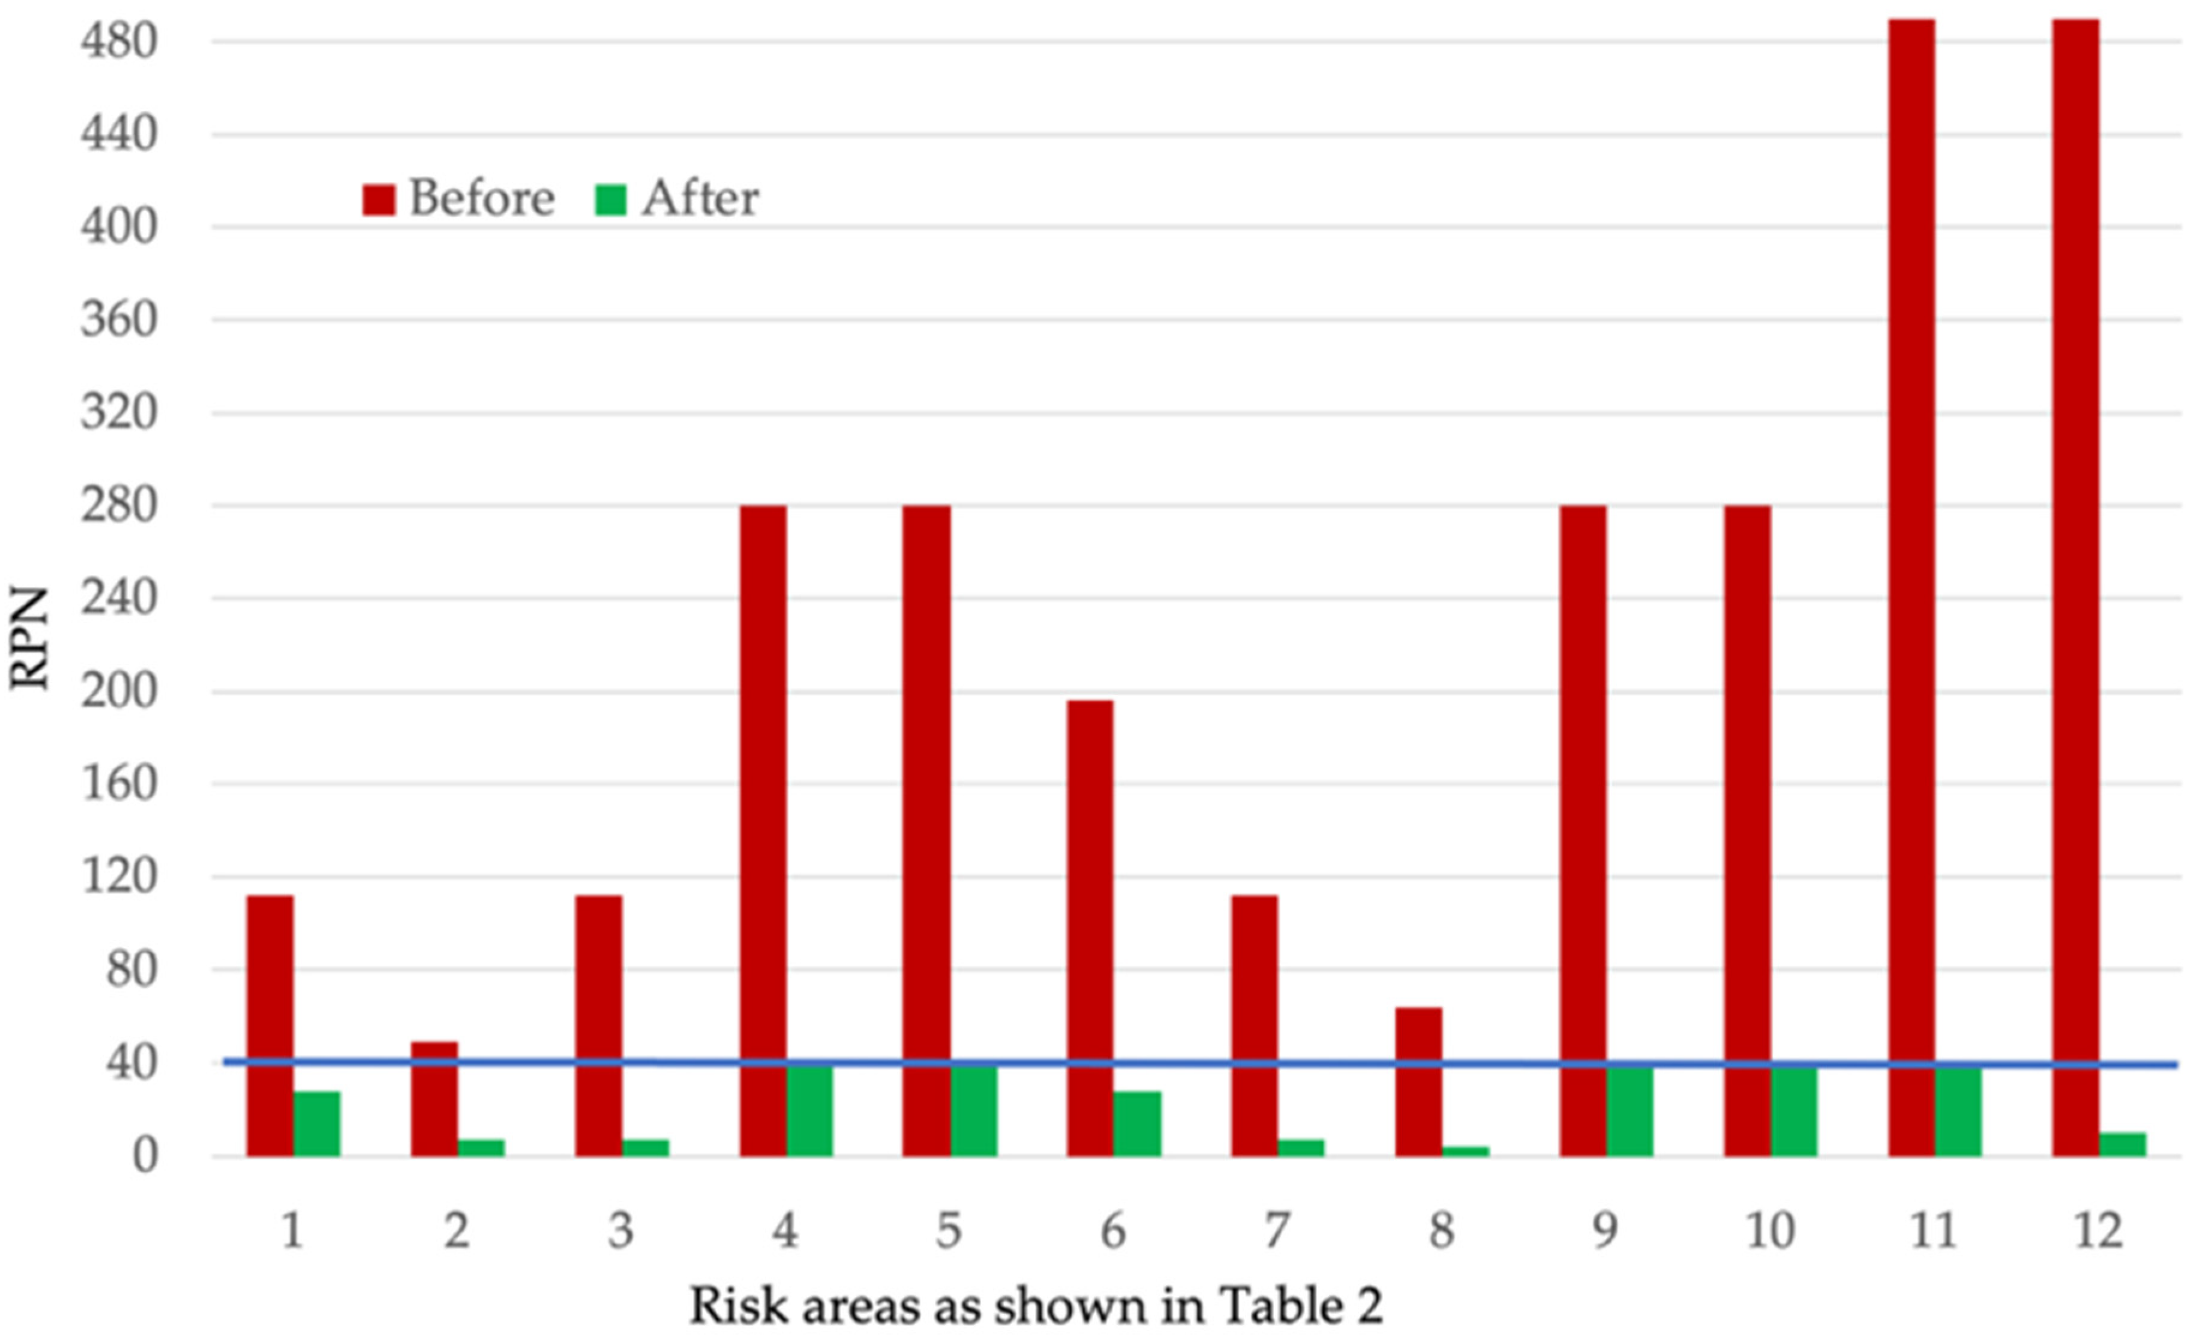
In this paper, AQbD principles and an accuracy profile approach are applied to develop and validate a method to quantify piroxicam content in a Kollidon® VA64 carrier using in-line UV-Vis spectroscopy during HME. This includes a failure mode effect analysis of the analytical procedure and the development of an ATP to determine the content of piroxicam in Kollidon® VA 64.
2. Materials and Methods
2.1. Materials
Piroxicam (Medex, Rugby, UK) was the active ingredient and Kollidon
® VA64 (donated by BASF, Ludwigshafen, Germany) the polymer carrier. Stock mixtures of 32%
w/
w PRX in KOL were prepared. These were later diluted by adding further KOL to reach the desired concentrations. The powder mixtures were thoroughly blended using a V-cone mixer (Pharmatech, Coleshill, UK) for 10 min and using 75% of the volume fill. Off-line UV-Vis calibration curve was performed to check content uniformity and 10 min was considered the optimal time for blending. The rationale for using piroxicam and Kollidon
® VA64 is described in [
15].
2.2. Extrusion Setup
The extruder used in the HME process was a Leistritz Nano 16 (Somerville, NJ, USA), which is a co-rotating twin screw extruder (screw diameter 16 mm) with three heating zones and a die zone. The feeder used was an FW20 FlexWall feeder (Brabender Technologie, Duisburg, Germany). A schematic diagram of the hot melt extrusion process is presented in
Figure 1. Optimised process conditions (extruder temperature 120 (zone 1), 130 (zone 2) and 140 °C (zone 3 and die), screw speed 200 rpm and feed rate 7 g/min) were used to develop and validate the analytical procedure for API around 15%
w/
w. The method robustness was tested by evaluating the effects of screw speed (150–250 rpm) and feed rate (5–9 g/min) on piroxicam content around 15%
w/
w.
2.3. In-line UV-Vis Spectroscopy
The UV-Vis spectrophotometer (Inspectro X ColVisTec, Berlin, Germany) was setup using the optical fibre cables with two probes (TPMP, ColVisTec, Berlin, Germany) installed into the extruder die in a transmission configuration, as presented in
Figure 1. A reference UV-Vis transmittance signal was obtained with empty die at the selected process temperature, 140 °C. Transmittance data was collected from 230 to 816 nm with a resolution of 1 nm. Data collection frequency was 0.5 Hz and each spectrum was taken as the average of 10 scans. The spot size of the used UV-Vis spectrophotometer probes was 2 mm diameter and measured sample volume of typically 2.5 mm
3.
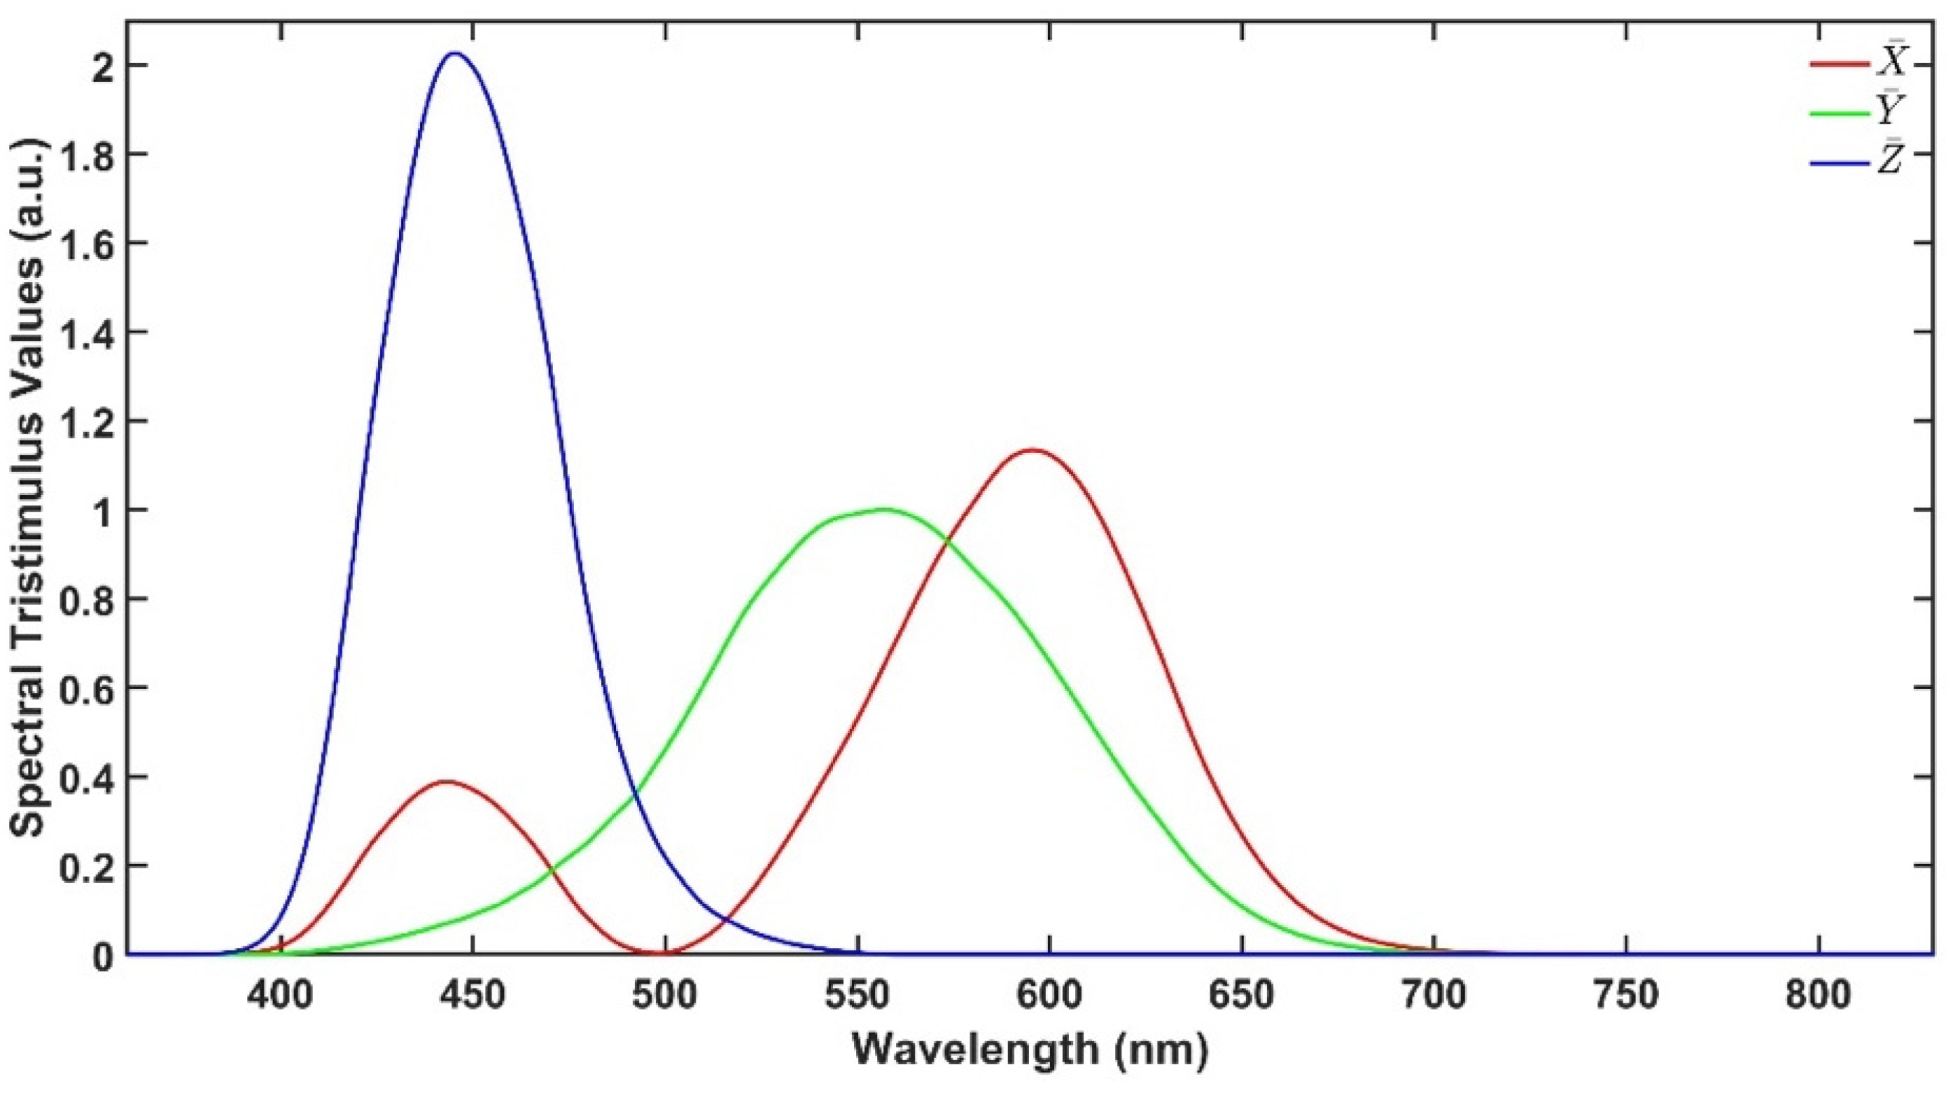
As described earlier, CIELAB colour space is an approach to express colour using three parameters: ‘lightness’ (L*), ‘green to red’ (a*) and ‘blue to yellow’ (b*) defined by the International Commission on Illumination (CIE). These parameters are calculated from the UV-Vis transmittance spectra in the range from 380 to 780 nm.
Figure 2 illustrates the spectral tristimulus values
,
and
that are used to calculate X, Y and Z using Equations (1)–(4), where T is the transmittance spectrum, S is the relative spectral power and λ is the wavelength. Then, L*, a* and b* are calculated using Equations (5)–(7), where X
n, Y
n and Z
n are the spectral tristimulus values of the nominally white object. The values of
,
,
, S and further explanation are available in [
14].
2.4. HPLC Reference Analytical Procedure
HPLC was performed as an off-line method to assay PRX content in the extruded samples. Assay values obtained from this reference method were used as true content values in the development and validation steps of the UV-Vis quantification method. The equipment used was an Agilent 1100 system with a Phenomenex C-18 column (Kinetix 4.6 × 250 mm, 5 μm); and methanol:sodium dihydrogen phosphate buffer 45:55 mobile phase (LiChropur, Millipore, Waltford, UK); pH 3.0; flow rate 1.2 mL/min. A calibration curve was constructed using PRX standard solutions with concentrations ranging from 10 to 80 μg/mL and the measured respective peak areas (mAU*s) at 360 nm. The milled extrudate (312 mg) was dissolved in 100 mL of 0.01M methanolic hydrochloric acid (Fisher, Loughborough, UK), which was diluted by a factor of 10 to obtain a sample solution. Sample solutions were homogenised by mechanical agitation (Stuart, Stone, UK) for 5 min. All samples were prepared in triplicate.
2.5. UV-Vis Spectra Data Analysis Tools
Analysis of the in-line UV-Vis spectral data was performed using Matlab (Matlab R2018a, Natick, MA, USA) functions for multivariate analysis with mean-centred data, for method validation criteria calculation and data plotting.
2.6. Experimental Design
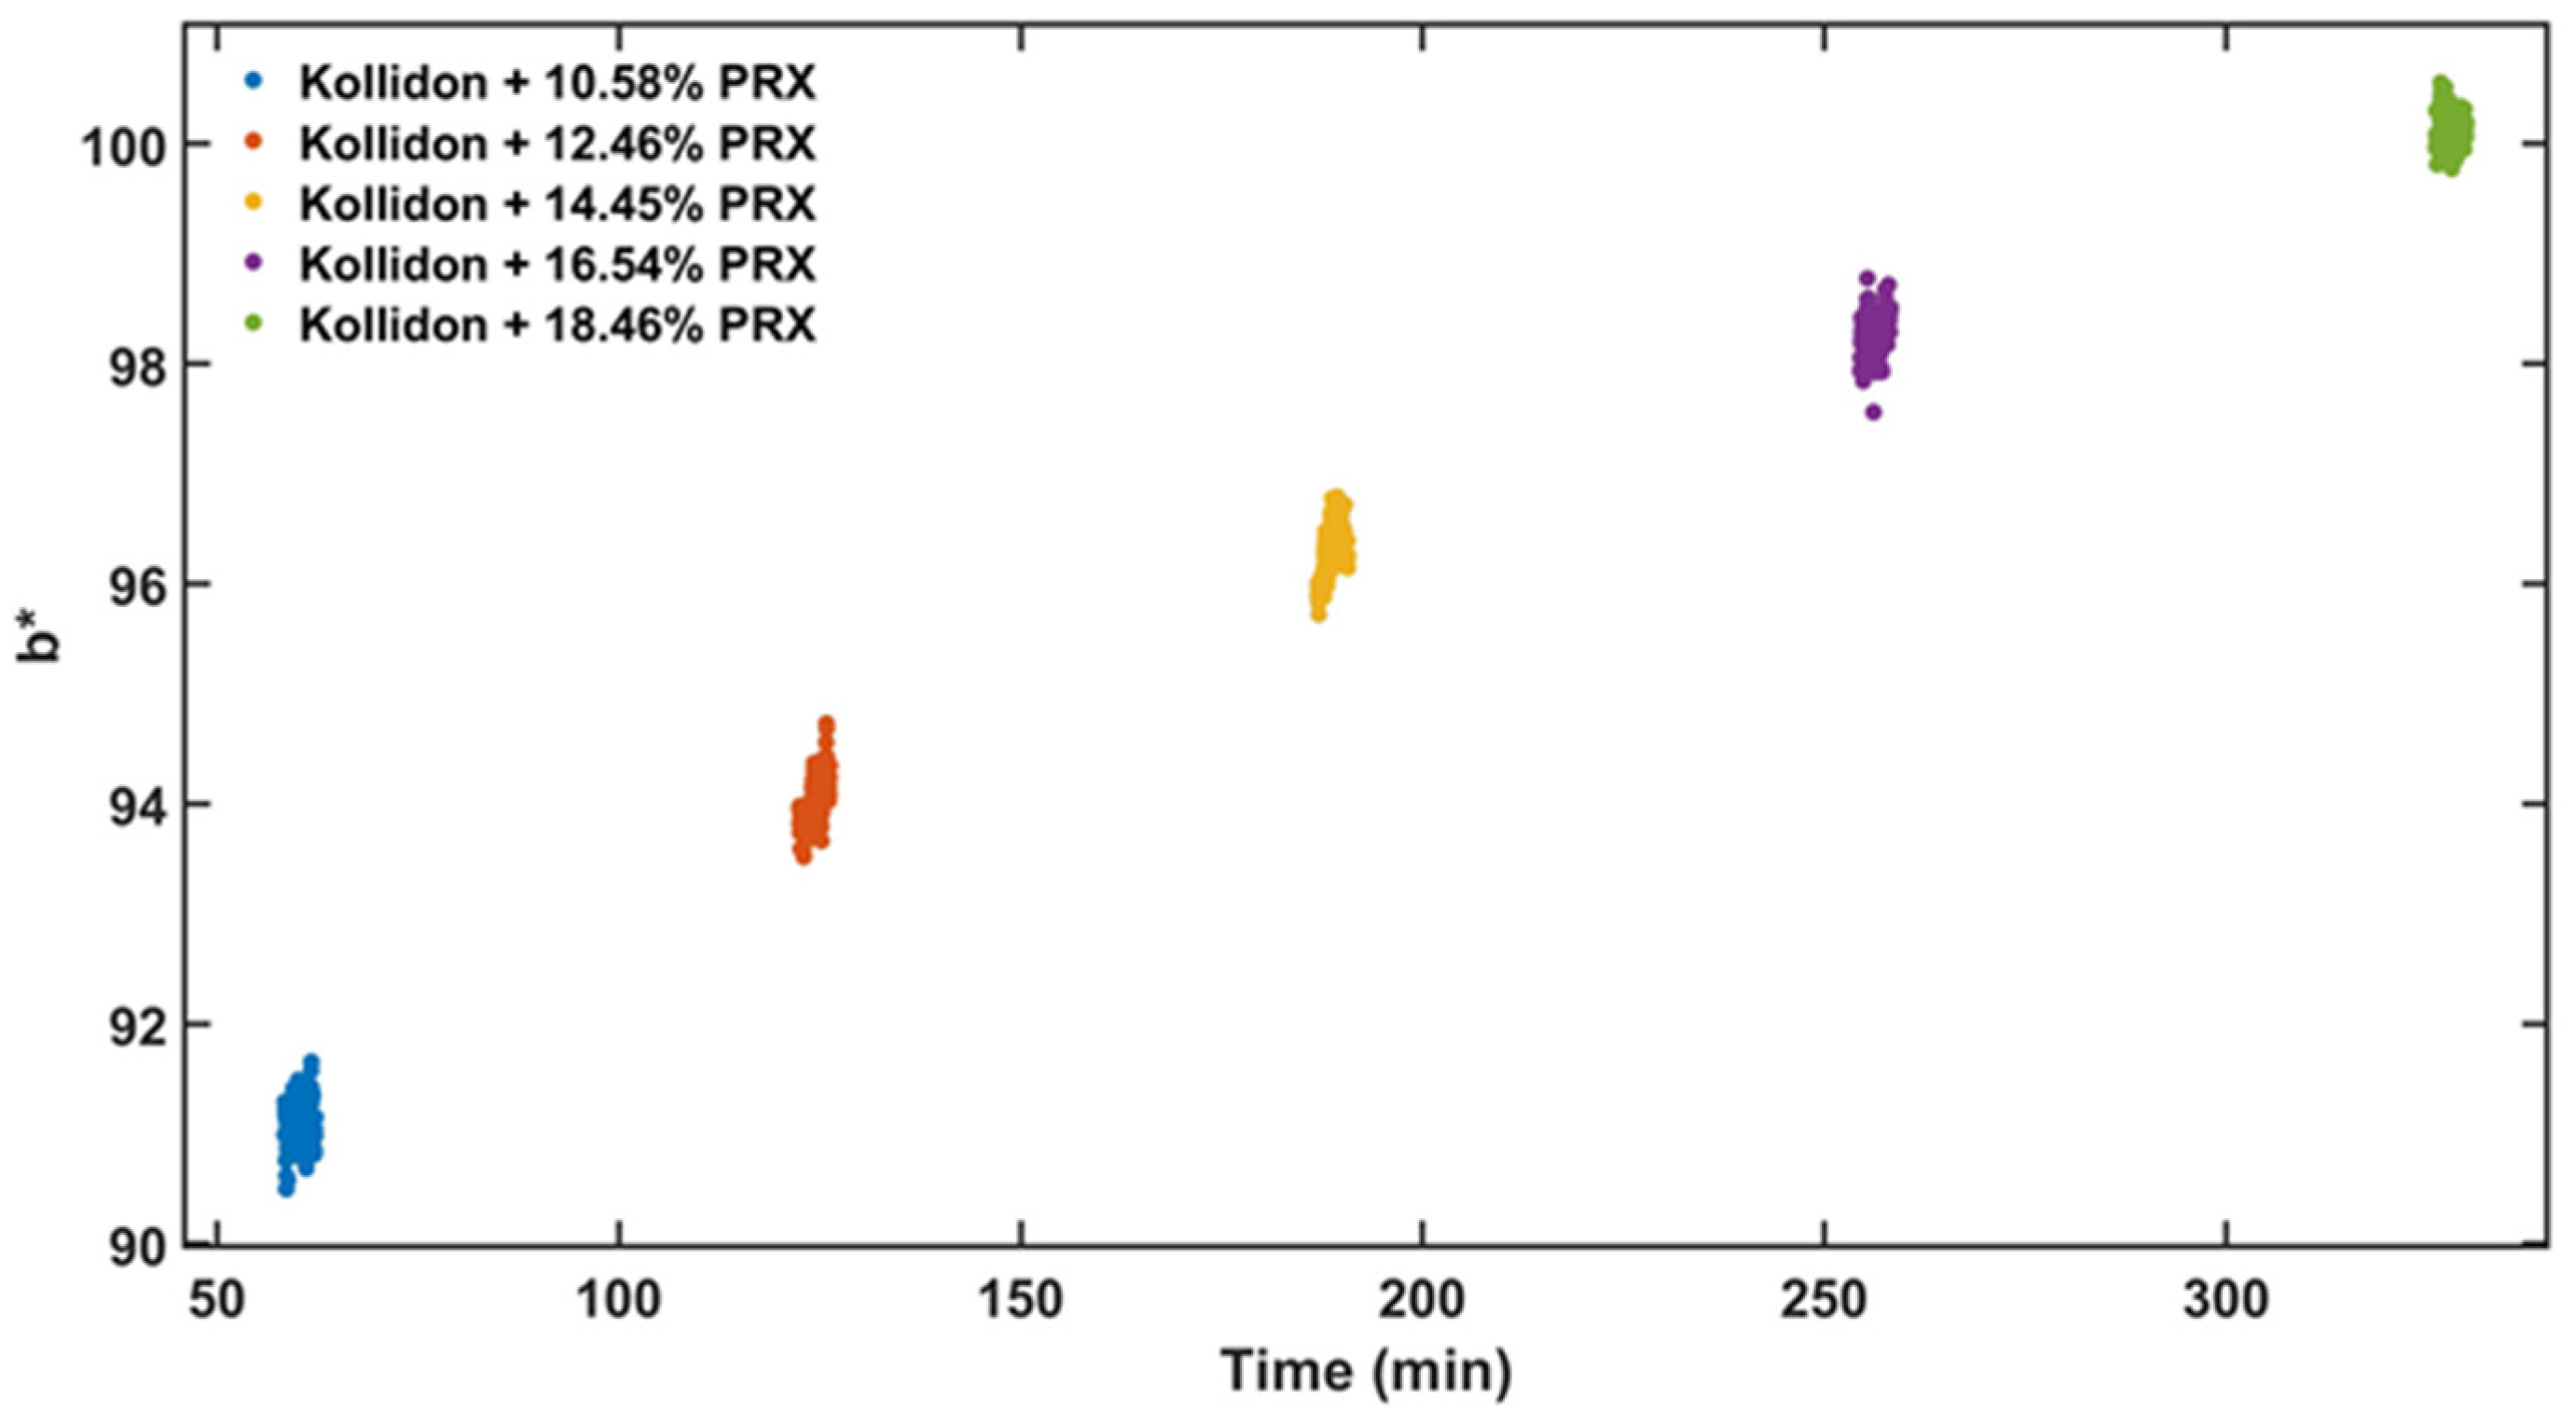
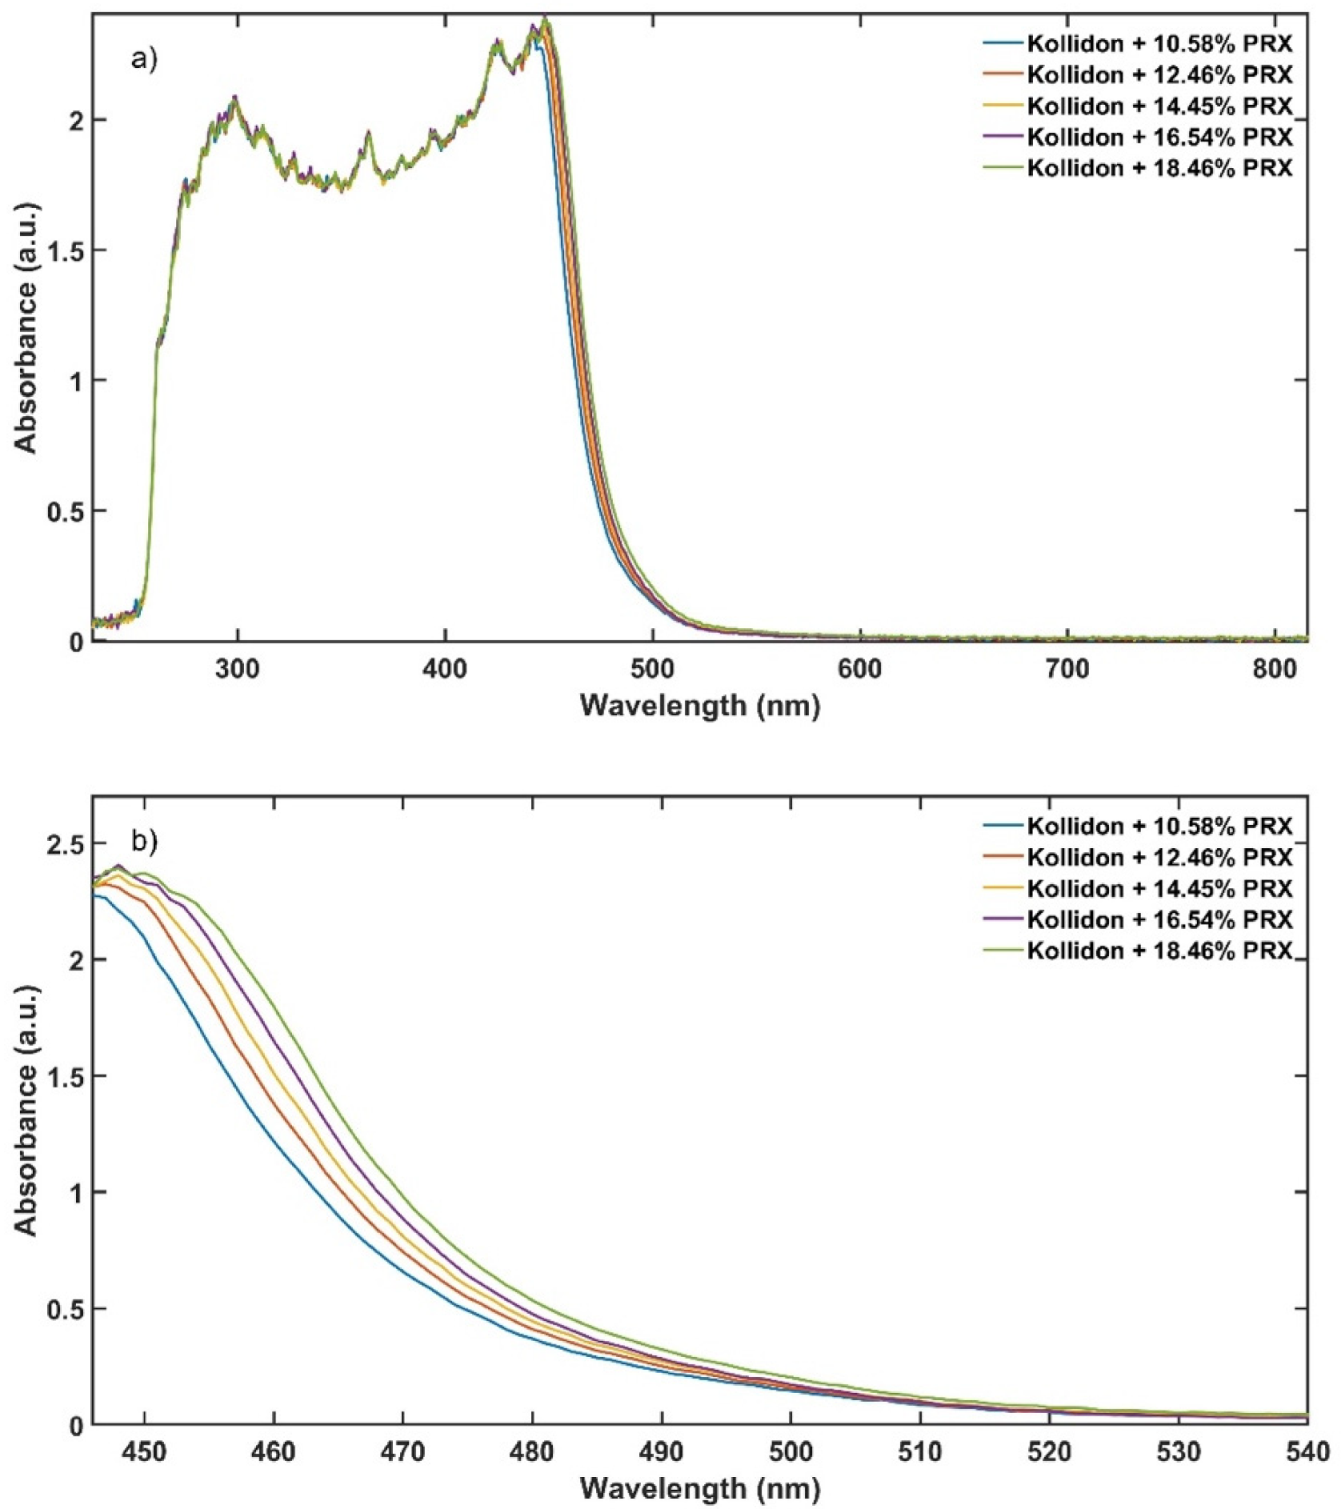
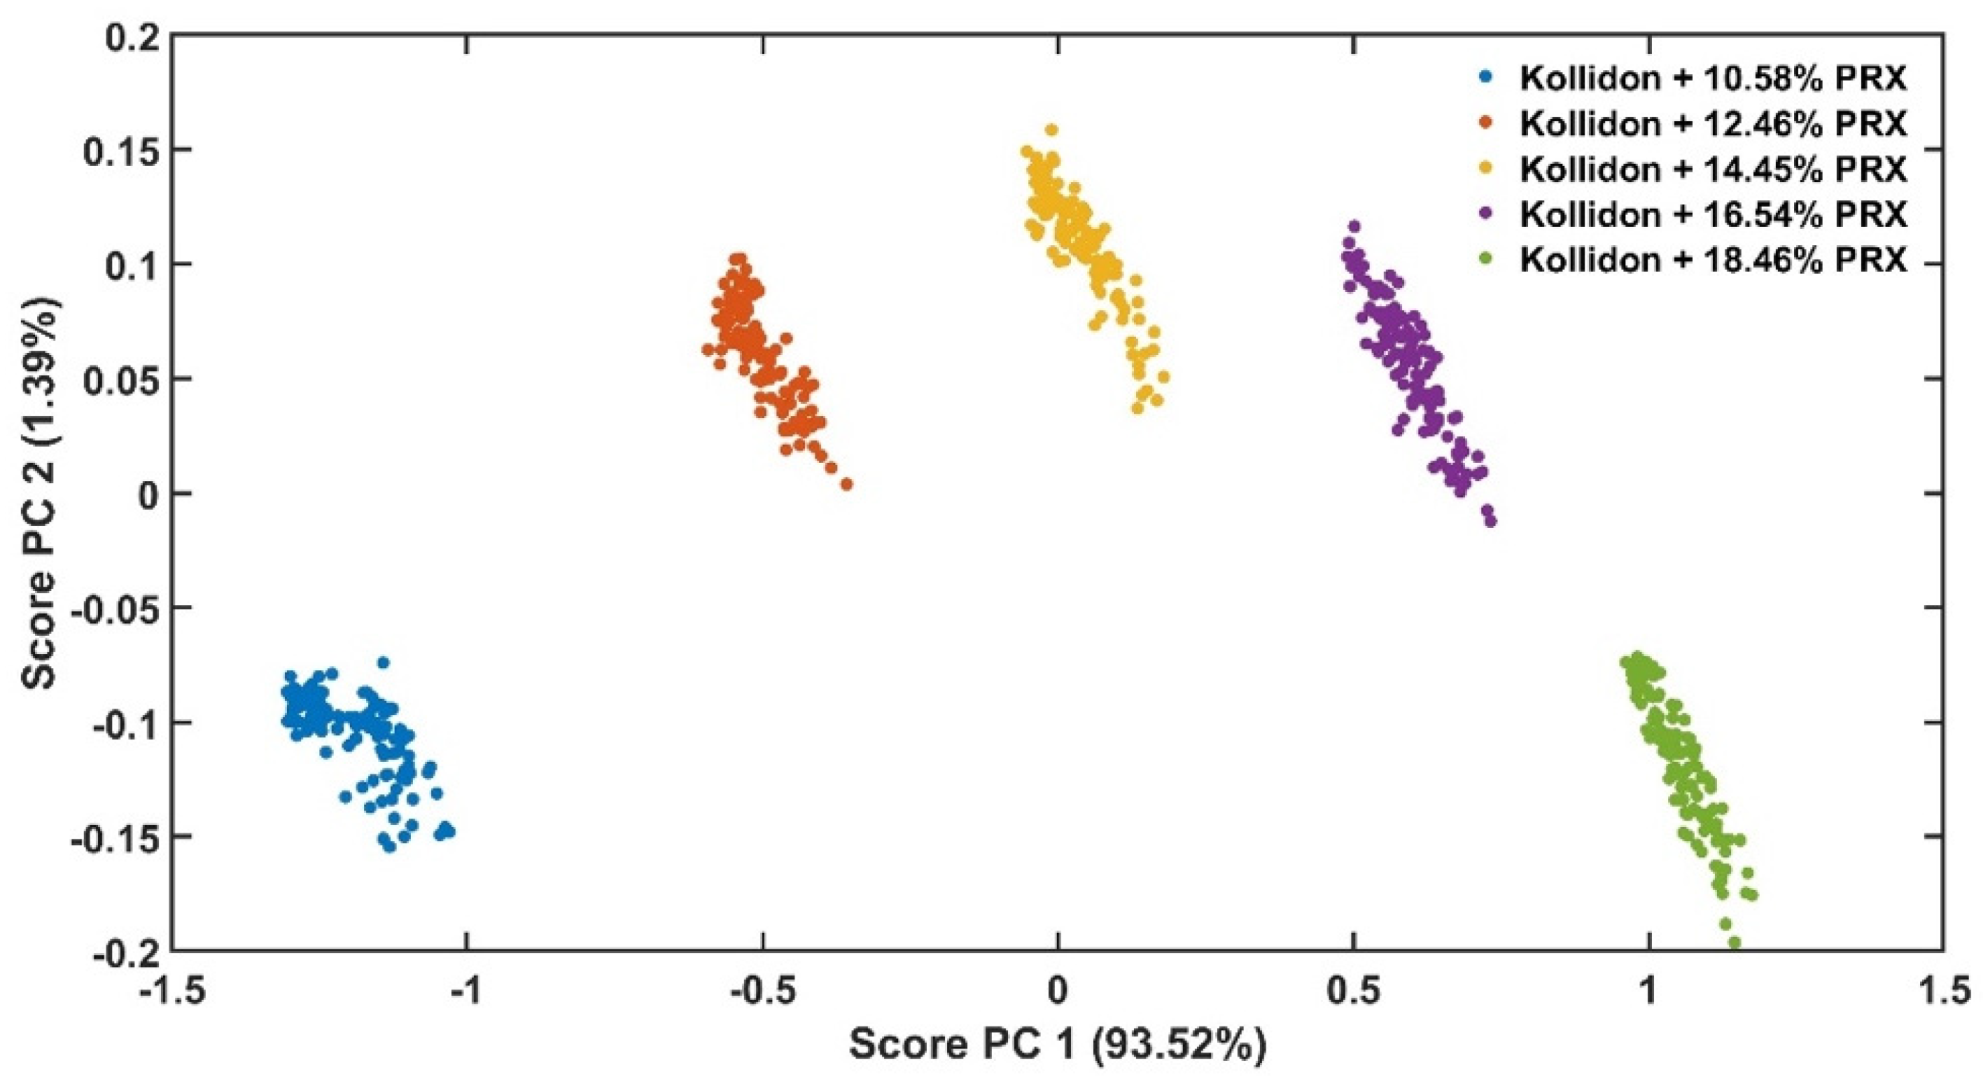
The experimental design for the method development combined one calibration and two validation data sets that were collected on different days. The calibration experiment comprised of five defined PRX concentrations of 10.58, 12.46, 14.45, 16.54 and 18.46% w/w. The validation data sets comprised of four PRX concentrations within the calibration data set range with concentrations of 11.66, 13.45, 15.45 and 17.50% w/w produced on different days. All PRX-containing samples were analysed by off-line HPLC assay and reported as true values for the used concentration ranges. It is important to note that the API concentration range is not restricted to high values. Feasibility studies performed by our research group show that this PAT tool can also detect low analyte concentrations, but this is out of the scope of this paper.
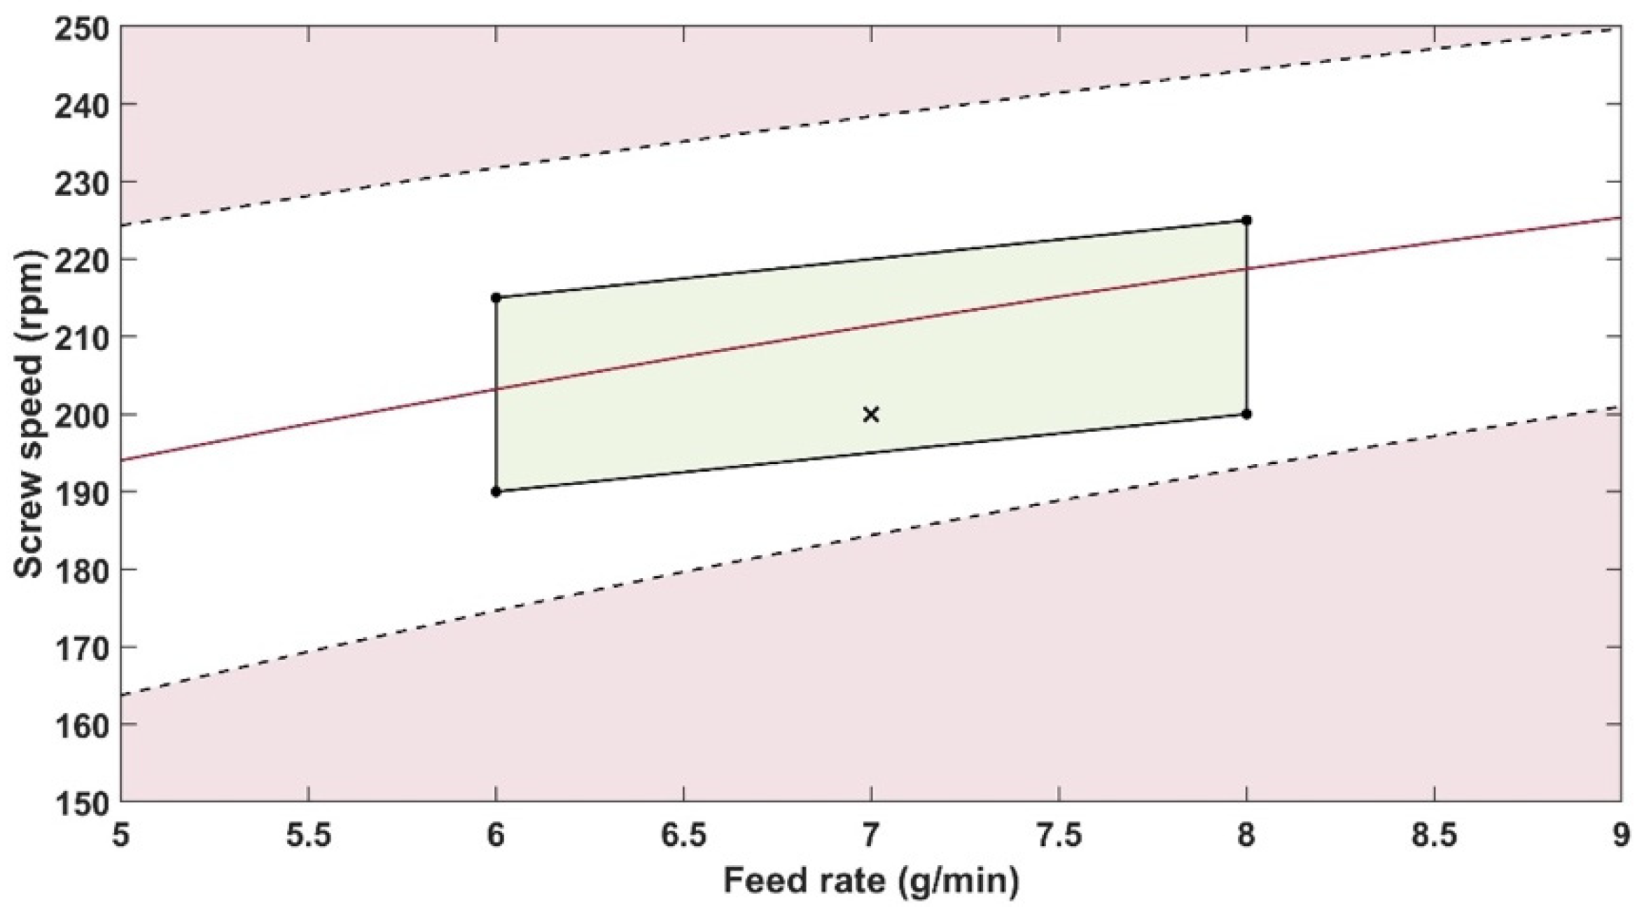
The robustness of the proposed method was evaluated by performing experiments using samples with 14.5% w/w of PRX and varying feed rate (5–9 g/min) and extrusion screw speed (150–250 rpm) within the design space range obtained from the process optimisation, as described at the end of the introduction section. The critical analytical attribute; parameter b*, was used to determine steady state during HME process and absorbance values were used to build the calibration model described in the next section.
4. Conclusions
An in-line UV-Vis method for API quantification during hot-melt extrusion processes was developed and validated according to the AQbD framework. AQbD concepts have not typically been applied to the PAT methods and the use of the analytical target profile to define and validate the performance requirements of an in-line method is novel. Failure mode and effects analysis was used to mitigated the risks during analytical procedure development and validation. Additionally, the AQbD approach is aligned with latest industry and regulatory thinking.
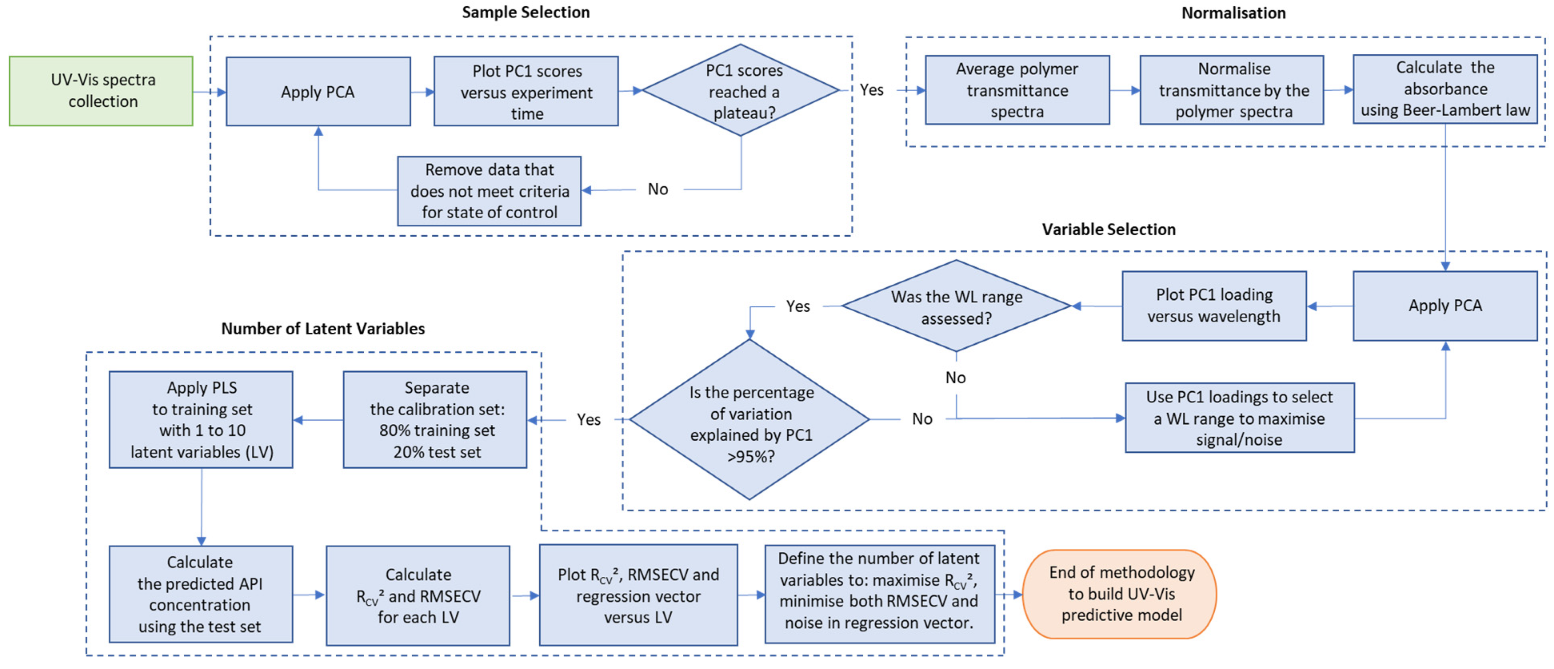
The predictive model was developed using a multivariate approach and an innovative methodology that assisted the analytical procedure agreement with ICH Q2(R1) criteria and accuracy profile validation strategy.
The results show that UV-Vis spectroscopy for HME is less complex than techniques such as NIR and can reliably detect variations in piroxicam content in a pharmaceutical HME product. The same methodology for the development and validation can be applied to different API/polymer systems to develop quantitative models based on UV-Vis for in-line HME monitoring.
Polymer batch variation should not influence the results as long as the same batch is used for the reference and API/polymer mixtures. Risk mitigation strategies can prevent failure modes such as probe gap size, probe temperature and polymer batch variations that can impact the method precision. The feed rate and screw speed process variables impact the method, but they have been constrained across an optimised range.
This in-line PAT can be used for real time monitoring of API content during HME continuous manufacturing process. The accuracy profile obtained with two validation sets (from different days) showed that 95% of the future measurements will fall within ±5% acceptance limits.
The stepwise approach from defining the performance requirements, optimising the method and validating the predictive model offers analytical scientists a useful case study on how to tackle the validation of similar methods deploying the use of PLS.


 and
and 


