Abstract
Native fruiting plants are widely cultivated in the Amazon, but little information on their water use characteristics can be found in the literature. To explore the potential impacts of plantations on local to regional water balance, we studied plant water use characteristics of two native fruit plants commonly occurring in the Amazon region. The study was conducted in a mixed fruit plantation containing a dicot tree species (Cupuaçu, Theobroma grandiflorum) and a monocot palm species (Açai, Euterpe oleracea) close to the city of Manaus, in the Central Amazon. Scaling from sap flux measurements, palms had a 3.5-fold higher water consumption compared to trees with a similar diameter. Despite the high transpiration rates of the palms, our plantation had only one third of the potential water recycling capacity of natural forests in the area. Converting natural forest into such plantations will thus result in significantly higher runoff rates.
1. Introduction
Native fruiting plants are widely cultivated in the Amazon, but little information on their water use characteristics can be found in the literature. In the Central Amazon, the native Açai palm (Euterpe oleracea), for example, plays a significant role in the local diet, as the fruit pulp is processed into wine, candies, ice creams and jams and the inner core of the stems can be consumed as palm hearts [2,3]. These products have a rich nutritional and energetic value due to high protein, fiber, calcium, iron and vitamin content [4]. Furthermore, there is recently a growing demand for the “superfruit” Açai in North America and Europe, as it is suspected to contain cholesterol-reducing fats and anti-aging antioxidants [5]. Another widely-cultivated native woody plant from the well-drained, species-rich “terra firme” forests of the Amazon is the dicot tree Theobroma grandiflorum [6]; its fruits are also processed into juice, ice creams, jellies, wine, liqueur and candies [7].
Increased local consumption and the increasing global demand for these fruits mean growing areas devoted to plantations containing these two species in the Brazilian Amazon [8]. Although small-scale land use changes associated with plantations are assumed to have smaller effects on the hydrological cycle than large-scale deforestation [9], to our knowledge, the alterations to the local water regimes after the establishment of this specific sort of small-scale plantation has not yet been studied in the region. However, there is some evidence that trees planted in such plantations are exposed to an environment with higher evaporative demand compared to natural forests, and plantations are characterized by low hydraulic conductivity of the root systems, while showing high transpiration and evapotranspiration rates due to the exposure to high solar energy [10]. Nevertheless, there is an urgent need to increase our knowledge about the water use characteristics of monocot and dicot tropical tree species cultivated in plantations.
Despite the already existing studies on the water use characteristics of trees growing under plantation conditions [11,12,13], we focused on an almost ignored plant type, as only a few ecophysiological studies exist on neotropical palms [1,14], and additionally increased the species pool of dicot trees studied. Most of the existing literature is focused on “cosmopolitan” palms, such as coconut, date and oil palms [15], whereas publications on the water use characteristics of palm species currently restricted to a small geographic area are almost completely missing. To our knowledge, the only existing study on the water relations of palms in the Amazon attributes only a minor contribution of palm trees to overall stand transpiration in a mixed forest canopy; however, it outlines the relatively high individual water consumption of these plants [1,16].
How palms transport water and how this affects their water use characteristics is especially interesting, as palms do not have any secondary growth, but rather an always growing, very active xylem [17]. The same vascular vessels have to support the very “vulnerable process of water transport throughout the potentially long life of the palm” [18]. Given the structural differences between palms and trees, we hypothesized that there must be significant differences in water use characteristics between the two. The objectives of our study were (1) to compare environmental variables and plant traits controlling plant water use, (2) to identify differences in water use between a woody arborescent monocot and a dicot plant species growing in a fruit plantation and (3) to model possible implications on the overall local water budget in the Central Amazon.
2. Experimental Section
2.1. Study Site, Species Selection and Micrometeorological Measurements
This study was conducted in a fruit plantation near the field station of the forest management site of the National Institute for Research in the Amazon (INPA) approximately 60 km northwest of the Centre of Manaus, Brazil. The annual precipitation at the study site is on average 2547 mm/year [19]. Rainfall is more or less evenly distributed throughout the whole year, but with a lesser amount of rain falling between August and November (<100 mm per month). During El Niño events, longer dry spells can occur. Air temperature is on average 26.7 °C with almost no variation between months. The natural vegetation on plateau areas in the region is species-rich evergreen tropical forest (terra firme) growing usually on clay rich Oxisols. For our study, we selected one tree species (Cupuaçu, Theobroma grandiflorum (Willd. ex Spreng.) Schum., Malvaceae) and one palm species (Açaí, Euterpe oleracea, Mart., Arecaceae). Both species are common fruit-bearing species in the Central Amazon, with fruits that have increased in global demand and popularity in recent decades [5].
The fruit plantation is located adjacent to the field station and was established in the mid-1980s. Palms and trees were randomly planted in a mixed stand approximately 0.8 ha in size with no specific planting scheme, but at least with four meters’ distance between tree stems. The plantation was weeded regularly, such that no herbaceous layer was present. Other accompanying species in the plantation are Astrocaryum aculeatum (G. May, Arecaceae), Mangifera indica (L., Anacardiaceae) and Syzygium malaccense ((L.) Merr. & L.M. Perry, Myrtaceae). However, only a few individuals of these other species were planted and broadly scattered on the plantation, so we excluded those from the further analysis. All investigated individuals were in their reproductive state, but flowering or fruiting did not coincide with the study. We chose three individuals with unshaded or only minimally-shaded crowns for each species for the ecophysiological study. Micrometeorological data were gathered in open terrain adjacent to the fruit plantation approximately 30 m away from the plantation edge. Air temperature and relative humidity were measured 2.3 m above the ground with a professional weather station (PCE-FWS 20 weather station, PCE Instruments, Meschede, Germany). A Quantum Sensor (LI-190A, Licor Inc., Lincoln, NV, USA) set up at the same height was used to record photosynthetic photon flux density (PPFD, µ mol s−1 m−2).
2.2. Sap Flux Measurements
Sap flux density (Js, g cm−2 h−1) was measured continuously in three individuals of each selected species for six weeks from 1 August 2011 until 6 September 2011 (corresponding to the dry season) and for six weeks between 1 November 2011 and 12 December 2011 (corresponding to the wet season). Each tree and palm individual was equipped with two thermal dissipation probes [20] at breast height (1.30 m, DBH). One sensor was installed on the northern side and the other on the southern side of the stem. Sensors were protected with an aluminum-shielded insulation box and then covered with plastic foil, which was sealed with silicon to the stem above the sensor set up. The voltage output from the thermocouples was measured every 30 s, and 5-min averages were stored on a Delta-T datalogger (DL-2, Delta-T Devices Ltd., Cambridge, U.K.). We decided to use the standard calibration determined by Granier [21] to calculate sap flux density, as Renninger et al. [16] did not find considerable variations (within a 95% Confidence Interval) from this equation by calibrating thermal dissipation probes for palms.
2.3. Sap Flux Profile
In the last two weeks of the experiment, Js was measured at one additional depth below the cambium (20–40 mm) in each palm and tree individual, as well as at an additional depth (40–60 mm) for individuals with an appropriate diameter at breast height (DBH > 11 cm). The additional sensors were placed randomly on the eastern or western side of the stems, at an angle of 90° from each of two reference sensors to reduce possible interference between sensors. The additional measurements were used to construct a sap flux profile and to estimate the conductive area of the xylem.
2.4. Calculation of Water Use and Tree Transpiration
Daily water use rates (Q, kg day−1) were estimated by up-scaling daily modeled sap flux densities to the water flux through the whole conductive xylem area of a given stem [12]. We expressed tree transpiration rates per day (T, mm day−1) by dividing Q through the crown projection area of the respective tree or palm (m2) (see Table 1). Therefore, the horizontal crown extension of each tree and the horizontal extension of the leaves of each palm were measured in eight cardinal directions. Crown projection area was calculated by summing up the area of the eight pitch circles calculated from the crown/leaf extension in eight cardinal directions [22] (Table 1). We compared tree water use rates among species using the analysis of covariance with DBH as a covariate, as tree water use is often described as a function of tree size and/or DBH [12,23] (analysis of covariance (ANCOVA), followed by a post hoc Tukey honest significant difference (HSD) test). Sap flux densities and tree transpiration rates were compared among species by applying the analysis of variance (ANOVA, followed by a post hoc Tukey HSD test). The statistical analyses were performed using SPSS 18.0 software (SPSS Inc., Chicago, IL, USA). Daily maximum sap flux rates (Js max, g cm−2 h−1) are maximum values at least lasting for 45 min [12].
2.5. Sap Flux Density Model
We used a sap flux density model based on changes in radiation and vapor pressure deficit to identify eventually occurring differences in sap flux density among the two investigated species. The sap flux model used is a modified Jarvis-type model originally capturing stomatal controls in relation to environmental parameters [24]. The model was modified in analogy to the work of Diereck and Hölscher [25] and Diereck et al. [26]; however, in contrast to the earlier work, we opted for a sap flux density model with PPFD (μ mol s−1 m−2) and vapor pressure deficit (VPD) (kPa) as explanatory variables, instead of using global radiation. This resulted in the following model form:
where Js model: modelled sap flux density (g cm−2 h−1);
- a: maximum modelled sap flux density (g cm−2 h−1);
- b: parameter describing PFFD response;
- c,d: parameters describing VPD response.

Table 1.
A summary of the plant structural characteristics of the studied trees and palmsand a summary of the maximum (Js max), mean (Js mean) daily sap flux density, mean daily water use (Qmean) and mean (Tmean) transpiration rates (means and standard deviations (SD), n = 3). Significant differences between the two species (p < 0.05) are indicated by different superscripted letters.
| Species | Family | Common Name | DBH (cm) | Height (m) | Crown Projection Area (m2) | Conductive Xylem (cm2) | Js max g cm−2 h−1 | Js mean g cm−2 day−1 | Qmean kg day−1 | Tmean mm day−1 | ||||||||
|---|---|---|---|---|---|---|---|---|---|---|---|---|---|---|---|---|---|---|
| Mean | SD | Mean | SD | Mean | SD | Mean | SD | Mean | SD | Mean | SD | Mean | SD | Mean | SD | |||
| Euterpe oleracea | Arecaceae | Açai | 13.7 | 1.8 | 7.3 | 1.8 | 25.6 | 2.4 | 143 | 14 | 24.2 a | 9.8 | 90.6 a | 30.3 | 43.6 a | 20.2 | 1.67 a | 0.66 |
| Theobroma grandiflorum | Malvaceae | Cupuaçu | 16.8 | 1.9 | 7.9 | 1.4 | 51.4 | 17.5 | 127 | 19 | 17.7 a | 2.1 | 114.2 a | 24.6 | 14.7 b | 2.8 | 0.30 b | 0.11 |
DBH, diameter at breast height.
Calculations of model parameters a, b, c and d and statistical analyses were performed as described in Diereck et al. [26] using R Version 2.6.2 (R Development Core Team, 2008). Model parameters were used to calculate daily sap flux densities of the year 2012 and to upscale sap flux densities to annual values for the period between 1 January 2012 and 31 December 2012. Annual ingoing data (VPD and PFFD) came from the above-mentioned climate station. Daily water use rates (Q, kg day−1) of all of the trees and palms of the plantation were estimated by up-scaling daily modeled sap flux densities to the water flux through the whole conductive xylem area of all trees and palms on the plantation. Therefore, a diameter at breast height to conductive sap wood area relationship was established from the above-mentioned profile measurements. The established equation was used to calculate the conductive sap wood area of all trees and palms on the plantation. Daily values of water use rates were summed up for given time intervals chosen for inclusion in the model (weeks, months or year) and divided by the total area of the plantation to receive the stand transpiration rate (Ts, mm).
3. Results
3.1. Sap Flux Properties and Conductivity of the Xylem
Normalized daily sap flux densities of both species over the whole period corresponded well to the environmental parameter chosen to perform the model (Figure 1). The two investigated species were relatively similar in their mean daily maximum and mean diurnal sap flux densities. However, the midday course seemed to be different between the two species, as shown for one representative individual of each species over five bright sunny days (Figure 1). This variation indicated a midday depression in transpiration in the trees, but not in the palms. However, a clear morning peak was present in the Cupuaçu trees, but not in the palm. Maximum Js max measured was 24.2 g cm−2 h−1 for Açai and 17.7 g cm−2 h−1 Cupuaçu, and mean daily Js was 90.6 and 114.2 g cm−2 day−1 for Açai and Cupuaçu, respectively (Table 1). Neither the observed maximum Js nor the mean daily Js differed significantly among the two species (Table 1).
The radial sap flux measurements indicated significant water fluxes even below the reference installation depth of the first 2 cm of the xylem below the cambium (Figure 2). In the Açai palm, the sap flux density in the second depth (2–4 cm below cambium) was revealed to be almost the same as in the peripheral cambium (0–2 cm below cambium) (compare to Figure 2a). Compared to the peripheral xylem, sap flux densities were 4% lower in the second xylem depth (2–4 cm below cambium) and 43% lower in the third depth (4–6 cm below cambium). The sap flux densities in the inner xylem compared to the peripheral xylem declined rapidly in the Cupuaçu trees. In the second depth (2–4 cm below cambium), we found a 65% lower sap flux compared to the peripheral xylem and an 88% lower sap flux in the third depth (4–6 cm below cambium) (compare to Figure 3b). Despite the small dataset, the species-specific conductive xylem area scaled relatively well with the diameter at breast height of a given species.
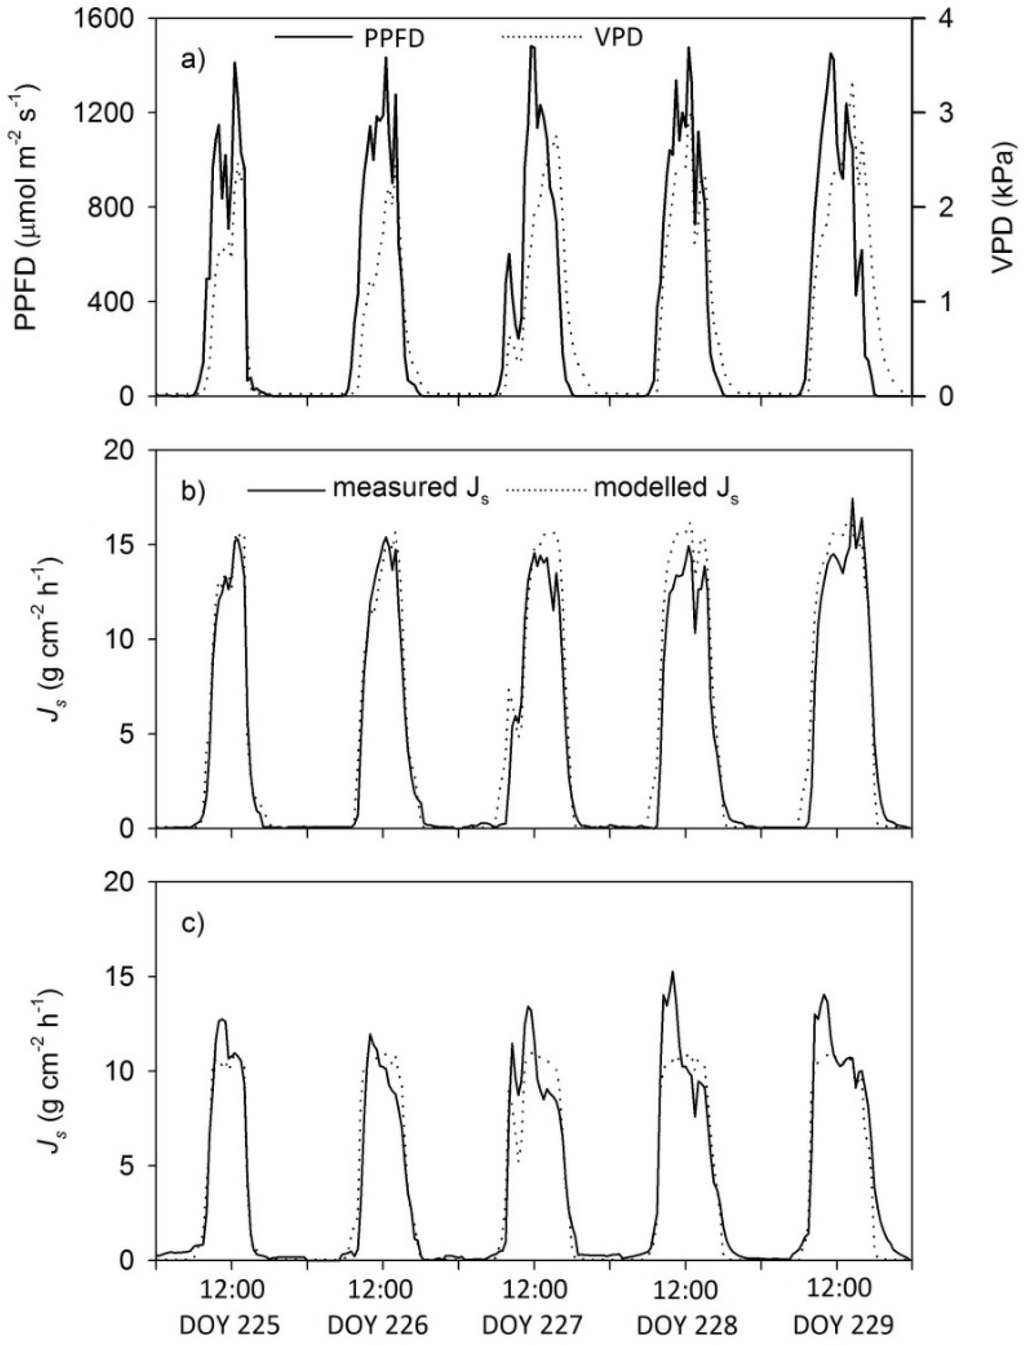
Figure 1.
Diurnal courses of (a) photosynthetic photon flux density (PPFD), vapor pressure deficit (VPD), measured and modelled sap flux densities in a representative (b) Açaí palm and (c) Cupuaçu tree over five days in August 2011 (mean of n = 3, DOY = day of year, Js = Sap flux density).
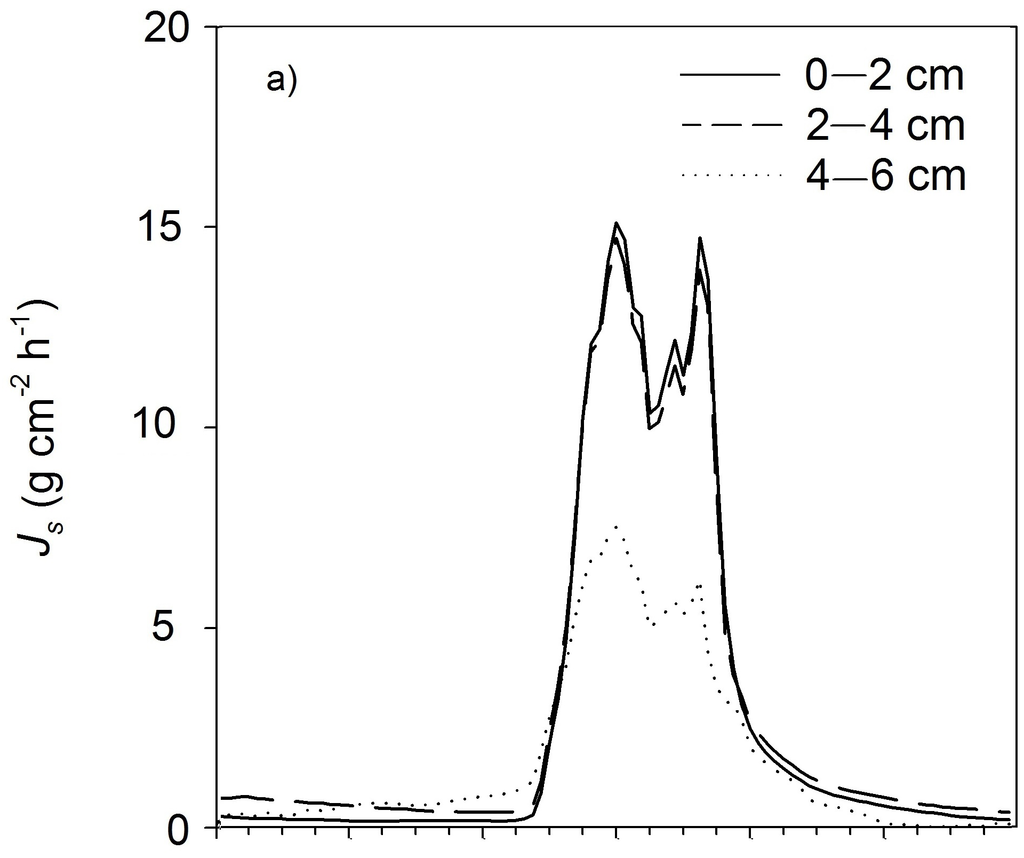
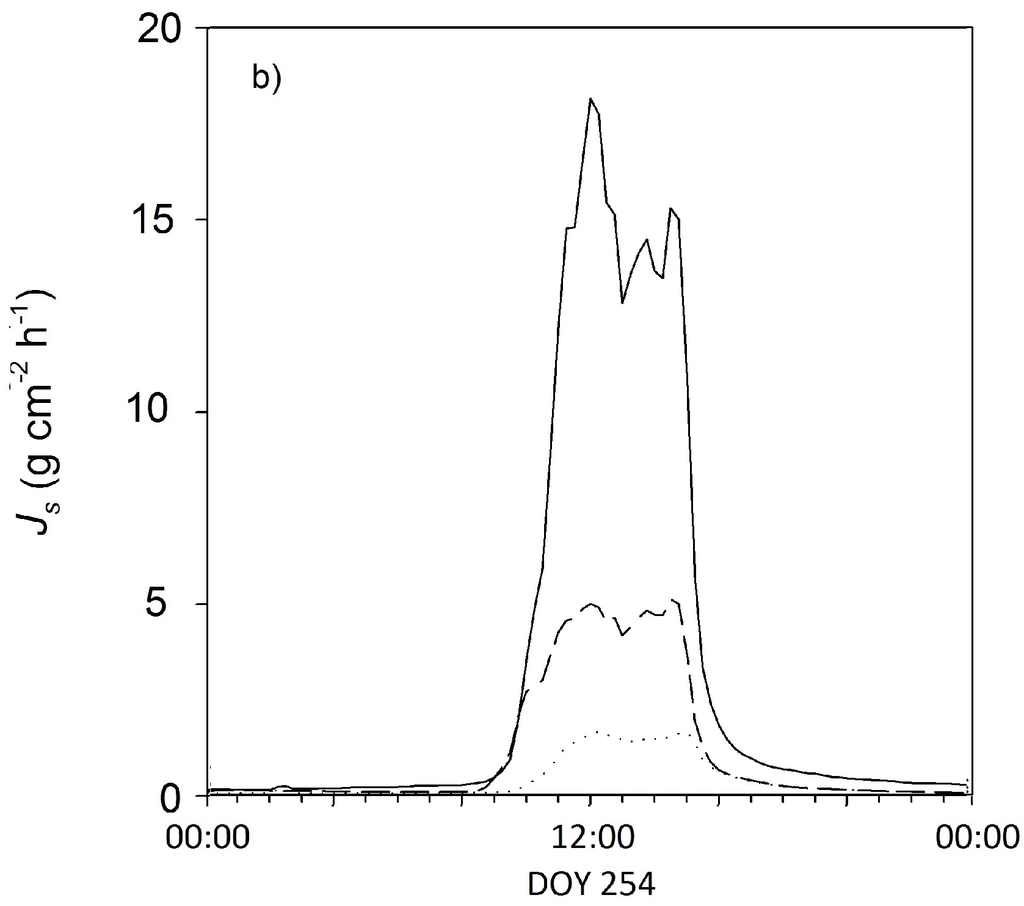
Figure 2.
Representative daily courses of sap flux densities at the different xylem depths (0–2 cm, 2–4 cm and 4–6 cm below cambium) for (a) one Açaí palm and (b) one Cupuaçu tree over 24 h on 5 September 2011, Js = Sap flux density.
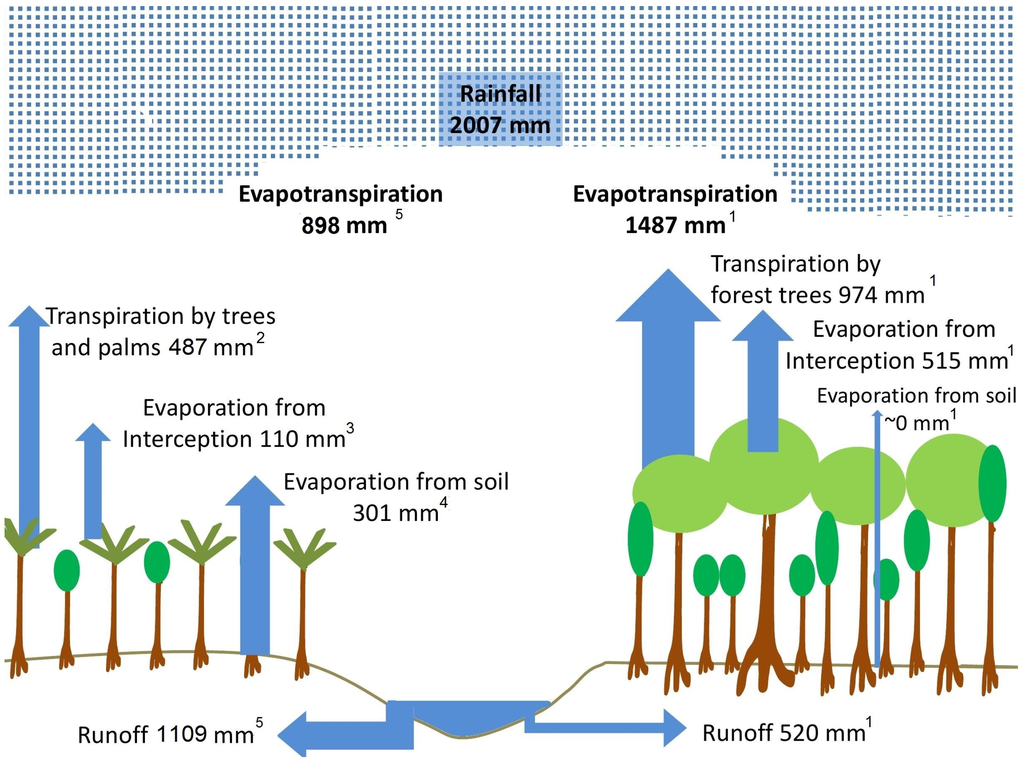
Figure 3.
Changes in the water budget after forest conversion into fruit plantation. The origin and reference of the different values are given by the subscripted numbers. 1 Compiled after values given for Manaus by Salati and Vose [27] and Leopolodo et al. [28], we took the actual precipitation input of the year 2012, which differs only minimally from the original studies by Salati and Vose [27] and Leopolodo et al. [28]. 2 Estimates derived from measurements conducted by this study. 3 The intercept was assumed to scale with leaf area [29] (average leaf area in the planation 1.8 m2 m−2 and in the rainforest 8 m2 m−2), and the leaves in the plantation had intermediate interception properties. 4 Soil evaporation was assumed to be in accordance to average values found in tropical tree plantations [30]. 5 We used the commonly-recognized function to calculate evapotranspiration as the sum of evapotranspiration from intercepted rainwater, tree transpiration and evaporation by the soil. The runoff was calculated as the subtraction of evapotranspiration from annual rainfall.
3.2. Response of Sap Flux to Environmental Parameters
The applied sap flux model captured the relation between observed sap flux densities and the describing environmental variables well. Adjusted coefficient of determination (R2adj) ranged between 0.62 and 0.93 for all plant individuals and was on average 0.87 over all study plants. The root mean square error (RMSE) of the modeled sap flux densities was 2.56 g cm−2 h−1 for the Açai palms and 1.65 g cm−2 h−1 for the Cupuaçu trees (Table 2). All estimated model parameters and standard deviations are presented in Table 2. Means of the parameter a (modeled Js max) and parameter b (species-specific PPFD response) were significantly different (post hoc Tukey test), whereas no differences between species were indicated for parameter c (VPD response). Modeled mean daily sap flux densities differed from the actual measured mean daily sap flux densities by 3.9% and 4.9% for the Açai palms and the Cupuaçu trees, respectively (compare Table 1 and Table 2).
Table 2.
Estimated daily mean sap flux density (Js mean), estimated model parameters (a, b, c and d) and measures of model performance (adjusted coefficient of determination (R2adj); root mean square error (RMSE)) for the two studied species (means and standard deviations (SD), n = 3 plant individuals). Significant differences (p < 0.05) between species for the estimated sap flux density and individual model parameters are indicated by different superscripted letters.
| Species | Js max (g cm−2 day−1) | a (g cm−2 h−1) | b μ mol s−1 m−2 | c (kPa) | d (kPa) | R2adj (-) | RMSE (g cm−2 h−1) | ||||||
|---|---|---|---|---|---|---|---|---|---|---|---|---|---|
| Mean | SD | Mean | SD | Mea | SD | Mean | SD | Mean | SD | Mean | SD | ||
| Euterpe oleracea | 87.1 a | 50.8 | 12.5 a | 5.3 | 311.7 a | 290.4 | 0.38 a | 0.29 | 0.46 | 0.16 | 0.67 | 2.56 | 0.57 |
| Theobroma grandiflorum | 108.6 a | 21.0 | 13.3 b | 1.8 | 79.1 b | 51.0 | 0.30 a | 0.09 | 0.24 | 0.08 | 0.92 | 1.65 | 0.27 |
a: maximum modelled sap flux density (g cm−2 h−1); b: parameter describing photosynthetic photon flux density (PFFD) response; c,d: parameters describing vapor pressure deficit (VPD) response.
3.3. Water Use and Transpiration Rates
Species’ means of daily mean and maximum water use rates (Q and Qmax in kg day−1) were significantly different among the two investigated species. We estimated the mean daily water use rate of Açai to be 43 kg day−1 with maximum rates up to 90 kg day−1. The Cupuaçu trees for the mean used 14.7 kg day−1 with maximum water use rates of 23.9 kg day−1 (compare to Table 1). The difference in maximum water use rates between the two species was largely defined by the strong dependency of the water use rates on the conductivity of the xylem, and the conductive xylem area explained 85% of the observed variability in the maximum water use rates. An often described interspecific relationship between water use rates and diameter at breast height (which leaves out possible differences in area, which explained the conductive tissues) was not indicated. Species differed significantly in their water use rates expressed per unit crown projection area (Table 1). Mean transpiration rates averaged 1.67 mm day−1 for the Açai palm and 0.30 mm day−1 for the Cupuaçu trees over the whole study period. Maximum transpiration rates observed in the six plant individuals varied from 0.34–5.52 mm day−1. We estimated that the plantation transpired 24.3% of the annual rainfall summing up to 487 mm/year (Figure 3). Palms contributed the greatest fraction of the overall stand transpiration rate.
4. Discussion
4.1. Sap Flux Characteristics and Model Performance
Our observed maximum sap flux densities for Cupuaçu (Theobroma grandiflorum) and Açai (Euterpe oleracea) are in accordance to reported values for tropical tree species growing in plantations in the Neotropics, which mostly fall between 7 and 46 g cm−2 h−1 [13,31]. Overall, we achieved a very satisfying fit of the model describing the sap flux density of both species, and the models estimating sap flux using the parameter we used are recommended for tropical regions. The good model fit was illustrated by high to very high R2adj values and by very low root mean square errors for all of our studied palm and tree individuals (Table 2) [25,26]. All three estimated parameter were within the range of values estimated for 17 species from three different secondary forests [26]; hence, sap flux sensors can be applied in palms without any disadvantage with respect to their differing stem structure compared to trees.
A detailed comparison of the day time variation in sap flux between species indicates a pronounced midday depression in the sap flux of the Cupuaçu tree that was not indicated by the model. Unfortunately, no soil moisture was measured, but we speculate that this midday depression might have been caused by soil water limitation, as sap flux densities were reduced after noon with continuing high evaporative demand (Figure 1). Kunert et al. [12] found similar behavior in water-limited trees, which showed reduced sap flux densities compared to times under ample water conditions and similar availability of radiation. Another explanation could be that the climate station was too close to the stand and not installed at a representative height [25] for the canopy of the Cupuaçu trees, as they were much higher than the Açai palms. Nevertheless, the two environmental parameters we used to explain variations in sap flux define a great portion of the diurnal changes in sap flux densities of the Açai palm and the Cupuaçu tree. The model might not have captured the morning peak in the Cupuaçu trees, but had a high fit when comparing the estimated and measured daily sap flux densities. These values are the important estimates to up-scale from the sap flux densities to whole tree water use and transpiration rates. However, under different circumstances (e.g., most probably under severe water limitation during the dry season), a similar good model fit might not be achieved, and as already mentioned, soil moisture content could be an additional explanatory parameter [26]. That we only found a midday depression of transpiration in the Cupuaçu trees and not in the palms could be explained by the exceptionally high water storage capacity in the palm stems [18]. Evidence for this can be found from the profile measurements; higher nighttime refilling activity took place in the deeper xylem of the palms (2–4 cm) (Figure 2).
4.2. Xylem Conductivity and Water Use Rates
Water use in the palm trees was up to 3.5-times higher than in the Cupuaçu trees for a given diameter at breast height (Table 1). This difference in water use results from a much greater conductive xylem area in the palm trees, as sap flux densities in the outer 2 cm were not significantly different, but sap flux densities in deeper sap wood profiles were much higher in palms than in trees. In general, total plant water use is assumed to “universally scale” with the size of the conductive xylem area [32]. In our diffuse porous Cupuaçu trees, the conductivity of the xylem was already significantly reduced within the second depth of the profile measurements (20–40 mm, a reduction of 65% compared to 0–20 mm), and only a small fraction of the out sap flux density was measured at the third depth (40–60 mm, a reduction of 88% compared to 0–20 mm). In contrast, sap flux densities were almost the same in the deeper xylem of the Açai palm as in the outer xylem (Figure 2). Palms are commonly known to have vascular bundles throughout the whole stem cross-section and are able to transport water also within the center of the stem [14]. Nevertheless, the slightly reduced sap flux densities measured at the deepest depth of the palm xylem (40–60 mm) indicate that there is a lower concentration of vascular bundles towards the center. Similar results are reported by anatomical studies on the structure of palm stems from the genus Euterpe in the Central Amazon and in Costa Rica, where a higher concentration of vascular bundles was found at the stem periphery [14,18].
We estimated the mean daily water use rate of Açai as 43 kg day−1 with maximum rates up to 90 kg day−1 during days with high evaporative demand. High water use rates have already been estimated for other palm species, e.g., coconut palm trees, in various studies. Adult coconut trees use between 30 and 120 kg day−1 [33], but high water consumption only occurs during periods with high evaporative demand [34]. The extreme high water use rate of the Açai palm might also explain why this species, or in general arborescent palms, is more common in the flood plains where the water table is higher than in plateau areas of the terra firme forest in the Amazon. Observed water use rates of the Cupuaçu trees had a mean of 14.7 kg day−1 and were in line with other studies on tropical trees. Mean daily water use rates of 10 kg day−1 are reported for Theobroma cacao (mean DBH 10 cm) in Indonesia [11] and water use rates between 10 and 20 kg day−1 (mean DBH 15 cm) for a variety of tree species, even sized and growing under plantation conditions in mono-specific and mixed stands in Panama [31,35].
4.3. Plant Transpiration Rates
Maximum transpiration rates observed in the six plant individuals varied from 0.34–5.52 mm day−1. This wide range of individual tree transpiration is confirmed by various studies in the tropics. Daily transpiration rates, for example, in individual trees growing in a Panamanian plantation, had a mean between 0.36 and 1.16 mm day−1 per unit crown projection area during the wet season [31], whereas values up to 4.9 mm day−1, with one exceptional tree transpiring 7.5 mm day−1 per unit crown projection area, were also recorded in a study comparing data from three different secondary tropical forests, one located in Indonesia, one in the Philippines and one in Panama [26]. In our case, the palm trees had significantly higher transpiration rates. High transpiration rates of native palm trees occurring in the Amazon were already outlined by Renninger et al. [16]. In the mentioned study, the palm species Iriartea deltoidea contributed significantly more to the stand transpiration per unit leaf area “than the average leaf found in the rain forest”.
4.4. Stand Transpiration Rate and Impact on the Local Water Budget
Land use change is significantly affecting the local budget and drastically reduces the recycling rate of precipitation [9,27]. Deforestation has thus a significant effect on the rainfall pattern of the whole Amazon Basin and with teleconnections on rainfall in the Southern parts of South America [36]. Conversion of natural forests to anthropogenic forest systems, such as tree plantations, is supposed to have lower effects on the overall water budget [37]. However, we found in this study that the evapotranspiration was drastically reduced above the plantation compared to estimates from the natural undisturbed forest. Estimates for the Central Amazon for years with similar rainfall rates as during our study period assume that approximately 74.1% of the annual rainfall is evapotranspired [27], which would be 1487 mm for our study year. Assuming a significant increase of soil evaporation from 0% in the forest [27,28] to up to 15% of the annual rainfall in the plantation [30] and a reduced evaporation of rainfall interception due to reduced leaf area in the plantation, we estimated an annual evapotranspiration rate of 898 mm above the plantation (Figure 3). This means locally an up to 40% reduction of evapotranspiration through land use conversion to such small-holder plantations and that the runoff rate would be significantly increased.
5. Conclusions
The observed individual water uses and transpiration rates might give only limited information on how the stand transpiration rates will change if natural forests are altered into plantations, as we considered only unshaded or minimally-shaded palm and tree individuals. However, we assumed that these palms and trees contribute a major part to the overall stand transpiration, although differences in individual tree development within a stand and contrasting stand structure due to species mixtures might reduce the observed species-specific transpiration rates [26]. Nevertheless, we suggest that the distinct difference in water use and transpiration rates between monocot and dicot species will have a major effect on changes in the water table of newly established fruit plantations and on variations within the water table compared to former land uses in the affected area.
Acknowledgments
We thank Alida Mercado Cárdenas for critical proof reading and Susan Trumbore for valuable comments on an earlier version of the manuscript. We would like to thank two anonymous reviewers for their comments on and suggestion for how to improve the clarity of this manuscript.
Author Contributions
Norbert Kunert and Priscila Barros conducted the field work. Norbert Kunert, Luiza Maria Teóphilo Aparecido and Niro Higuchi analyzed the data. Norbert Kunert took the lead in writing the manuscript. All authors contributed to the revision of the final manuscript.
Conflicts of Interest
The authors declare no conflict of interest.
References
- Kunert, N.; Barros, P.; Higuchi, N. Do palm water use characteristics explain the spatial distribution of palms in the Central Amazon? Acta Hortic. 2013, 991, 197–204. [Google Scholar]
- Henderson, A. The Palms of the Amazon; University Press: Oxford, UK, 1995. [Google Scholar]
- Nogueira, O.; Carvalho, C.; Muller, C.; Galvao, E.; Silva, H.; Rodrigues, J.; Ooliveira, M.; Carvalho Neto, J.; Nascimento, W.; Calvazarra, B. A Cultura do Açaí.; Embrapa/Centro de Pesquisa Agroflorestal da Amazônia Oriental: Beasilia, Brazil, 1995. [Google Scholar]
- Santos, G.M.; Maia, G.; Sousa, P.; Costa, J.; Figueiredo, R.; Prado, G. Correlação entre atividade antioxidante e compostos bioativos de polpas comerciais de açaí (Euterpe oleracea Mart). Archivos Latinoam. Nutr. 2008, 58, 187–192. (In Portuguese) [Google Scholar]
- Colapinto, J. Strange fruit: The rise and fall of Acai. New Yorker 2011, 87, 37–41. [Google Scholar]
- Lorenzi, H. Árvores brasileiras: Manual de Identificação e Cultivo de Plantas Arbóreas Nativas; Nova Odessa: Brasilia, Brazil, 1998. [Google Scholar]
- Venturieri, G. Cupuaçu: A Espécie, sua Cultura, usos e Processamento; Clube do Cupu: Belém, Brazil, 1993. [Google Scholar]
- Bastos, M.; Gurgel, T.; De Sousa Filho, M. Efeito da aplicação de enzimas pectinolíticas no rendimento da extração de polpa de cupuaçu. Rev. Bras. Frutic. 2002, 24, 240–242, (In Portuguese ). [Google Scholar] [CrossRef]
- D’Almeida, C.; Vörösmarty, C.J.; Hurtt, G.C.; Marengo, J.A.; Dingman, S.L.; Keim, B.D. The effects of deforestation on the hydrological cycle in Amazonia: A review on scale and resolution. Int. J. Climatol. 2007, 27, 633–647. [Google Scholar] [CrossRef]
- Flore, J.A.; Lakso, A.N. Environmental and physiological regulation of photosynthesis in fruit crops. In Horticultural Reviews; John Wiley & Sons, Inc.: Hoboken, NJ, USA, 1989; pp. 111–157. [Google Scholar]
- Köhler, M.; Schwendenmann, L.; Hölscher, D. Throughfall reduction in a cacao agroforest: Tree water use and soil water budgeting. Agric. For. Meteorol. 2010, 150, 1079–1089. [Google Scholar] [CrossRef]
- Kunert, N.; Schwendenmann, L.; Hölscher, D. Seasonal dynamics of tree sap flux and water use in nine species in Panamanian forest plantations. Agric. For. Meteorol. 2010, 150, 411–419. [Google Scholar] [CrossRef]
- Dünisch, O.; Morais, R. Regulation of xylem sap flow in an evergreen, a semi-deciduous, and a deciduous meliaceae species from the amazon. Trees 2002, 16, 404–416. [Google Scholar]
- Aparecido, L.M.T.; dos Santos, J.; Higuchi, N.; Kunert, N. Ecological applications of differences in the hydraulic efficiency of palms and broad-leaved trees. Trees 2015, 1–15. [Google Scholar] [CrossRef]
- Niu, F.; Röll, A.; Hardanto, A.; Meijide, A.; Köhler, M.; Hendrayanto; Hölscher, D. Oil palm water use: Calibration of a sap flux method and a field measurement scheme. Tree Physiol. 2015, 35, 563–573. [Google Scholar] [CrossRef] [PubMed]
- Renninger, H.J.; Phillips, N.; Salvucci, G.D. Wet- vs. dry-season transpiration in an Amazonian rain forest palm Iriartea deltoidea. Biotropica 2010, 42, 470–478. [Google Scholar] [CrossRef]
- Basset, Y. Communities of insect herbivores foraging on saplings versus mature trees of Pourouma bicolor (Cecropiaceae) in Panama. Oecologia 2001, 129, 253–260. [Google Scholar] [CrossRef]
- Rich, P.M. Developmental anatomy of the stem of Welfia georgii, Iriartea gigantea, and other arborescent palms: Implications for mechanical support. Am. J. Bot. 1987, 74, 792–802. [Google Scholar] [CrossRef]
- Da Silva, F.; Suwa, R.; Kajimoto, T.; Ishizuka, M.; Higuchi, N.; Kunert, N. Allometric equations for estimating biomass of Euterpe precatoria, the most abundant palm species in the Amazon. Forests 2015, 6, 450–463. [Google Scholar] [CrossRef]
- Granier, A. Une nouvelle méthode pour la mesure du flux de sève brute dans le tronc des arbres. Ann. For. Sci. 1985, 42, 193–200. (In French) [Google Scholar] [CrossRef]
- Granier, A. Evaluation of transpiration in a Douglas-fir stand by means of sap flow measurements. Tree Physiol. 1987, 3, 309–320. [Google Scholar] [CrossRef] [PubMed]
- Röhle, H. Vergleichende Untersuchungen zur Ermittlung der Genauigkeit bei der Ablotung von Kronenradien mit dem Dachlot und durch senkrechtes anvisieren des Kronenrandes. Forstarchiv 1986, 57, 67–71. (In German) [Google Scholar]
- Andrade, J.; Meinzer, F.; Goldstein, G.; Schnitzer, S. Water uptake and transport in lianas and co-occurring trees of a seasonally dry tropical forest. Trees 2005, 19, 282–289. [Google Scholar] [CrossRef]
- Jarvis, P.G. The interpretation of the variations in leaf water potential and stomatal conductance found in canopies in the field. Philos. Trans. R. Soc. Lond. B Biol. Sci. 1976, 273, 593–610. [Google Scholar] [CrossRef]
- Dierick, D.; Hölscher, D. Species-specific tree water use characteristics in reforestation stands in the Philippines. Agric. For. Meteorol. 2009, 149, 1317–1326. [Google Scholar] [CrossRef]
- Dierick, D.; Kunert, N.; Köhler, M.; Schwendenmann, L.; Hölscher, D. Comparison of tree water use characteristics in reforestation and agroforestry stands across the tropics. In Tropical Rainforests and Agroforests under Global Change; Tscharntke, T., Leuschner, C., Eds.; Spinger: Berlin, Germany, 2010; pp. 293–308. [Google Scholar]
- Salati, E.; Vose, P.B. Amazon basin: A system in equilibrium. Science 1984, 225, 129–138. [Google Scholar] [CrossRef] [PubMed]
- Leopoldo, P.R.; Franken, W.K.; Salati, E. Balanço hídrico de pequena bacia hidrográfica em floresta amazônica de terra firme. Acta Amazon. 1982, 12, 33–337. (In Portuguese) [Google Scholar]
- Schneebeli, M.; Wolf, S.; Kunert, N.; Eugster, W.; Mätzler, C. Relating the X-band opacity of a tropical tree canopy to sapflow, rain interception and dew formation. Remote Sens. Environ. 2011, 115, 2116–2125. [Google Scholar] [CrossRef]
- Lane, P.N.J.; Morris, J.; Ningnan, Z.; Guangyi, Z.; Guoyi, Z.; Daping, X. Water balance of tropical eucalypt plantations in south-eastern China. Agric. For. Meteorol. 2004, 124, 253–267. [Google Scholar] [CrossRef]
- Kunert, N. Tree Transpiration in Forest Plantations: Effects of Species, Seasonality and Diversity (Panama); Georg-August-Universität Göttingen: Goettingen, Germany, 2010. [Google Scholar]
- Meinzer, F.; Andrade, J.; Goldstein, G.; Holbrook, N.; Cavelier, J.; Wright, S. Partitioning of soil water among canopy trees in a seasonally dry tropical forest. Oecologia 1999, 21, 293–301. [Google Scholar] [CrossRef]
- Jayasekara, K.; Jayasekara, C. Efficiency of water use in coconut under different soil/plant management systems. In Advances in Coconut Research and Development; Nair, M., Khan, H., Eds.; Oxford & IBH Publishing: New Delhi, India, 1993. [Google Scholar]
- Yusuf, M.; Varadan, K. Water management studies on coconut in india. In Advances in Coconut Research and Development; Nair, M., Khan, H., Eds.; Oxford & IBH Publishing: New Delhi, India, 1993; pp. 337–346. [Google Scholar]
- Kunert, N.; Schwendenmann, L.; Potvin, C.; Hölscher, D. Tree diversity enhances tree transpiration in a Panamanian forest plantation. J. Appl. Ecol. 2012, 49, 135–144. [Google Scholar] [CrossRef]
- Spracklen, D.V.; Arnold, S.R.; Taylor, C.M. Observations of increased tropical rainfall preceded by air passage over forests. Nature 2012, 489, 282–285. [Google Scholar] [CrossRef] [PubMed]
- Kunert, N.; Cardenas, A.M. Are diverse tropical tree plantations more resistant to drought than monocultures? Forests 2015, 6, 2029–2046. [Google Scholar] [CrossRef]
© 2015 by the authors; licensee MDPI, Basel, Switzerland. This article is an open access article distributed under the terms and conditions of the Creative Commons Attribution license (http://creativecommons.org/licenses/by/4.0/).