Dieback of Euonymus alatus (Celastraceae) Caused by Cytospora haidianensis sp. nov. in China


Abstract
1. Introduction
2. Materials and Methods
2.1. Collection and Isolation
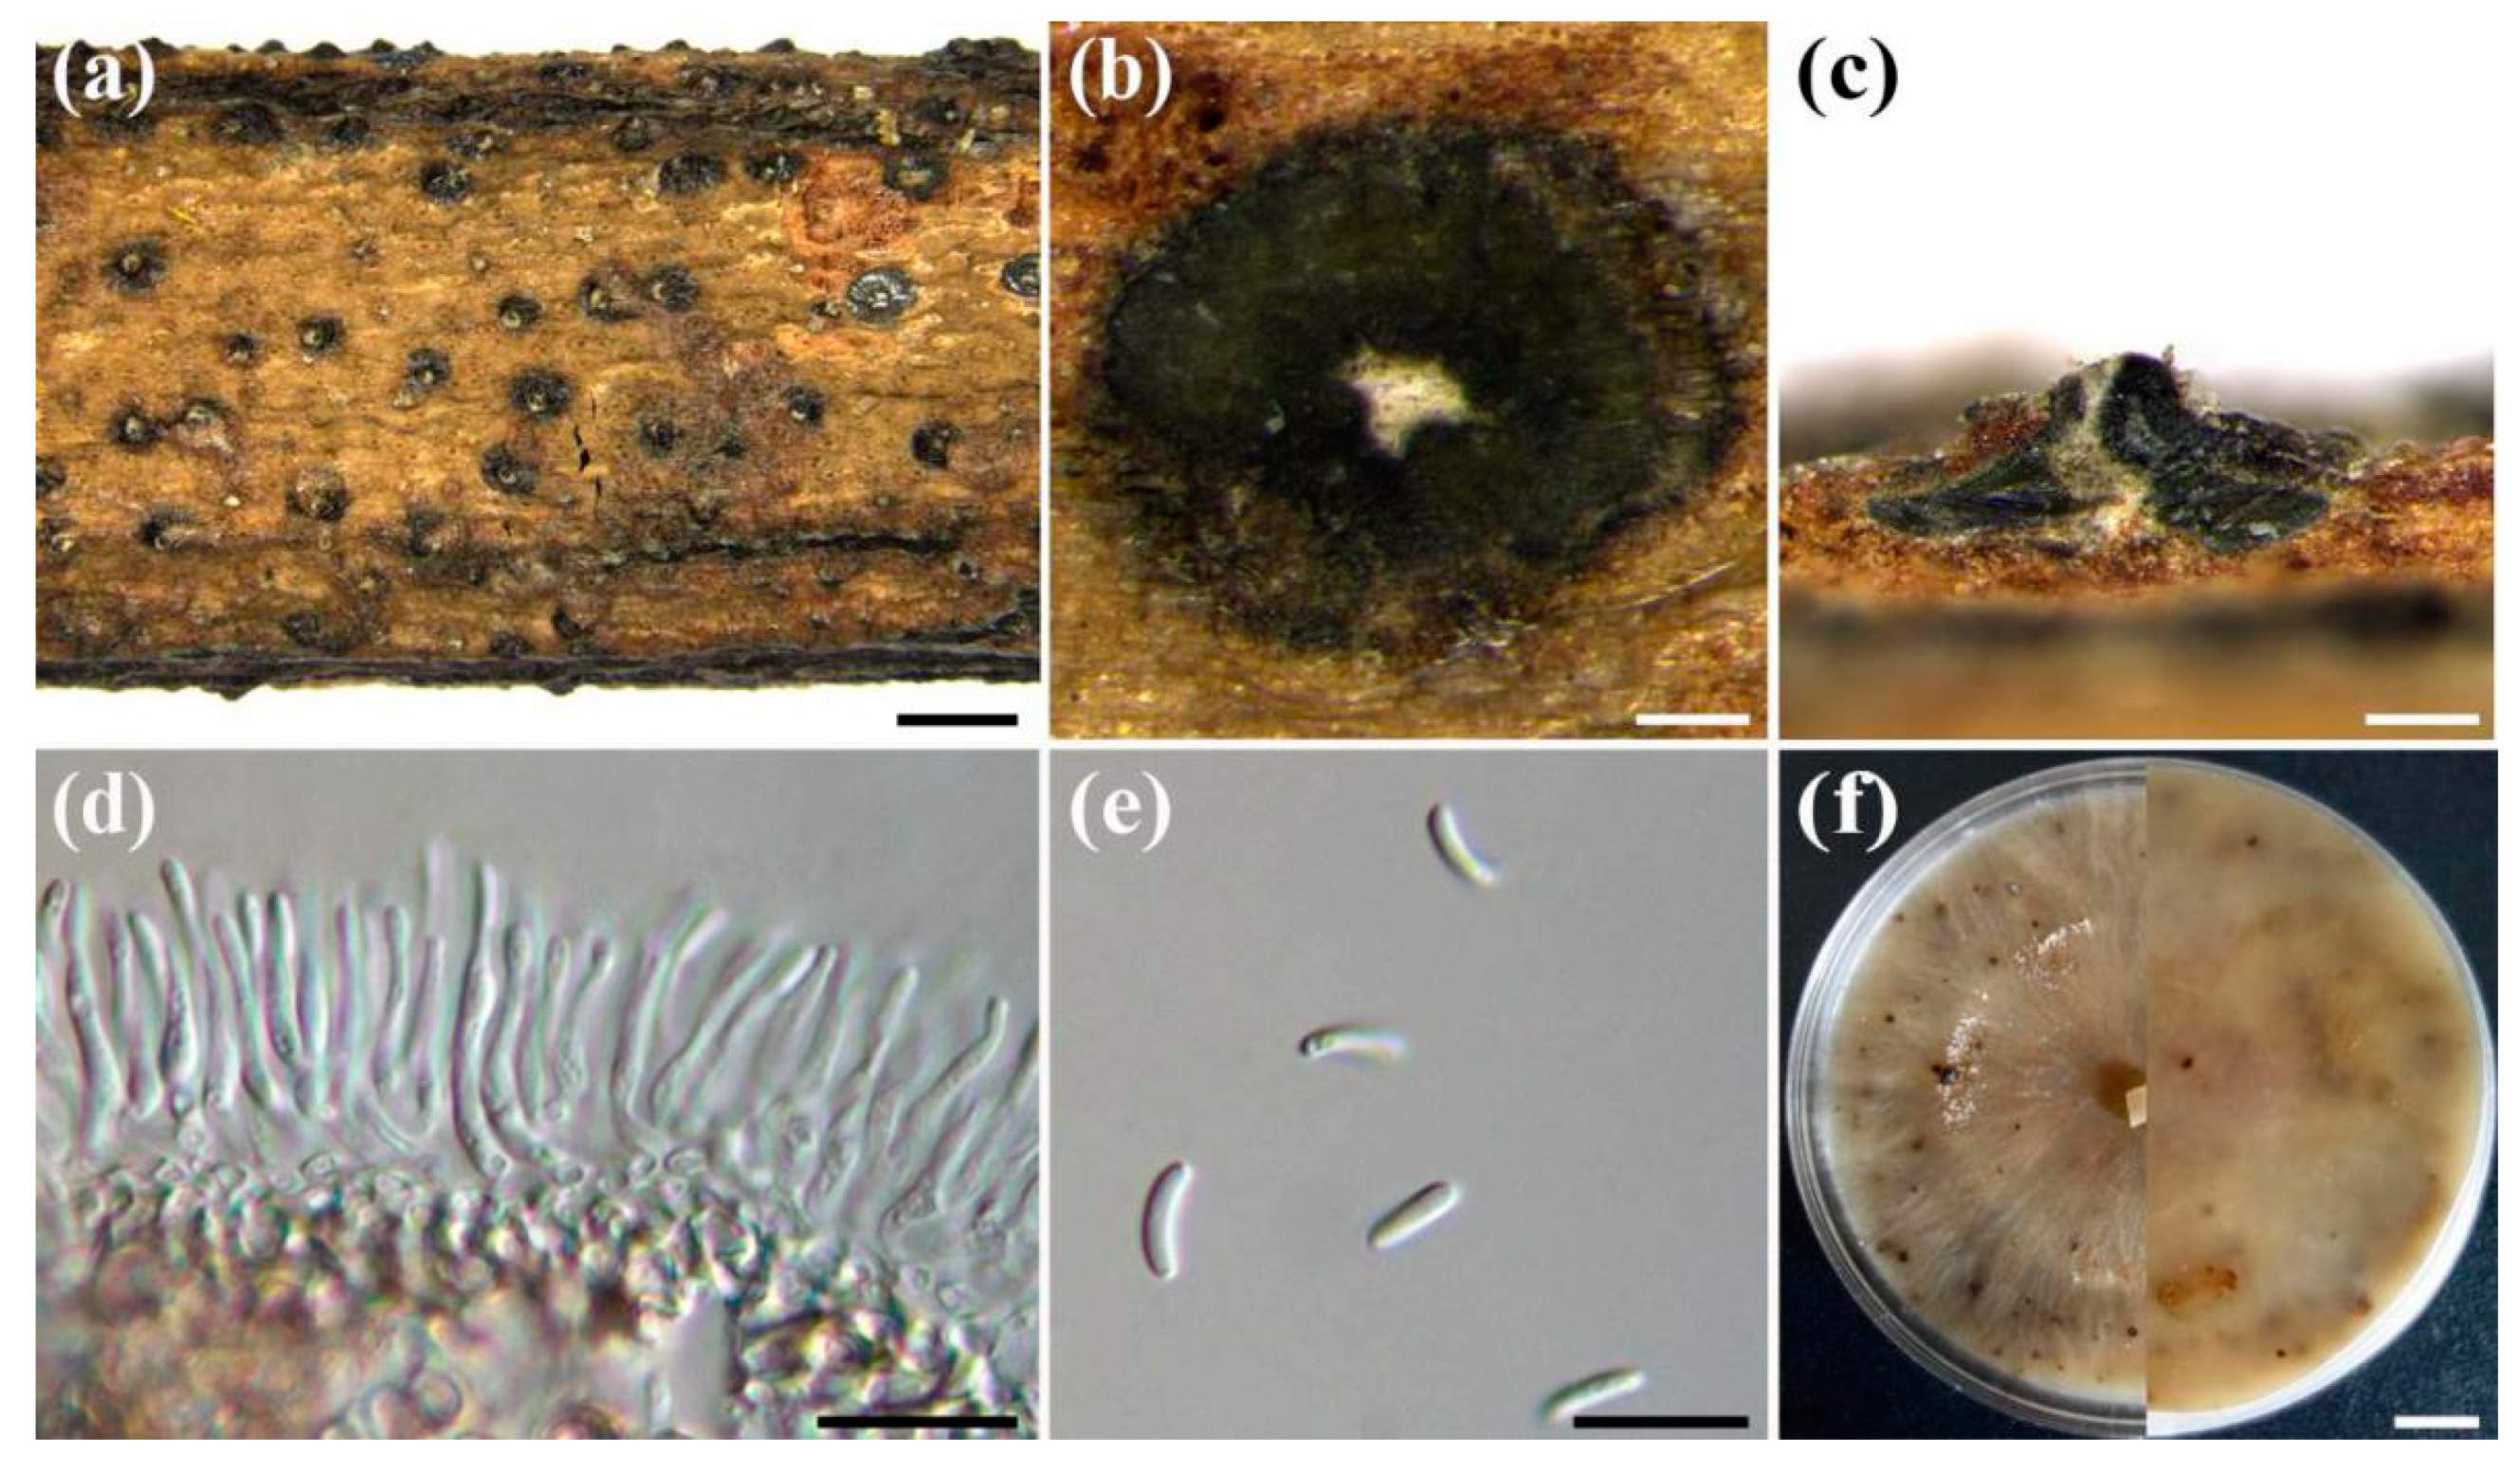
2.2. Morphological Observation
2.3. DNA Extraction, PCR Amplification and Sequencing
2.4. Phylogenetic Analysis
2.5. Pathogenicity Test
2.6. Temperature and pH Tests
2.7. Carbon Colony Growth Test
3. Results
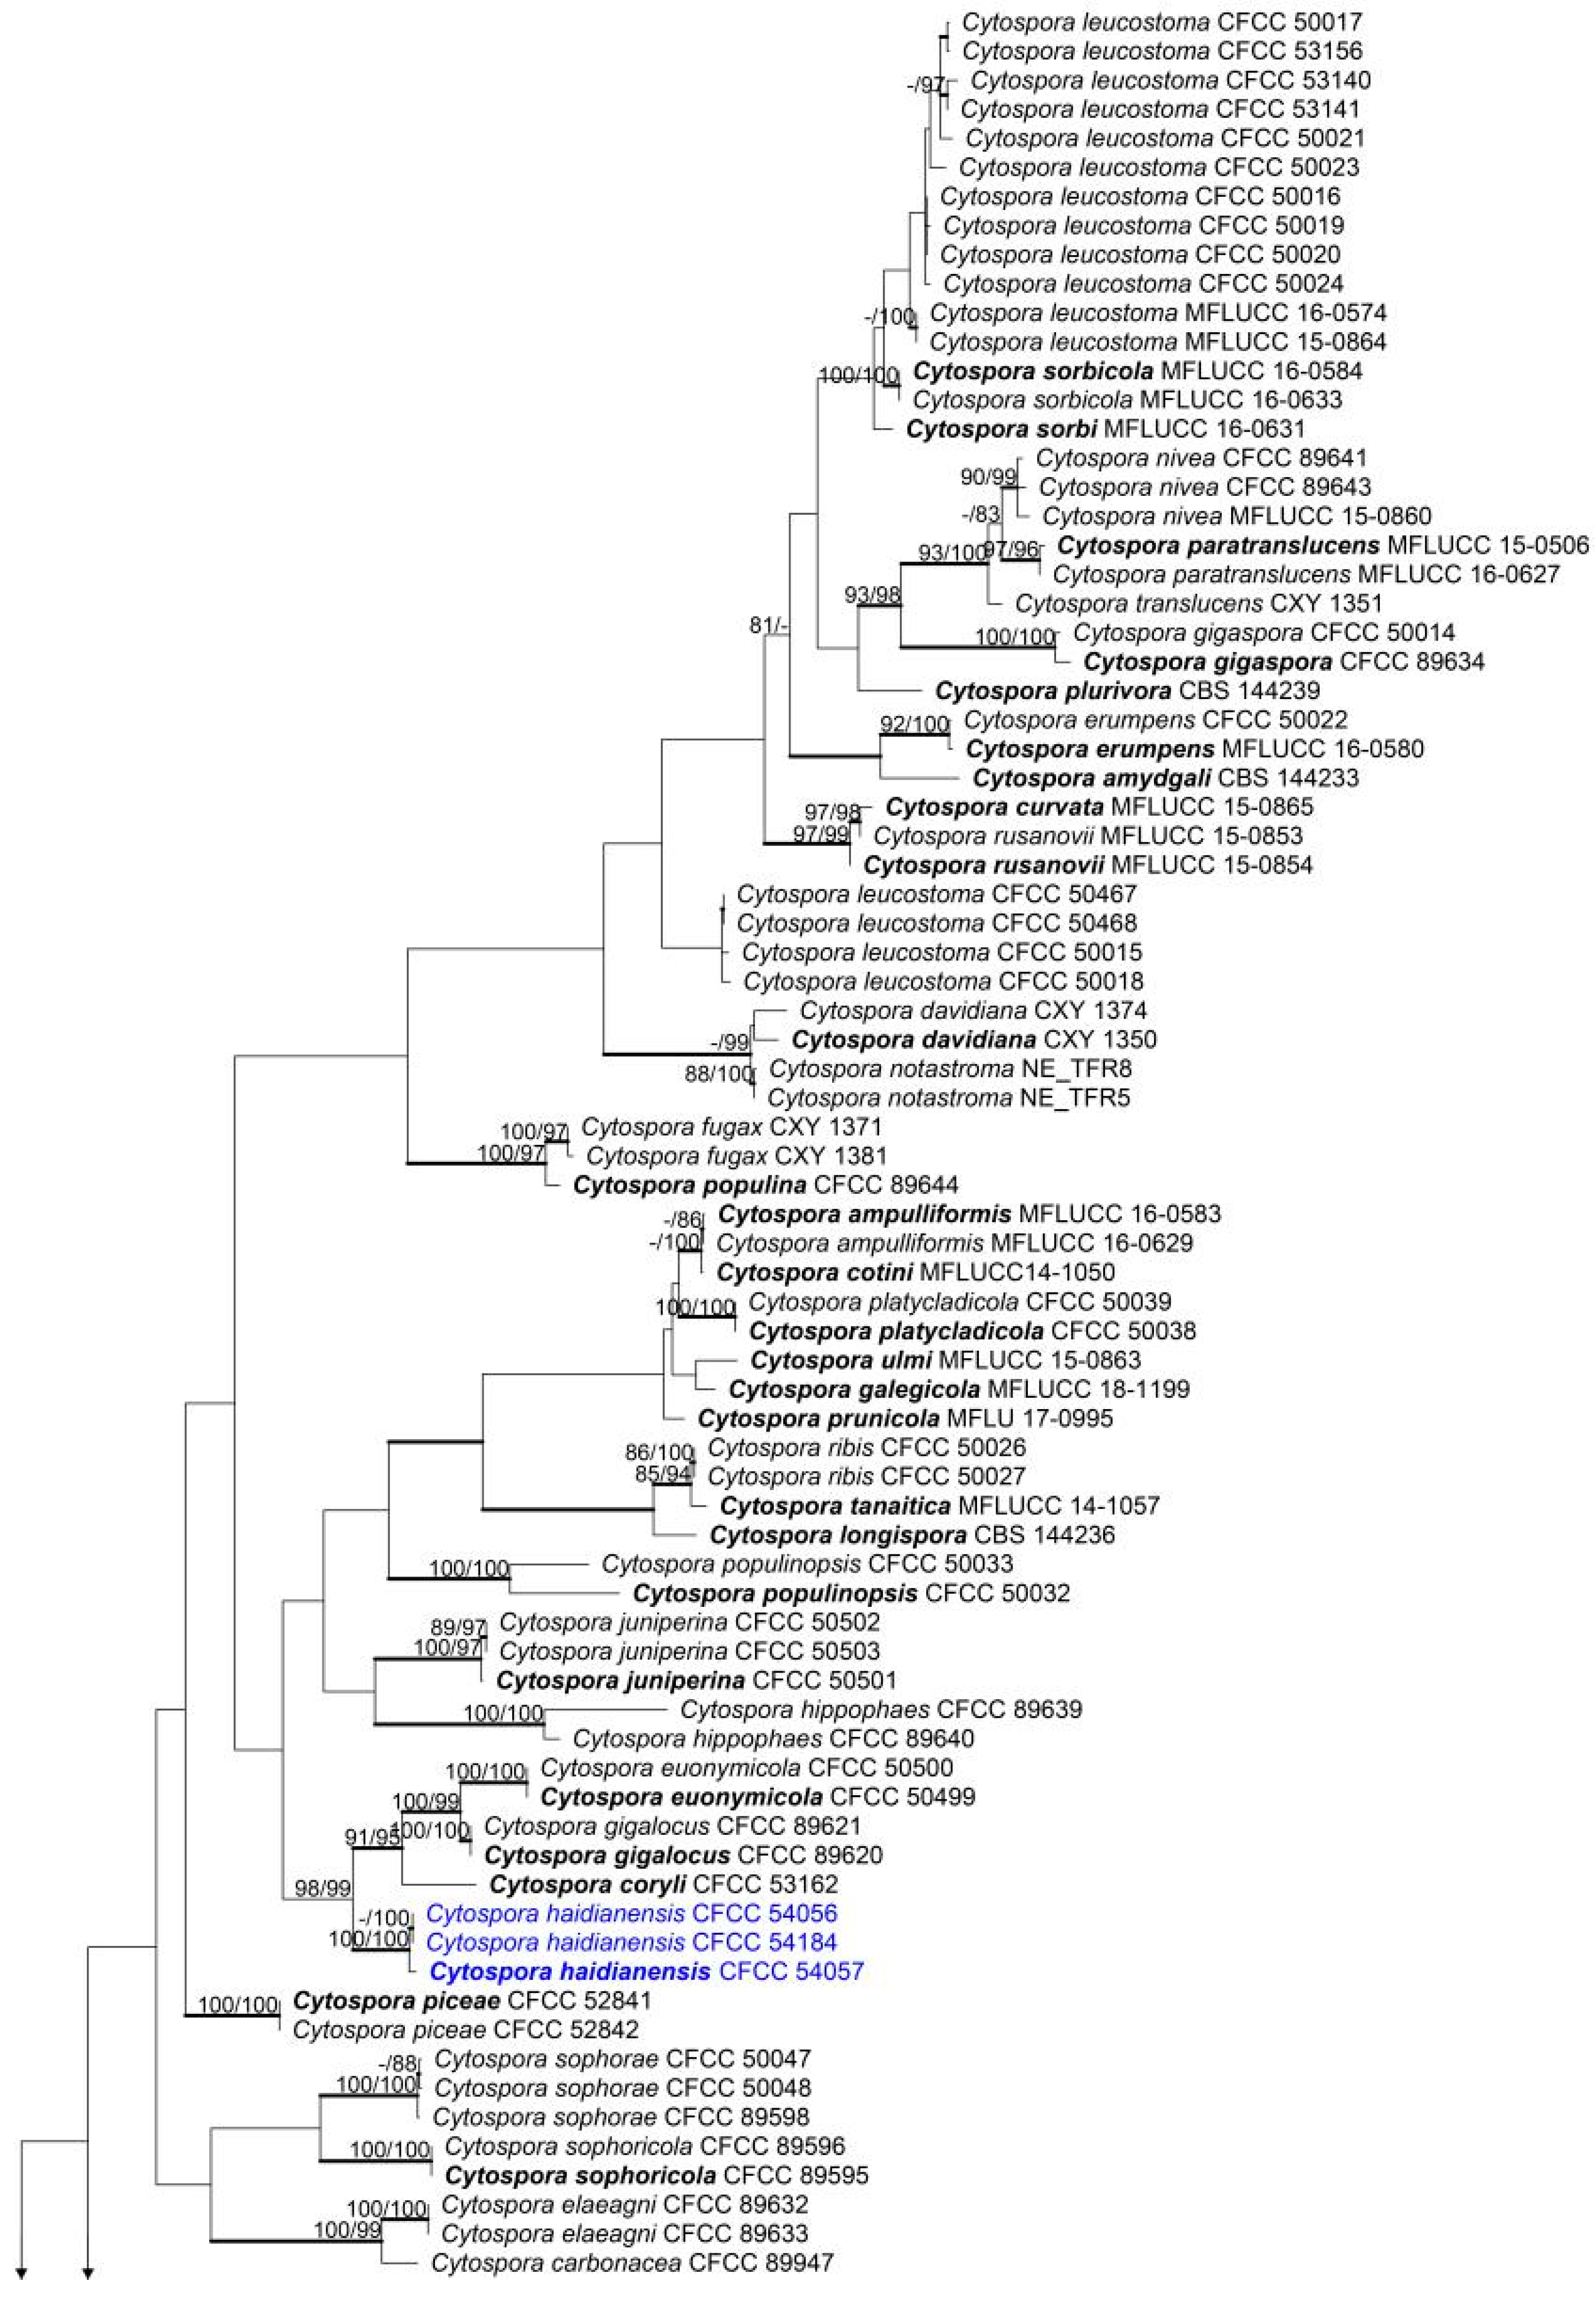
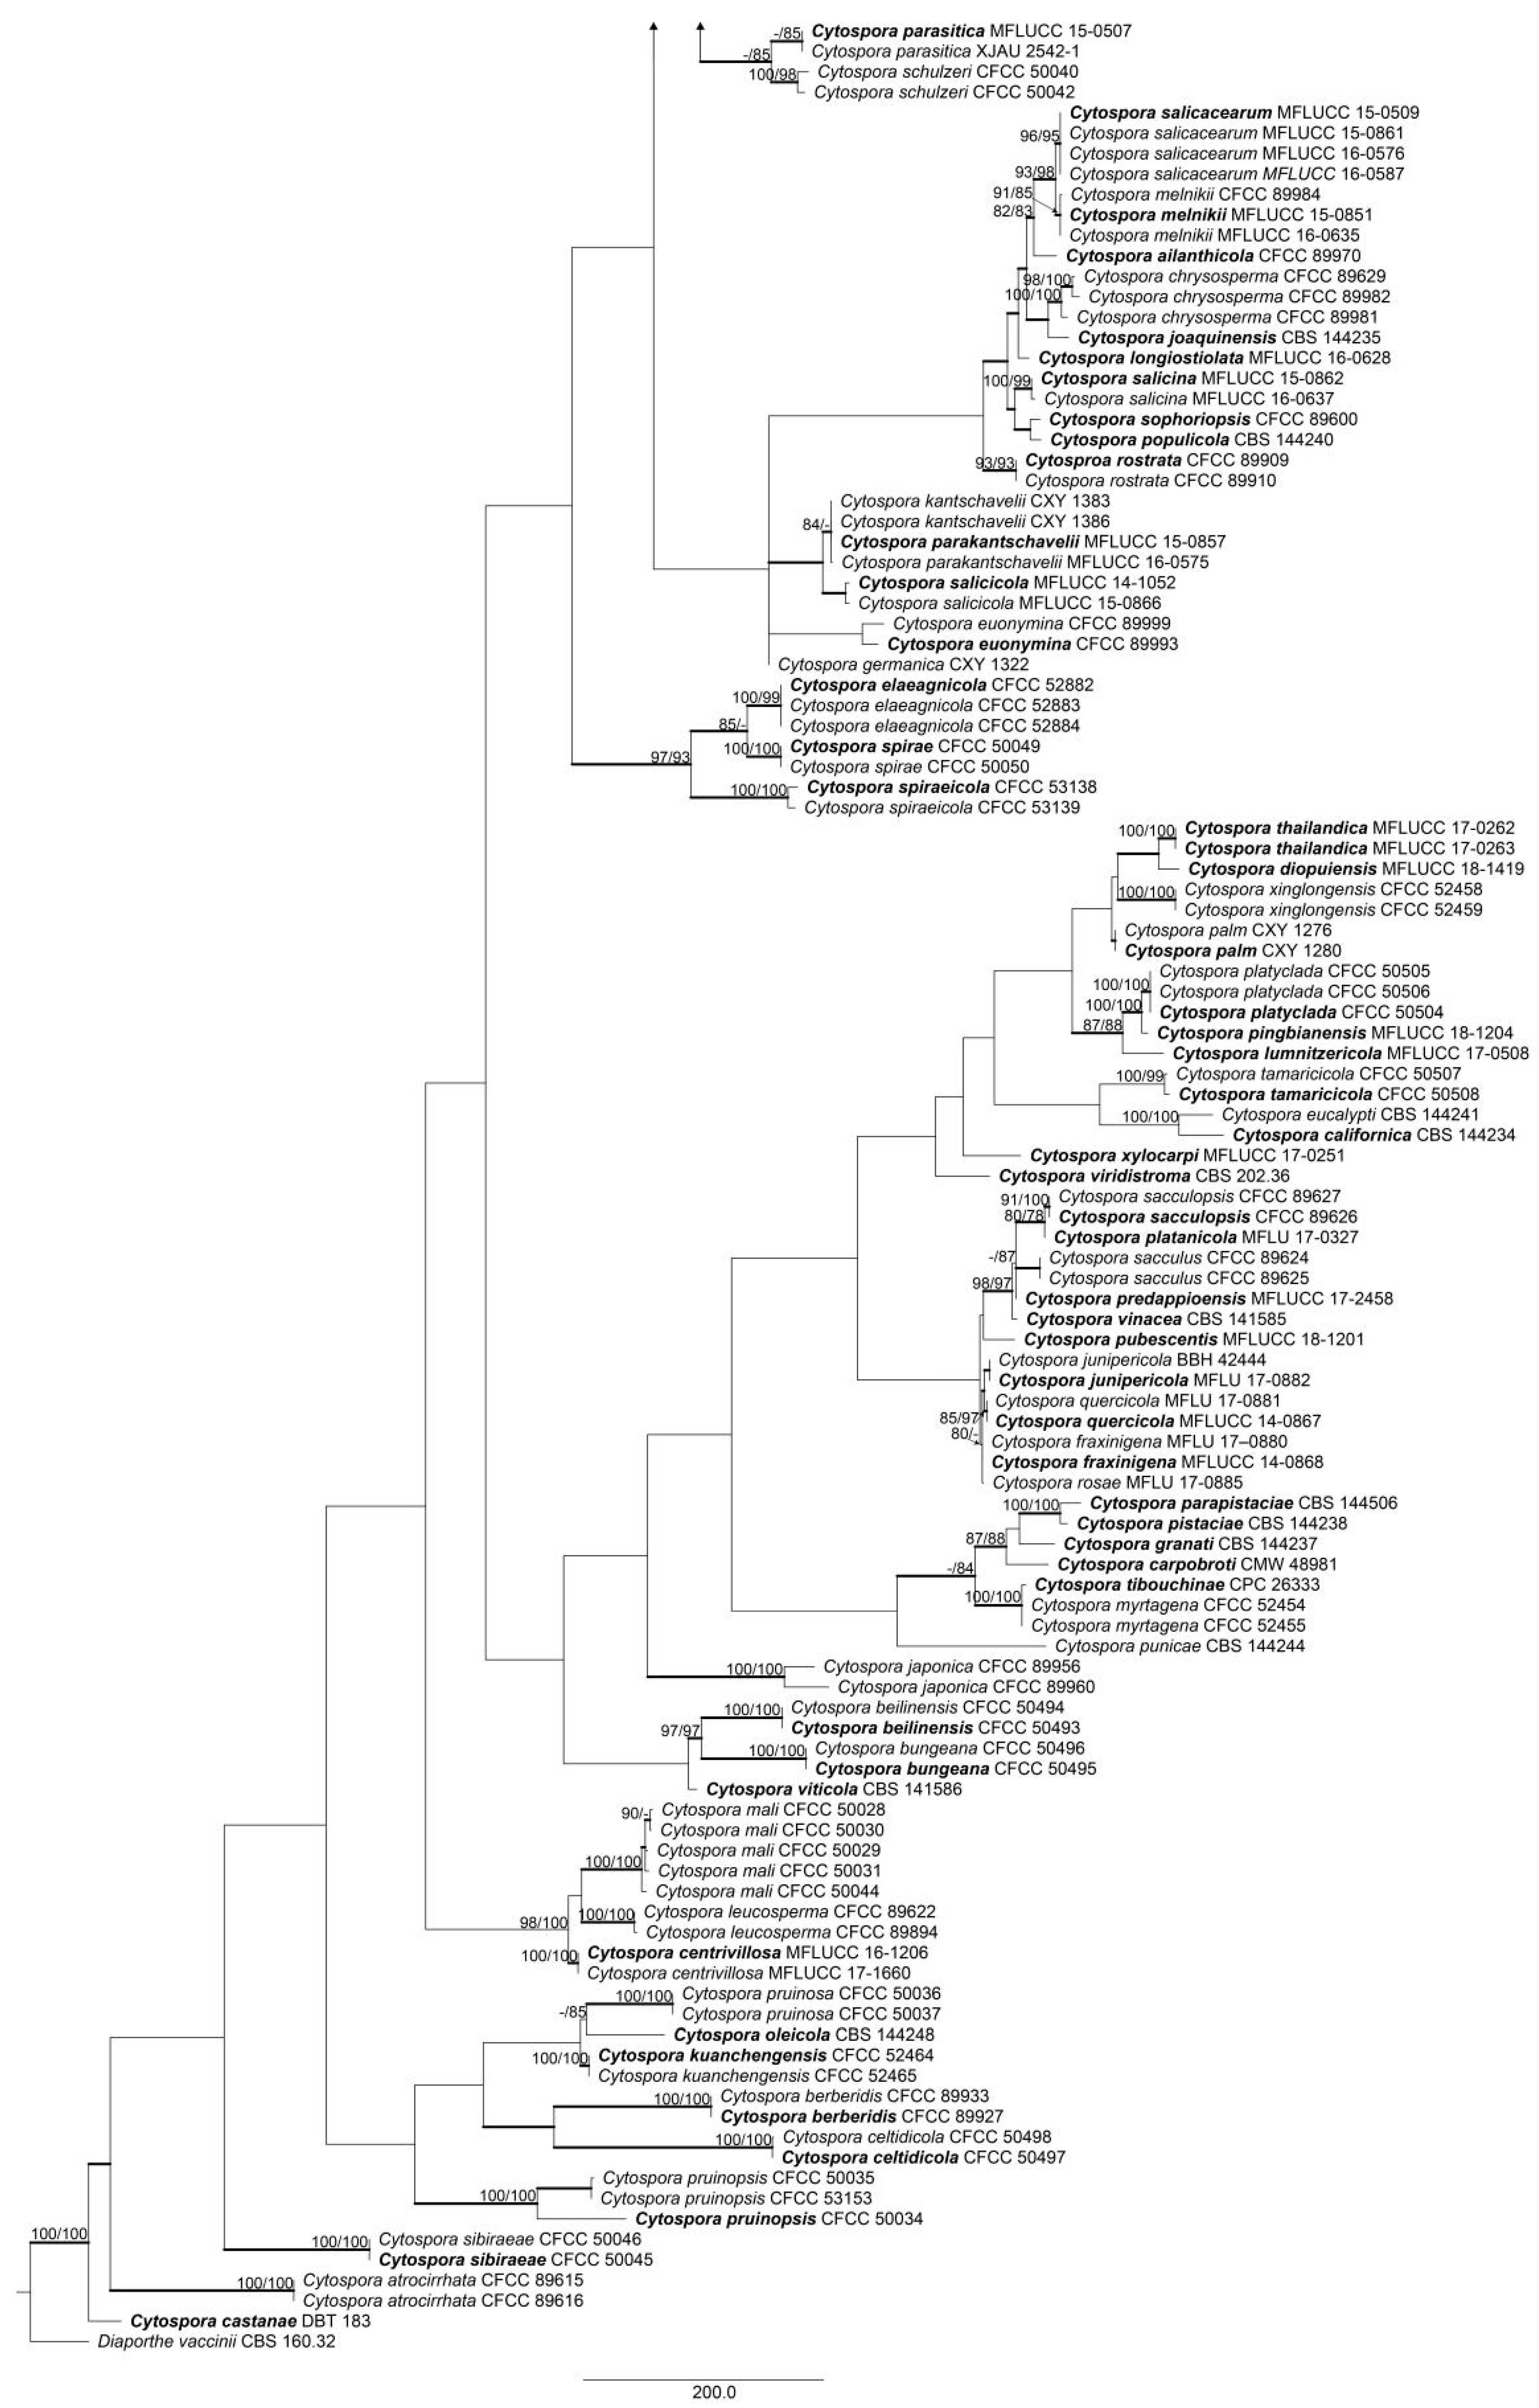
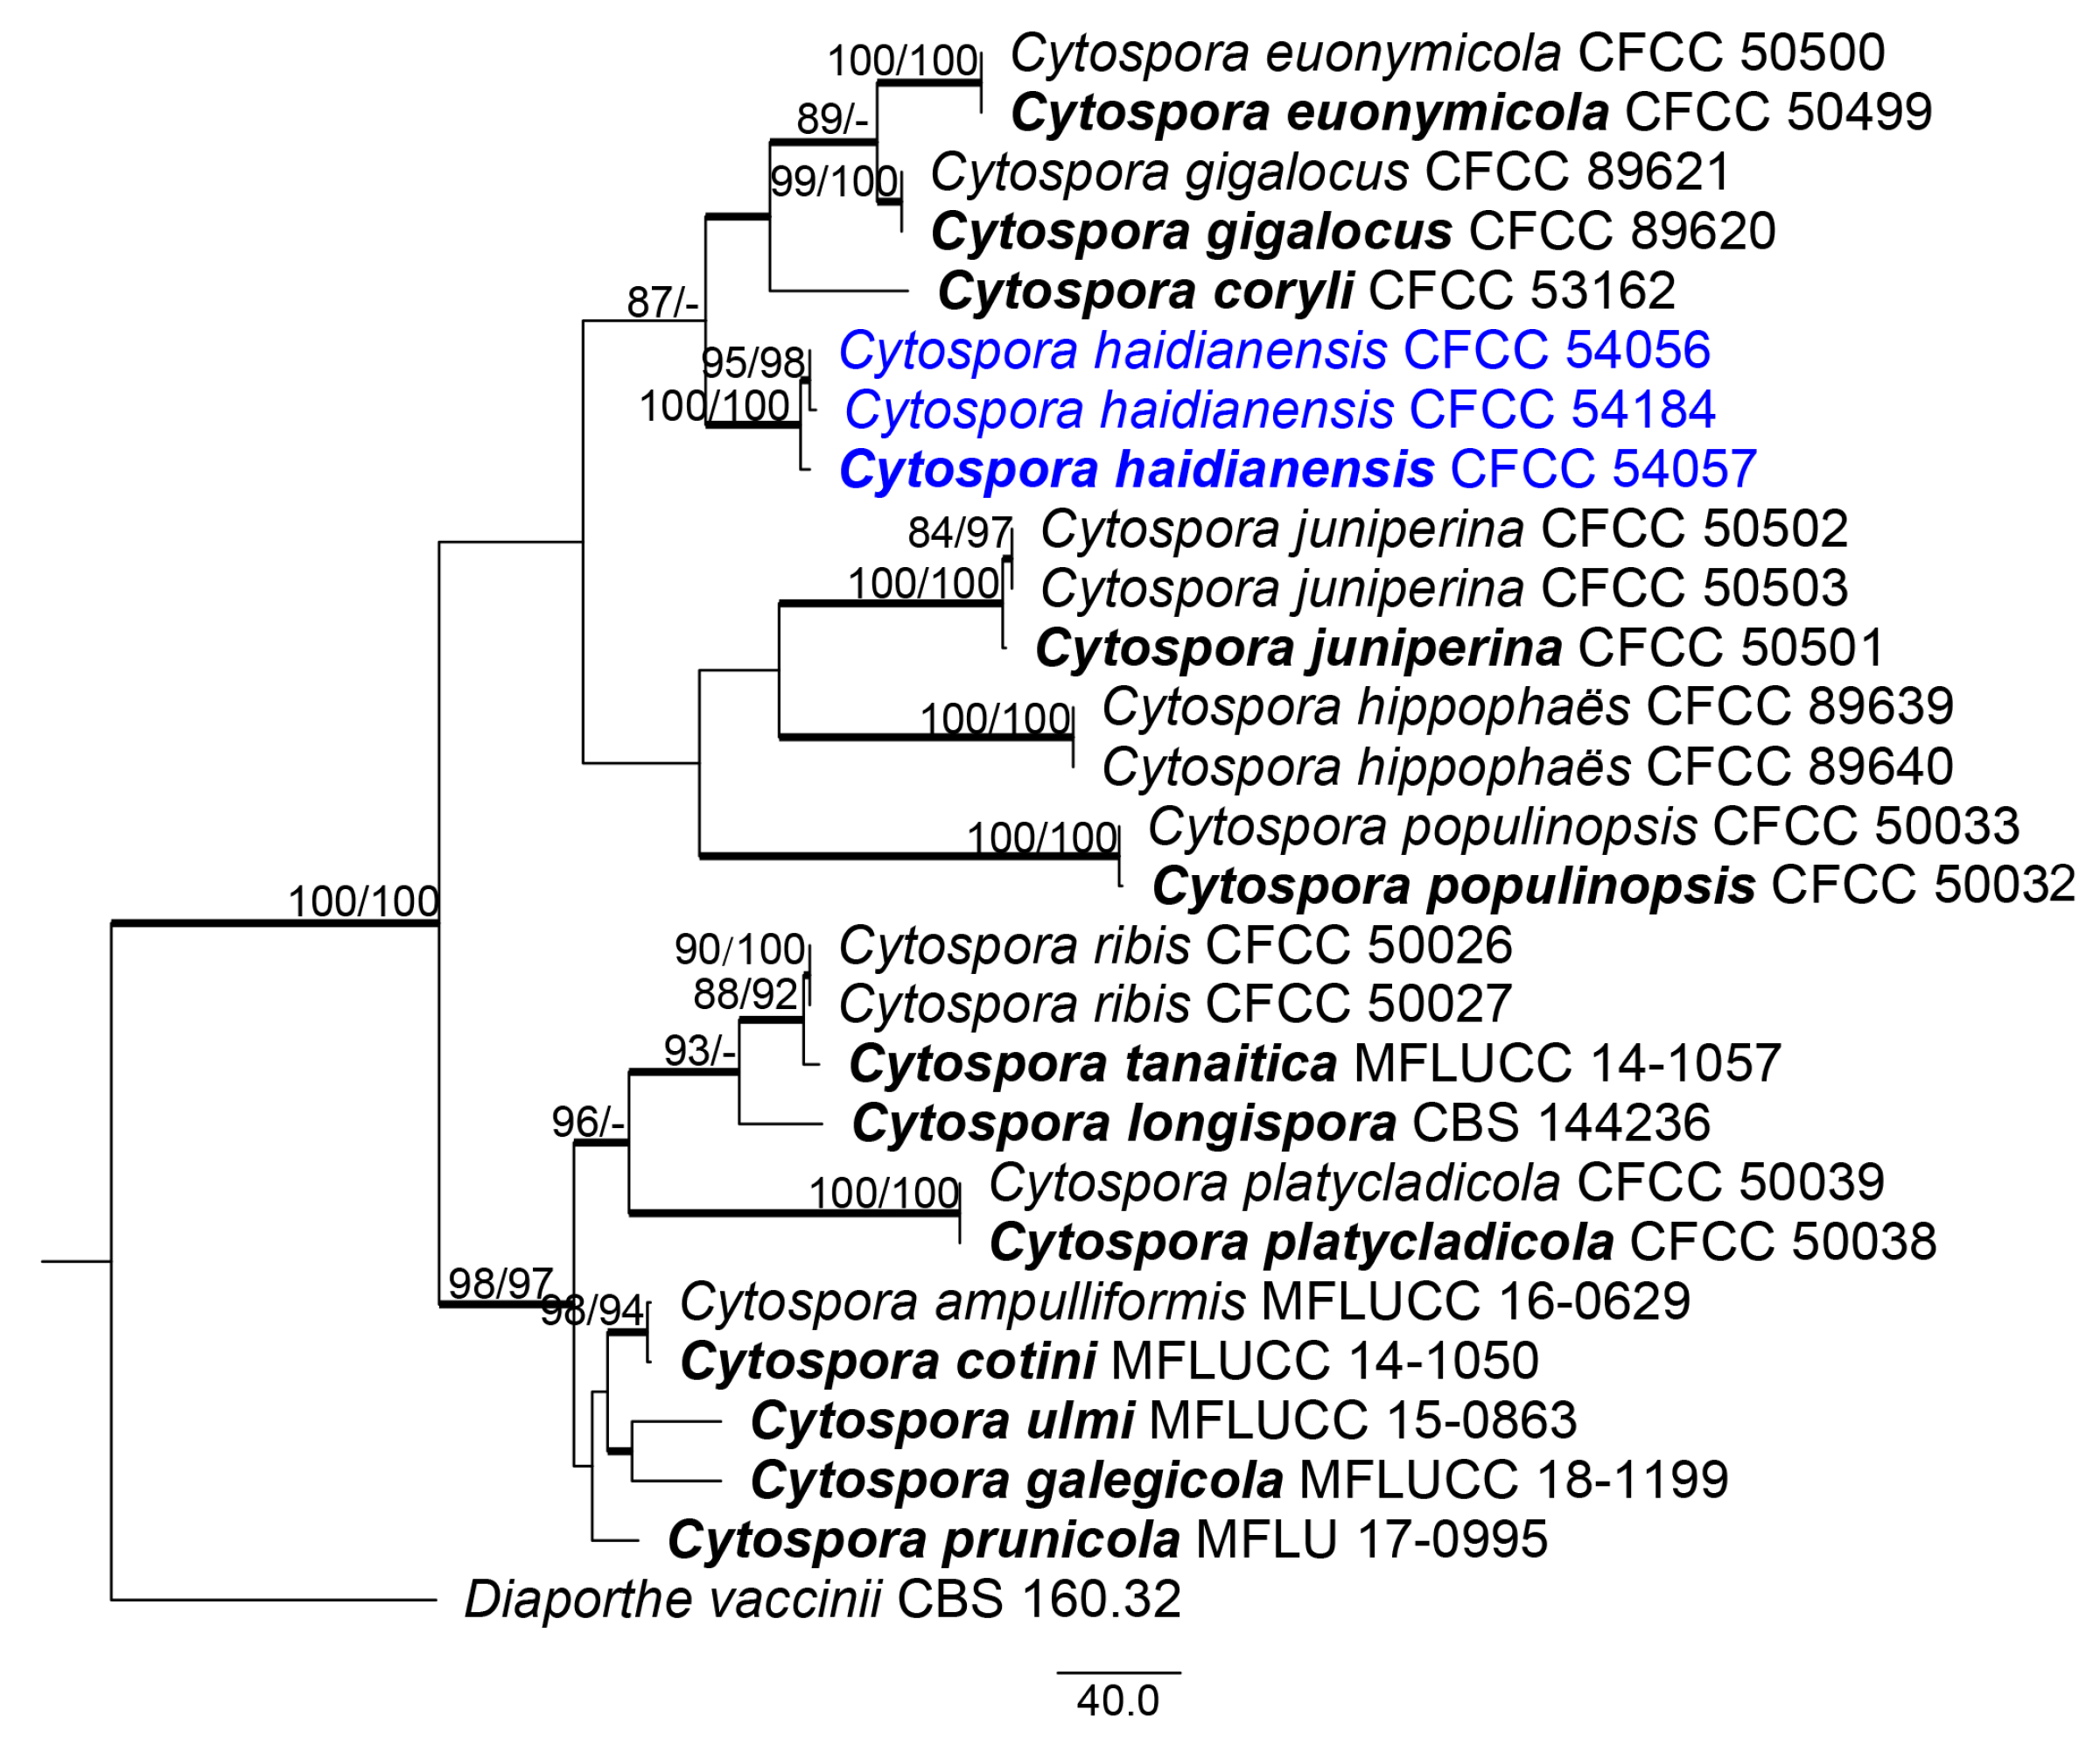
3.1. Phylogenetic Analyses
3.2. Taxonomy
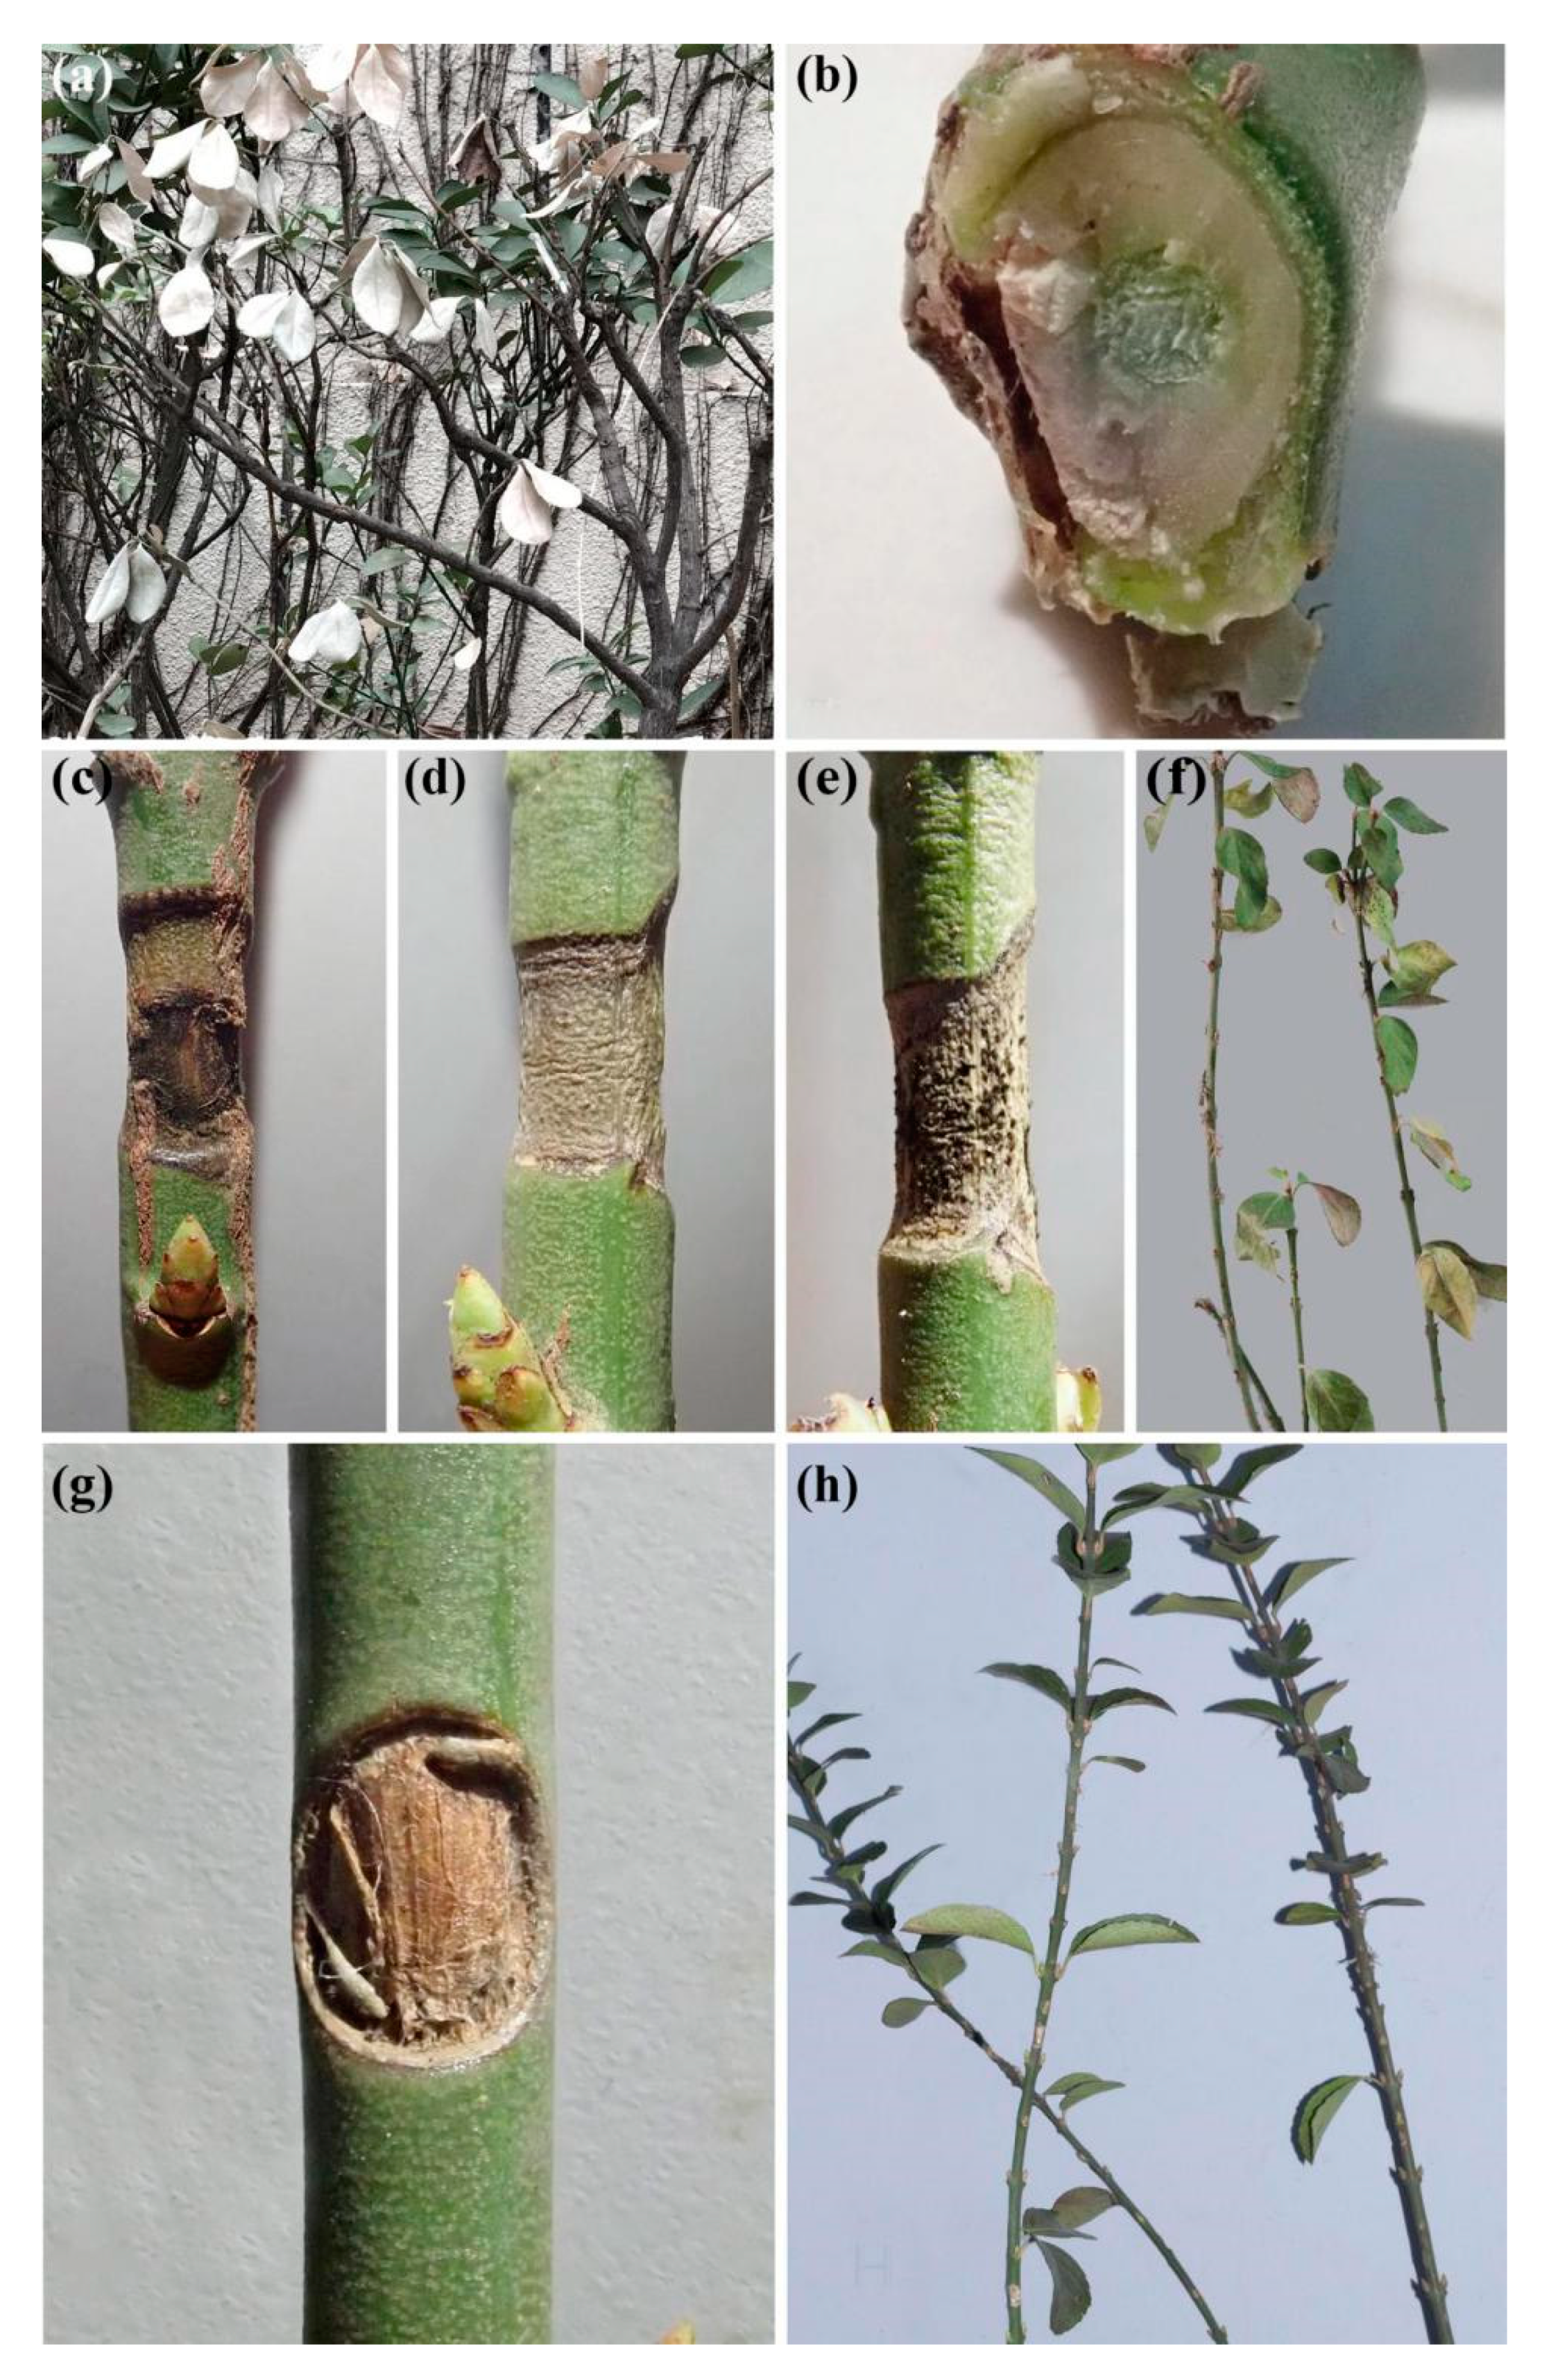
3.3. Pathogenicity Test
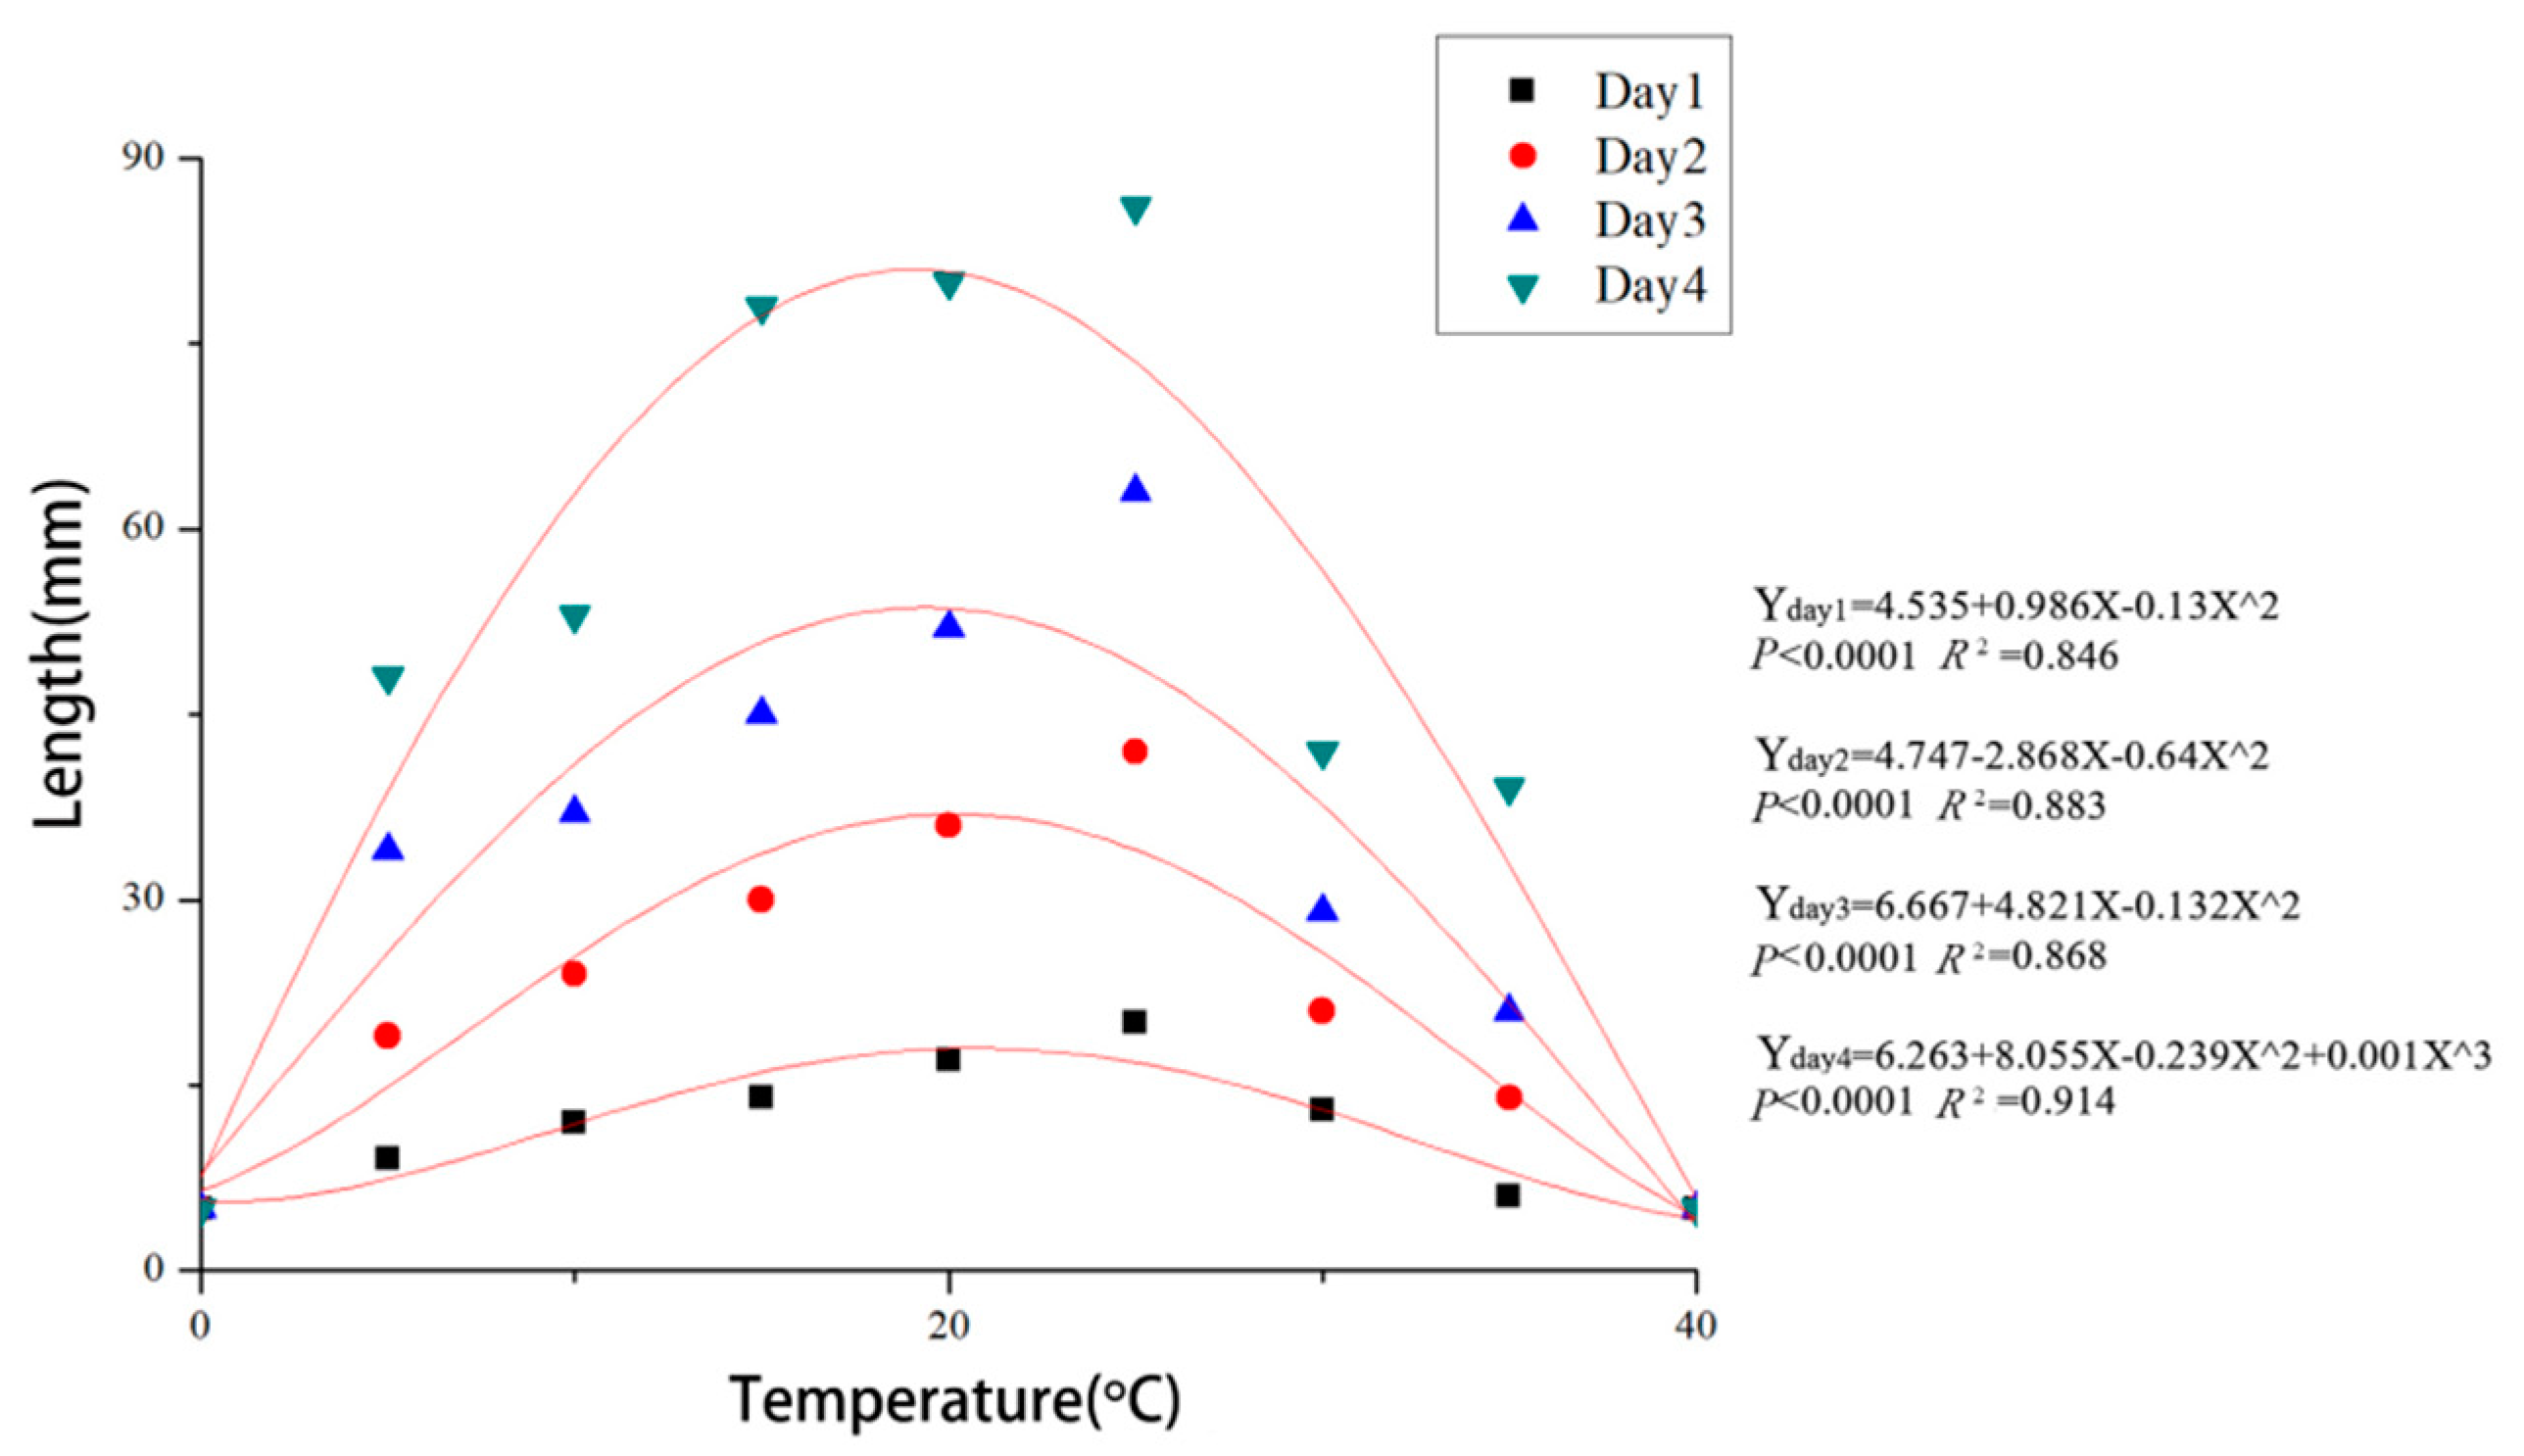
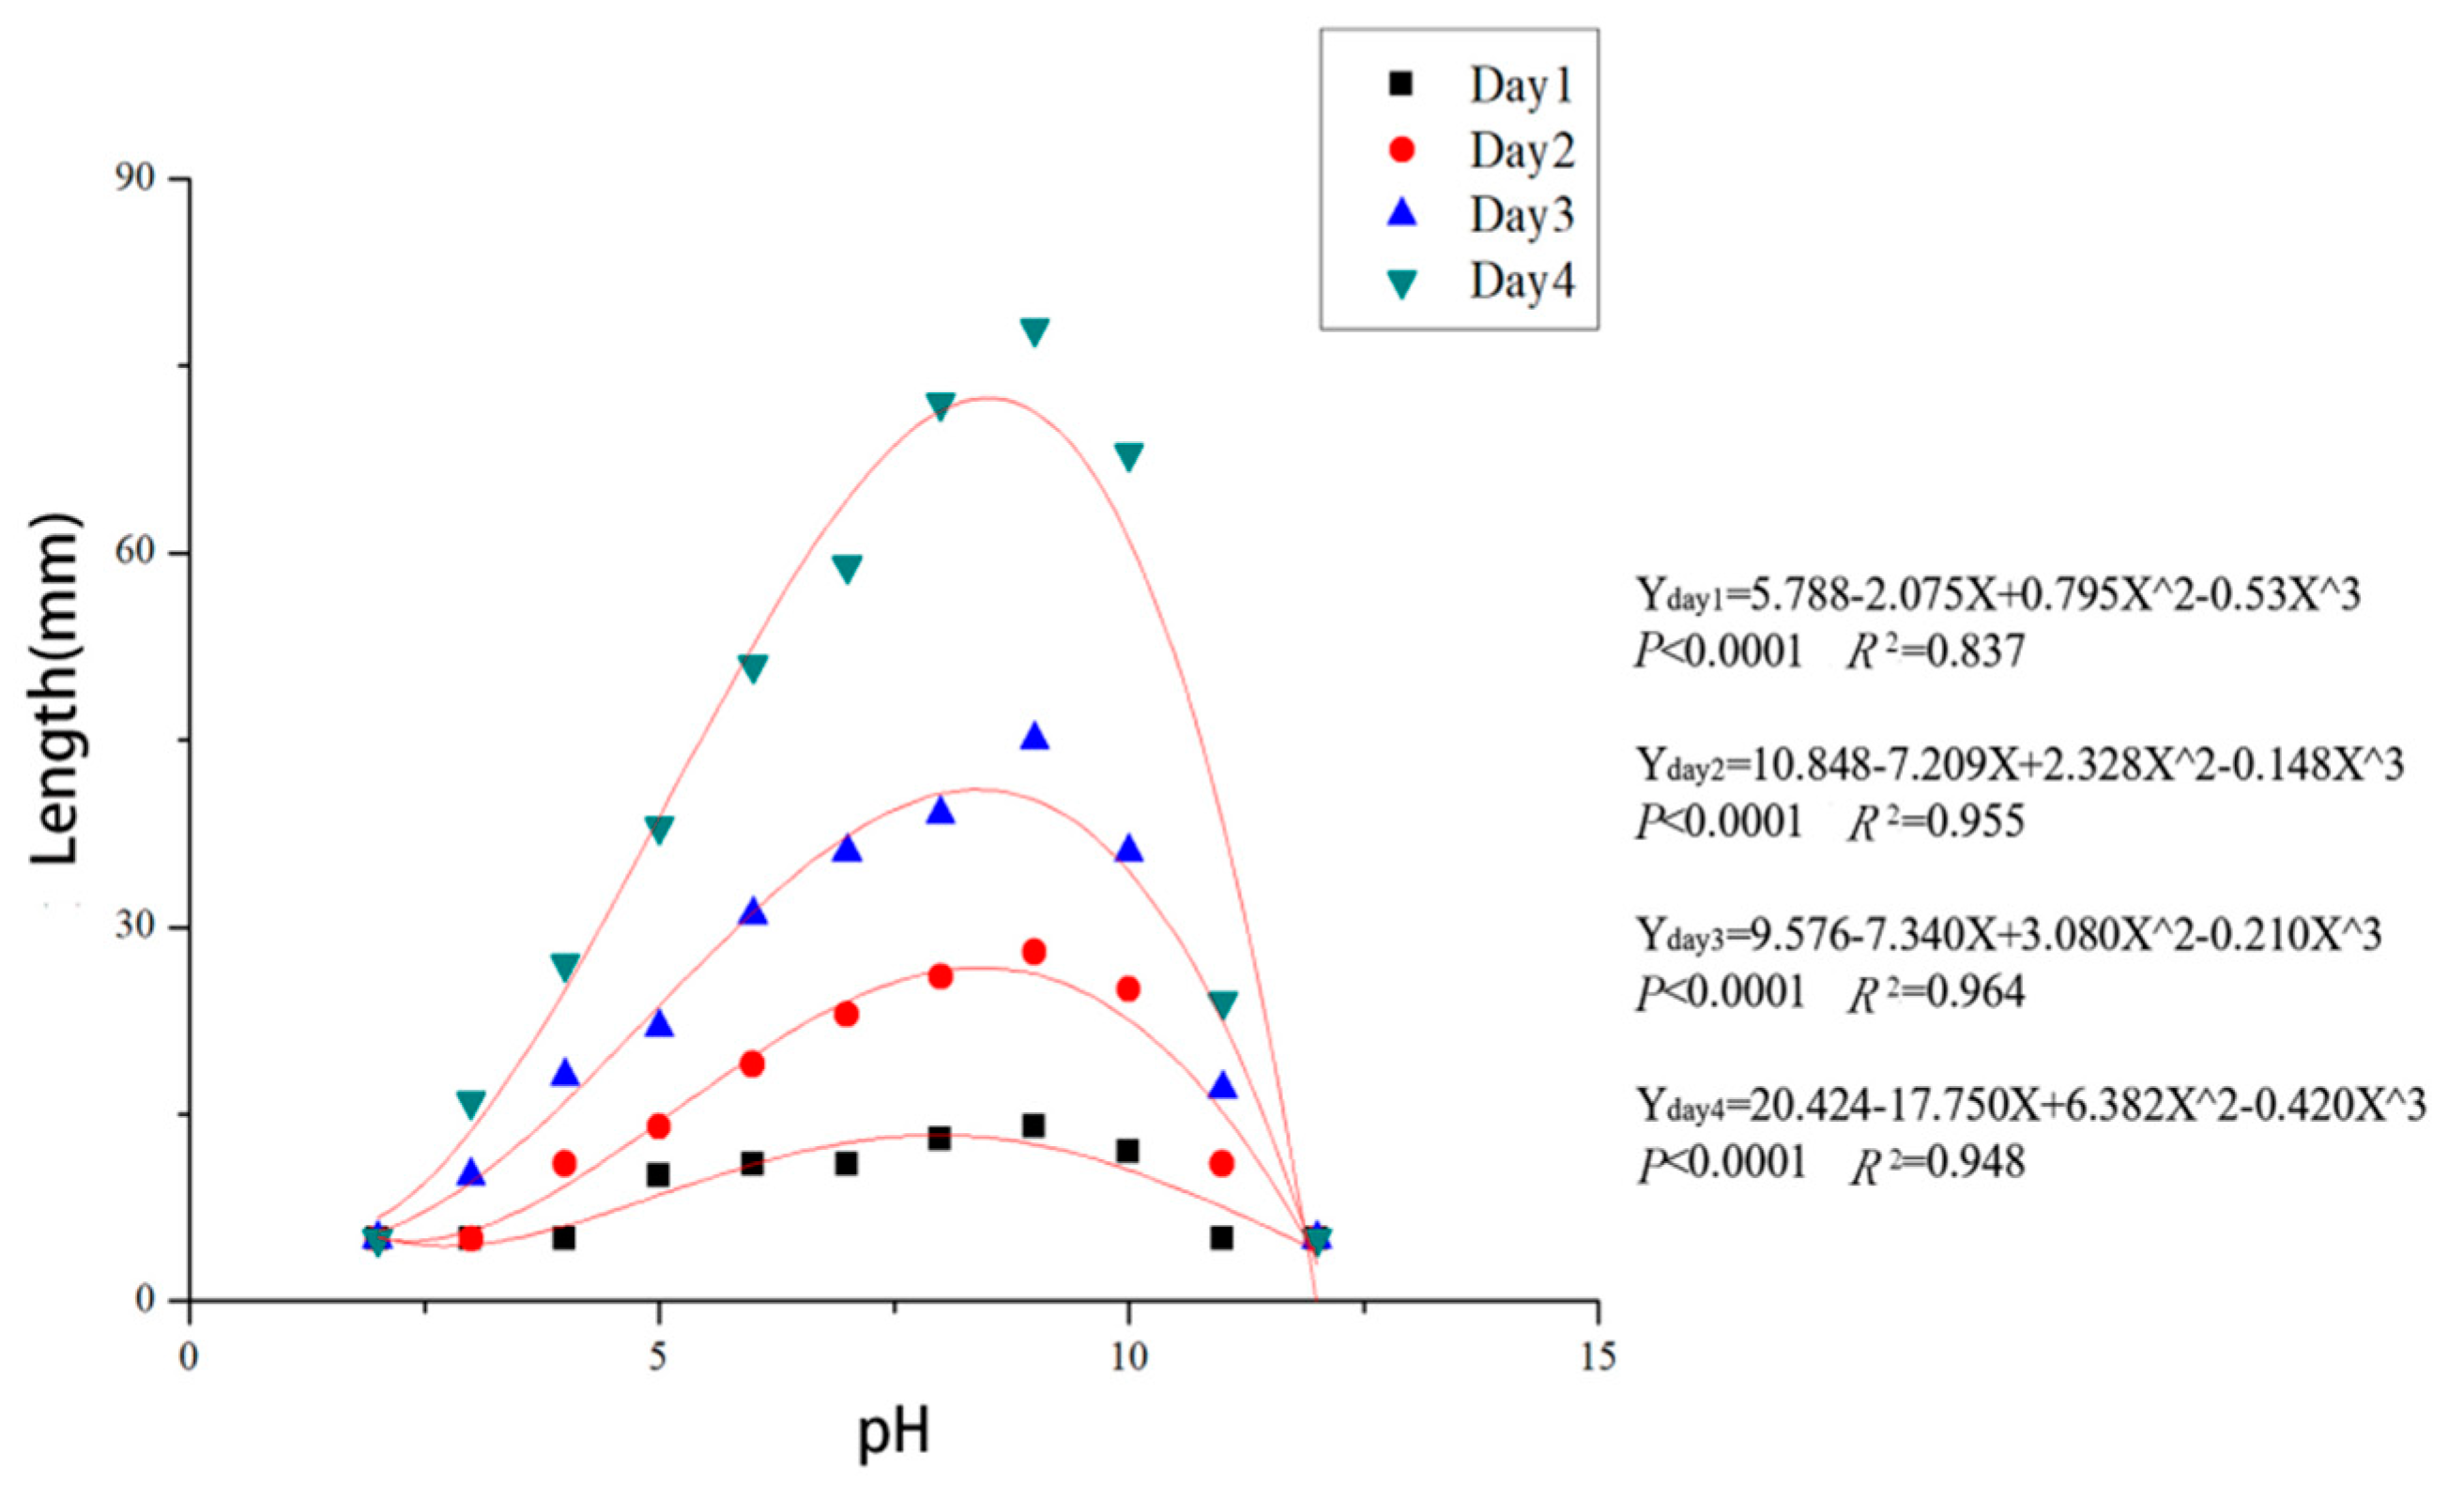
3.4. Effects of Temperature and pH on Mycelial Growth
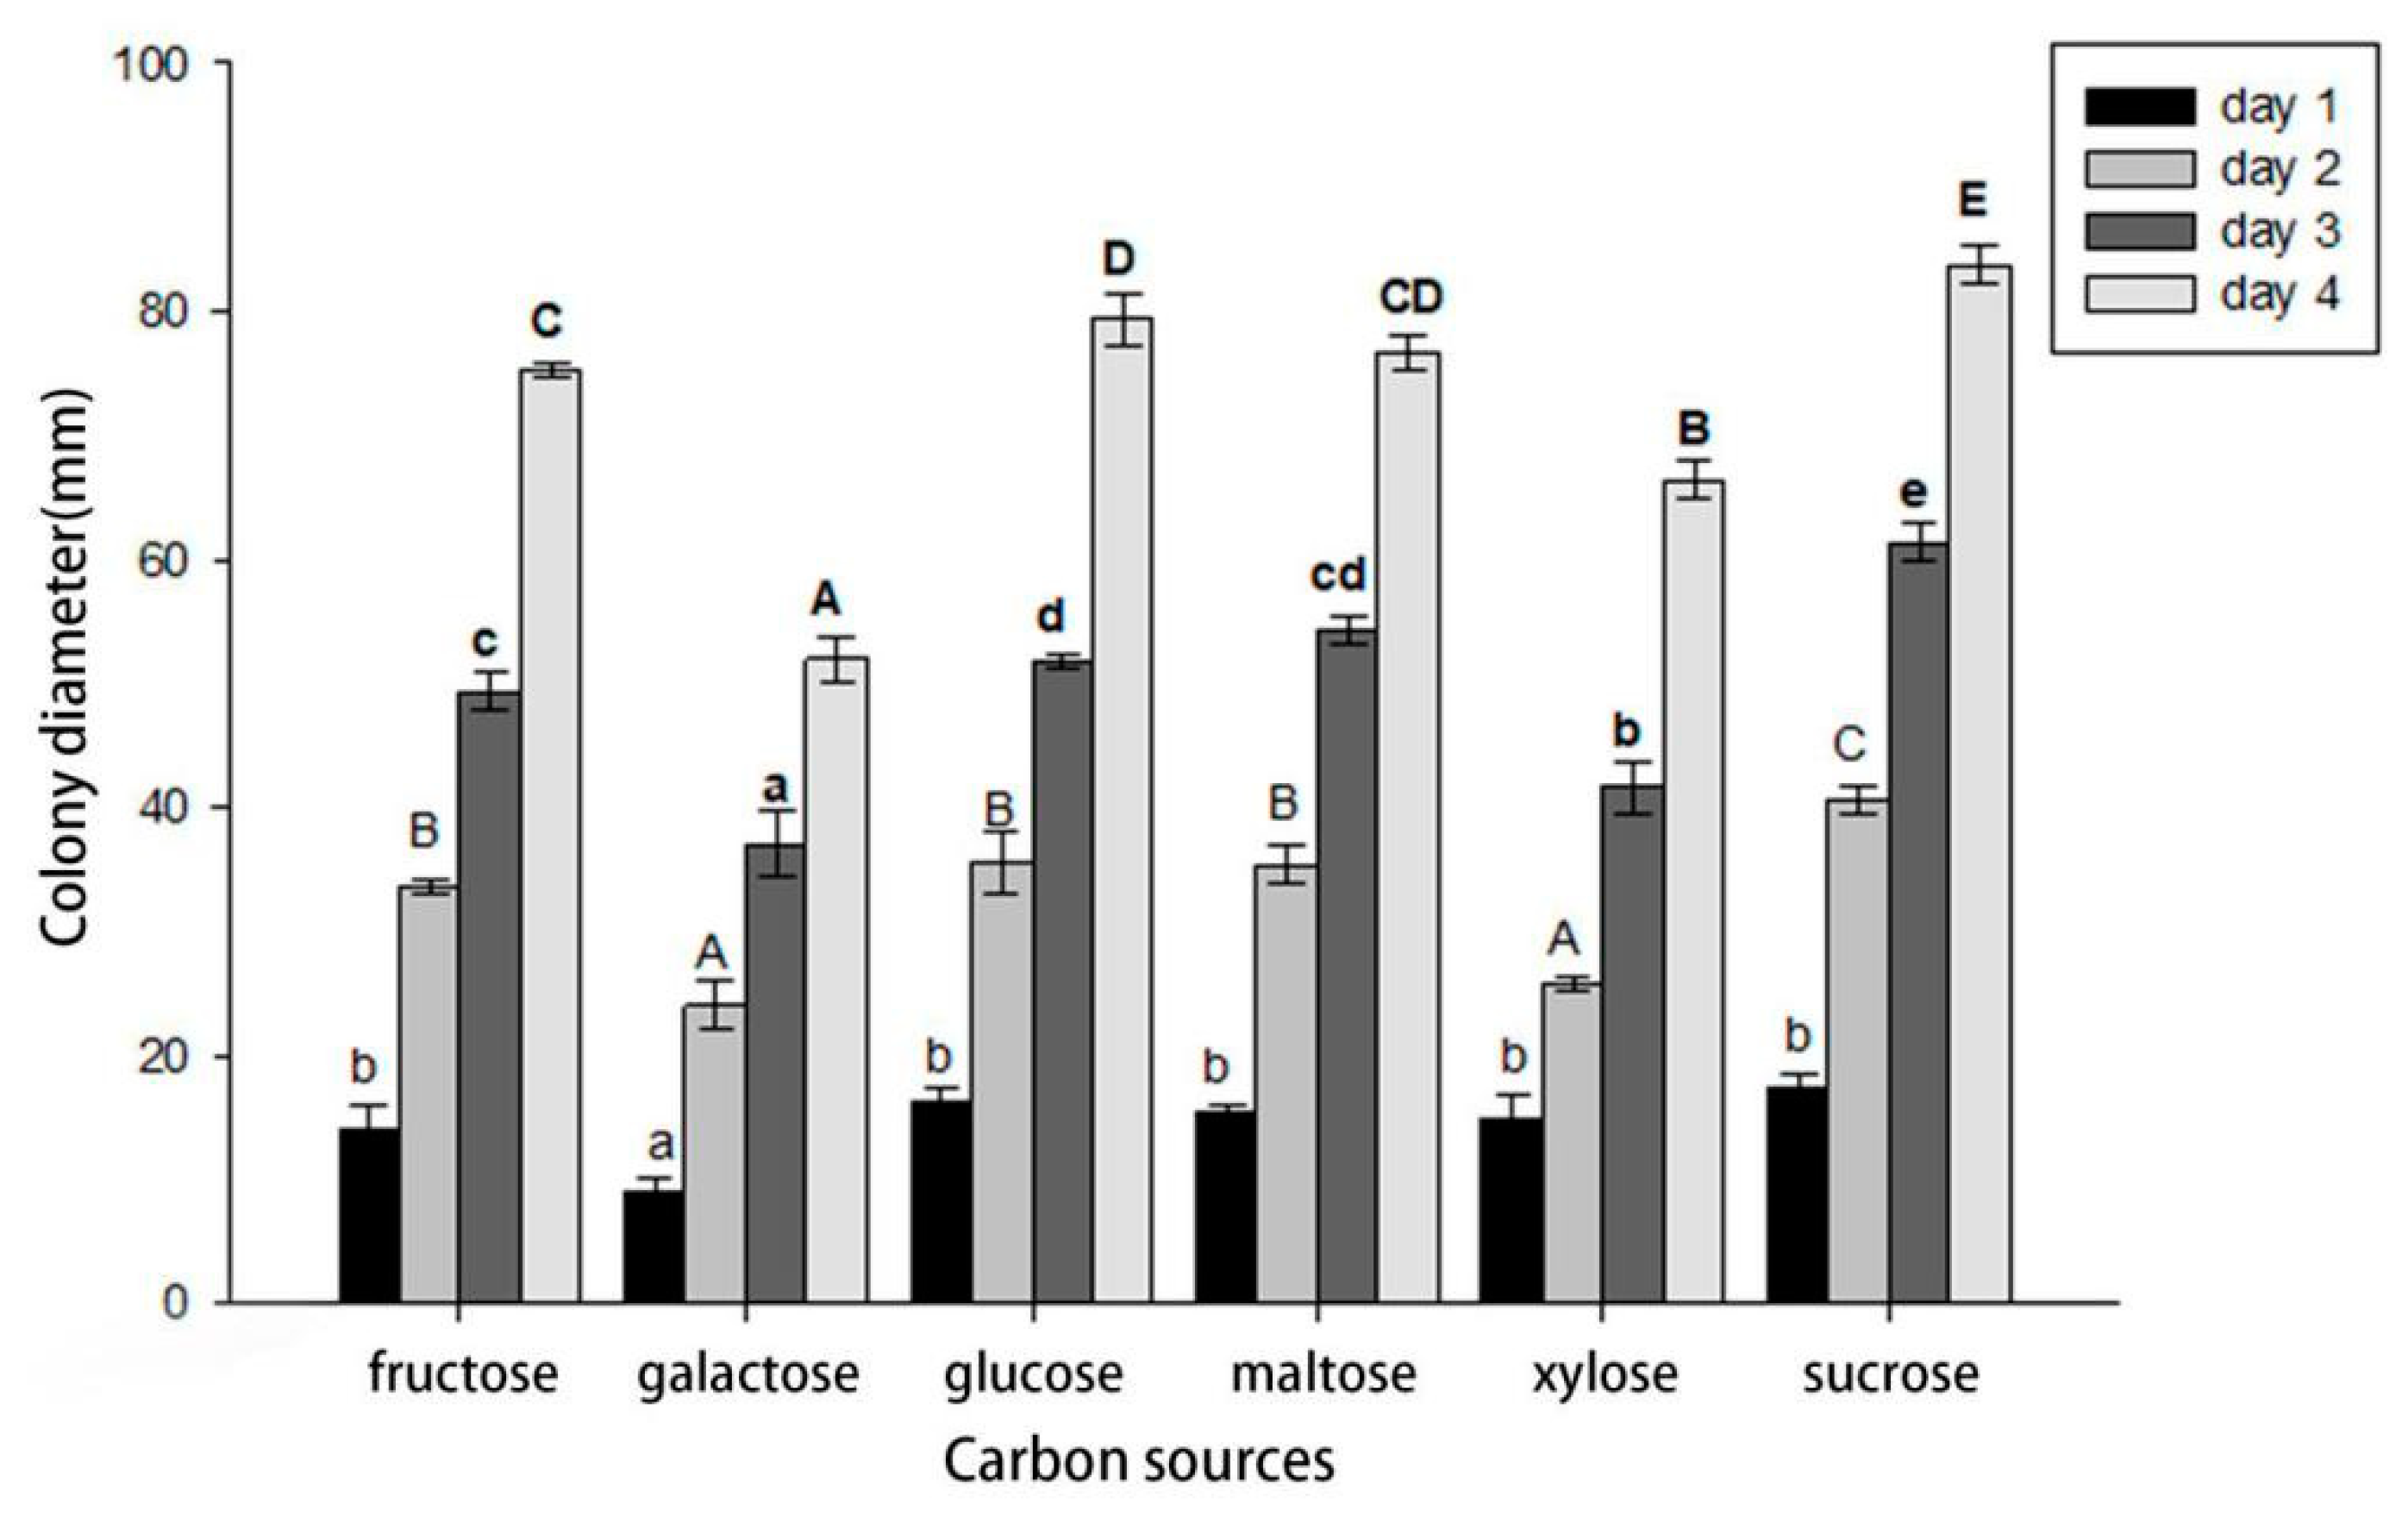
3.5. Effects of Carbon Sources on Mycelial Growth
4. Discussion
5. Conclusions
Author Contributions
Funding
Acknowledgments
Conflicts of Interest
References
- Dirr, M.A. Winged euonymus is a stalwart shrub for consistent fall color. Nurs. Manag. Prod. 2001, 17, 91–95. [Google Scholar]
- Olive, J.W.; Wick, R.L. Euonymus diseases. In Diseases of Woody Ornamentals and Trees in Nurseries; Jones, R.K., Benson, D.M., Eds.; APS Press: St. Paul, MN, USA, 2001. [Google Scholar]
- Fan, X.L.; Bezerra, J.D.P.; Tian, C.M.; Crous, P.W. Cytospora (Diaporthales) in China. Persoonia 2020, 45, 1–45. [Google Scholar] [CrossRef]
- Zhu, H.Y.; Pan, M.; Bezerra, J.D.P.; Tian, C.M.; Fan, X.L. Discovery of Cytospora species associated with canker disease of tree hosts from Mount Dongling of China. MycoKeys 2020, 68, 97–121. [Google Scholar] [CrossRef]
- Adams, G.C.; Wingfield, M.J.; Common, R.; Roux, J. Phylogenetic relationships and morphology of Cytospora species and related teleomorphs (Ascomycota, Diaporthales, Valsaceae) from Eucalyptus. Stud. Mycol. 2005, 52, 1–144. [Google Scholar]
- Adams, G.C.; Roux, J.; Wingfield, M.J. Cytospora species (Ascomycota, Diaporthales, Valsaceae), introduced and native pathogens of trees in South Africa. Australas. Plant Pathol. 2006, 35, 521–548. [Google Scholar] [CrossRef]
- Pan, M.; Zhu, H.Y.; Tian, C.M.; Alvarez, L.V.; Fan, X.L. Cytospora piceae sp. nov. associated with canker disease of Picea crassifolia in China. Phytotaxa 2018, 383, 181–196. [Google Scholar] [CrossRef]
- Palavouzis, S.C.; Tzamos, S.; Paplomatas, E.; Thomidis, T. First report of Cytospora punicae isolated from pomegranate plants with symptom of collar rot in northern Greece. J. Plant Pathol. 2015, 97, 209–220. [Google Scholar]
- Rayner, R.W. A Mycological Colour Chart; Commonwealth Mycological Institute: Kew, UK, 1970. [Google Scholar]
- Doyle, J.J.; Doyle, J.L. Isolation of plant DNA from fresh tissue. Focus 1990, 12, 13–15. [Google Scholar]
- Carbone, I.; Anderson, J.B.; Kohn, L.M. A method for designing primer sets for the speciation studies in filamentous ascomycetes. Mycologia 1999, 91, 553–556. [Google Scholar] [CrossRef]
- White, T.J.; Bruns, T.; Lee, S.; Taylor, J. Amplification and direct sequencing of fungal ribosomal RNA genes for phylogenetics. PCR Protoc. Guide Methods Appl. 1990, 18, 315–322. [Google Scholar]
- Liu, Y.J.; Whelen, S.; Hall, B.D. Phylogenetic relationships among ascomycetes: Evidence from an RNA polymerse II subunit. Mol. Biol. Evol. 1999, 16, 1799–1808. [Google Scholar] [CrossRef]
- Alves, A.; Crous, P.W.; Correia, A.; Phillips, A.J.L. Morphological and molecular data reveal cryptic speciation in Lasiodiplodia theobromae. Fungal Divers. 2008, 28, 1–13. [Google Scholar]
- Glass, N.L.; Donaldson, G.C. Development of primer sets designed for use with the PCR to amplify conserved genes from filamentous ascomycetes. Appl. Environ. Microbiol. 1995, 61, 1323–1330. [Google Scholar] [CrossRef]
- Katoh, K.; Standley, D.M. MAFFT multiple sequence alignment software version 7: Improvements in performance and usability. Mol. Biol. Evol. 2013, 30, 772–780. [Google Scholar] [CrossRef]
- Tamura, K.; Stecher, G.; Peterson, D.; Filipski, A.; Kumar, S. MEGA6: Molecular evolutionary genetics analysis version 6.0. Mol. Biol. Evol. 2013, 30, 2725–2729. [Google Scholar] [CrossRef]
- Zhu, H.Y.; Tian, C.M.; Fan, X.L. Multigene phylogeny and morphology reveal Cytospora spiraeae sp. nov. (Diaporthales, Ascomycota) in China. Phytotaxa 2018, 338, 49–62. [Google Scholar] [CrossRef]
- Fan, X.L.; Liang, Y.M.; Ma, R.; Tian, C.M. Morphological and phylogenetic studies of Cytospora (Valsaceae, Diaporthales) isolates from Chinese scholar tree, with description of a new species. Mycoscience 2014, 55, 252–259. [Google Scholar] [CrossRef]
- Fan, X.L.; Tian, C.M.; Yang, Q.; Liang, Y.M.; You, C.J.; Zhang, Y.B. Cytospora from Salix in northern China. Mycotaxon 2014, 129, 303–315. [Google Scholar] [CrossRef]
- Fan, X.L.; Hyde, K.D.; Liu, M.; Liang, Y.M.; Tian, C.M. Cytospora species associated with walnut canker disease in China, with description of a new species C. gigalocus. Fungal Biol. 2015, 119, 310–319. [Google Scholar] [CrossRef]
- Fan, X.L.; Hyde, K.D.; Yang, Q.; Liang, Y.M.; Ma, R.; Tian, C.M. Cytospora species associated with canker disease of three anti-desertification plants in northwestern China. Phytotaxa 2015, 197, 227–244. [Google Scholar] [CrossRef]
- Lawrence, D.P.; Holland, L.A.; Nouri, M.T.; Travadon, R.; Abramians, A.; Michailides, T.J.; Trouillas, F.P. Molecular phylogeny of Cytospora species associated with canker diseases of fruit and nut crops in California, with the descriptions of ten new species and one new combination. IMA Fungus 2018, 9, 333–370. [Google Scholar] [CrossRef]
- Lawrence, D.P.; Travadon, R.; Pouzoulet, J.; Rolshausen, P.E.; Wilcox, W.F.; Baumgartner, K. Characterization of Cytospora isolates from wood cankers of declining grapevine in North America, with the descriptions of two new Cytospora species. Plant Pathol. 2017, 66, 713–725. [Google Scholar] [CrossRef]
- Swofford, D.L. PAUP*: Phylogenetic Analysis Using Parsimony. (*and Other Methods), Version 4.0b10; Sinauer Associates: Sunderland, MA, USA, 2003. [Google Scholar]
- Ronquist, F.; Huelsenbeck, J.P. MrBayes 3: Bayesian phylogenetic inference under mixed models. Bioinformatics 2003, 19, 1572–1574. [Google Scholar] [CrossRef]
- Stamatakis, A. RAxML version 8: A tool for phylogenetic analysis and post-analysis of large phylogenies. Bioinformatics 2014, 30, 1312–1313. [Google Scholar] [CrossRef]
- Hillis, D.M.; Bull, J.J. An empirical test of bootstrapping as a method for assessing confidence in phylogenetic analysis. Syst. Biol. 1993, 42, 182–192. [Google Scholar] [CrossRef]
- Rannala, B.; Yang, Z. Probability distribution of molecular evolutionary trees: A new method of phylogenetic inference. J. Mol. Evol. 1996, 43, 304–311. [Google Scholar] [CrossRef]
- Posada, D.; Crandall, K.A. Modeltest: Testing the model of DNA substitution. Bioinformatics 1998, 14, 817–818. [Google Scholar] [CrossRef]
- Rambaut, A.; Drummond, A. FigTree v.1.3.1. Institute of Evolutionary Biology; University of Edinburgh: Edinburgh, UK, 2010. [Google Scholar]
- Xu, C.N.; Zhang, H.J.; Zhou, Z.S.; Hu, T.; Wang, S.T.; Wang, Y.N.; Cao, K.Q. Identification and distribution of Botryosphaeriaceae species associated with blueberry stem blight in China. Eur. J. Plant Pathol. 2015, 143, 737–752. [Google Scholar] [CrossRef]
- Zhao, L.; Wang, Y.; He, W.; Zhang, Y. Stem blight of blueberry caused by Lasiodiplodia vaccinii sp. nov. in China. Plant Dis. 2019, 103, 2041–2050. [Google Scholar] [CrossRef]
- Strausbaugh, C.A.; Dugan, F. A novel Penicillium sp. causes rot in stored sugar beet roots in Idaho. Plant Dis. 2017, 101, 1781–1787. [Google Scholar] [CrossRef]
- Elfar, K.; Torres, R.; Díaz, G.A.; Latorre, B.A. Characterization of Diaporthe australafricana and Diaporthe spp. associated with stem canker of blueberry in Chile. Plant Dis. 2013, 97, 1042–1050. [Google Scholar] [CrossRef]
- Xu, C.N. Etiology, Molecular Detection and Control of Blueberry Stem Blight in China. Ph.D. Thesis, Hebei Agricultural University, Baoding, Hebei, China, 2016. [Google Scholar]
- Lin, Z.Y.; Wei, J.J.; Zhang, M.Q.; Xu, S.Q.; Guo, Q.; Wang, X.; Wang, J.H.; Chen, B.S.; Que, Y.X.; Deng, Z.H.; et al. Identification and characterization of a new fungal pathogen causing twisted leaf disease of sugarcane in China. Plant Dis. 2015, 99, 325–332. [Google Scholar] [CrossRef]
- Spaulding, P. Disease of Foreign Forest Trees Growing in the United States; Department of Agriculture: Washington, DC, USA, 1958.


| Species | Strain1 | Host | Origin | GenBank Accession Numbers | ||||
|---|---|---|---|---|---|---|---|---|
| ACT | ITS | RPB2 | TEF1-α | TUB2 | ||||
| Cytospora ailanthicola | CFCC 89970T | Ailanthus altissima | China | MH933526 | MH933618 | MH933592 | MH933494 | MH933565 |
| Cytospora leucosperma | CFCC 89622 | Pyrus bretschneideri | China | KU710988 | KR045616 | KU710944 | KU710911 | KR045657 |
| CFCC 89894 | Pyrus bretschneideri | China | KU710989 | KR045617 | KU710945 | KU710912 | KR045658 | |
| Cytospora ampulliformis | MFLUCC 16-0583T | Sorbus intermedia | Russia | KY417692 | KY417726 | KY417794 | NA | NA |
| MFLUCC 16-0629 | Acer platanoides | Russia | KY417693 | KY417727 | KY417795 | NA | NA | |
| Cytospora amygdali | CBS 144233T | Prunus dulcis | USA | MG972002 | MG971853 | NA | MG971659 | MG971718 |
| Cytospora atrocirrhata | CFCC 89615 | Juglans regia | China | KF498673 | KR045618 | KU710946 | KP310858 | KR045659 |
| CFCC 89616 | Juglans regia | China | KF498674 | KR045619 | KU710947 | KP310859 | KR045660 | |
| Cytospora beilinensis | CFCC 50493T | Pinus armandii | China | MH933527 | MH933619 | NA | MH933495 | MH933561 |
| CFCC 50494 | Pinus armandii | China | MH933528 | MH933620 | NA | MH933496 | MH933562 | |
| Cytospora berberidis | CFCC 89927T | Berberis dasystachya | China | KU710990 | KR045620 | KU710948 | KU710913 | KR045661 |
| CFCC 89933 | Berberis dasystachya | China | KU710991 | KR045621 | KU710949 | KU710914 | KR045662 | |
| Cytospora bungeana | CFCC 50495T | Pinus bungeana | China | MH933529 | MH933621 | MH933593 | MH933497 | MH933563 |
| CFCC 50496 | Pinus bungeana | China | MH933530 | MH933622 | MH933594 | MH933498 | MH933564 | |
| Cytospora californica | CBS 144234T | Juglans regia | USA | MG972083 | MG971935 | NA | MG971645 | NA |
| Cytospora carbonacea | CFCC 89947 | Ulmus pumila | China | KP310842 | KR045622 | KU710950 | KP310855 | KP310825 |
| Cytospora carpobroti | CMW 48981T | Carpobrotus edulis | South Africa | NA | MH382812 | NA | MH411212 | MH411207 |
| Cytosporacastanae | DBT 183T | Castanea sativa | North India | NA | KC963921 | NA | NA | NA |
| Cytospora celtidicola | CFCC 50497T | Celtis sinensis | China | MH933531 | MH933623 | MH933595 | MH933499 | MH933566 |
| CFCC 50498 | Celtis sinensis | China | MH933532 | MH933624 | MH933596 | MH933500 | MH933567 | |
| Cytospora centrivillosa | MFLUCC 16-1206T | Sorbus domestica | Italy | NA | MF190122 | MF377600 | NA | NA |
| MFLUCC 17-1660 | Sorbus domestica | Italy | NA | MF190123 | MF377601 | NA | NA | |
| Cytospora ceratosperma | CFCC 89624 | Juglans regia | China | NA | KR045645 | KU710976 | KP310860 | KR045686 |
| CFCC 89625 | Juglans regia | China | NA | KR045646 | KU710977 | KP31086 | KR045687 | |
| Cytospora ceratospermopsis | CFCC 89626T | Juglans regia | China | KU711011 | KR045647 | KU710978 | KU710934 | KR045688 |
| CFCC 89627 | Juglans regia | China | KU711012 | KR045648 | KU710979 | KU710935 | KR045689 | |
| Cytospora chrysosperma | CFCC 89629 | Salix psammophila | China | NA | KF765673 | KF765705 | NA | NA |
| CFCC 89981 | Populus alba subsp. pyramidalis | China | MH933533 | MH933625 | MH933597 | MH933501 | MH933568 | |
| CFCC 89982 | Ulmus pumila | China | KP310835 | KP281261 | NA | KP310848 | KP310818 | |
| Cytosporacoryli | CFCC 53162T | Corylus mandshurica | China | NA | MN854450 | MN850751 | MN850758 | MN861120 |
| Cytospora cotini | MFLUCC 14-1050T | Cotinus coggygria | Russia | NA | KX430142 | KX430144 | NA | NA |
| Cytospora curvata | MFLUCC 15-0865T | Salix alba | Russia | KY417694 | KY417728 | KY417796 | NA | NA |
| Cytospora davidiana | CXY 1350T | Populus davidiana | China | NA | KM034870 | NA | NA | NA |
| CXY 1374 | Populus davidiana | China | NA | KM034869 | NA | NA | NA | |
| Cytosporadiopuiensis | MFLUCC 18-1419T | Undefined wood | Thailand | MN685819 | MK912137 | NA | NA | NA |
| Cytosporaleucostoma | MFLUCC 15-0864 | Crataegus monogyna | Ukraine | KY417729 | KY417729 | KY41769 | KY417797 | NA |
| Cytospora elaeagni | CFCC 89632 | Elaeagnus angustifolia | China | KU710995 | KR045626 | KU710955 | KU710918 | KR045667 |
| CFCC 89633 | Elaeagnus angustifolia | China | KU710996 | KF765677 | KU710956 | KU710919 | KR045668 | |
| Cytospora elaeagnicola | CFCC 52882T | Elaeagnus angustifolia | China | MK732344 | MK732341 | MK732347 | NA | NA |
| CFCC 52883 | Elaeagnus angustifolia | China | MK732345 | MK732342 | MK732348 | NA | NA | |
| CFCC 52884 | Elaeagnus angustifolia | China | MK732346 | MK732343 | MK732349 | NA | NA | |
| Cytospora erumpens | CFCC 50022 | Prunus padus | China | MH933534 | MH933627 | NA | MH933502 | MH933569 |
| MFLUCC 16-0580T | Salix × fragilis | Russia | KY417699 | KY417733 | KY417801 | NA | NA | |
| Cytospora eucalypti | CBS 144241 | Eucalyptus globulus | USA | MG972056 | MG971907 | NA | MG971617 | MG971772 |
| Cytospora euonymicola | CFCC 50499T | Euonymus kiautschovicus | China | MH933535 | MH933628 | MH933598 | MH933503 | MH933570 |
| CFCC 50500 | Euonymus kiautschovicus | China | MH933536 | MH933629 | MH933599 | MH933504 | MH933571 | |
| Cytospora euonymina | CFCC 89993T | Euonymus kiautschovicus | China | MH933537 | MH933630 | MH933600 | MH933505 | MH933590 |
| CFCC 89999 | Euonymus kiautschovicus | China | MH933538 | MH933631 | MH933601 | MH933506 | MH933591 | |
| Cytospora fraxinigena | MFLUCC 14-0868T | Fraxinus ornus | Italy | NA | MF190133 | NA | NA | NA |
| MFLU 17-0880 | Fraxinus ornus | Italy | NA | MF190134 | NA | NA | NA | |
| Cytospora fugax | CXY 1371 | Populus simonii | China | NA | KM034852 | NA | NA | KM034891 |
| CXY 1381 | Populus ussuriensis | China | NA | KM034853 | NA | NA | KM034890 | |
| Cytosporagalegicola | MFLUCC 18-1199T | Galega officinalis | Italy | MN685810 | MK912128 | MN685820 | NA | NA |
| Cytospora germanica | CXY 1322 | Elaeagnus oxycarpa | China | NA | JQ086563 | NA | NA | NA |
| Cytospora gigalocus | CFCC 89620T | Juglans regia | China | KU710997 | KR045628 | KU710957 | KU710920 | KR045669 |
| CFCC 89621 | Juglans regia | China | KU710998 | KR045629 | KU710958 | KU710921 | KR045670 | |
| Cytospora gigaspora | CFCC 50014 | Juniperus procumbens | China | KU710999. | KR045630 | KU710959 | KU710922 | KR045671 |
| CFCC 89634T | Salix psammophila | China | KU711000 | KF765671 | KU710960 | KU710923 | KR045672 | |
| Cytospora granati | CBS 144237T | Punica granatum | USA | MG971949 | MG971799 | NA | MG971514 | MG971664 |
| Cytosporahaidianensis | CFCC 54056 | Euonymus alatus | China | MT363978 | MT360041 | MT363987 | MT363997 | MT364007 |
| CFCC 54057T | Euonymus alatus | China | MT363979 | MT360042 | MT363988 | MT363998 | MT364008 | |
| CFCC 54184 | Euonymus alatus | China | MT363980 | MT360043 | MT363989 | MT363999 | MT364009 | |
| Cytospora hippophaës | CFCC 89639 | Hippophaë rhamnoides | China | KU711001 | KR045632 | KU710961 | KU710924 | KR045673 |
| CFCC 89640 | Hippophaë rhamnoides | China | KF765730 | KF765682 | KU710962 | KP310865 | KR045674 | |
| Cytospora japonica | CFCC 89956 | Prunus cerasifera | China | KU710993 | KR045624 | KU710953 | KU710916 | KR045665 |
| CFCC 89960 | Prunus cerasifera | China | KU710994 | KR045625 | KU710954 | KU710917 | KR045666 | |
| Cytospora joaquinensis | CBS 144235T | Populus deltoides | USA | MG972044 | MG971895 | NA | MG971605 | MG971761 |
| Cytospora junipericola | BBH 42444 | Juniperus communis | Italy | NA | MF190126 | NA | MF377579 | NA |
| MFLU 17-0882T | Juniperus communis | Italy | NA | MF190125 | NA | MF377580 | NA | |
| Cytospora juniperina | CFCC 50501T | Juniperus przewalskii | China | MH933539 | MH933632 | MH933602 | MH933507 | NA |
| CFCC 50502 | Juniperus przewalskii | China | MH933540 | MH933633 | MH933603 | MH933508 | MH933572 | |
| CFCC 50503 | Juniperus przewalskii | China | MH933541 | MH933634 | MH933604 | MH933509 | NA | |
| Cytospora kantschavelii | CXY 1383 | Populus maximowiczii | China | NA | KM034867 | NA | NA | NA |
| CXY 1386 | Populus maximowiczii | China | NA | KM034867 | NA | NA | NA | |
| Cytospora kuanchengensis | CFCC 52464T | Castanea mollissima | China | MK442940 | MK432616 | MK578076 | NA | NA |
| CFCC 52465 | Castanea mollissima | China | MK442941 | MK432617 | MK578077 | NA | NA | |
| Cytospora leucostoma | CFCC 50015 | Sorbus aucuparia | China | KU711002 | KR045634 | NA | KU710925 | KR045675 |
| CFCC 50016 | Sorbus aucuparia | China | MH820408 | MH820400 | NA | MH820404 | MH820389 | |
| CFCC 50017 | Prunus cerasifera | China | MH933542 | MH933635 | NA | MH933510 | MH933573 | |
| CFCC 50018 | Prunus serrulata | China | MH933543 | MH933636 | NA | MH933511 | MH933574 | |
| CFCC 50019 | Rosa helenae | China | MH933544 | MH933637 | NA | NA | NA | |
| CFCC 50020 | Prunus persica | China | MH933545 | MH933638 | NA | NA | NA | |
| CFCC 50021 | Prunus salicina | China | MH933546 | MH933639 | NA | MH933512 | MH933575 | |
| CFCC 50023 | Cornus alba | China | KU711003 | KR045635 | KU710964 | KU710926 | KR045676 | |
| CFCC 50024 | Prunus pseudocerasus | China | MH933547 | MH933640 | MH933605 | NA | MH933576 | |
| CFCC 50467 | Betula platyphylla | China | NA | KT732948 | NA | NA | NA | |
| CFCC 50468 | Betula platyphylla | China | NA | KT732949 | NA | NA | NA | |
| CFCC 53140 | Prunus sibirica | China | MN850760 | MN854445 | MN850746 | MN850753 | MN861115 | |
| CFCC 53141 | Prunus sibirica | China | MN850761 | MN854446 | MN850747 | MN850754 | MN861116 | |
| CFCC 53156 | Juglans mandshurica | China | MN850762 | MN854447 | MN850748 | MN850755 | MN861117 | |
| MFLUCC 16-0574 | Rosa sp. | Russia | KY417696 | KY417731 | KY417798 | NA | NA | |
| Cytospora longiostiolata | MFLUCC 16-0628T | Salix × fragilis | Russia | KY417700 | KY417734 | KY417802 | NA | NA |
| Cytospora longispora | CBS 144236T | Prunus domestica | USA | MG972054 | MG971905 | NA | MG971615 | MG971764 |
| Cytospora lumnitzericola | MFLUCC 17-0508T | Lumnitzera racernosa | Thailand | MH253457 | MG975778 | MH253453 | NA | NA |
| Cytospora mali | CFCC 50028 | Malus pumila | China | MH933548 | MH933641 | MH933606 | MH933513 | MH933577 |
| CFCC 50029 | Malus pumila | China | MH933549 | MH933642 | MH933607 | MH933514 | MH933578 | |
| CFCC 50030 | Malus pumila | China | MH933550 | MH933643 | MH933608 | MH933524 | MH933579 | |
| CFCC 50031 | Crataegus sp. | China | KU711004 | KR045636 | KU710965 | KU710927 | KR045677 | |
| CFCC 50044 | Malus baccata | China | KU711005 | KR045637 | KU710966 | KU710928 | KR045678 | |
| Cytospora melnikii | CFCC 89984 | Rhus typhina | China | MH933551 | MH933644 | MH933609 | MH933515 | MH933580 |
| MFLUCC 15-0851T | Malus domestica | Russia | KY417701 | KY417735 | KY417803 | NA | NA | |
| MFLUCC 16-0635 | Populus nigra var. italica | Russia | KY417702 | KY417736 | KY417804 | NA | NA | |
| Cytosporamyrtagena | CFCC 52454 | Castanea mollissima | China | MK442938 | MK432614 | MK578074 | NA | NA |
| CFCC 52455 | Castanea mollissima | China | MK442939 | MK432615 | MK578075 | NA | NA | |
| Cytospora nivea | MFLUCC 15-0860 | Salix acutifolia | Russia | KY417703 | KY417737 | KY417805 | NA | NA |
| CFCC 89641 | Elaeagnus angustifolia | China | KU711006 | KF765683 | KU710967 | KU710929 | KR045679 | |
| CFCC 89643 | Salix psammophila | China | NA | KF765685 | KU710968 | KP310863 | KP310829 | |
| Cytosporanotastroma | NE_TFR5 | Populus tremuloides | USA | NA | JX438632 | NA | JX438543 | NA |
| NE_TFR8 | Populus tremuloides | USA | NA | JX438633 | NA | JX438542 | NA | |
| Cytospora oleicola | CBS 144248T | Olea europaea | USA | MG972098 | MG971944 | NA | MG971660 | MG971752 |
| Cytospora palm | CXY 1276 | Cotinus coggygria | China | NA | JN402990 | NA | KJ781296 | NA |
| CXY 1280T | Cotinus coggygria | China | NA | JN411939 | NA | KJ781297 | NA | |
| Cytospora parakantschavelii | MFLUCC 15-0857T | Populus × sibirica | Russia | KY417704 | KY417738 | KY417806 | NA | NA |
| MFLUCC 16-0575 | Pyrus pyraster | Russia | KY417705 | KY417739 | KY417807 | NA | NA | |
| Cytospora parapistaciae | CBS 144506T | Pistacia vera | USA | MG971954 | MG971804 | NA | MG971519 | MG971669 |
| Cytospora parasitica | MFLUCC 15-0507T | Malus domestica | Russia | KY417706 | KY417740 | KY417808 | NA | NA |
| XJAU 2542-1 | Malus sp. | China | NA | MH798884 | NA | MH813452 | NA | |
| Cytospora paratranslucens | MFLUCC 15-0506T | Populus alba var. bolleana | Russia | KY417707 | KY417741 | KY417809 | NA | NA |
| MFLUCC 16-0627 | Populus alba | Russia | KY417708 | KY417742 | KY417810 | NA | NA | |
| Cytosporapiceae | CFCC 52841T | Picea crassifolia | China | MH820406 | MH820398 | MH820395 | MH820402 | MH820387 |
| CFCC 52842 | Picea crassifolia | China | MH820407 | MH820399 | MH820396 | MH820403 | MH820388 | |
| Cytosporapingbianensis | MFLUCC 18-1204T | Undefined wood | China | MN685817 | MK912135 | MN685826 | NA | NA |
| Cytospora pistaciae | CBS 144238T | Pistacia vera | USA | MG971952 | MG971802 | NA | MG971517 | MG971667 |
| Cytospora platanicola | MFLU 17-0327T | Platanus hybrida | Italy | MH253449 | MH253451 | MH253450 | NA | NA |
| Cytospora platyclada | CFCC 50504T | Platycladus orientalis | China | MH933552 | MH933645 | MH933610 | MH933516 | MH933581 |
| CFCC 50505 | Platycladus orientalis | China | MH933553 | MH933646 | MH933611 | MH933517 | MH933582 | |
| CFCC 50506 | Platycladus orientalis | China | MH933554 | MH933647 | MH933612 | MH933518 | MH933583 | |
| Cytospora platycladicola | CFCC 50038T | Platycladus orientalis | China | MH933555 | KT222840 | MH933613 | MH933519 | MH933584 |
| CFCC 50039 | Platycladus orientalis | China | KU711008 | KR045642 | KU710973 | KU710931 | KR045683 | |
| Cytospora plurivora | CBS 144239T | Olea europaea | USA | MG972010 | MG971861 | NA | MG971572 | MG971726 |
| Cytospora populicola | CBS 144240T | Populus deltoides | USA | MG972040 | MG971891 | NA | MG971601 | MG971757 |
| Cytospora populina | CFCC 89644T | Salix psammophila | China | KU711007 | KF765686 | KU710969 | KU710930 | KR045681 |
| Cytospora populinopsis | CFCC 50032T | Sorbus aucuparia | China | MH933556 | MH933648 | MH933614 | MH933520 | MH933585 |
| CFCC 50033 | Sorbus aucuparia | China | MH933557 | MH933649 | MH933615 | MH933521 | MH933586 | |
| Cytospora pruinopsis | CFCC 50034T | Ulmus pumila | China | KP310836 | KP281259 | KU710970 | KP310849 | KP310819 |
| CFCC 50035 | Ulmus pumila | China | KP310837 | KP281260 | KU710971 | KP310850 | KP310820 | |
| CFCC 53153 | Ulmus pumila | China | MN850763 | MN854451 | MN850752 | MN850759 | MN861121 | |
| Cytospora predappioensis | MFLUCC 17-2458T | Platanus hybrida | Italy | NA | MG873484 | NA | NA | NA |
| Cytospora pruinosa | CFCC 50036 | Syringa oblata | China | KP310832 | KP310800 | NA | KP310845 | KP310815 |
| CFCC 50037 | Syringa oblata | China | MH933558 | MH933650 | NA | MH933522 | MH933589 | |
| Cytospora prunicola | MFLU 17-0995T | Prunus sp. | Italy | MG742353 | MG742350 | MG742352 | NA | NA |
| Cytosporapubescentis | MFLUCC 18-1201T | Quercus pubescens | Italy | MN685812 | MK912130 | MN685821 | NA | NA |
| Cytospora punicae | CBS 144244 | Punica granatum | USA | MG972091 | MG971943 | NA | MG971654 | MG971798 |
| Cytospora quercicola | MFLUCC 14-0867T | Quercus sp. | Italy | NA | MF190129 | NA | NA | NA |
| MFLU 17-0881 | Quercus sp. | Italy | NA | MF190128 | NA | NA | NA | |
| Cytospora ribis | CFCC 50026 | Ulmus pumila | China | KP310843 | KP281267 | KU710972 | KP310856 | KP310826 |
| CFCC 50027 | Ulmus pumila | China | KP310844 | KP281268 | NA | KP310857 | KP310827 | |
| Cytospora rosae | MFLU 17-0885 | Rosa canina | Italy | NA | MF190131 | NA | NA | NA |
| Cytospora rostrata | CFCC 89909T | Salix cupularis | China | KU711009 | KR045643 | KU710974 | KU710932 | KR045684 |
| CFCC 89910 | Salix cupularis | China | KU711010 | KR045644 | KU710975 | KU710933 | NA | |
| Cytospora rusanovii | MFLUCC 15-0853 | Populus × sibirica | Russia | KY417709 | KY417743 | KY417811 | NA | NA |
| MFLUCC 15-0854T | Salix babylonica | Russia | KY417710 | KY417744 | KY417812 | NA | NA | |
| Cytospora salicacearum | MFLUCC 15-0861 | Salix × fragilis | Russia | KY417711 | KY417745 | KY417813 | NA | NA |
| MFLUCC 15-0509T | Salix alba | Russia | KY417712 | KY417746 | KY417814 | NA | NA | |
| MFLUCC 16-0576 | Populus nigra var. italica | Russia | KY417707 | KY417741 | KY417809 | NA | NA | |
| MFLUCC 16-0587 | Prunus cerasus | Russia | KY417708 | KY417742 | KY417810 | NA | NA | |
| Cytospora salicicola | MFLUCC 15-0866 | Salix alba | Russia | KY417715 | KY417749 | KY417817 | NA | NA |
| MFLUCC 14-1052T | Salix alba | Russia | KU982637 | KU982636 | NA | NA | NA | |
| Cytospora salicina | MFLUCC 15-0862T | Salix alba | Russia | KY417716 | KY417750 | KY417818 | NA | NA |
| MFLUCC 16-0637 | Salix × fragilis | Russia | KY417717 | KY417751 | KY417819 | NA | NA | |
| Cytospora schulzeri | CFCC 50040 | Malus domestica | China | KU711013 | KR045649 | KU710980 | KU710936 | KR045690 |
| CFCC 50042 | Malus asiatica | China | KU711014 | KR045650 | KU710981 | KU710937 | KR045691 | |
| Cytospora sibiraeae | CFCC 50045T | Sibiraea angustata | China | KU711015 | KR045651 | KU710982 | KU710938 | KR045692 |
| CFCC 50046 | Sibiraea angustata | China | KU711015 | KR045652 | KU710983 | KU710939 | KR045693 | |
| Cytospora sophorae | CFCC 50047 | Styphnolobium japonicum | China | KU711017 | KR045653 | KU710984 | KU710940 | KR045694 |
| CFCC 50048 | Magnolia grandiflora | China | MH820409 | MH820401 | MH820397 | MH820405 | MH820390 | |
| CFCC 89598 | Styphnolobium japonicum | China | KU711018 | KR045654 | KU710985 | KU710941 | KR045695 | |
| Cytospora sophoricola | CFCC 89595T | Styphnolobium japonicum var. pendula | China | KU711019 | KR045655 | KU710986 | KU710942 | KR045696 |
| CFCC 89596 | Styphnolobium japonicum var. pendula | China | KU711020 | KR045656 | KU710987 | KU710943 | KR045697 | |
| Cytospora sophoriopsis | CFCC 89600T | Styphnolobium japonicum | China | KU710992 | KR045623 | KU710951 | KU710915 | KP310817 |
| Cytospora sorbi | MFLUCC 16-0631T | Sorbus aucuparia | Russia | KY417718 | KY417752 | KY417820 | NA | NA |
| Cytospora sorbicola | MFLUCC 16-0584T | Acer pseudoplatanus | Russia | KY417721 | KY417755 | KY417823 | NA | NA |
| MFLUCC 16-0633 | Cotoneaster melanocarpus | Russia | KY417724 | KY417758 | KY417826 | NA | NA | |
| Cytospora spiraeae | CFCC 50049T | Spiraea salicifolia | China | MG708196 | MG707859 | MG708199 | NA | NA |
| CFCC 50050 | Spiraea salicifolia | China | MG708197 | MG707860 | MG708200 | NA | NA | |
| Cytosporaspiraeicola | CFCC 53138T | Spiraea salicifolia | China | NA | MN854448 | MN850749 | MN850756 | MN861118 |
| CFCC 53139 | Tilia nobilis | China | NA | MN854449 | NA | NA | NA | |
| Cytospora tamaricicola | CFCC 50507 | Rosa multifolora | China | MH933559 | MH933651 | MH933616 | MH933525 | MH933587 |
| CFCC 50508T | Tamarix chinensis | China | MH933560 | MH933652 | MH933617 | MH933523 | MH933588 | |
| Cytospora tanaitica | MFLUCC 14-1057T | Betula pubescens | Russia | KT459413 | KT459411 | NA | NA | NA |
| Cytospora thailandica | MFLUCC 17-0262T | Xylocarpus moluccensis | Thailand | MH253459 | MG975776 | MH253455 | NA | NA |
| MFLUCC 17-0263T | Xylocarpus moluccensis | Thailand | MH253460 | MG975777 | MH253456 | NA | NA | |
| Cytospora tibouchinae | CPC 26333T | Tibouchina semidecandra | France | NA | KX228284 | NA | NA | NA |
| Cytospora translucens | CXY 1351 | Populus davidiana | China | NA | KM034874 | NA | NA | KM034895 |
| Cytospora ulmi | MFLUCC 15-0863T | Ulmus minor | Russia | NA | KY417759 | NA | NA | NA |
| Cytospora vinacea | CBS 141585T | Vitis interspecific hybrid ‘Vidal’ | USA | NA | KX256256 | NA | KX256277 | KX256235 |
| Cytosporaxinglongensis | CFCC 52458 | Castanea mollissima | China | MK442946 | MK432622 | MK578082 | NA | NA |
| CFCC 52459 | Castanea mollissima | China | MK442947 | MK432623 | MK578083 | NA | NA | |
| Cytospora viridistroma | CBS 202.36T | Cercis canadensis Castigl. | USA | NA | MN172408 | NA | MN271853 | NA |
| Cytospora viticola | CBS 141586T | Vitis vinifera | USA | NA | KX256239 | NA | KX256260 | KX256218 |
| Cytospora xylocarpi | MFLUCC 17-0251T | Xylocarpus granatum | Thailand | MH253458 | MG975775 | MH253454 | NA | NA |
| Diaporthe vaccinii | CBS 160.32 | Vaccinium macrocarpon | USA | JQ807297 | KC343228 | NA | KC343954 | KC344196 |
© 2020 by the authors. Licensee MDPI, Basel, Switzerland. This article is an open access article distributed under the terms and conditions of the Creative Commons Attribution (CC BY) license (http://creativecommons.org/licenses/by/4.0/).
Share and Cite
Zhou, X.; Pan, M.; Li, H.; Tian, C.; Fan, X. Dieback of Euonymus alatus (Celastraceae) Caused by Cytospora haidianensis sp. nov. in China. Forests 2020, 11, 524. https://doi.org/10.3390/f11050524
Zhou X, Pan M, Li H, Tian C, Fan X. Dieback of Euonymus alatus (Celastraceae) Caused by Cytospora haidianensis sp. nov. in China. Forests. 2020; 11(5):524. https://doi.org/10.3390/f11050524
Chicago/Turabian StyleZhou, Xian, Meng Pan, Haoyu Li, Chengming Tian, and Xinlei Fan. 2020. "Dieback of Euonymus alatus (Celastraceae) Caused by Cytospora haidianensis sp. nov. in China" Forests 11, no. 5: 524. https://doi.org/10.3390/f11050524
APA StyleZhou, X., Pan, M., Li, H., Tian, C., & Fan, X. (2020). Dieback of Euonymus alatus (Celastraceae) Caused by Cytospora haidianensis sp. nov. in China. Forests, 11(5), 524. https://doi.org/10.3390/f11050524