Abstract
Analyzing the effects of climate change on forest ecosystems and individual species is of great significance for incorporating management responses to conservation policy development. Euscaphis japonica (Staphyleaceae), a small tree or deciduous shrub, is distributed among the open forests or mountainous valleys of Vietnam, Korea, Japan, and southern China. Meanwhile, it is also used as a medicinal and ornamental plant. Nonetheless, the extents of E. japonica forest have gradually shrunk as a result of deforestation, together with the regional influence of climate change. The present study employed two methods for modeling species distribution, Maxent and Genetic Algorithm for Rule-set Prediction (GARP), to model the potential distribution of this species and the effects of climate change on it. Our results suggest that both models performed favorably, but GARP outperformed Maxent for all performance metrics. The temperate and subtropical regions of eastern China where the species had been recorded was very suitable for E. japonica growth. Temperature and precipitation were two primary environmental factors affecting the distribution of E. japonica. Under climate change scenarios, the range of suitable habitats for E. japonica will expand geographically toward the north. Our findings may be used in several ways such as identifying currently undocumented locations of E. japonica, sites where it may occur in the future, or potential locations where the species could be introduced and so contribute to the conservation and management of this species.
1. Introduction
Climate has been identified to be a main element affecting the large-scale distribution of various species [1,2]. Global climate change has been reported to result in shifts in the distribution of many species over the past 30 years, and may be the dominant factor leading directly to species extinction in the short run, or under the synergistic effect with additional drivers of extinction [2,3,4]. Forest ecosystems are affected by changes in rainfall and average temperature, as well as by changes in the frequency of extreme weather events, including droughts, cyclones, intense storms, and wildfires [5]. These effects of weather and climate can be broadly described as changes affecting species distribution [6] as well as the composition and structure [7,8] of forests. Climate also affects flowering and fruiting phenology [2], life-history traits [9,10,11], and habitat requirements [2,6]. Therefore, it is important to understand the effects of climate change on the suitable habitat for various species, so that forest managers are able to evaluate the climate change susceptibilities of ecosystems and species [12,13].
Species distribution modelling (SDM) is one approach used to model the potential geographical distribution and ecological requirements of a species. This method analyzes those environmental conditions of a species’ known occurrence to predict potential suitable habitats in different locations and has been adopted among various disciplines, such as global change biology, biogeography, and conservation management [9,13,14]. Various SDMs, such as domain environmental envelope (DOMAIN), the generalized additive model (GAM), Maxent, and the Genetic Algorithm for Rule-set Production (GARP), have been widely used in predicting ecological requirements, distribution areas, invasive risks, and disease transmission for various species [15,16,17]. Briefly, these approaches are different from each other in terms of species records (absence/presence or presence-only) as well as the factors used to make predictions (mechanistic-physiological constrain or empirical-climatic approach) [18].
Each model is associated with drawbacks that limit the accuracy of predictions [19]. Consequently, the most reliably modeled potential distribution of a species could be identified through comparing predictions obtained from more than one algorithm [9,19]. Maxent and GARP provide two commonly used methods for predicting the distribution of species at different scales [20]. Therefore, evaluating the performances of GARP and Maxent will help to reveal the variations in the ability of these two models to accurately predict the future distribution of a plantation species.
Euscaphis japonica (Thunb.) Kanitz (Staphyleaceae) is a small widely distributed deciduous tree or shrub growing in open forests or mountainous valleys across Vietnam, Korea, Japan, and a majority of provinces in China, particularly from the south Yangtze River to Hainan [21]. The ripe red of the pericarp of fruits of this species cause it to be used in horticulture as an ornamental tree; the fruits stay on the branches from September until March in the following year [22,23]. Besides its attractive fruit, E. japonica extracts have abundant chemical compositions, including esters, terpenes, flavonoids, etc., and they have diverse pharmacological effects, including anti-inflammatory, anti-liver fibrosis, and anti-oxidation effects [24].
Over the past few decades, an unprecedented amount of damage caused by humans to forests has caused severe degeneration of the natural habitat of E. japonica. However, without knowing the climatic preference and potential geographical distribution of this species, developing a management strategy and practical measures that can be used to conserve or cultivate E. japonica resources will be difficult. Moreover, climate change has been reported to have significant implications for the habitat requirements of various species. Therefore, determining whether climate change will affect the suitability of habitat for this species presents another critical problem linked to its economic value and ecological significance. Nonetheless, the ecological requirements of E. japonica have rarely been investigated in existing studies, so that little is known about which areas should be prioritized for afforestation using E. japonica under climate change.
In this regard, we use Maxent and GARP to project the potential distribution patterns of E. japonica. The goals of this paper are to (a) examine the geographical distribution of E. japonica; (b) determine relevant environmental factors influencing its distribution; (c) discuss the variations of suitable habitat under projected climate change conditions; and (d) recommend conservation priority areas for future effective conservation. The results will contribute to identifying the appropriate geographical space available for this species in the future and help in the use, management, and cultivation of E. japonica.
2. Materials and Methods
2.1. Location Data for E. japonica
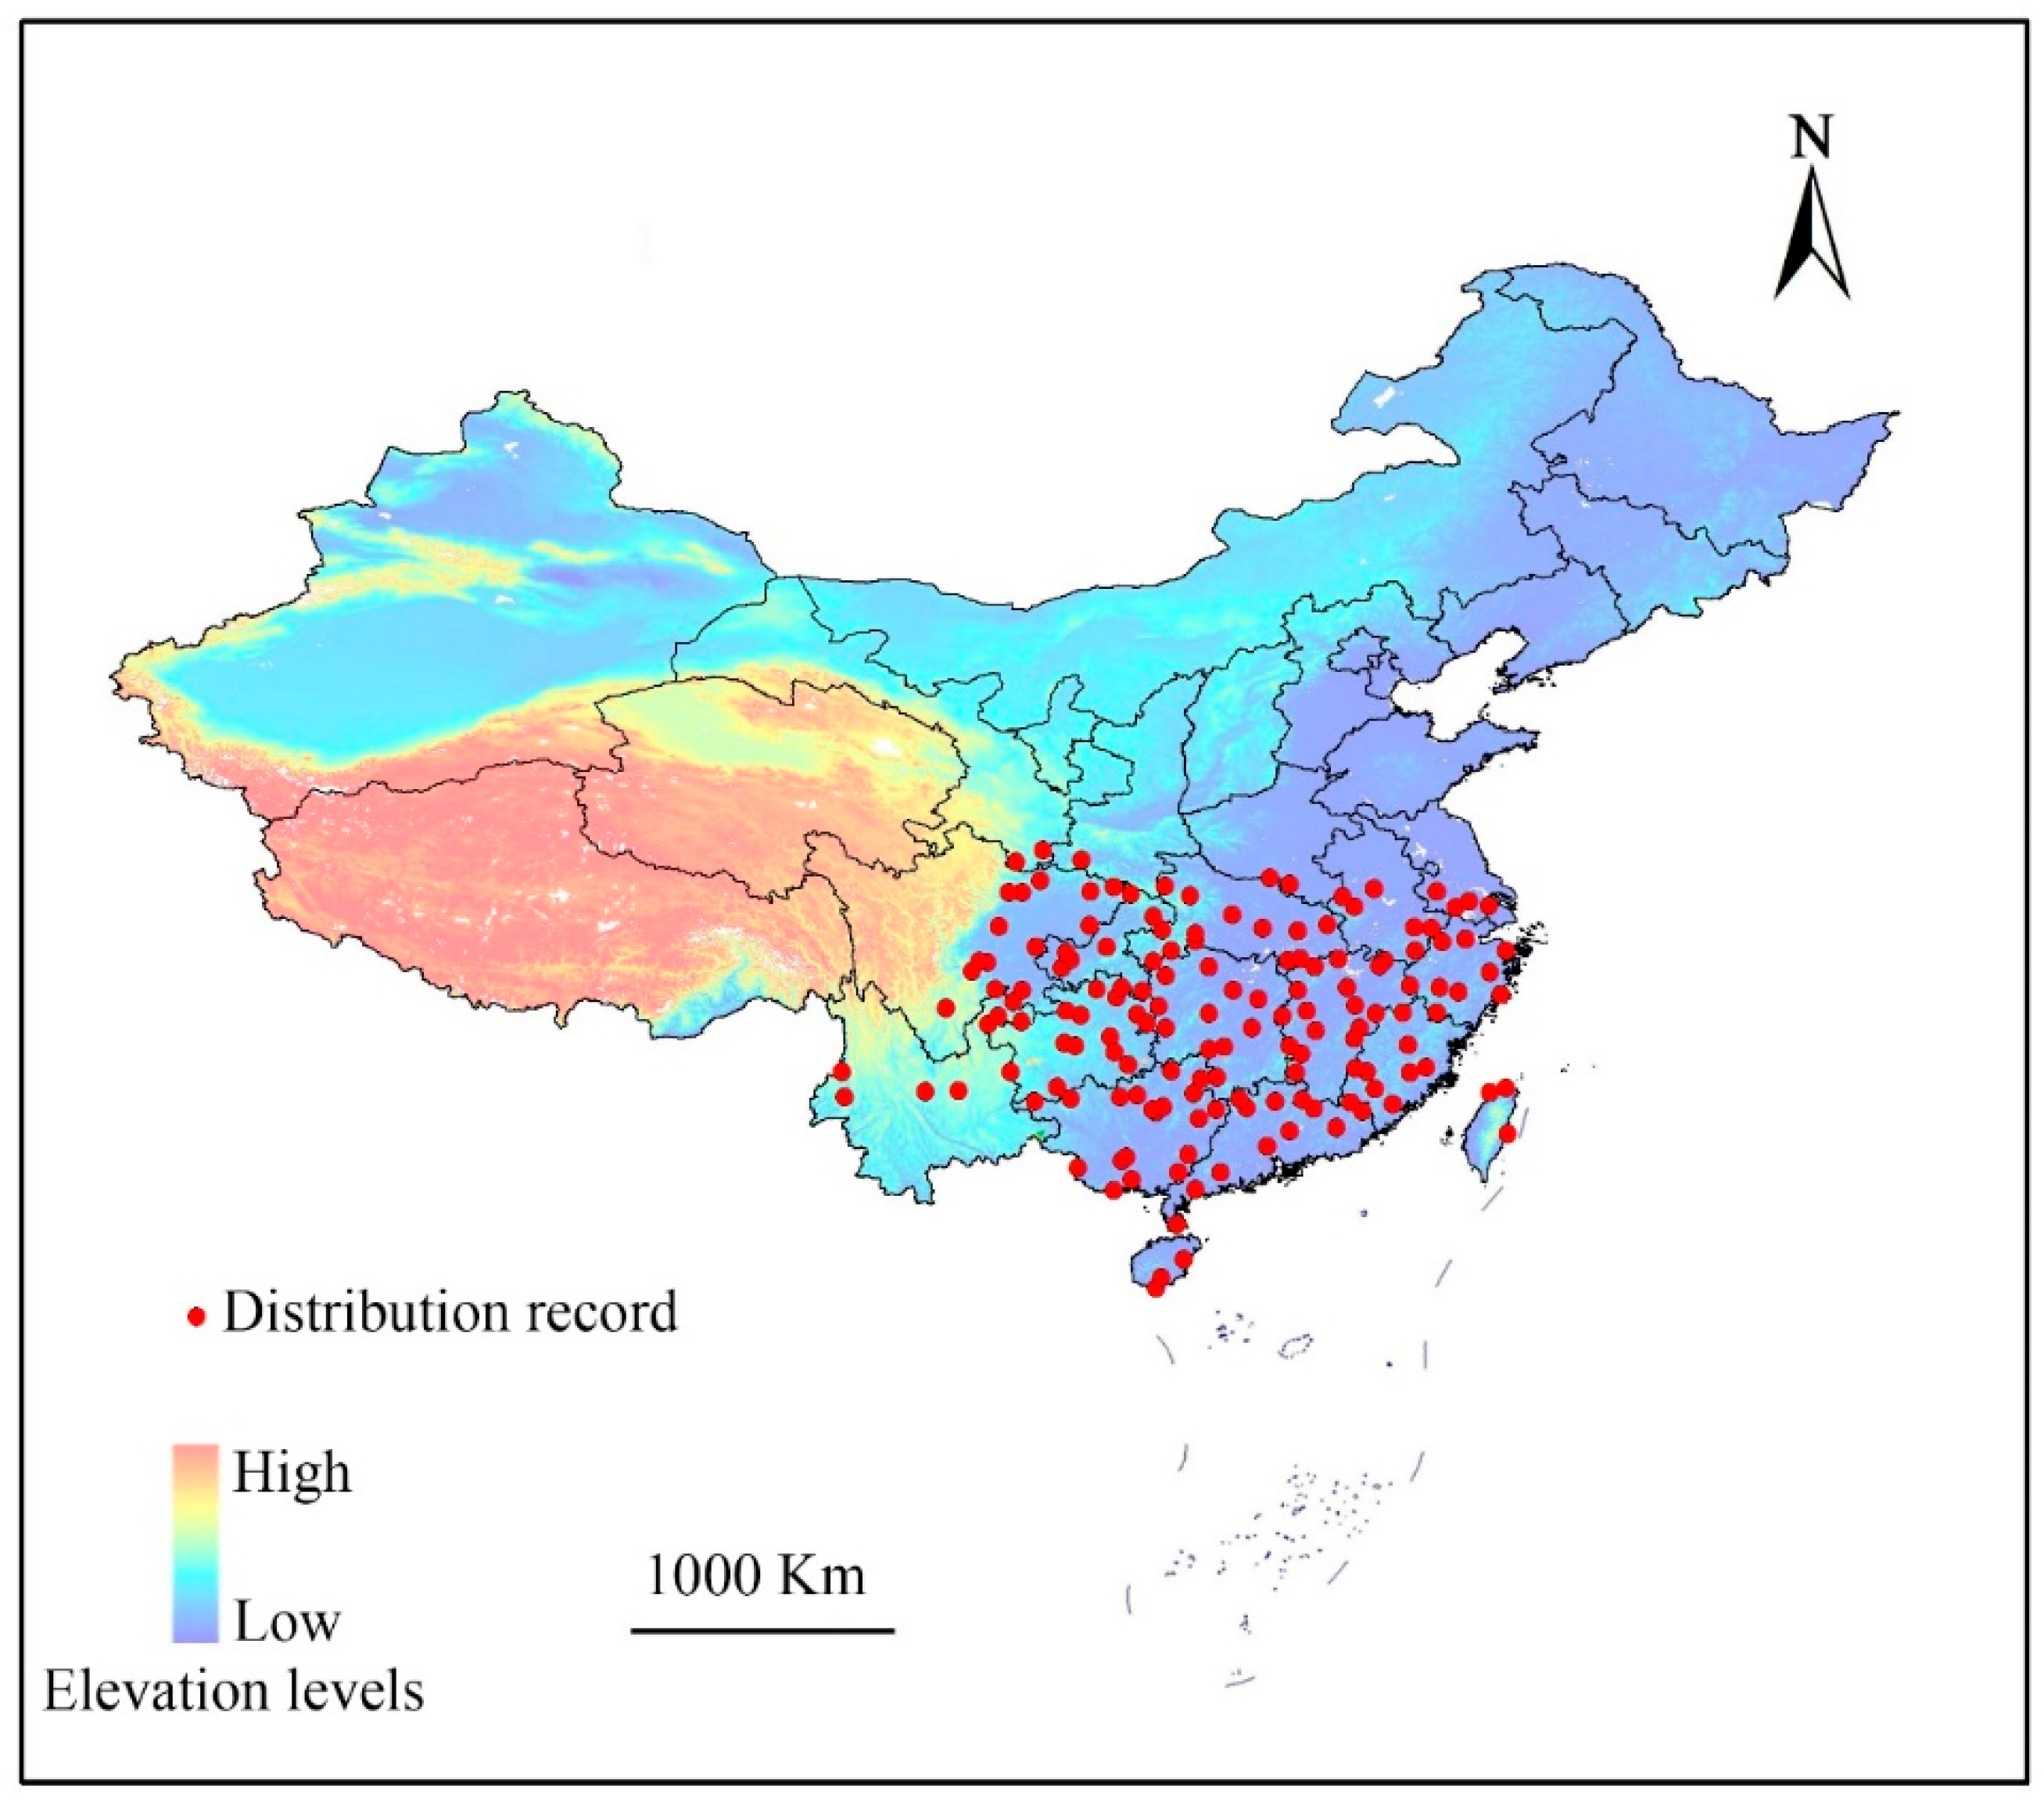
The complete list of locations (longitude and latitude) for distribution of E. japonica in China was collected from the Global Biodiversity Information Facility (GBIF, http://www.gbif.org/), and the Chinese Virtual Herbarium (CVH) databases (http://v5.cvh.org.cn/). A few distribution records were obtained by literature searches and our field investigations. We assessed the dataset under a set of criteria based on the suggestions of Boitani et al. [25]. Only the specimens collected in the last 20 years and documented in the literature during that time period were used. Furthermore, only locations provided by online search engines or local flora were used to ensure that these locations represent areas of permanent and natural presence. The analysis excluded records with imprecise locations when no exact geo-coordinates existed in the location records. After duplicates were removed, the remaining points were filtered to ensure that only one point was plotted per 1.0 × 1.0 km grid cell. A total of 195 geological reference records were collected (Figure 1).
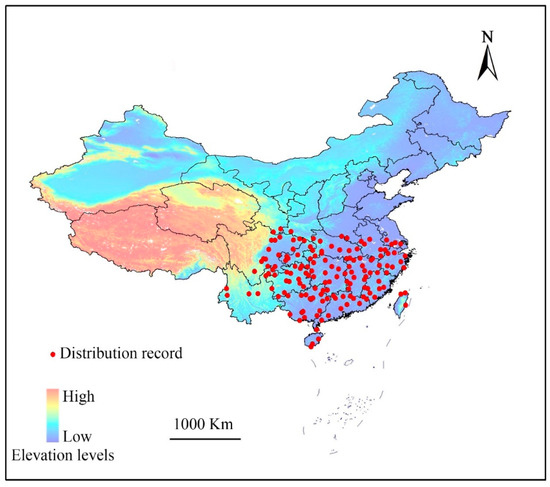
Figure 1.
Known sites of Euscaphis japonica used when generating the predictive models. Provinces and other administrative areas are outlined.
2.2. Environmental Parameters
A total of 28 environmental parameters were selected to be the candidate predicting factors for the distribution of E. japonica habitat according to other SDMs studies and the biological relevance to distribution [2,3,6,19,26]. Notably, altogether 19 bioclimatic parameters that showed relatively high biological significance for defining the species tolerance to eco-physiological stresses [27] were acquired based on the WorldClim dataset (http://www.worldclim.org/bioclim.htm). Three topographic parameters, i.e., slope degree, aspect, and elevation, were extracted from digital elevation model acquired via the Geospatial Data Cloud (http://www.gscloud.cn) with 30 × 30 m resolution. Three soil variables, i.e., soil organic carbon, soil pH, and soil type, were acquired from the Center for Sustainability and the Global Environment (SAGE) database (http://www.sage.wisc.edu/atlas/index.php); in addition, Normalized Difference Vegetation Index (NDVI), relative humidity, and sunshine duration in growing season were acquired based on China Meteorological Data Sharing Service System (http://data.cma.cn/site/index.html).
The future climate data adopted for simulation were the BCC-CSM 1.1 modeling data under Representative Concentration Pathway (RCP) 2.6 and 8.5 for 2050 and 2070 issued via the IPCC Accessment Report 5 (AR5). The BCC-CSM 1.1 data have been recommended for research on climate change across China [28]. RCP 2.6 reflects potential radiative forcing by 2100, compared with the pre-industrial values of +2.6 W/m2 which is optimistic, while RCP 8.5, the more pessimistic situation, represents the great emission levels of greenhouse gases, and leads to radiative forcing of 8.5 W/m2 by 2100.
A 1 km spatial resolution was employed to resample all environmental variables; in addition, all variables were clipped in the study area. Next, all layers were processed using ArcGIS 10.0 along with the same cell size, spatial extent, and a WGS84 projection system. The variables were next tested by Pearson correlation coefficient and principal component analyses. Only one parameter was selected for those with high cross-correlation (r2 > 0.90) based on the biological significance to E. japonica distribution [26]. Eventually, the number of predicting factors was decreased to 19 (Table 1).

Table 1.
Selected environmental variables and their percent contribution for Euscaphis japonica tree species in China.
2.3. Model Simulation and Evalution
We employed both Maxent and GARP to predict the distribution of E. japonica and the impact of global warming. These two models were chosen because previous similar studies demonstrated their better performance compared to other models [14,19]. Both models use artificial intelligence to evaluate the potential geographical distribution, and require location information and pseudo-absence (for Maxent) or background (GARP) data during the construction of models [9]. However, they differ in their operating principle. GARP is a machine-learning algorithm. It uses rules to determine whether a species is present within the given area and generate models [20]. GARP uses an iteration procedure, including rule selection, testing, evaluation, rejection or incorporation to select an approach based on various options (negated range rules, range rules, atomic rules, and logistic regression) and applies it into those training data for developing or evolving one rule (see Stockwell and Noble [20] for more details). However, Maxent has recently been reclassified as a version of the generalized linear model. It generates models based on the principle of maximum entropy (see Phillips et al. [29] for more details). It generates models by finding the distribution closest to uniform distribution (i.e., maximum entropy) of each environmental variable across the study area.
In our study, Maxent models were ran using version 3.3.3k [19,29,30]. The location data were randomly separated into two parts, where 75% were adopted in model training, whereas the remaining 25% were used in model testing. Recent studies showed that the default configuration is not always appropriate. Therefore, various regularized multiplier values were analyzed, finding that the default setting had the best performance [31]. The comparison of models was done by using the corrected Akaike information criterion (AICc). The best model has the smallest AICc value (for more detail, see Merow et al. [31]). The model extrapolation was improved using a bias file layer that was created to restrict those background points within species occurrence regions [2]. Repeated split samples were processed using ten replicates to measure the variation in the model; then we averaged the results. A total of 1000 iterations was selected to give the model adequate time for convergence; 1 × 10⁻⁶ was selected as a convergence threshold [31]. The internal jackknife of Maxent was also adopted for testing and assessing the significance for all environmental parameters in the prediction of E. japonica distribution. Maxent employs various methods that can be used to quantify how each variable contributes to the model. The present study employed permutation importance to identify the most important bioclimatic variables used in predicting the geographical distribution of a particular group of taxa. Permutation importance measures the decrease in training AUC that results from randomly permuted values of a specific variable during training of the model. A variable that requires less training AUC is more important to the model [29].
The GARP model was implemented in desktop version 1.1. GARP uses sets of rules to determine whether a species is present within the given area [20]. It uses an iteration procedure, including rule selection, testing, evaluation, rejection or incorporation to select an approach based on various options (negated range rules, range rules, atomic rules, and logistic regression) and applies it into those training data for developing or evolving one rule [32]. Location data were divided randomly in the same equal percentage for training and testing as was implemented in the Maxent. We ran 100 models with the model iteration convergence limit at 0.01 for at most 1000 iterations. Meanwhile, the “best subsets” procedure and the internal testing feature were activated to select the 10 best models [29,33]. Omission errors were included in the selection criteria (i.e., known locations predicted areas of absence); these were set to the lowest 20% of values. The default value of 50% was used for errors of commission. The two models, GARP and Maxent, were projected into datasets of the climate change scenarios after completing the iteration phase.
2.4. Model Evalution
The predicted distribution maps were compared with the currently reported areas of distribution and the locations of such records based on various local florae and the literature. The accuracy of the algorithms in prediction was assessed through three parameters, i.e., the area under the Receiver Operating Characteristic (ROC) curve (AUC) [19,29], Cohen’s Kappa [34], and TSS [35]. Each of the accuracy measures was obtained based on a “confusion matrix” [33,36], while ArcGIS 10.0 was used to perform statistical analyses. The value of AUC varied from 0 to 1, among which, that of ≤0.5 suggests that the models show no predicting capability, while that of >0.7 represents that the models are acceptable [37]. The value of Cohen’s Kappa was between −1 and + 1, in which + 1 suggests excellent performance, while values of ≤0 indicate that a performance was not superior to a random result [38]. TSS also varies from −1 to +1, in which +1 stands for excellent agreement, and a value of ≤0 indicates that the performance is not superior to random. A Wilcoxon signed-rank test (one-tailed) was adopted for evaluating AUC, Kappa and TSS values between GARP and Maxent for their statistical significance.
3. Results
3.1. Model Accuracy and Prediction of Potentially Suitable Areas
Generally, both GARP and Maxent showed a good performance when considering all accuracy measures considered (AUC, Kappa, and TSS; Table 2); thus the resulting potential distributions of the species were considered to provide a reliable estimate of the forecasted effects of climate change. However, the values of the AUC, Kappa, and TSS of GARP were significantly higher than Maxent (Table 2), indicating that GARP had a higher performance than Maxent.

Table 2.
Comparison of area under the ROC curve (AUC), kappa and true skill statistic (TSS) of Genetic Algorithm for Rule-set Prediction (GARP) and Maxent models.
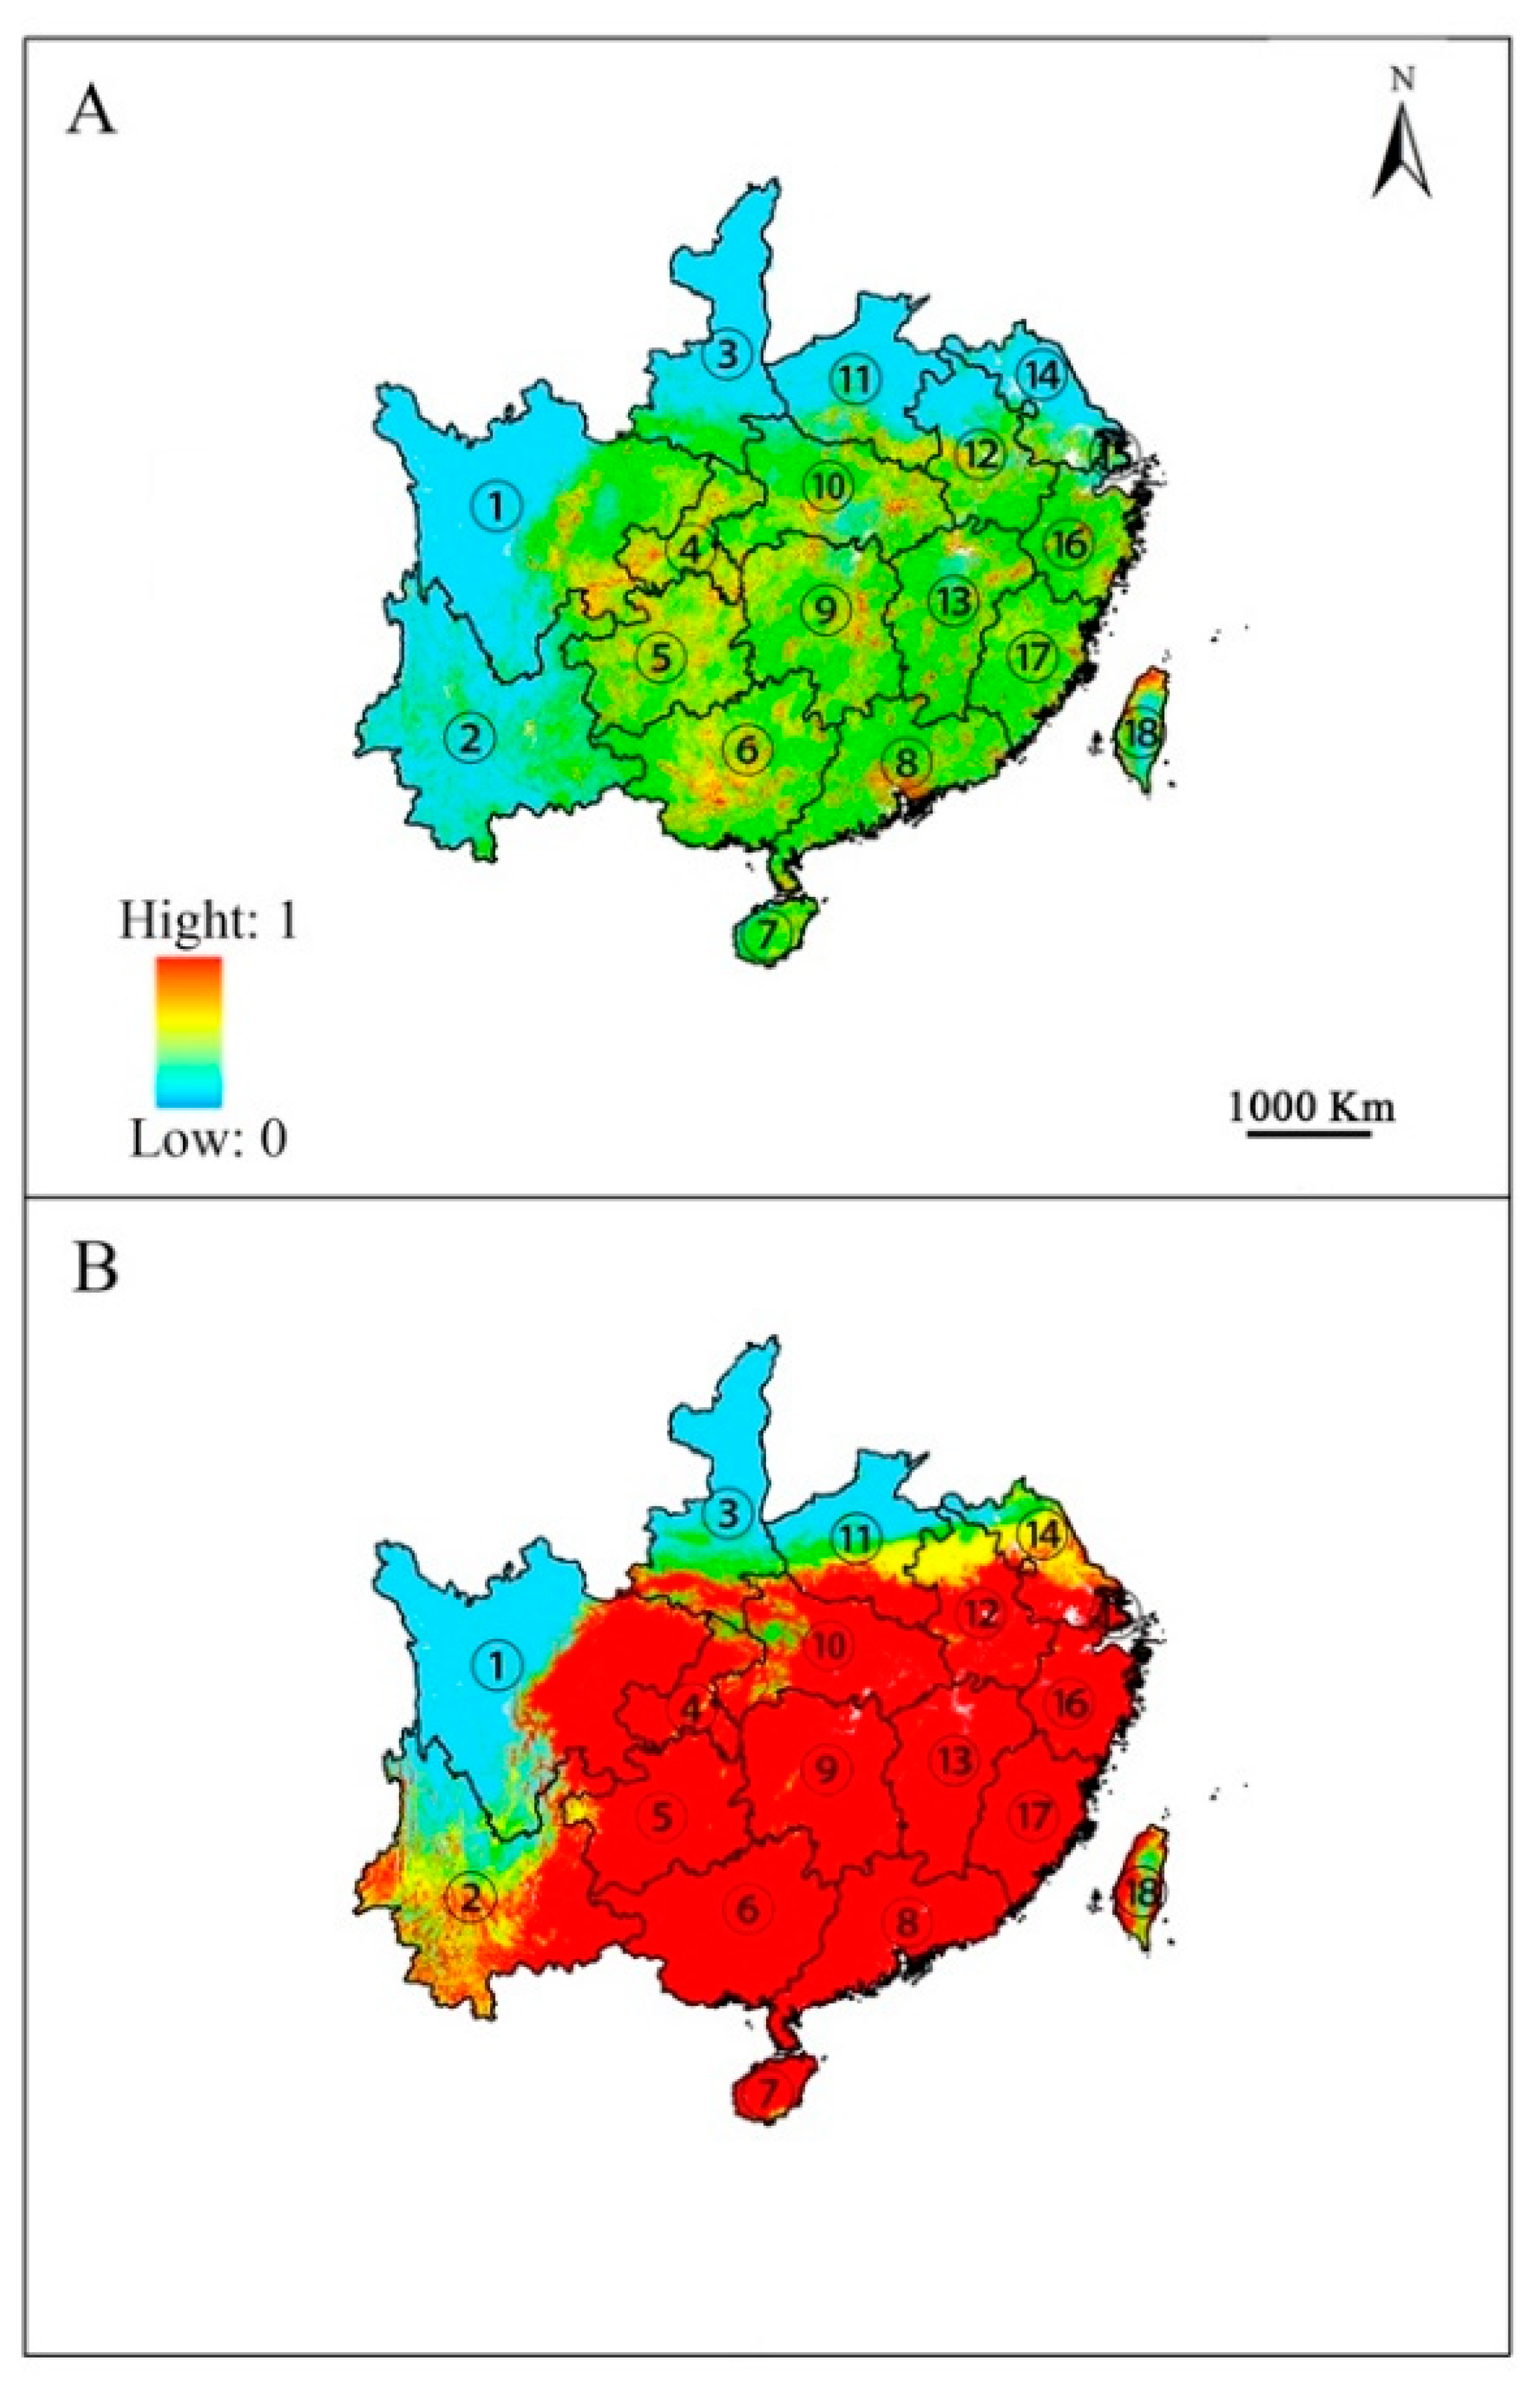
The predicted potential geographic distribution of E. japonica from both GARP and Maxent models were projected onto China using the identical environmental variables (Figure 2). The output maps for China’s potential distribution of E. japonica based on GARP analysis were consistent with Maxent’s projected distribution. Both models predict that the climate in temperate and subtropical regions of southeastern China is suitable for the growth of E. japonica. However, differences were also detected in the current potential distributions predicted by Maxent and GARP; to be specific, GARP predicted that large areas of habitat in Anhui, Jiangsu and Yunnan provinces were suitable; however, the areas predicted by Maxent in those two province were small. Moreover, GARP predicted that the potential geographic distribution with high suitability was continuous and covers a large area, whereas that predicted by Maxent was scattered and small.
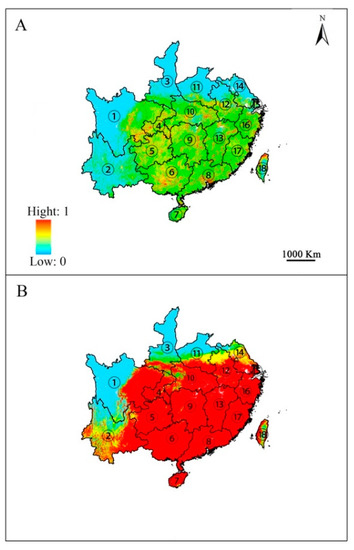
Figure 2.
Predicted potential distribution of Euscaphis japonica by Maxent (A) and GARP (B). ① Sichuan; ② Yunnan; ③ Shanxi; ④ Chongqing; ⑤ Guizhou; ⑥ Guangxi; ⑦ Hainan; ⑧ Guangdong; ⑨ Hunan; ⑩ Hubei; ⑪ Henan; ⑫ Anhui; ⑬ Jiangxi; ⑭ Jiangsu; ⑮ Shanghai; ⑯ Zhejiang; ⑰ Fujian; ⑱ Taiwan. Only the provinces where E. japonica is predicted to occur are shown.
3.2. Variable Importance and Climatic Preference
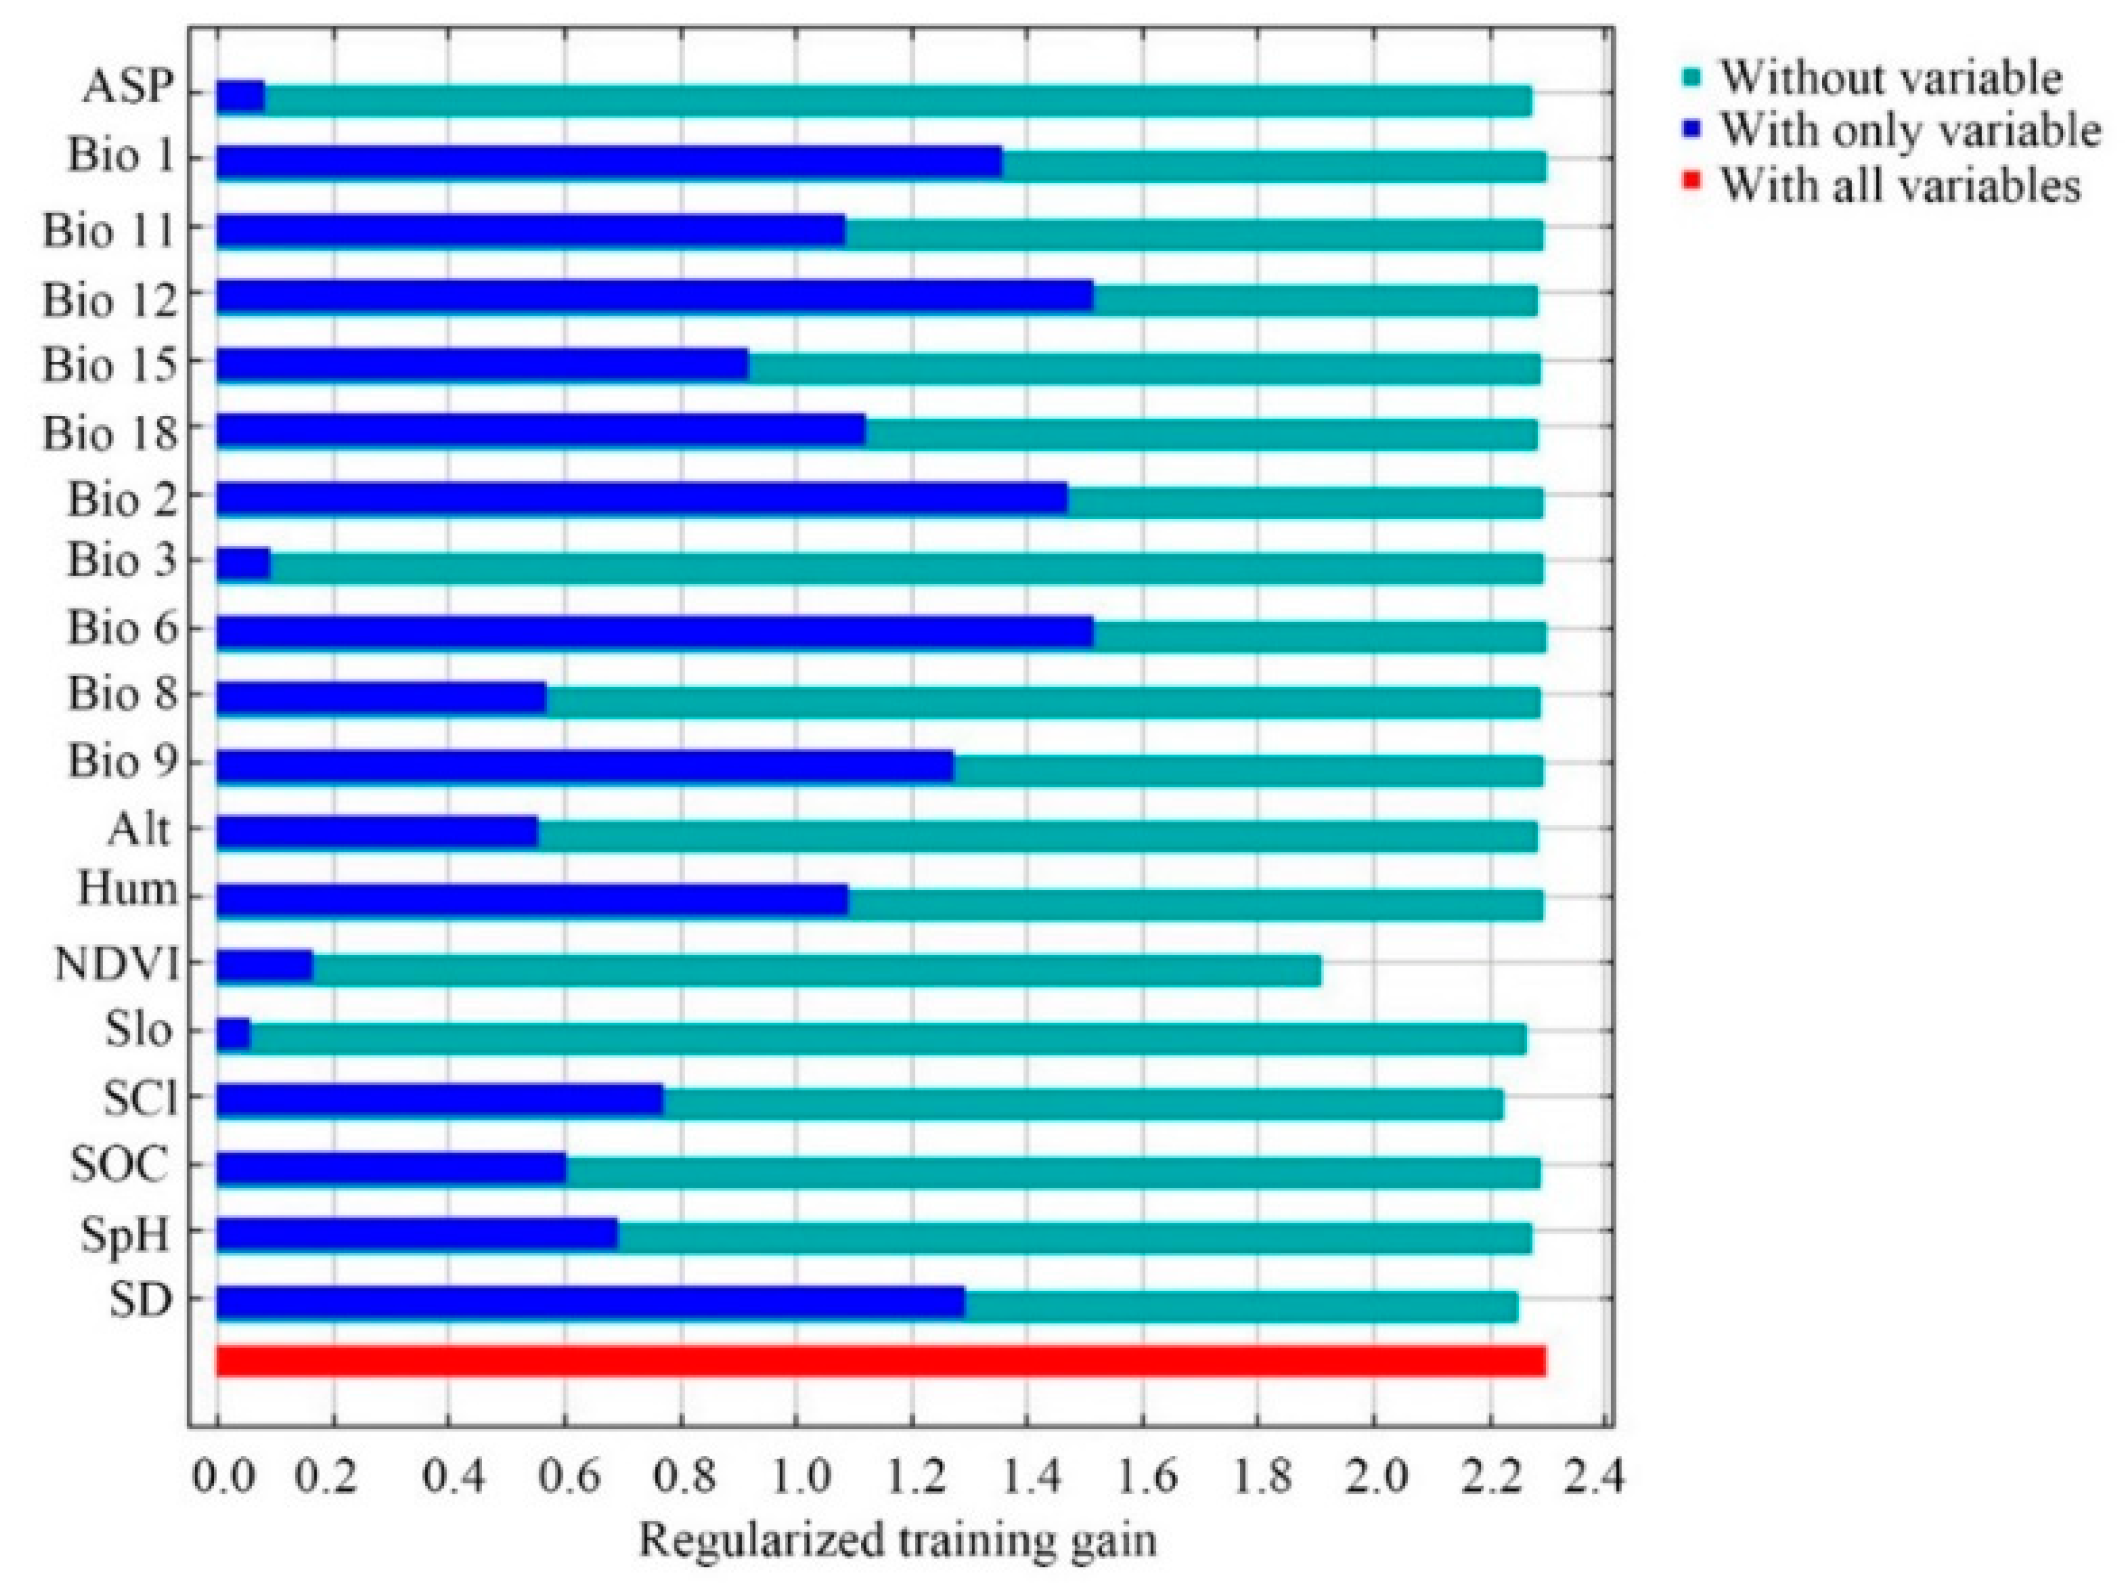
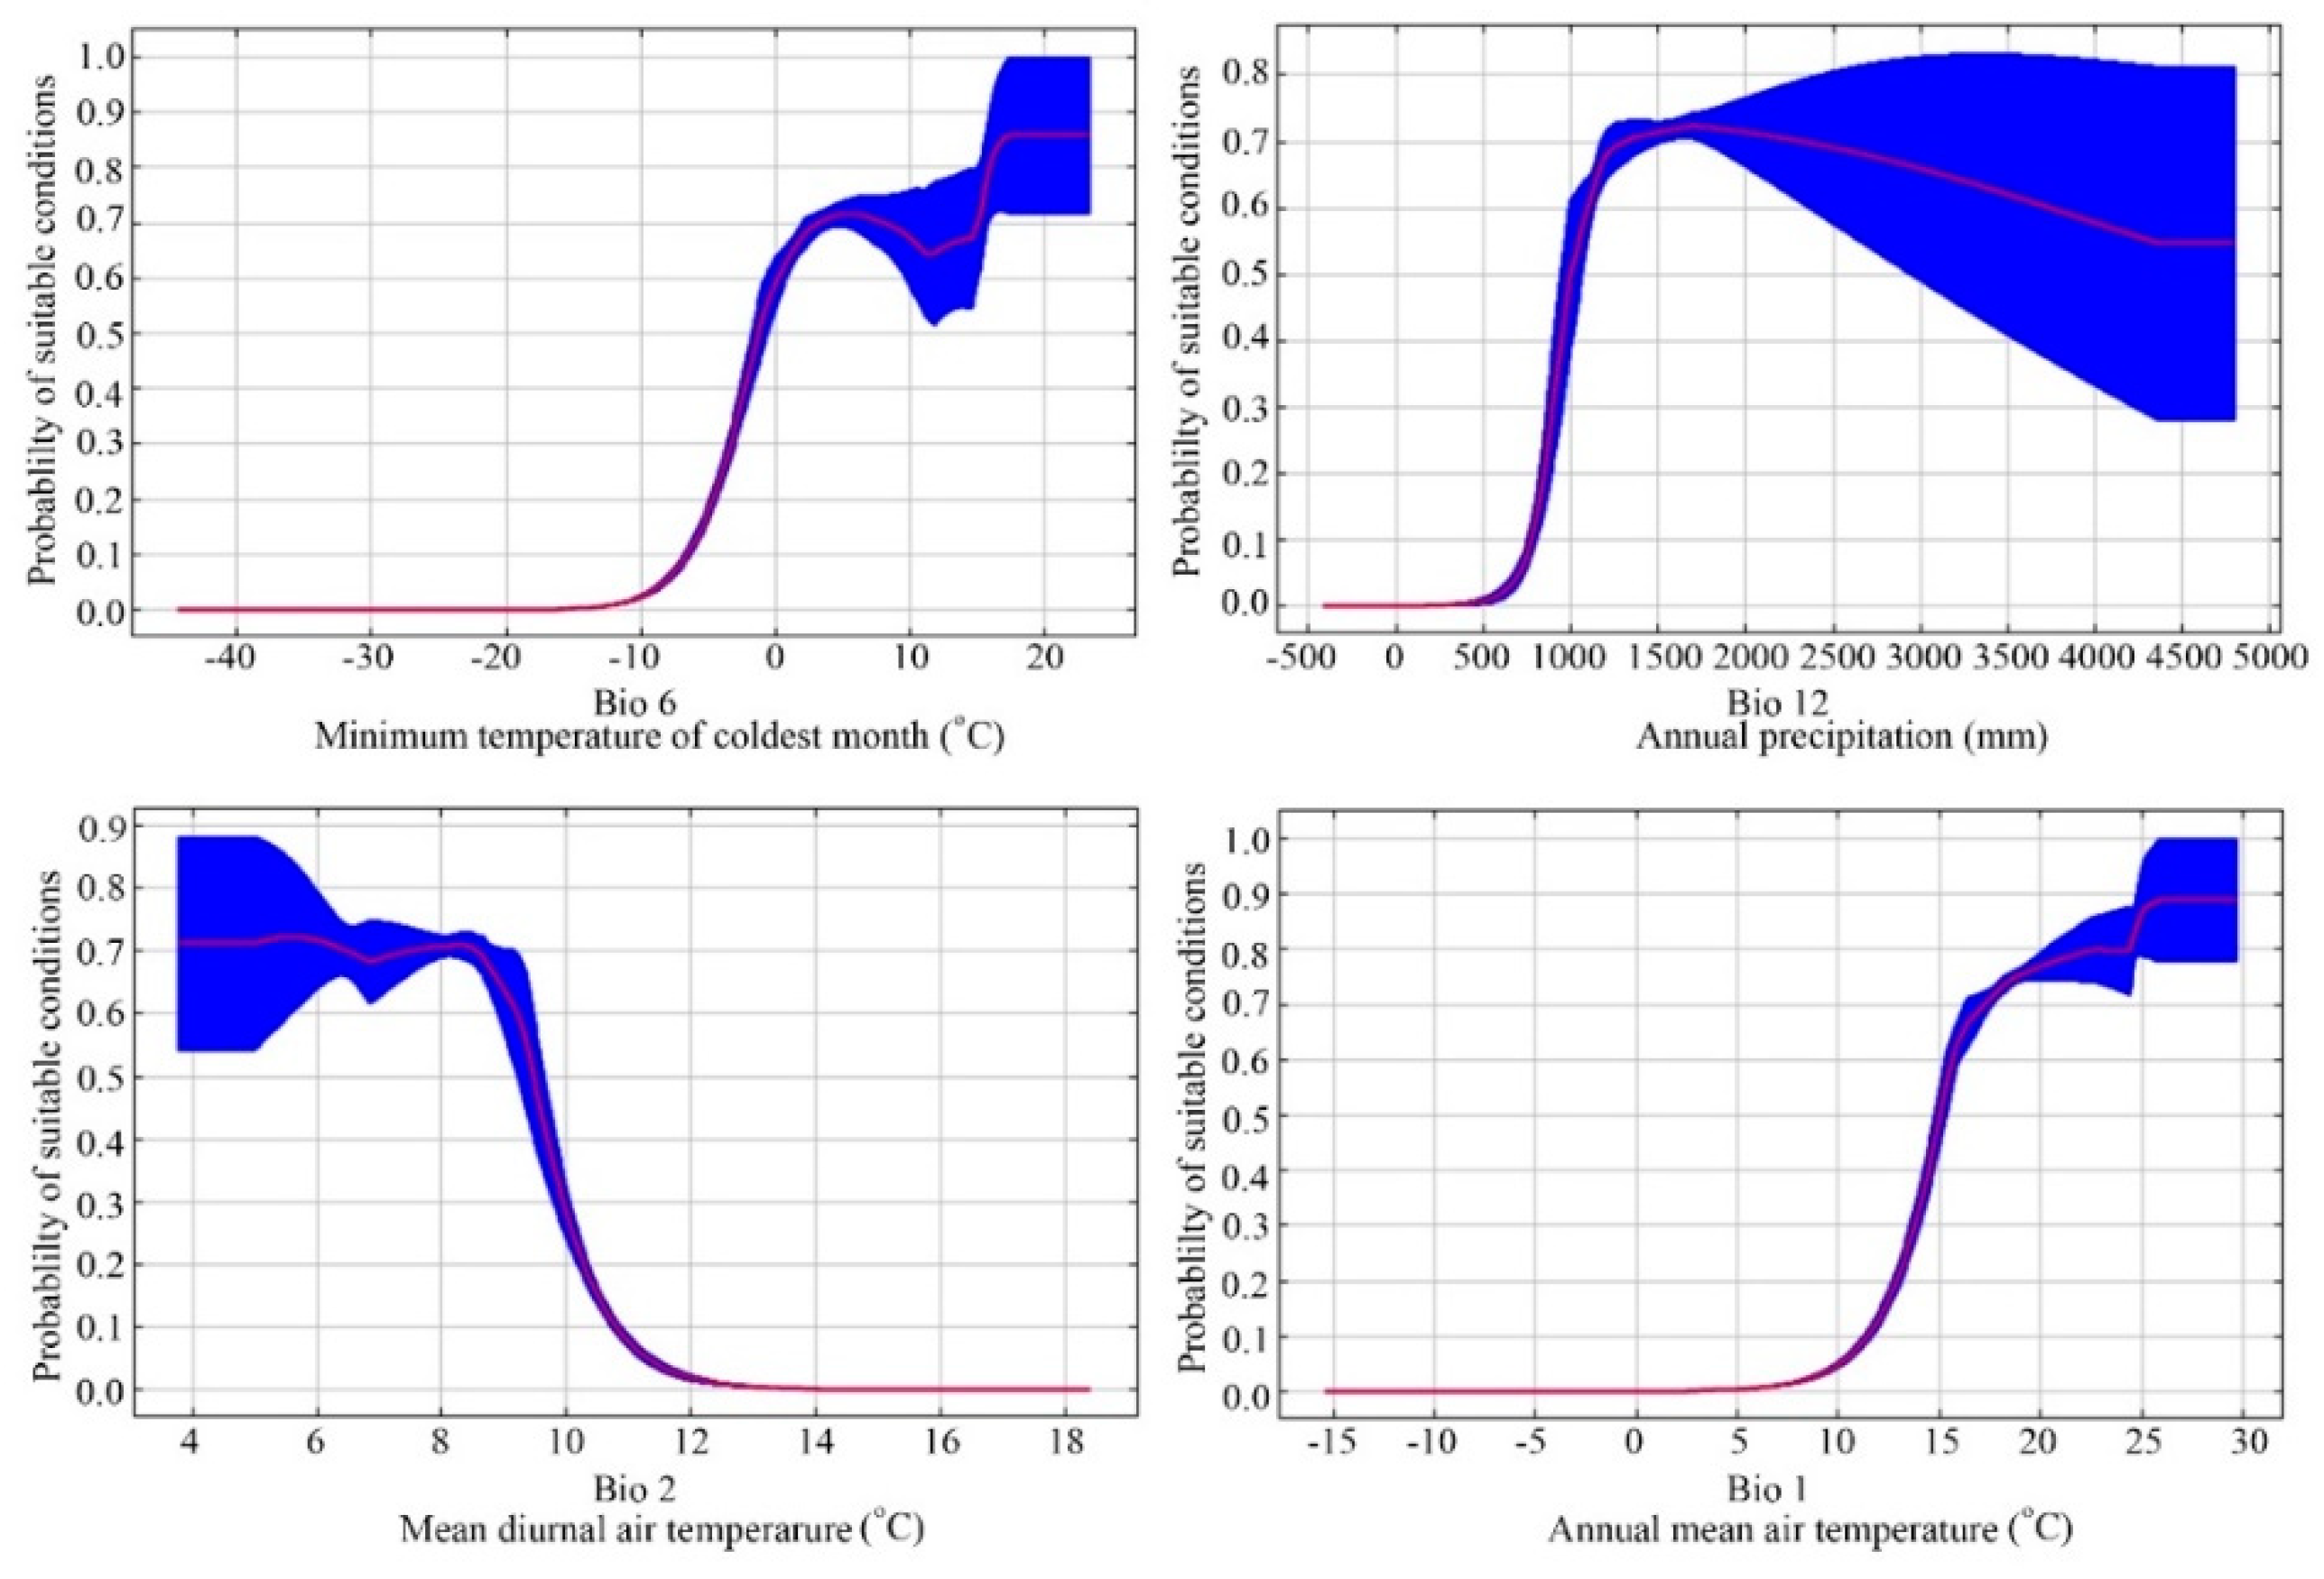
Jackknife tests (Figure 3) analyzed in Maxent on the environmental variables indicated that (Bio 6, Bio 12, Bio 2, and Bio 1 were the most important environmental factors affecting the distribution of E. japonica. Analyzing those response curves (Figure 4) also indicated how the logistic prediction for E. japonica changes while maintaining the remaining predicting factors at their average values. Generally, the minimum temperature of the coldest month and the annual mean temperature showed a positively non-linear response, but a negative nonlinear response for mean diurnal range. The optimum annual precipitation for the probability of E. japonica occurrence was approximately 1000–2000 mm.
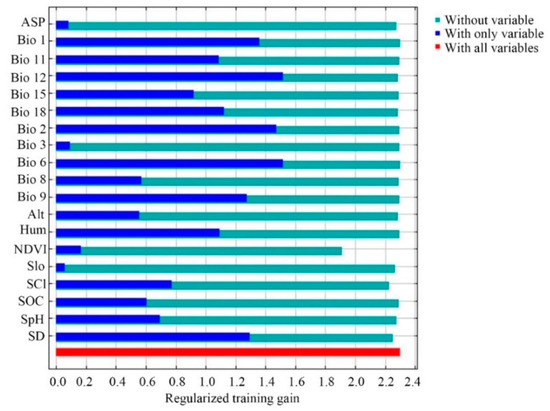
Figure 3.
Jackknife test used to evaluate the relative importance of environmental variables for Euscaphis japonica in China by Maxent.
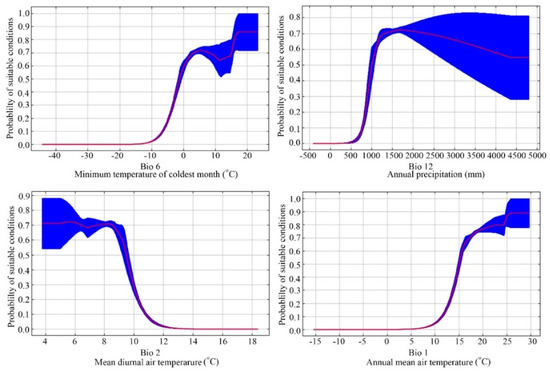
Figure 4.
Average response curves of the main predictor variables of the modeled distribution of Euscaphis japonica based on the Maxent algorithm.
3.3. Changes in Potential Distribution Area under Climate Change
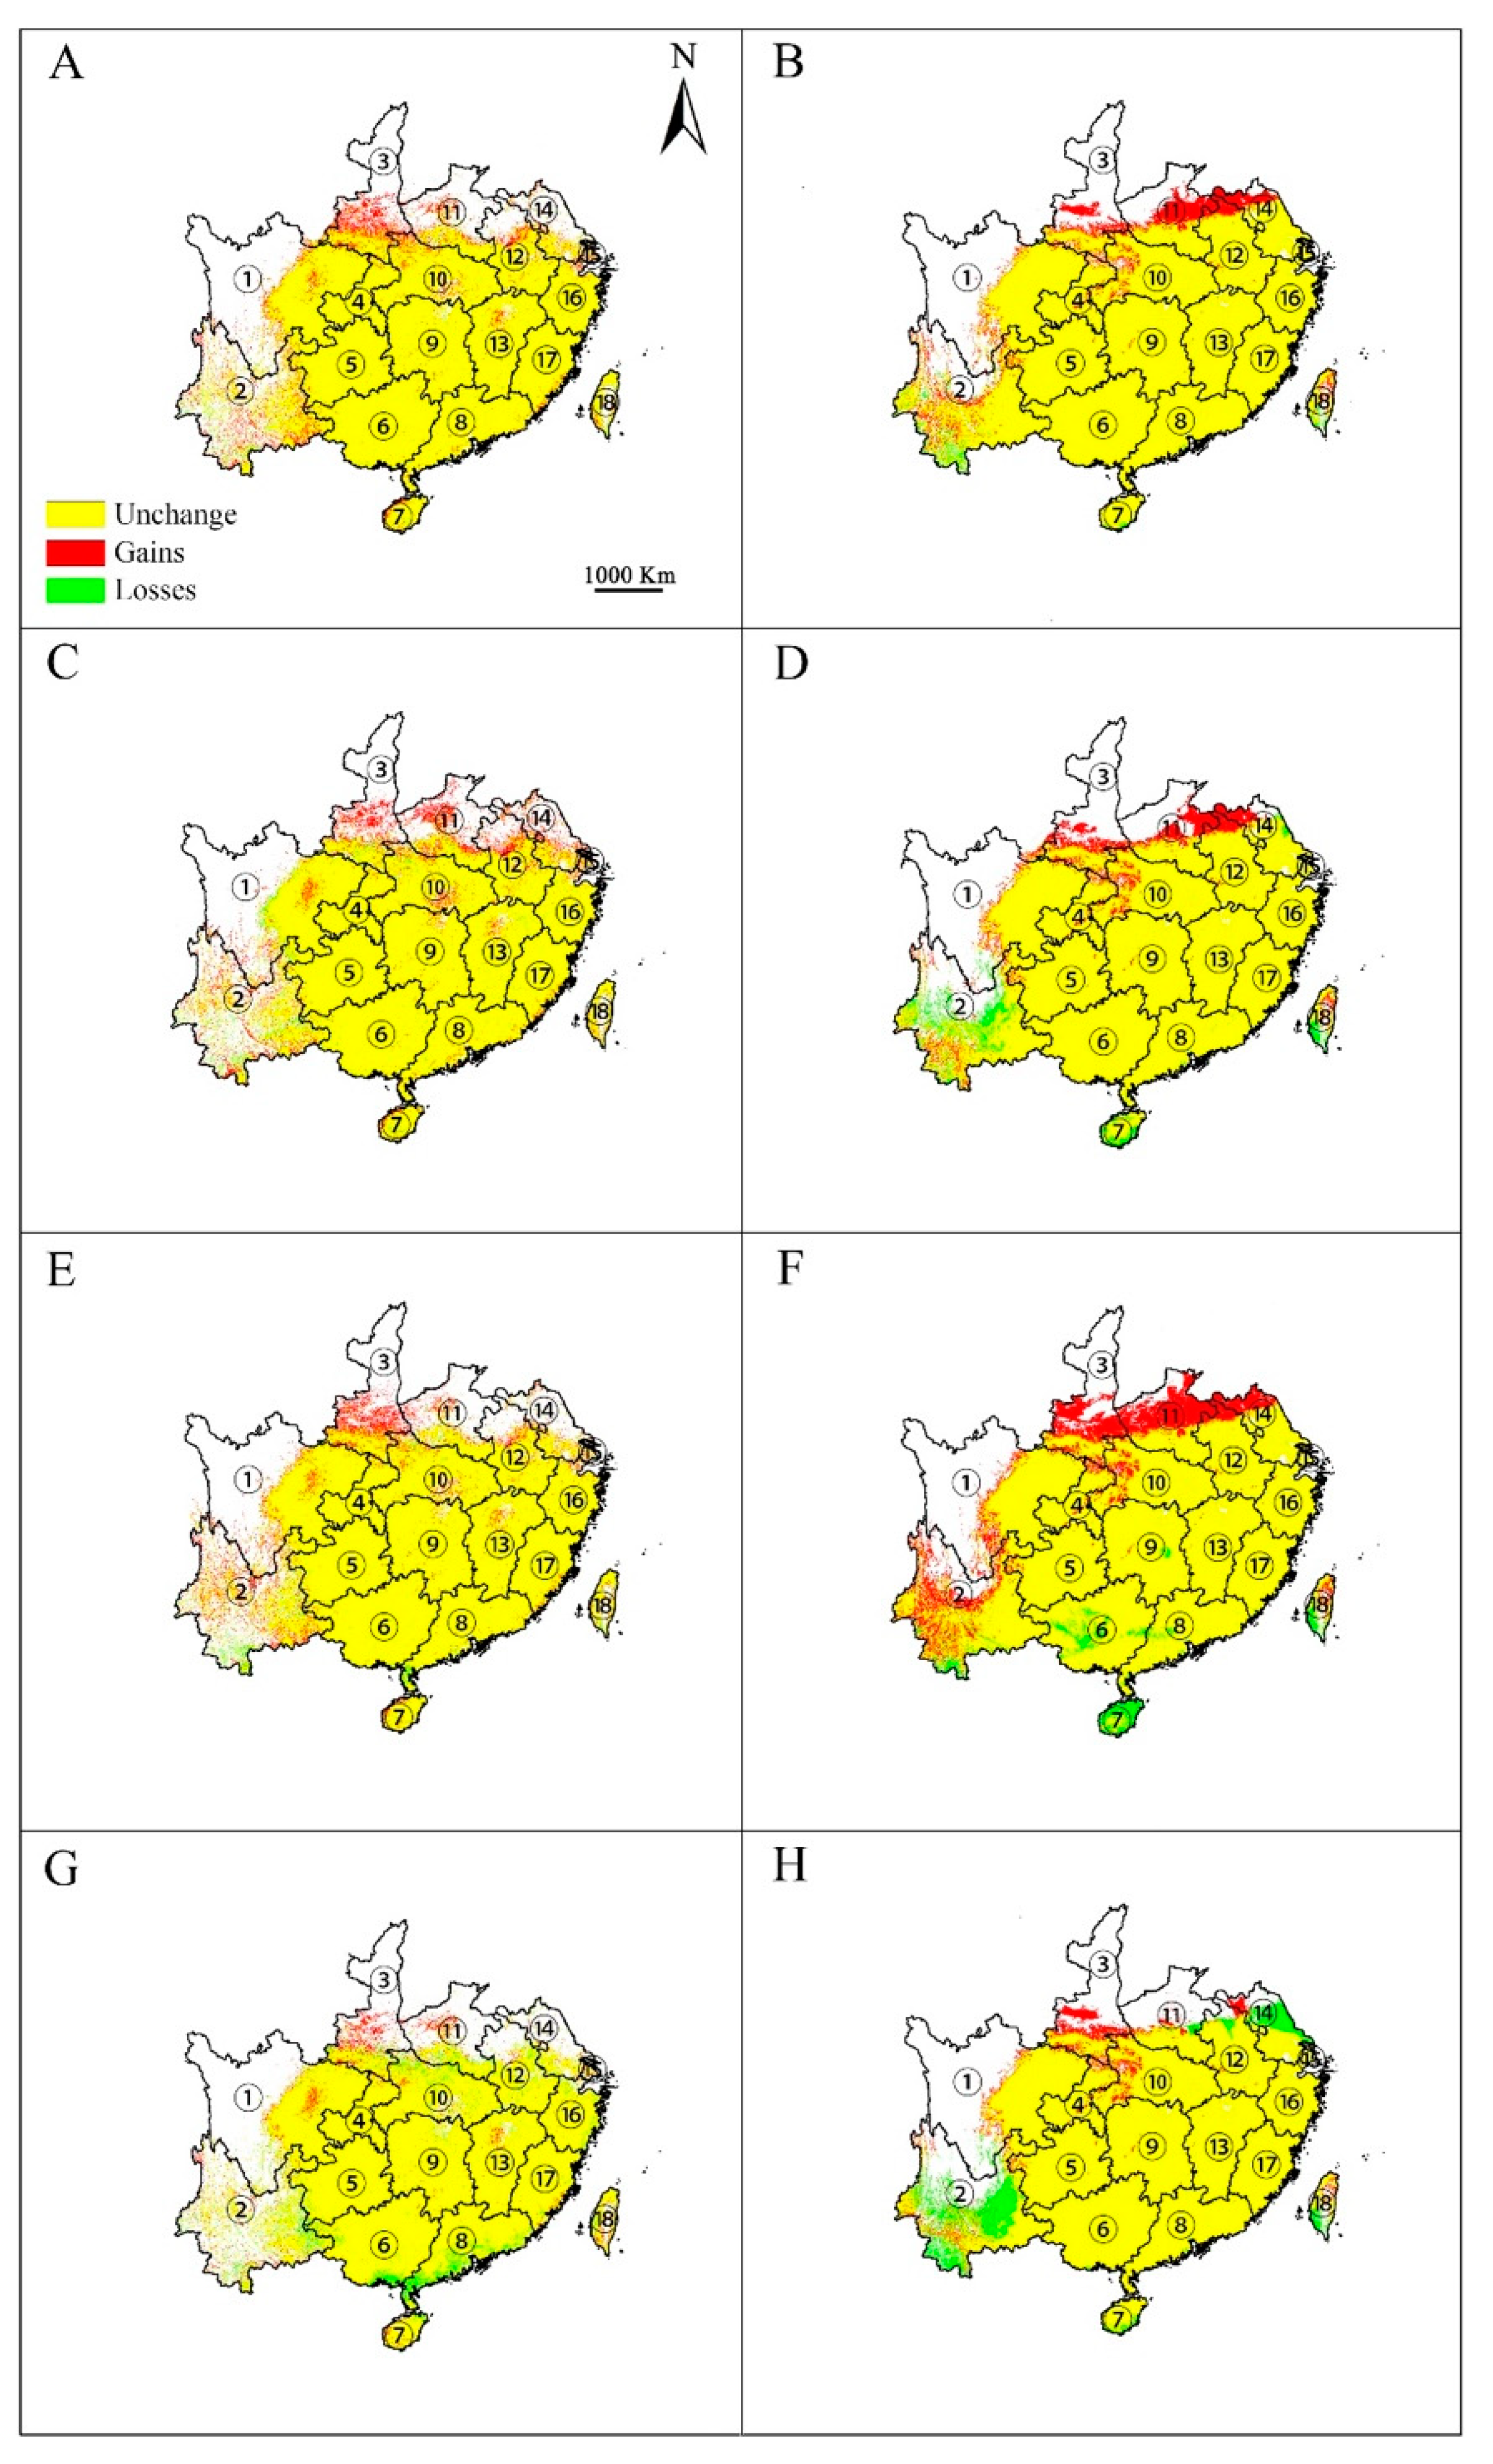
The effects of climate change on the potential distribution of E. japonica were visually analyzed by using both emission scenarios (RCP 2.6 and RCP 8.5) and modeling methods (GARP and Maxent). Overall, both algorithms predicted that the spatial extent of the area of climate suitable for this species will increase under the RCP 2.6 scenario (Figure 5A–D). This increase was predicted to mainly occur in southern Shaanxi, Jiangsu, central Henan, central Anhui, and Yunnan in both 2050 and 2070. In the meantime, both algorithms predicted that some patches in southern Yunnan are likely to lose climatic suitability by 2050 (Figure 5A,B), while by 2070, both algorithms predicted that some additional patches of climatic suitability would continue to be lost; Maxent predicted losses in Yunnan and central Sichuan (Figure 5C) and GARP in Yunnan, Hainan, and Taiwan (Figure 5D). Under the RCP 8.5 greenhouse gas emission scenario, both algorithms predicted that climatic suitability for E. japonica would increase by 2050 (Figure 5E,F) but would decrease by 2070 (Figure 5G,H). In 2050, the areas of increase were predicted to be located at the same provinces as with RCP 2.6. However, Maxent predicted that losses in suitable habitat area for E. japonica would occur in southern Yunnan and southern Guangdong, while GARP predicted that the losses would occur in southern Yunnan, Hainan, Taiwan, Guangdong, and Guangxi. In 2070, Maxent predicted that the area of suitable habitat would increase mainly in Shaanxi, Henan, and Sichuan, and the area would decrease mainly in Yunnan, Guangdong, Guangxi, and northern Hubei (Figure 5G). Meanwhile, GARP predicted that the area of suitable habitat would increase mainly in Shaanxi, Sichuan, and Hubei, and habitat loss would mainly occur in Yunnan, north Jiangsu, and southern Taiwan (Figure 5H).
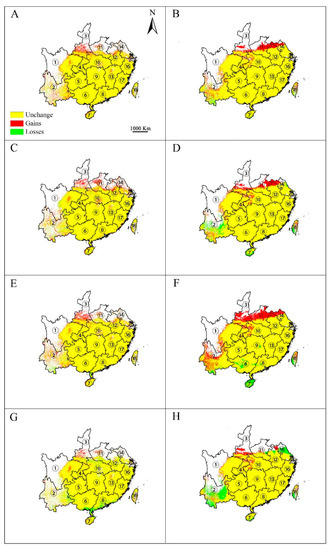
Figure 5.
Changes in distribution area for Euscaphis japonica under climate change scenarios RCP2.6 and RCP8.5 by Maxent (A,C,E,G) and GARP (B,D,F,H). A, B, scenarios for RCP2.6-2050; C, D, scenarios for RCP2.6-2070; E, F, scenarios for RCP8.5-2050; G, H, scenarios for RCP8.5-2070. ① Sichuan; ② Yunnan; ③ Shanxi; ④ Chongqing; ⑤ Guizhou; ⑥ Guangxi; ⑦ Hainan; ⑧ Guangdong; ⑨ Hunan; ⑩ Hubei; ⑪ Henan; ⑫ Anhui; ⑬ Jiangxi; ⑭ Jiangsu; ⑮ Shanghai; ⑯ Zhejiang; ⑰ Fujian; ⑱ Taiwan. Only the provinces where E. japonica is predicted to occur are shown.
4. Discussion
4.1. Predictive Capabilities of GARP and Maxent
Predicting the suitable habitat for E. japonica in China is critical for helping in the use, management, and cultivation of this species. Despite the differences among various SDMs, this method can provide a vital investigation approach used to estimate and predict species distributional changes. However, each SDM has its respective strengths and limitations. Using multiple SDMs has become critical to selecting an appropriate modelling method that can be used to predict the distribution of a variety of species. In the present study, both Maxent and GARP achieved good performances based on the three evaluation criteria (AUC, Kappa, and TSS; Table 1). However, the value of those three evaluation criteria of GARP was significantly higher than Maxent, indicating that GARP outperformed than Maxent.
From the geographic point of view, we found the predicted distribution maps of both algorithms were consistent with the currently known location records. Nonetheless, Maxent failed to detect a range edge for known sites in Anhui and Jiangsu provinces, probably because there were not enough samples from that area; meanwhile, GARP accurately predicted the majority of the known range in Anhui and Jiangsu. GARP might perform better in predicting distributions when incomplete coordinate sets were used [39]. Also, those possible geographic distributions with high suitability predicted by GARP were continuous and cover a large area, whereas those predicted by Maxent was scattered and small. These results may have occurred because GARP and Maxent have basic differences; GARP tends to result in models with a greater number of errors of commission than Maxent; that is, it would predict broader areas of suitable habitat [40].
4.2. Climate Preference of E. japonica
Determining which environmental factor is shaping and maintaining a species geographical distribution is a critical issue in ecology and evolution. Among the 19 environmental parameters adopted within this model, the most important ones that explained the species’ environmental requirements best were three parameters derived from temperature and one derived from precipitation, i.e., mean annual temperature (Bio 1), the lowest temperature in the coldest month (Bio 6), the annual rainfall (Bio 12), and the average diurnal range (Bio 2).
The tolerance of a particular range of temperatures is one of the most important features used to explain the latitudinal distribution of a species [41]. E. japonica generally grows in warm and humid regions with a mean annual temperature and precipitation of about 15 °C and 1500 mm, respectively. This finding agrees with the known climatic preferences of E. japonica [21]. Variations in temperature affected the distribution E. japonica through affecting germination, water absorption, photosynthesis, transpiration, respiration, reproduction and growth. Low winter temperature has been suggested to affect the dormancy breaking of E. japonica seeds [42]. Also, the annual mean air temperature of our field records (points of location) showed that E. japonica does not occur in regions with means <12.1 °C.
Similar to temperature, precipitation directly affects the growth and morphology [43,44], phenology [22] and accumulation of plant biomass of E. japonica [43]. With a decreased amount of rainfall, the resulting plant height, the rate of biomass accumulation, and seed production of E. japonica decreased [43]. Moreover, patterns and annual amounts of precipitation serve as important factors in plant regeneration and survival as well as in other ecosystem functions. As a result, all of these factors can affect the creation of the ultimate ecological adaptation and distribution of E. japonica.
4.3. Impacts on E. japonica Forest Ecosystems and Implications for Biodiversity Conservation
At present, the frequency and severity of extreme weather events are also increasing year by year. Plants respond to climate change by adaptation, migration, or extinction. In our study, both algorithms and emissions scenarios predicted the spatial extent of suitable climate for E. japonica to geographically expand due to global warming, particularly in a northerly direction, especially in south Shaanxi, central Anhui, north Henan, and Jiangsu, which, under current conditions, is recognized in the literature and our current climatic data-based model to be inappropriate. Those projected climate changes may provide migration opportunities for E. japonica to move into novel areas northward to the latitude barrier driven by climate.
However, the predicted shifts may also greatly affect the current E. japonica predominated ecosystems and may also affect the dependent/related flora and fauna. This may lead to the regional or local disappearance of E. japonica, and the presence or replacement of entire ecosystems by additional types of ecosystems [4]. The altered temperature and rainfall regimes can also give rise to E. japonica phenological shifts, and this may indirectly affect the dependent faunal and floral species. Moreover, climate change may adversely affect numerous insects, mammals, and terrestrial birds indirectly or directly because they rely on E. japonica seeds, fruits, and flowers [12]. Therefore, new guidelines will need to be created in support of sustainable forest management under predicted climate change.
First, our results may be adopted for categorizing those natural habitats into high or low risk in the presence of climate changes, to inform conservation planning. For example, under the future climatic situations, at high risk sites, land managers should introduce other species that were evaluated to be appropriate for specific climatic situations, rather than continue to make new plantations of E. japonica. Second, the models used here predicted that some areas may become climatically suitable for this species outside of its native range. Assisted migration may be used as a conservation strategy, which may help these species to reach the new appropriate sites in the presence of the changing climate [45]. In addition, E. japonica forests are extensively distributed across a broad climate range, and the species may also be able to adapt to new climatic conditions [2]. Therefore, it is important to exploit the phenotypic plasticity and to select appropriate adaptive genotypes for future climatic situations, so as to enhance the tolerance of E. japonica [41]. The ‘no change’ and ‘gain’ areas within the climatic space across various ecoregions for E. japonica identified in this study may serve as the possible refugia of climate change.
4.4. Limitations and Future Research Directions
Predicting the shifts in the ranges of species under future global climates creates a major challenge for conservation biogeography [4,46]. Although SDM has been widely used in predicting the range shifts, each model is associated with the drawbacks that limited its predictive accuracy [19,29,47]. For example, the location dataset of E. japonica was compiled based on various sources, but may have a certain amount of sampling bias. Therefore, we created bias files within the models to limit sampling errors [29]. In addition, although BCC-CSM 1.1 has been recommended to be used in studies investigating the climate changes across China, the nature of climate change is uncertain, and hence the projected distribution/suitability of habitat are also uncertain [2,48]. Moreover, various important environmental factors that may affect the distribution of E. japonica, such as inter/intraspecific competition, predation, dispersal capabilities, anthropogenic influence, and geographical barriers, were not incorporated into our models because robust data were lacking. Therefore, future studies need to incorporate these factors into their analysis [18].
5. Conclusions
SDM has been extensively used to guide forest management under the threat of future global climate change [2,45]. Given our results and earlier biological information, we suggest that the distribution of E. japonica is mainly driven by the effects of the minimum temperature of the coldest month (Bio 6), annual precipitation (Bio 12), mean diurnal range (Bio 2), and annual mean temperature (Bio 1) on its fitness. Our results indicate that the temperate and subtropical regions of eastern China where the species had been recorded was highly suitable for E. japonica growth. Under climate change scenarios, the climatic niche of E. japonica expanded geographically further toward the north. The maps produced in our study give a quantitative view of the risks associated with regional climate that could impact E. japonica cultivation. Moreover, the methods proposed in this study may be adopted to quantify the distribution of other threatened and endangered species and may provide background data for field surveys as well as information that will support conservation and restoration efforts.
Author Contributions
J.T., K.Z. and L.S. collected the data; L.S. and K.Z. analyzed the data; L.S. and J.T. drafted the manuscript while consulting all coauthors. All authors commented on the manuscript and contributed to the final version. All authors have read and agreed to the published version of the manuscript.
Funding
This research was funded by the Forestry Science and Technology Promotion and Demonstration Fund of Central Finance ([2018]TG08); and the Construction of Jiangsu Modern Agricultural Industry Technology System (JATS[2019]448).
Conflicts of Interest
The authors declare no conflict of interest.
References
- Poortinga, W.; Whitmarsh, L.; Steg, L.; Böhm, G.; Fisher, S. Climate change perceptions and their individual-level determinants: A cross-European analysis. Glob. Environ. Chang. 2019, 55, 25–35. [Google Scholar] [CrossRef]
- Hossain, M.S.; Arshad, M.; Qian, L.; Kächele, H.; Khan, I.; Islam, M.D.I.; Mahboob, M.G. Climate change impacts on farmland value in Bangladesh. Ecol. Indic. 2020, 112, 106181. [Google Scholar] [CrossRef]
- Pearson, R.G.; Stanton, J.C.; Shoemaker, K.T.; Aiello-Lammens, M.E.; Ersts, P.J.; Horning, N.; Fordham, D.A.; Raxworthy, C.J.; Ryu, H.Y.; McNees, J.; et al. Life history and spatial traits predict extinction risk due to climate change. Nat. Clim. Chang. 2014, 4, 217–221. [Google Scholar] [CrossRef]
- Román-Palacios, C.; Wiens, J.J. Recent responses to climate change reveal the drivers of species extinction and survival. Proc. Natl. Acad. Sci. USA 2020, 117, 4211–4217. [Google Scholar] [CrossRef] [PubMed]
- Timm, K.M.; Maibach, E.W.; Boykoff, M.; Myers, T.A.; Broeckelman-Post, M.A. The prevalence and rationale for presenting an opposing viewpoint in climate change Reporting: Findings from a US national survey of TV weathercasters. Weather Clim. Soc. 2020, 12, 103–115. [Google Scholar] [CrossRef]
- Yan, H.; Feng, L.; Zhao, Y.; Feng, L.; Wu, D.; Zhu, C. Prediction of the spatial distribution of Alternanthera philoxeroides in China based on ArcGIS and MaxEnt. Glob. Ecol. Conserv. 2020, 21, e00856. [Google Scholar] [CrossRef]
- Negrini, M.; Fidelis, E.G.; Picanço, M.C.; Ramos, R.S. Mapping of the Steneotarsonemus spinki invasion risk in suitable areas for rice (Oryza sativa) cultivation using MaxEnt. Exp. Appl. Acarol. 2020, 80, 445–461. [Google Scholar] [CrossRef]
- Gonzalez, P.; Kroll, B.; Vargas, C.R. Tropical rainforest biodiversity and aboveground carbon changes and uncertainties in the Selva Central, Peru. For. Ecol. Manag. 2014, 312, 78–91. [Google Scholar] [CrossRef]
- Peterson, A.T.; Papes, M.; Eaton, M. Transferability and model evaluation in ecological niche modeling: A comparison of GARP and Maxent. Ecography 2007, 30, 550–560. [Google Scholar] [CrossRef]
- Zhang, W.X.; Kou, Y.X.; Zhang, L.; Zeng, W.D.; Zhang, Z.Y. Suitable distribution of endangered species Pseudotaxus chienii (Cheng) Cheng (Taxaceae) in five periods using niche modeling. Chin. J. Ecol. 2020, 39, 600–613. [Google Scholar]
- Yi, F.; Wang, Z.; Baskin, C.C.; Baskin, J.M.; Ye, R.; Sun, H.; Zhang, Y.; Ye, X.; Liu, G.; Yang, X.; et al. Seed germination responses to seasonal temperature and drought stress are species-specific but not related to seed size in a desert steppe: Implications for effect of climate change on community structure. Ecol. Evol. 2019, 9, 2149–2159. [Google Scholar] [CrossRef] [PubMed]
- Butt, N.; Seabrook, L.; Maron, M.; Law, B.S.; Dawson, T.P.; Syktus, J.I.; McAlpne, A. Cascading effects of climate extremes on vertebrate fauna through changes to low-latitude tree flowering and fruiting phenology. Glob. Chang. Biol. 2015, 21, 3267–3277. [Google Scholar] [CrossRef] [PubMed]
- Li, Y.; Tang, Z.Y.; Yan, Y.J.; Wang, K.; Cai, L.; He, J.S.; Gu, S.; Yao, Y.J. Incorporating species distribution model into the red list assessment and conservation of macrofungi: A case study with Ophiocordyceps sinensis. Biodiver. Sci. 2020, 28, 99–106. [Google Scholar]
- Guisan, A.; Zimmermann, N.E. Predictive habitat distribution models in ecology. Ecol. Model. 2000, 135, 147–186. [Google Scholar] [CrossRef]
- Rojas-Soto, O.R.; Martinez-Meyer, E.; Navarro-Siguenza, A.G.; de Ita, A.O.; de Silva, H.G.; Peterson, A.T. Modeling distributions of disjunct populations of the Sierra Madre Sparrow. J. Field Ornithol. 2008, 79, 245–253. [Google Scholar] [CrossRef]
- Carvalho, S.B.; Brito, J.C.; Crespo, E.G.; Watts, M.E.; Possingham, H.P. Conservation planning under climate change: Toward accounting for uncertainty in predicted species distributions to increase confidence in conservation investments in space and time. Biol. Conserv. 2011, 144, 2020–2030. [Google Scholar] [CrossRef]
- Bonizzoni, M.; Gasperi, G.; Chen, X.G.; James, A.A. The invasive mosquito species Aedes albopictus: Current knowledge and future perspectives. Trends Parasitol. 2013, 29, 460–468. [Google Scholar] [CrossRef]
- Pearson, R.G.; Dawson, T.P. Predicting the impacts of climate change on the distribution of species: Are bioclimate envelope models useful? Glob. Ecol. Biogeogr. 2003, 12, 361–371. [Google Scholar] [CrossRef]
- Elith, J.; Graham, C.H.; Anderson, R.P.; Dudík, M.; Ferrier, S.; Guisan, A.; Hijmans, R.; Huettmann, F.; Leathwick, J.R.; Lehmann, A.; et al. Novel methods improve prediction of species’ distributions from occurrence data. Ecography 2006, 29, 129–151. [Google Scholar] [CrossRef]
- Stockwell, D.; Noble, I. Induction of sets of rules from animal distribution data: A robust and informative method of data analysis. Math. Comput. Simulat. 1992, 33, 385–390. [Google Scholar] [CrossRef]
- Long, C.; Song, H. China Diesel Plant; Science Press: Beijing, China, 2012. [Google Scholar]
- Shao, X. Study on Reproductive Biology of Euscaphis konishlii. Master’s Thesis, Jiangxi Agricultural University, Nanchang, China, 2016. [Google Scholar]
- Cai, B.; Guo, H.; Zhang, X.; Chen, X.; Liu, S. Biodiversity of the excellent ornamental plant Euscaphis japonica. Acta. Hortic. 2017, 1185, 73–78. [Google Scholar] [CrossRef]
- Man, X.; Tan, Y.; Pei, G. Research progress on chemical constituents and pharmacological activities of Euscaphis plants from China. Nat. Prod. Res. Dev. 2019, 31, 723–730. [Google Scholar]
- Boitani, L.; Maiorano, L.; Baisero, D.; Falcucci, A.; Visconti, P.; Rondinini, C. What spatial data do we need to develop global mammal conservation strategies? Philos. Trans. R. Soc. Lond. B Biol. Sci. 2011, 366, 2623–2632. [Google Scholar] [CrossRef] [PubMed]
- Yi, Y.J.; Cheng, X.; Yang, Z.F.; Zhang, S.H. Maxent modeling for predicting the potential distribution of endangered medicinal plant (H. riparia Lour) in Yunnan, China. Ecol. Eng. 2016, 92, 260–269. [Google Scholar] [CrossRef]
- Murienne, J.; Guilbert, E.; Grandcolas, P. Species’ diversity in the New Caledonian endemic genera Cephalidiosus and Nobarnus (Insecta: Heteroptera: Tingidae), an approach using phylogeny and species’ distribution modelling. Biol. J. Soc. 2009, 97, 177–184. [Google Scholar] [CrossRef]
- Wu, T.; Song, L.; Li, W.; Wang, Z.; Zhang, H.; Xin, X.; Zhang, Y.; Zhang, L.; Li, J.; Wu, F.; et al. An overview of BCC climate system model development and application for climate change studies. J. Meteorol. Res. 2019, 28, 34–56. [Google Scholar] [CrossRef]
- Phillips, S.J.; Anderson, R.P.; Schapire, R.E. Maximum entropy modeling of species geographic distributions. Ecol. Model. 2006, 190, 231–259. [Google Scholar] [CrossRef]
- Hernandez, P.A.; Graham, C.H.; Master, L.L.; Albert, D.L. The effect of sample size and species characteristics on performance of different species distribution modeling methods. Ecography 2006, 29, 773–785. [Google Scholar] [CrossRef]
- Merow, C.; Smith, M.J.; Silander, J.A. A practical guide to MaxEnt for modeling species’ distributions: What it does, and why inputs and settings matter. Ecography 2013, 36, 1058–1069. [Google Scholar] [CrossRef]
- Stockwell, D.; Peters, D. The GARP modelling system: Problems and solutions to automated spatial prediction. Int. J. Geogr. Inf. Sci. 1999, 13, 143–158. [Google Scholar] [CrossRef]
- Anderson, R.P.; Lew, D.; Peterson, A.T. Evaluating predictive models of species’ distributions: Criteria for selecting optimal models. Ecol. Model. 2003, 162, 211–232. [Google Scholar] [CrossRef]
- Cohen, J. A coefficient of agreement for nominal scales. Educ. Psychol. Meas. 1960, 20, 37–46. [Google Scholar] [CrossRef]
- Allouche, O.; Tsoar, A.; Kadmon, R. Assessing the accuracy of species distribution models: Prevalence, kappa and the true skill statistic (TSS). J. Appl. Ecol. 2006, 43, 1223–1232. [Google Scholar] [CrossRef]
- Fielding, A.H.; Bell, J.F. A review of methods for the assessment of prediction errors in conservation presence/absence models. Environ. Conserv. 1997, 24, 38–49. [Google Scholar] [CrossRef]
- Swets, J.A. Measuring the accuracy of diagnostic systems. Science 1988, 240, 1285–1293. [Google Scholar] [CrossRef]
- Chen, Y.R.; Xie, H.M.; Luo, H.L.; Yang, B.Y.; Xiong, D.J. Impacts of climate change on the distribution of Cymbidium kanran and the simulation of distribution pattern. Chin. J. Appl. Ecol. 2019, 30, 3419–3425. [Google Scholar]
- Costa, G.C.; Nogueira, C.; Machado, R.B.; Colli, G.R. Sampling bias and the use of ecological niche modeling in conservation planning: A field evaluation in a biodiversity hotspot. Biodivers. Conserv. 2010, 19, 883–899. [Google Scholar] [CrossRef]
- Sánchez-Flores, E. GARP modeling of natural and human factors affecting the potential distribution of the invasives Schismus arabicus and Brassica tournefortii in ‘El Pinacate y Gran Desierto de Altar’ Biosphere Reserve. Ecol. Model. 2007, 204, 457–474. [Google Scholar] [CrossRef]
- Larcher, W. Physiological Plant Ecology, 3rd ed.; Springer: Berlin, Germany, 1995. [Google Scholar]
- Kang, W. Studies on seedling growth rhythm and physiological on cold resistance of families of Euscaphis konishii. Master’s Thesis, Jiangxi Agricultural University, Jiangxi, China, 2015. [Google Scholar]
- Zhi, L.; Wu, T.; Long, Y.; Yu, L.; You, Q.; Chen, F.; Hu, S. Leaf physiological characteristics of Euscaphis konishii seedlings in drought stress. J. Fujian Coll. For. 2008, 28, 190–192. [Google Scholar]
- Jia, X.; Ma, F.F.; Zhou, W.M.; Zhou, L.; Yu, D.P.; Qin, J.; Dai, L.M. Impacts of climate change on the potential geographical distribution of broadleaved Korean pine (Pinus koraiensis) forests. Acta Ecol. Sin. 2017, 37, 464–473. [Google Scholar]
- Hällfors, M.H.; Aikio, S.; Fronzek, S.; Hellmann, J.J.; Ryttäri, T.; Heikkinen, R.K. Assessing the need and potential of assisted migration using species distribution models. Biol. Conserv. 2016, 196, 60–68. [Google Scholar] [CrossRef]
- Liu, Q.; Wang, Y.K.; Peng, P.H.; Lu, Y.F.; Chen, Y.F.; Wang, S. Characteristics of distribution and migration of species in Sichuan under the climate change. Mount. Res. 2016, 34, 716–723. [Google Scholar]
- Yang, L.; Yang, L.; Li, J.X.; Zhang, C.; Huo, Z.M.; Luan, X.F. Potential distribution and conservation priority areas of five species in Northeast China. Acta Ecol. Sin. 2019, 39, 1082–1094. [Google Scholar]
- Wiens, J.A.; Stralberg, D.; Jongsomjit, D.; Howell, C.A.; Snyder, M.A. Niches, models, and climate change: Assessing the assumptions and uncertainties. Proc. Natl. Acad. Sci. USA 2009, 106, 19729–19736. [Google Scholar] [CrossRef] [PubMed]
© 2020 by the authors. Licensee MDPI, Basel, Switzerland. This article is an open access article distributed under the terms and conditions of the Creative Commons Attribution (CC BY) license (http://creativecommons.org/licenses/by/4.0/).

