Article

Within-Site Variability of Liana Wood Anatomical Traits: A Case Study in Laussat, French Guiana

by
Félicien Meunier
1,2,
Sruthi M. Krishna Moorthy
1,
Hannes P. T. De Deurwaerder
1,
Robin Kreus
1,
Jan Van den Bulcke
3,
Romain Lehnebach
3 and
Hans Verbeeck
1,*
1
UGent-CAVElab—Computational and Applied Vegetation Ecology lab, Department of Environment, Ghent University, 9000 Ghent, Belgium
2
Ecological Forecasting Lab, Department of Earth and Environment, Boston University, Boston, MA 02215, USA
3
UGent-Woodlab, Laboratory of Wood Technology, Department of Environment, Ghent University, 9000 Ghent, Belgium
*
Author to whom correspondence should be addressed.
Forests 2020, 11(5), 523; https://doi.org/10.3390/f11050523
Submission received: 17 March 2020 / Revised: 23 April 2020 / Accepted: 4 May 2020 / Published: 7 May 2020
(This article belongs to the Special Issue Wood Structure and Properties)

Abstract

:
Research Highlights: We investigated the variability of vessel diameter distributions within the liana growth form among liana individuals originating from a single site in Laussat, French Guiana. Background and Objectives: Lianas (woody vines) are key components of tropical forests. Lianas are believed to be strong competitors for water, thanks to their presumed efficient vascular systems. However, unlike tropical trees, lianas are overlooked in field data collection. As a result, lianas are often referred to as a homogeneous growth form while little is known about the hydraulic architecture variation among liana individuals. Materials and Methods: We measured several wood hydraulic and structural traits (e.g., basic specific gravity, vessel area, and vessel diameter distribution) of 22 liana individuals in a single sandy site in Laussat, French Guiana. We compared the liana variability of these wood traits and the correlations among them with an existing liana pantropical dataset and two published datasets of trees originating from different, but species-rich, tropical sites. Results: Liana vessel diameter distribution and density were heterogeneous among individuals: there were two orders of magnitude difference between the smallest (4 µm) and the largest (494 µm) vessel diameters, a 50-fold difference existed between extreme vessel densities ranging from 1.8 to 89.3 vessels mm−2, the mean vessel diameter varied between 26 µm and 271 µm, and the individual theoretical stem hydraulic conductivity estimates ranged between 28 and 1041 kg m−1 s−1 MPa−1. Basic specific gravity varied between 0.26 and 0.61. Consequently, liana wood trait variability, even within a small sample, was comparable in magnitude with tree surveys from other tropical sites and the pantropical liana dataset. Conclusions: This study illustrates that even controlling for site and soil type, liana traits are heterogeneous and cannot be considered as a homogeneous growth form. Our results show that the liana hydraulic architecture heterogeneity across and within sites warrants further investigation in order to categorize lianas into functional groups in the same way as trees

Graphical Abstract

1. Introduction

Lianas (woody vines) are increasing in abundance and biomass across the neotropics [1]. Mechanistic understanding behind the current liana proliferation remains, as of today, unclear but could find its roots in the efficiency of the liana vascular system in accessing below-ground resources [2]. However, lianas remain understudied to this day and generally ignored in plot-scale studies [3]. In the absence of sufficient data, it remains impossible to validate the hypothesis of the specific advantage of lianas over trees for acquiring water and below-ground resources. Moreover, this lack of liana traits information hinders the development of reliable vegetation models which would allow predictive assessments of liana dynamics under changing climate [4].
It is important to forecast the abundance of lianas and their impact on the ecosystem as they are a critical component of tropical forests. Lianas indeed act as structural parasites, using the structure of self-supporting growth forms (e.g., trees) to climb up and reach the open canopy [5]. In disturbed or water-limited tropical ecosystems, they can represent up to 40% of woody stems [2], and about one third of the forest leaf biomass [6]. By increasing the competition for resources (water, nutrients, and light), lianas reduce tree growth, increase tree mortality [7], and decrease ecosystem carbon uptake capacity [8] and reinforce the general trend of the forest carbon sink decline [9].
In the past, the lianescent growth forms have been correlated with wide [10,11,12] and long [13] vessels, responsible for its hydraulic-efficiency, right-skewed vessel diameter distribution [14,15], and high sapwood-specific hydraulic conductivity [16,17,18,19]. Liana wood has also been associated with larger amounts of axial parenchyma, larger rays, and longer fibers than tree wood [20]. These properties presumably make liana vascular systems competitive hydraulic architectures and may explain why lianas exhibit higher transpiration rates, less negative predawn leaf water potentials, and larger growth rates compared to trees during the dry season [16,21,22,23,24]. However, the data supporting these conclusions were collected from a low number of liana species in a limited number of study sites. All in all, liana woody trait data remain particularly sparse in the existing literature.
Consequently, unlike trees that are often categorized into functional groups, lianas, when taken into account, are most of the time considered a homogeneous growth form (e.g., a single plant functional type in vegetation models or a single category in statistical models [25]) while several studies have shown that the ranges of variation in liana allometries [26,27] and traits [28] largely overlap those of trees. The actual heterogeneity of liana woody traits is largely unknown even though seminal studies have shown that liana hydraulic properties vary pantropically [29], and even locally [30].
To contribute to resolving this lack of data, we sampled 22 individuals, belonging to 10 liana families within a single tropical forest plot in Laussat, French Guiana. We assessed the vessel diameter distribution of each liana individual and measured some key wood variables. We investigated the correlations between wood liana traits related to water transport. Finally, we estimated the liana trait variability at the local scale and compared this variability with an existing global liana dataset and data of tree traits from single tropical sites.

2. Materials and Methods

2.1. Study Site

Field work was conducted during a period of three days (23–25 May 2018) in the tropical rainforest of Laussat, French Guiana (05°28′ N, 053°34′ W). The site is located in the north-west of French Guiana, which is characterized by a tropical rainforest climate. Mean annual precipitation is about 2400 mm, the mean dry season about 36.8 days long, and the annual mean temperature around 26 °C [31]. The site is located in close vicinity of the national road N1 and comprises a secondary forest with three types of soils: terra firme, white sands, and lowland soils (from low to high abundance).

2.2. Liana Sampling and Identification

Individuals were sampled along a 100 m long line transect, 50 m away and parallel to the access trail. The 100 m transect covered a single type of soil (white sands). Stem sections were harvested at 130 cm (where diameter at breast height (DBH) was measured) from the last rooting point, according to Schnitzer and colleagues [32]. Specimens coming from different rooting points were considered as distinct individuals. Sample lengths were at least 15 cm. All sampled lianas reached the canopy. All samples were stored after collection in individual zip bags. Cotton wool soaked with an ethanol solution (50% ethanol, 50% water) was attached to each extremity of the stem sample and covered with aluminum foil to prevent fungal development and drying of the sample. Photographs of the sampled lianas were taken before sample collection to ease liana identification. Samples were kept in isothermal bags and stored in the refrigerator (4 °C) after each field session.
Liana identification was conducted post-sampling thanks to the expertise of liana specialists from the Wood Laboratory of Pariacabo (French Guiana) and the Smithsonian Institute (Washington, DC, USA). As leaves were not reachable from the forest ground, the identification only relied on stem anatomy, climbing mechanism, field photographs, bark aspect, and the presence of exudates. Lianas were identified at the family level, and whenever possible with high level of confidence at the genus level.
In total, 22 individuals were sampled (minimum stem diameter cut-off of 1 cm), 17 of which could be identified at the family level post-sampling (10 different identified families). Among these 22 specimens, 6 different genera could be identified for 10 individuals (Table 1). Even without proper identification, the 22 individuals could be classified into 14 different morpho-species. In Table 1, and throughout the manuscript, numerical arbitrary identifiers are consistently used to distinguish individuals from the same morpho-species.

2.3. Basic Specific Gravity Measurements

Thinner discs (1 cm length) were extracted from the initial 15 cm long samples and polished for stem density measurements, which were achieved on samples including both wood and bark. Mass and volume measurements were conducted seven days after sampling, and samples were re-hydrated by immersing lianas in water 24 h prior to measurement. Saturated volume (Vsat, cm3) was measured by the water displacement method using a Sartorius CP224S balance with a precision of 0.2 mg. Liana samples were then dried for 48 h in an oven (Memmert Type UNE) at 103 °C, and then weighed once more to measure their dry mass (Mdry, g). Basic specific gravity (Gb, unitless) was calculated as the ratio of sample dry mass to its saturated volume [33], normalized by the density of water ρ (1 g cm−3):
G b = M d r y V s a t × 1 ρ

2.4. Vessel Diameter Distribution

Transverse section images of polished cross-sections were taken for each individual before and after oven drying. Cross-section images were acquired at 4800 dpi resolution, using an EPSON V800 flatbed scanner. For each sample, a representative area (i.e., a wedge portion of the cross-section from pith to bark under the condition that the area contained at least 40 vessels) was selected and further analyzed. All the vessels contained in this area were counted and the area was measured using standard annotation tools in ImageJ [34].

2.5. Anatomical Traits

From each cross-section image, we identified, located, and scanned all liana vessels included in the representative area. We counted their total number N and as they were rarely circular, we calculated for each of them (i varying between 1 and N) the equivalent circular diameter Di (m) as:
D i = 4 A i π
where Ai (m2) is the individual vessel area as computed from cross-sections in ImageJ. From the vessel diameter distribution of each sample, we further computed the mean vessel diameter D (m), the hydraulically weighted mean diameter Dh (Equation (3), m), and the theoretical stem conductivity, Kp, derived from the Hagen–Poiseuille equation (Equation (4), kg m−1 s−1 MPa−1), according to [35]:
D h = ( 1 N i D i 4 ) 1 4
K p = π ϱ 128 η V D · D h 4
where ρ and η are the water density and viscosity (respectively 1000 kg m−3 and 1.002 × 10⁻⁹ MPa s), and VD is the vessel density (as calculated by the ratio of N and the total representative area S, m2). Finally, the vessel area fraction, VA (%) was calculated as the fraction of the total sample area occupied by the vessels:
V A = 100 × i ( π D i 2 4 ) S

2.6. Analyses

We measured liana DBH, Gb, and the vessel diameter distributions for each of the 22 studied individuals. From the vessel diameter distribution we further computed the hydraulically-weighted diameter Dh, VD, VA, and specific conductivity Kp for each single specimen. Correlations between all individual variables were assessed through Pearson coefficients and tested for significance. To meet normality assumptions, VD, Kp, D, and Dh were log10-transformed.
To test the bimodal hypothesis of liana vessel diameter distribution, we computed the skewness of each individual vessel diameter distribution [36] and classified the individual into left-skewed (skew < −0.5), right-skewed (skew > 0.5), or not skewed (−0.5 ≤ skew ≤ 0.5).
To compare the variability of liana basic specific gravity in our study site with global estimates, we extracted all measured values corresponding to liana species from the Global Wood Density Database (GWDDB) [37] merged with a growth form database [38].
To get a sense of how the single-site variability we observed in our liana dataset compared with liana global estimates and superimposed the Dh-VD relationship derived from our observations with the liana pantropical dataset of Rosell and Olson [29]. In doing so, we estimated the ranges of variability of both vessel diameter distribution and vessel density that were represented in our liana dataset.
In addition, we performed principal component analysis (PCA) to evaluate how plant traits are associated, after averaging (when possible, i.e., n > 1) the variables for the individuals belonging to the same morpho-species level.
We also compared wood trait variability to the ones observed for tree species in a semi-evergreen forest of La Chonta, Bolivia [39], and in seasonally moist lowland forests in Panama [40]. In their studies, Poorter et al. [39] and Hietz et al. [40] investigated wood trait variability of 42 and 325 tropical tree species, respectively, spread along the wood economic spectrum and covering a large range of life strategies in species-rich rainforests (59 and 166 vascular species ha−1 in both sites, respectively). For this analysis, we also used the morpho-species averages of the woody traits. This aggregation at the morpho-species level was necessary to format our dataset according to the previous studies [39,40]. However, the low number of replications for several liana species limits the quality of the results, which should therefore be interpreted with caution.
All data (including the cross-section images), analyses, figures, tables, and scripts are publicly available at GitHub (repertory femeunier/LianaHydroVar, commit b496640). The polished cross-sections are also contained in the supplementary material of this paper.

3. Results

In total, we measured the size (diameter) of 1239 vessels from 22 liana individuals. The number of vessels we measured per individual varied between 42 and 116 (56 on average, see Table 1). Measured vessel diameter distributions were broad at the individual scales, and therefore over the entire liana dataset (Table 1 and Figure 1). Minimum and maximum measured vessel diameters of the whole liana dataset were 4 and 494 µm, respectively (Table 1). On average, the difference between the largest and the smallest vessel diameter of each liana individual was 248 µm (with a standard deviation of 88 µm between individuals). This difference between extremum-size vessels corresponds to 1.74 times the whole dataset average vessel diameter (142 µm, Table 1). The vessel diameter coefficient of variation ranged between 22% and 163% (Indet3 and Sapindaceae Paullinia spp1 (1), respectively) with a mean of 54% for all 22 studied individuals, and an inter-individual standard deviation of 32%.
More than half of all measured vessels (59%) were larger than 100 µm (Figure 1). At the individual level (Figure 1), the fraction of large vessels (>100 µm) varied between 6% (Sapindaceae Paullinia spp1 (1)) and 100% (Convolvulaceae Maripa spp1 (3)), with a mean of 62% over all individuals. Rubiaceae spp1 (2) was the liana individual with the smallest maximum vessel diameter (124 µm), which almost corresponded to the narrowest vessel (134 µm) of Convolvulaceae Maripa spp1 (3). Only 21% of the measured vessels were smaller than 50 µm and almost half of them were contained in Sapindaceae Paullinia spp1 (1); see Figure 1. More than a quarter (27%) of all vessel diameters were wider than 200 µm. These very large vessels were found in 17 out of the 22 individuals, and when present represented between 3% and 99% of all vessels (Sapindaceae Paullinia spp1 (1) and Convolvulaceae Maripa spp1 (3), respectively).
Nine of the 22 liana vessel diameter distributions could be considered as right-skewed (i.e., many narrow vessels and few wide ones, Figure 1), with a positive skewness >0.5. This implies that more than half of liana individuals (13) were either not-skewed (9, −0.5 ≤ skew ≤ 0.5) or left-skewed (4, skew < −0.5, many wide vessels and few narrow ones).
Hydraulically weighted diameter Dh was found between 77 and 296 µm (Table 1) and was positively correlated with the mean vessel diameter (r = 0.91, p-value < 10−8, Figure 2), and with the Hagen–Poiseuille stem-derived conductivity Kp (r = 0.82, p-value < 0.001, Figure 2). Individuals with the two extreme Dh originated from the same morphospecies (Indet1) that differed by 10 mm in DBH (Table 1). Diameter metrics (D and Dh) were negatively correlated with vessel density (Pearson coefficients of –0.87 and –0.86, respectively and p-values < 10−6) and with basic specific gravity (r = −0.45 and −0.44, p-value = 0.036 and 0.041, respectively).
On average, liana stem conductivity was large (300.43 kg m−1 s−1 MPa−1) even though it dramatically varied between the least (28) and the most (1041) conductive individual (Table 1). Due to the strong negative correlation between VD and Dh, Kp and VD were negatively (but marginally) correlated (r = −0.42, p-value = 0.052, Figure 2), while they exhibited a positive linear relationship according to Equation (4).
Due to the fourth power in the Hagen–Poiseuille equation (Equation (4)), the largest vessels of each individual disproportionately contributed to the stem conductivity (Figure 3). The top 5% of the largest vessels contributed between 12% and 99% to the individual stem conductivity, with a mean of 38%. On average, the diameter above which the vessels contributed to 50% of the conductivity was equivalent to three times the mean vessel diameter.
Individual vessel area was also extremely variable between samples (Table 1): vessels occupied between 5.2% (Bignoniaceae spp1) and 38.6% (Rubiaceae spp1 (3)) of the analyzed area. VA was a poor predictor of basic specific gravity but correlated (r = 0.6, p-value = 0.002) with the maximum stem hydraulic conductivity (Figure 2). Similarly, vessel density varied over a wide range of values: between 1.8 (Apocynaceae Odontadenia spp1) and 89.3 (Sapindaceae Paullinia spp1 (1)) vessels per square millimeter.
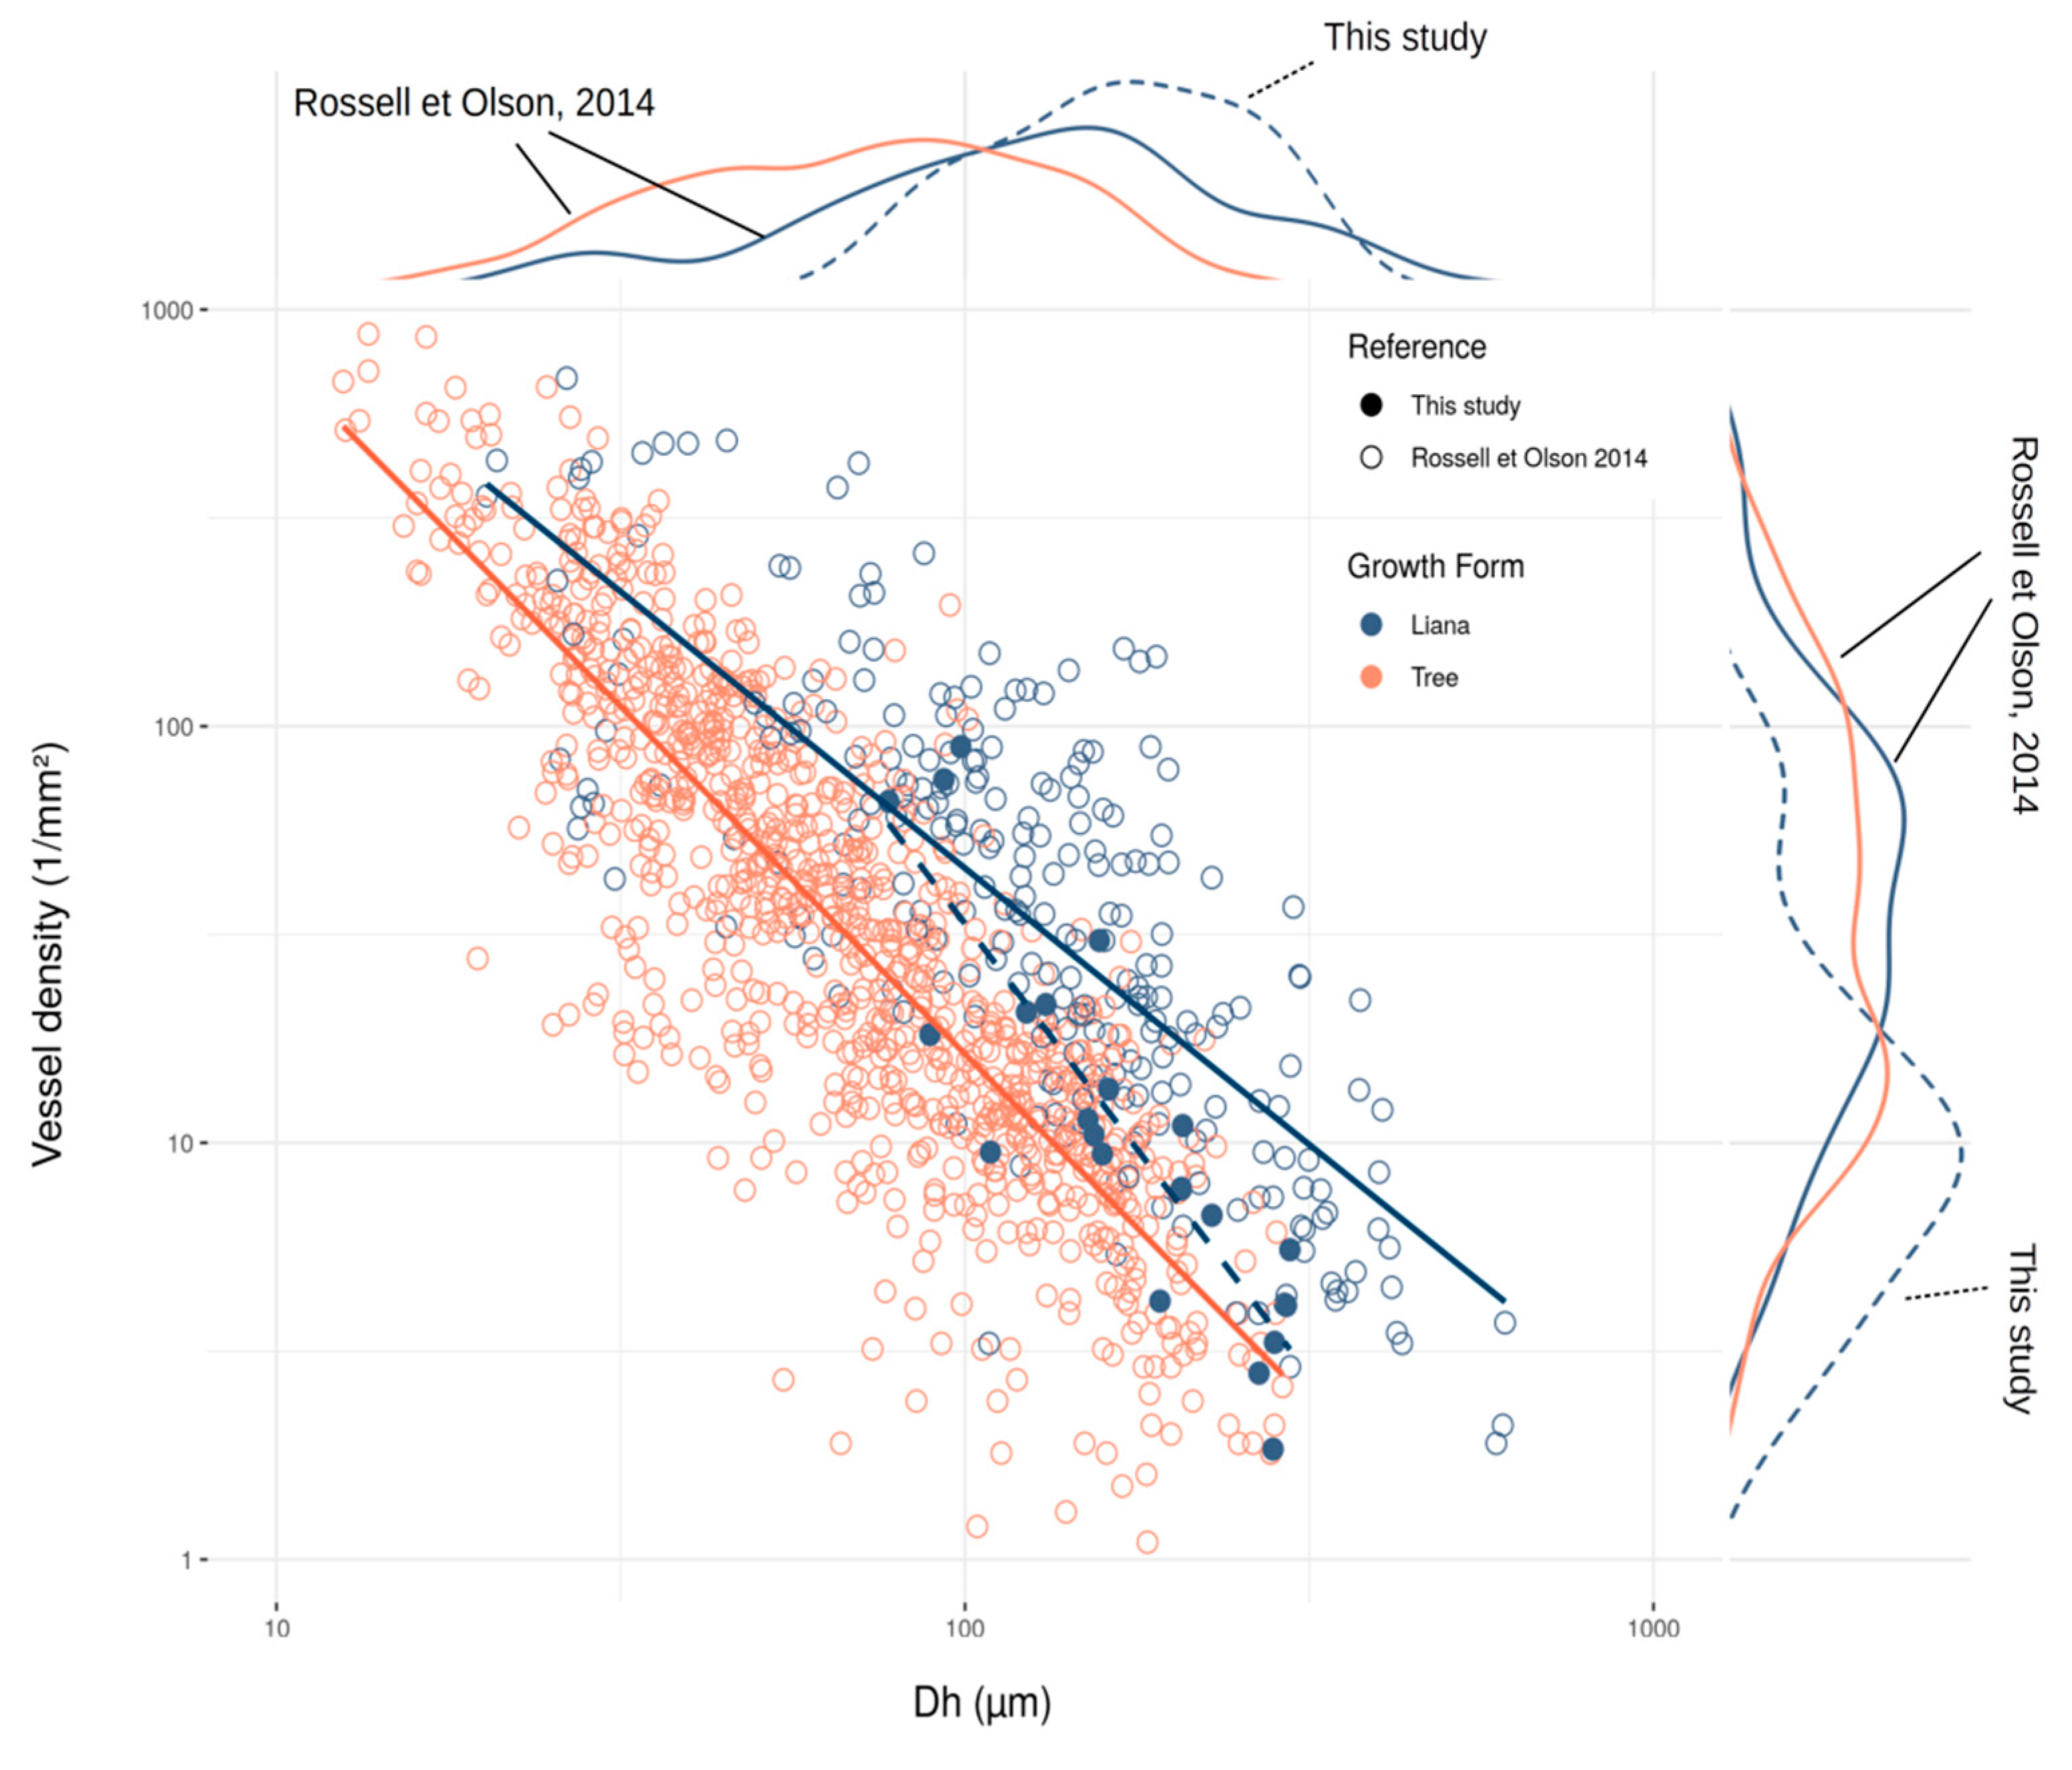
As compared to a much larger study [29] in which 1409 pantropical wood samples (267 non-self-supporting) from 424 species (84 non-self-supporting) among 159 families (136 non-self-supporting) were analyzed, the ranges of measured values of both hydraulic diameter Dh and vessel density VD were smaller but included a significant fraction of the global observations (Figure 4). More precisely, in the range of Dh we observed that Laussat covered 37% of the range reported in the global dataset of Rosell and Olson [29]: the minimum Dh measured in this study in Laussat was larger (77 vs. 20.2 µm) while the maximum Dh was smaller (296 vs. 609 µm) than the respective extremum values of Rosell and Olson [29]. Observed VD in Laussat comprised 12% of the range observed by Rosell and Olson pantropically, the maximum vessel density in this study being much smaller than the maximal one of Rosell and Olson (89.3 vs. 685 vessels mm−2). The slopes of the log-log regression of Dh and VD in our study and the one of Rosell and Olson also agreed on the direction of the correlation (Figure 4).
There was more than a factor of two between the lowest (0.26) and the largest (0.61) liana basic specific gravity measurements. Measured liana wood densities in Laussat were rather on the low side of both the tree and liana records from the GWDDB: liana mean basic specific gravity (0.52) was significantly lower (p-value < 0.004) than the global mean of lianas (0.58, N = 153) and of trees (0.61, N > 27,000). The spread of the liana Gb range (0.26–0.61) represented about 27% of the range generated by all tree entries (0.11–1.39), and 37% of the range generated by all liana entries (0.17–1.12).
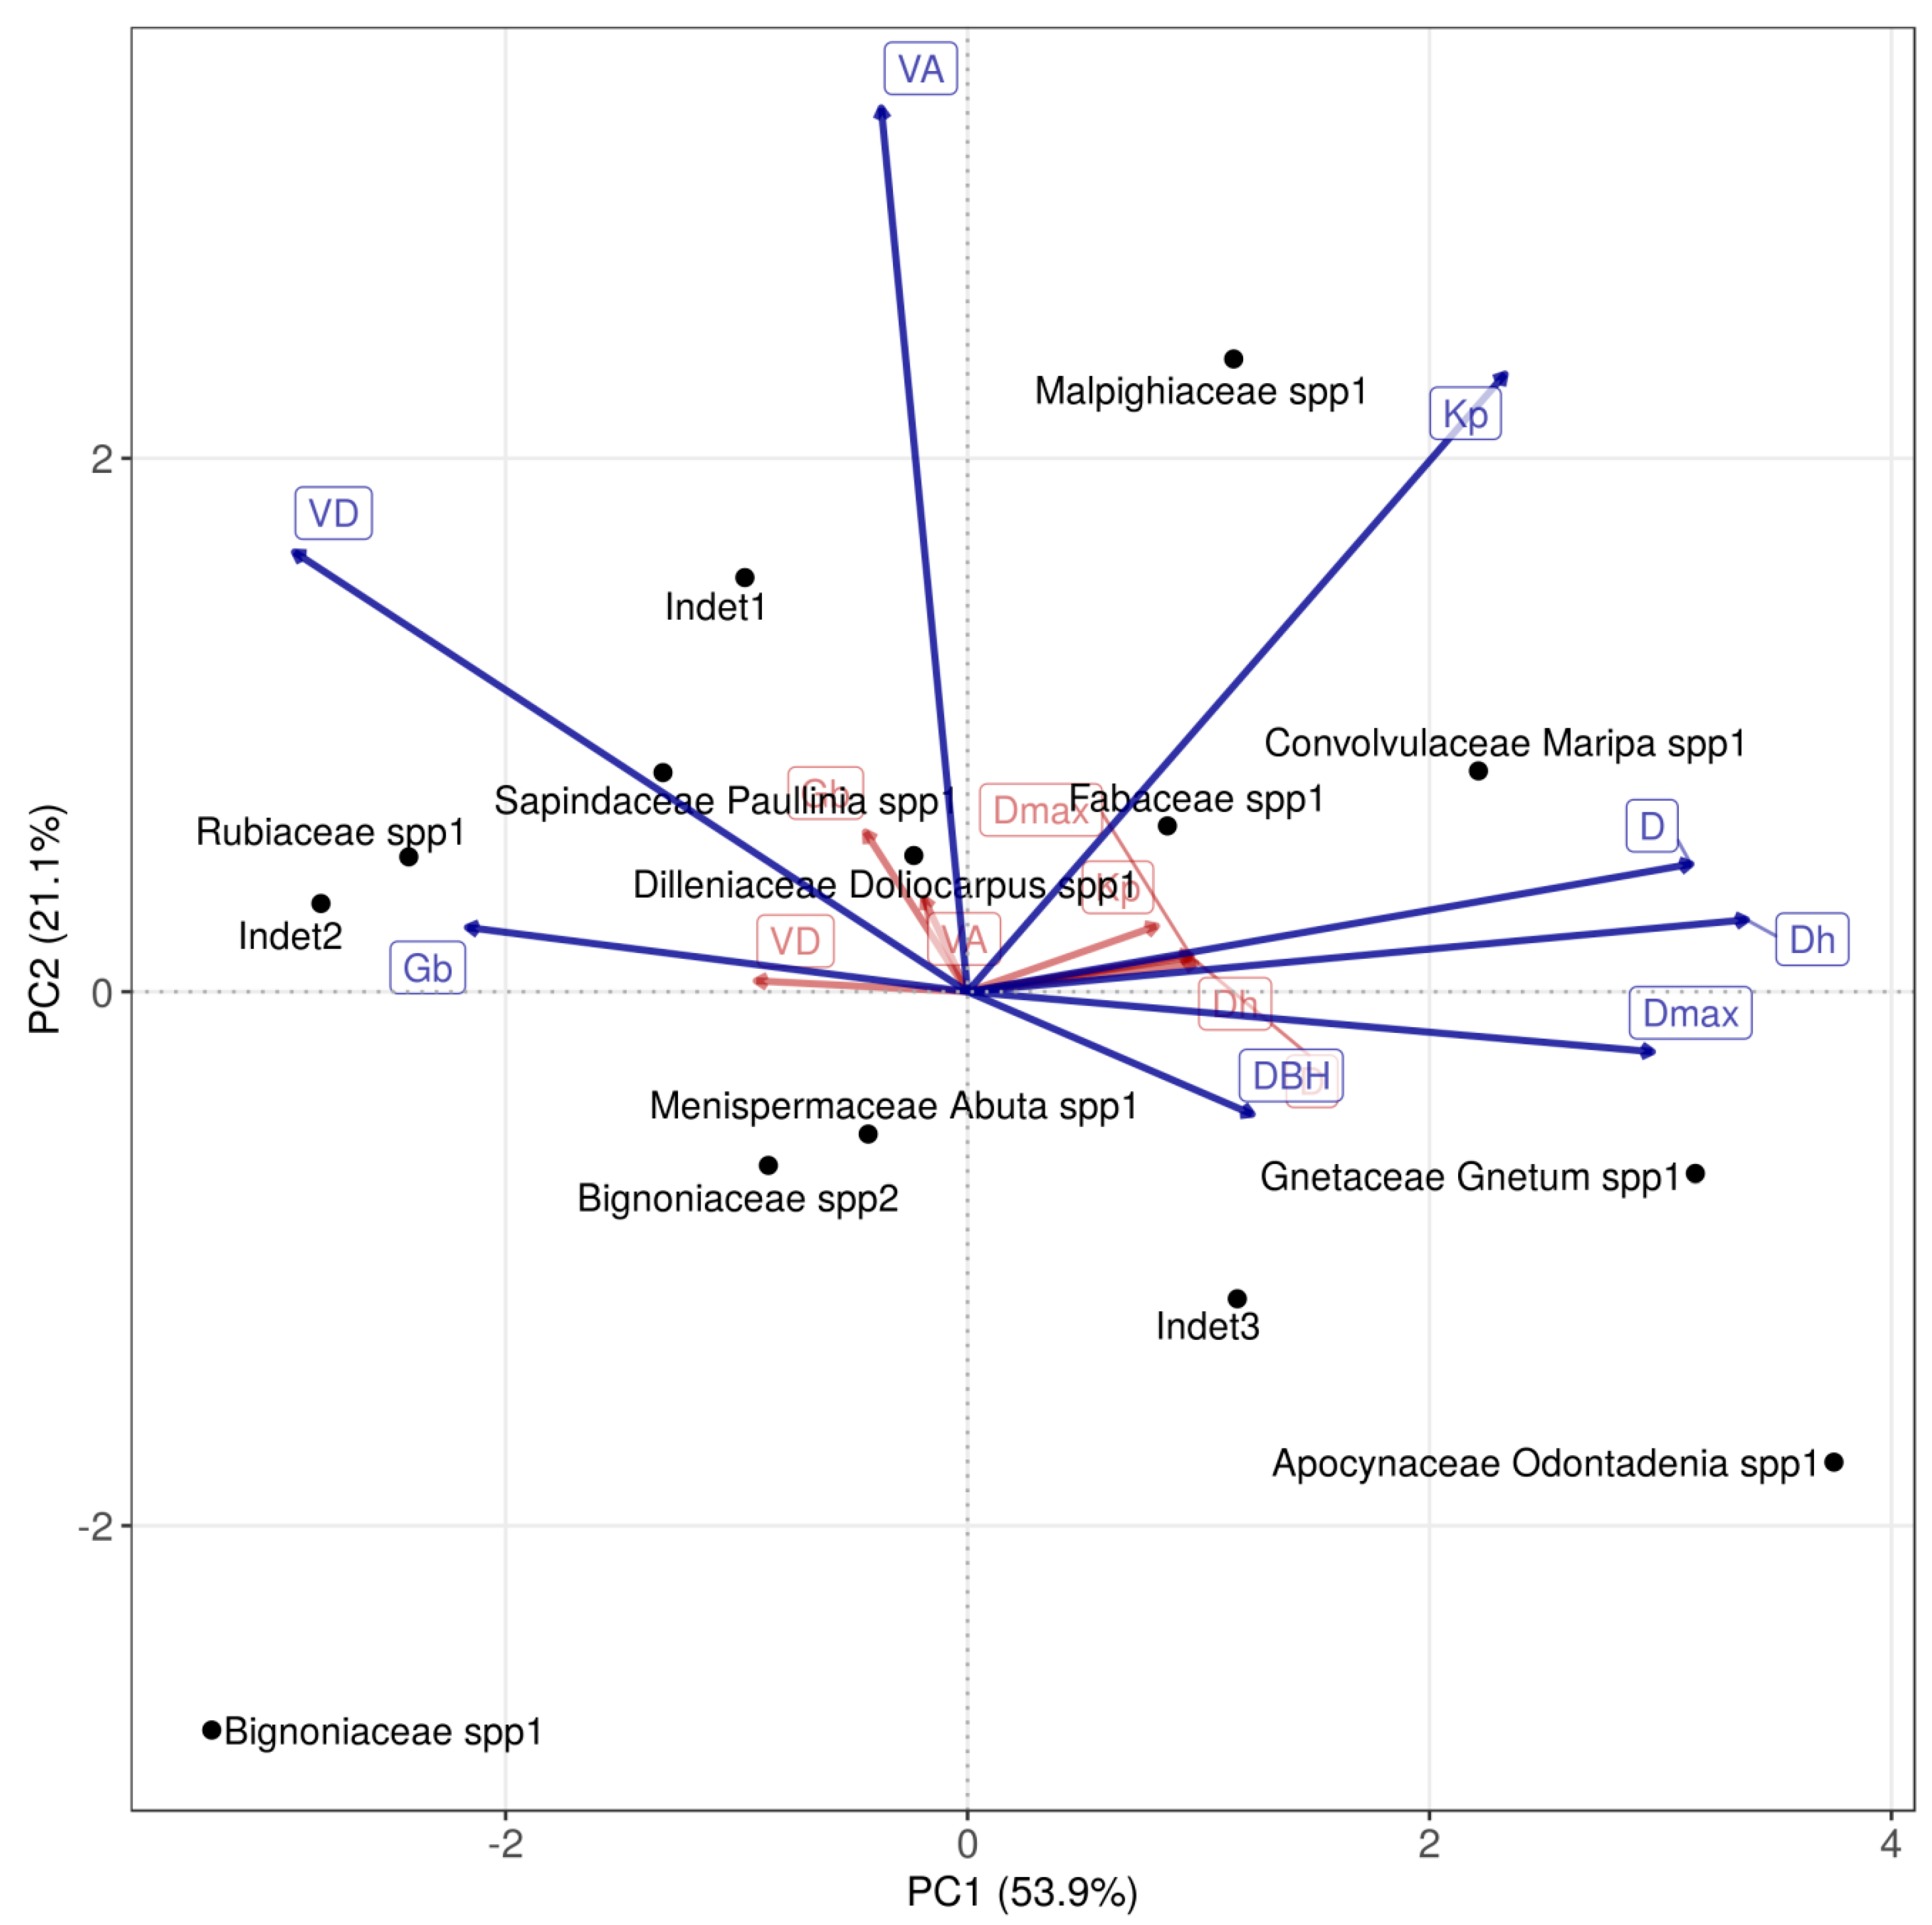
The first two axes of the PCA applied to the morpho-species-aggregated liana wood traits explained 75% of the variation (Figure 5). The first axis (53.9% of the variation) showed strong positive loadings for the diameter metrics (D, Dh, and Dmax the maximum vessel diameter), individual size and the maximum stem hydraulic conductivity Kp, and negative loadings for basic specific gravity and vessel density. The second axis explained 21.1% of the variation and showed a positive loading for the vessel cross-sectional area VA and the maximum stem conductivity Kp. The 14 liana morpho-species were almost equally distributed in all four quadrants (Figure 5).

4. Discussion

Just like other growth forms that have variable vessel sizes across their stem due to ontogenetic shifts and seasonal and interannual changes in meteorological conditions, liana cross-sections were characterized by broad vessel diameter distributions. Nevertheless, most of the liana individuals that we investigated were characterized by the presence of large to very large vessels (Table 1 and Figure 1), as observed in previous liana studies [13,41]. Such large vessels are responsible for previously observed large conductivity in lianas, and their higher sensitivity to embolism [16,17,18,23]. All individuals considered together, the vessel diameter distribution of the whole dataset was more right-skewed than global vessel distributions of trees and lianas [42] even though only nine liana individuals (out of 22) could be considered as right-skewed. This discovery questions the widely shared hypothesis of vessel diameter bimodal distribution in lianas. This study shows that more than half of liana individuals do not exhibit such a dimorphic distribution.
On average, liana individuals from this study were characterized by low basic specific gravity and hydraulically efficient stems as compared to global plant trait distributions, which is consistent with their ability to structurally parasitize trees and escape the trade-off between stem hydraulic efficiency and mechanical stability [19]. These findings are also in line with previous studies showing that lianas have relatively lower wood density and are hydraulically more efficient than trees [43].
The correlations between liana wood trait variables we found in our dataset were close to wood trait relationships observed in tropical trees [39]: a strong negative correlation between VD and Kp (r = −0.42 and −0.59 in our study and theirs, respectively), and between VD and D (r = −0.87 and −0.9, respectively), and a strong positive correlation between Dh and Kp (r = 0.82 and 0.85, respectively). Similarly, liana individual mean vessel diameter D was highly (and negatively) correlated with vessel density VD when log10-transformed (r2 = 0.76), which is very close to the relationship observed for self and non-self-supporting species pantropically (r2 = 0.74 [29]). We also found no correlation between the liana vessel area fraction VA and liana basic specific gravity (Pearson correlation r = 0.06), as it was previously observed for rainforest tree species (r = 0.1 [39]). These results indicate that drivers of trait covariation in lianas are likely similar to those in trees.
The principal component analysis applied to our dataset (Figure 5, blue axes) yielded very similar results as the ones found by Poorter et al. [39] (Figure 5, red axes). As for tropical trees, the first axis of our PCA shows a positive relationship between Kp and average vessel diameter, on the one hand, and a negative relationship between these traits and the vessel density and the basic specific gravity on the other hand, which reflects the vessel diameter number trade-off. The second axis represents the trade-off between different tissue type investments and is strongly correlated to vessel area. These results are consistent across lianas and trees. In contrast to Poorter et al. [39], liana wood density did not load equally on both axes, and therefore could be a good proxy for liana stem hydraulics only rather than other stem functions.
This study, however, has some limitations. First, we did not collect wood samples from co-occurring trees and as a consequence, we cannot compare traits between growth forms from the same site. Second, while it is known that the theoretical (maximum) stem hydraulic conductivities are significantly reduced due to intervessel anatomical structures such as pits for both lianas and trees, we did not directly measure the sapwood-specific conductivities and can therefore only investigated maximum conductivities. Third, we did not measure the diameter of each single xylem vessel of the 22 liana individuals. Instead, we selected a restricted, but representative, area of each cross-section (wedge portion from pith to bark under the condition that the area contained at least 40 vessels) and all the visible vessels therein were selected and scanned. Nevertheless, the accuracy and the precision of the vessel size distribution depended on the representativeness of the selected area and on the quality of the sample preparation and the image acquisition. It is possible that we missed some vessels (especially the narrow ones, whose size appears to be very similar to the fiber size) during the process analysis, for example, when dust could have filled them during polishing. Finally, we generated a limited dataset (22 liana individuals only identified at the family level, with low to no replications for some species), and without liana inventory and proper identification, we cannot link our results to their local respective abundance. The variability that we highlighted in our results might be underestimated if we missed extreme family/species in the sampling or could be exaggerated if a limited number of species largely dominate liana demography or if adding replications averaged out the differences between species. While we are aware of these limitations, we still believe that the present dataset is an added value to the ecological community considering how little is known about liana variability in general, and liana wood traits in particular. For the aforementioned reasons, the dataset associated with this study only provides a first estimate of the liana wood traits and within-site variability of these traits and should be refined with future data collections focusing on replications for each single morpho-species and plant inventories.
In total, we scanned and digitized 1239 liana vessels in this study and the most time-consuming steps (selecting and measuring the vessels) were achieved manually. In the future, taking advantage of automated software and artificial intelligence could make these tasks faster and the whole process more efficient. Recognition algorithms should allow us to identify vessels and other wood anatomical traits in an efficient fashion.
Despite these limitations, the liana individuals described in this study exhibited high heterogeneity in vessel dimensions, density, and more generally in structural, anatomical, and hydraulic traits. Such large variability is illustrated by the overlap between wood trait distributions originating from our study and the global liana dataset (Figure 4), and the wide distribution of the 14 liana morpho-species along the two axes in the principal component analysis (Figure 5). Furthermore, liana (this study) ranges of species-aggregated traits were smaller than self-supporting woody plant traits [39,40] but comparable in magnitude (Table 2). Liana basic specific gravity varied 2.3-fold while trees’ varied 2.7/5.11-fold (for [39] and [40], respectively); liana vessel area varied 6.3-fold comparable to the tree vessel area variability in a study by Poorter et al. [39] (8.6-fold) but lower than in a study by Hietz and colleagues [40] (27.7-fold). Mean vessel diameter, vessel density, hydraulically weighted mean diameter, and maximum stem hydraulic conductivity ranges of variation at the species level were also smaller but comparable in magnitude for lianas than for trees. Interspecies variability was almost as large for liana species as for tree species, as indicated by the similar standard deviation of the respective variables (Table 2). Once again, these ranges must be interpreted with caution due to the limited number of replicates for several liana species in our study, but they seem to indicate that liana variability is larger than previously expected, even controlling for site and soil type.
While it is not the first time that a within-site variability is observed for lianas [38], data remain scarce. Consequently, lianas are considered one homogeneous growth form and modeled so by necessity. However, we showed in this study with a limited dataset that the intra-site range of variation of liana wood traits represents a significant fraction of the observed variability in liana traits pantropically [29], and a significant fraction of the observed variability in wood traits of tropical trees investigated in different, but species-rich, sites [39,40]. This variability is even more remarkable when we remember that the liana samples all originate from the same water-limited and nutrient poor white sands soil type. Our findings suggest that liana traits are heterogeneous, and we should invest as much in documenting growth-form variability in lianas as we do in trees.

5. Conclusions

In a limited number of individual liana wood samples (22) from the rainforest of Laussat (French Guiana), a large variability in structural (basic specific gravity), anatomical (diameter, vessel density, vessel area), and hence hydraulic (hydraulically weighted diameter, maximum stem hydraulic conductivity) traits was found. The wide range of variation of these properties represented a significant fraction of the observed pantropical liana variability and was comparable in magnitude with the observed ranges in tropical rainforest tree species from different, species-rich sites. These findings indicate that while lianas are on average characterized by large vessels, high stem conductivity, low basic specific gravity, and dimorphic vessel distribution, they also vary much around these means. This variability needs to be taken into account for future forest sampling, growth form comparison, and vegetation modeling.

Supplementary Materials

Cross-section images are available at https://zenodo.org/record/3762770#.XqDQHHVKiV4 and on the GitHub repository associated with this study (github.com/femeunier/LianaHydroVar).

Author Contributions

Conceptualization, H.V., S.M., and R.K.; methodology, H.V., S.M.K.M., F.M., J.V.d.B., and R.K.; data collection, R.K.; data analysis, H.P.T.D.D., R.L., F.M., R.K., and S.M.K.M.; original draft preparation, F.M.; writing—review and editing, all co-authors; visualization, F.M.; supervision, S.M.K.M. and H.V.; funding acquisition, H.V. and F.M. All authors have read and agreed to the published version of the manuscript.

Funding

This research was funded by the European Research Council Starting Grant 637643 (TREECLIMBERS) and FWO grant 1507818N. During the preparation of this manuscript, F.M. was funded by the BAEF and the WBI as a research fellow, then by the FWO as a junior postdoc (grant 1214720N) and is thankful to these organizations for their financial support.

Acknowledgments

We are very thankful to Tempest McCabe and Betsy Cowdery who proofread this manuscript.

Conflicts of Interest

The authors declare no conflicts of interest.

References

  1. Phillips, O.L. Increasing dominance of large lianas in Amazonian forests. Nature 2002, 418, 770–774. [Google Scholar] [CrossRef] [PubMed] [Green Version]
  2. Schnitzer, S.A.; Bongers, F. Increasing liana abundance and biomass in tropical forests: Emerging patterns and putative mechanisms. Ecol. Lett. 2011, 14, 397–406. [Google Scholar] [CrossRef] [PubMed] [Green Version]
  3. Schnitzer, S.A.; van der Heijden, G.M.F.; Powers, J.S. Reply to Verbeeck and Kearsley: Addressing the challenges of including lianas in global vegetation models. Proc. Natl. Acad. Sci. USA 2016, 113, E5–E6. [Google Scholar] [CrossRef] [PubMed] [Green Version]
  4. Verbeeck, H.; Kearsley, E. The importance of including lianas in global vegetation models. Proc. Natl. Acad. Sci. USA 2016, 113, E4. [Google Scholar] [CrossRef] [PubMed] [Green Version]
  5. Schnitzer, S. The ecology of lianas and their role in forests. Trends Ecol. Evol. 2002, 17, 223–230. [Google Scholar] [CrossRef] [Green Version]
  6. van der Heijden, G.M.; Schnitzer, S.A.; Powers, J.S.; Phillips, O.L. Liana impacts on carbon cycling, storage and sequestration in tropical forests. Biotropica 2013, 45, 682–692. [Google Scholar] [CrossRef] [Green Version]
  7. Ingwell, L.L.; Joseph Wright, S.; Becklund, K.K.; Hubbell, S.P.; Schnitzer, S.A. The impact of lianas on 10 years of tree growth and mortality on Barro Colorado Island. Panama J. Ecol. 2010, 98, 879–887. [Google Scholar] [CrossRef] [Green Version]
  8. van der Heijden, G.; Powers, J.S.; Schnitzer, S.A. Lianas reduce forest-level carbon accumulation and storage. Proc. Natl. Acad. Sci. USA 2015, 112, 13267–13271. [Google Scholar] [CrossRef] [Green Version]
  9. Baccini, A.; Walker, W.; Carvalho, L.; Farina, M.; Sulla-Menashe, D.; Houghton, R.A. Tropical forests are a net carbon source based on aboveground measurements of gain and loss. Science 2017, 358, 230–234. [Google Scholar] [CrossRef] [Green Version]
  10. Ewers, F.W.; Fisher, J.B.; Chiu, S.T. Water Transport in the Liana Bauhinia fassoglensis (Fabaceae). Plant. Physiol. 1989, 91, 1625–1631. [Google Scholar] [CrossRef] [Green Version]
  11. Caballé, G. Liana structure, function and selection: A comparative study of xylem cylinders of tropical rainforest species in Africa and America. Bot. J. Linn. Soc. 1993, 113, 41–60. [Google Scholar] [CrossRef]
  12. Chen, Y.J.; Schnitzer, S.A.; Zhang, Y.J.; Fan, Z.X.; Goldstein, G.; Tomlinson, K.W.; Cao, K.F. Physiological regulation and efficient xylem water transport regulate diurnal water and carbon balances of tropical lianas. Funct. Ecol. 2017, 31, 306–317. [Google Scholar] [CrossRef] [Green Version]
  13. Ewers, F.W.; Fisher, J.B.; Chiu, S.; Ewers, W.; Chi, S. A survey of vessel dimensions in stems of tropical lianas and other growth forms. Oecologia 1990, 84, 544–552. [Google Scholar] [CrossRef] [PubMed]
  14. Carvalho, E.C.D.; Martins, F.R.; Soares, A.A.; Oliveira, R.S.; Muniz, C.R.; Araújo, F.S. Hydraulic architecture of lianas in a semiarid climate: Efficiency or safety? Acta Bot. Bras. 2015, 29, 198–206. [Google Scholar] [CrossRef]
  15. Bastos, C.L.; Tamaio, N.; Angyalossy, V. Unravelling roots of lianas: A case study in Sapindaceae. Ann. Bot. 2016, 118, 733–746. [Google Scholar] [CrossRef] [Green Version]
  16. Chen, Y.-J.; Cao, K.-F.; Schnitzer, S.A.; Fan, Z.-X.; Zhang, J.-L.; Bongers, F. Water-use advantage for lianas over trees in tropical seasonal forests. New Phytol. 2015, 205, 128–136. [Google Scholar] [CrossRef]
  17. De Guzman, M.E.; Santiago, L.S.; Schnitzer, S.A.; Álvarez-Cansino, L. Trade-offs between water transport capacity and drought resistance in neotropical canopy liana and tree species. Tree Physiol. 2016. [Google Scholar] [CrossRef]
  18. Johnson, D.M.; Domec, J.C.; Woodruff, D.R.; McCulloh, K.A.; Meinzer, F.C. Contrasting hydraulic strategies in two tropical lianas and their host trees. Am. J. Bot. 2013, 100, 374–383. [Google Scholar] [CrossRef] [Green Version]
  19. Zhu, S.D.; Cao, K.F. Hydraulic Properties and Photosynthetic Rates in Co-occurring Lianas and Trees in a Seasonal Tropical Rainforest in Southwestern China. Plant. Ecol. 2009, 204, 295–304. [Google Scholar] [CrossRef]
  20. Angyalossy, V.; Angeles, G.; Pace, M.R.; Lima, A.C.; Dias-Leme, C.L.; Lohmann, L.G.; Madero-Vega, C. An overview of the anatomy, development and evolution of the vascular system of lianas. Plant Ecol. Divers. 2012, 5. [Google Scholar] [CrossRef]
  21. Schnitzer, S.A. A mechanistic explanation for global patterns of liana abundance and distribution. Am. Nat. 2005, 166, 262–276. [Google Scholar] [CrossRef] [Green Version]
  22. Jackson, P.C.; Cavelier, J.; Goldstein, G.; Meinzer, F.C.; Holbrook, N.M. Partitioning of water resources among plants of a lowland tropical forest. Oecologia 1995, 101, 197–203. [Google Scholar] [CrossRef]
  23. Zhu, S.D.; Cao, K.F. Contrasting cost-benefit strategy between lianas and trees in a tropical seasonal rain forest in southwestern China. Oecologia 2010, 163, 591–599. [Google Scholar] [CrossRef]
  24. Putz, F.E.; Mooney, H.A. (Eds.) The Biology of Vines; Cambridge University Press: Cambridge, UK, 1992. [Google Scholar]
  25. di Porcia E Brugnera, M.; Meunier, F.; Longo, M.; Krishna Moorthy, S.M.; De Deurwaerder, H.; Schnitzer, S.A.; Verbeeck, H. Modeling the impact of liana infestation on the demography and carbon cycle of tropical forests. Glob. Change Biol. 2019, 25, 3767–3780. [Google Scholar] [CrossRef]
  26. Smith-Martin, C.M.; Xu, X.; Medvigy, D.; Schnitzer, S.A.; Powers, J.S. Allometric scaling laws linking biomass and rooting depth vary across ontogeny and functional groups in tropical dry forest lianas and trees. New Phytol. 2019. [Google Scholar] [CrossRef]
  27. Wyka, T.P.; Oleksyn, J.; Karolewski, P.; Schnitzer, S.A. Phenotypic correlates of the lianescent growth form: A review. Ann. Bot. 2013, 112, 1667–1681. [Google Scholar] [CrossRef] [Green Version]
  28. Werden, L.K.; Waring, B.G.; Smith-Martin, C.M.; Powers, J.S. Tropical dry forest trees and lianas differ in leaf economic spectrum traits but have overlapping water-use strategies. Tree Physiol. 2017, 1–14. [Google Scholar] [CrossRef]
  29. Rosell, J.A.; Olson, M.E. Do lianas really have wide vessels? Vessel diameter–stem length scaling in non-self-supporting plants. Perspect. Plant. Ecol. Evol. Syst. 2014, 16, 288–295. [Google Scholar] [CrossRef]
  30. Gutierrez, M.; Miguel-Cha, R.S.; Terrazas, T. Xylem Conductivity and Anatomical Traits in Diverse Lianas and Small Tree Species from a Tropical Forest of Southwest Mexico. Int. J. Bot. 2009, 5, 279–286. [Google Scholar] [CrossRef] [Green Version]
  31. Baraloto, C.; Rabaud, S.; Molto, Q.; Blanc, L.; Fortunel, C.; Herault, B.; Fine, P.V. Disentangling stand and environmental correlates of aboveground biomass in Amazonian forests. Glob. Chang. Biol. 2011, 17, 2677–2688. [Google Scholar] [CrossRef]
  32. Schnitzer, S.A.; Dewalt, S.J.; Chave, J. Censusing and measuring lianas: A quantitative comparison of the common methods. Biotropica 2006, 38, 581–591. [Google Scholar] [CrossRef]
  33. Glass, S.V.; Zelinka, S.L. Moisture relations and physical properties of wood. In Wood Hanbook: Wood as an Engineering Material, Centennial ed; General technical report FPL, GTR-190; Department of Agriculture, Forest Service, Forest Products Laboratory: Madison, WI, USA, 2010; Chapter 4; pp. 4.1–4.19. [Google Scholar]
  34. Schneider, C.A.; Rasband, W.S.; Eliceiri, K.W. NIH Image to ImageJ: 25 years of image analysis. Nat. Methods 2012, 9, 671–675. [Google Scholar] [CrossRef] [PubMed]
  35. Sterck, F.J.; Zweifel, R.; Sass-Klaassen, U.; Chowdhury, Q. Persisting soil drought reduces leaf specific conductivity in Scots pine (Pinus sylvestris) and pubescent oak (Quercus pubescens). Tree Physiol. 2008, 28, 529–536. [Google Scholar] [CrossRef] [Green Version]
  36. Joanes, D.N.; Gill, C.A. Comparing Measures of Sample Skewness and Kurtosis. J. R. Stat. Soc. Ser. Stat. 1998, 47, 183–189. [Google Scholar] [CrossRef]
  37. Zanne, A.E.; Lopez-Gonzalez, G.; Coomes, D.A.; Ilic, J.; Jansen, S.; Lewis, S.L.; Chave, J. Wood Density Database. Dryad Digit. Repos. 2009. [Google Scholar] [CrossRef]
  38. Taseski, G.M.; Beloe, C.J.; Gallagher, R.V.; Chan, J.Y.; Dalrymple, R.L.; Cornwell, W.K. A global growth-form database for 143,616 vascular plant species. Ecology 2019, 100, e02614. [Google Scholar] [CrossRef] [Green Version]
  39. Poorter, L.; McDonald, I.; Alarcón, A.; Fichtler, E.; Licona, J.C.; Peña-Claros, M.; Sass-Klaassen, U. The importance of wood traits and hydraulic conductance for the performance and life history strategies of 42 rainforest tree species. New Phytol. 2010, 185, 481–492. [Google Scholar] [CrossRef]
  40. Hietz, P.; Rosner, S.; Hietz-Seifert, U.; Wright, S.J. Wood traits related to size and life history of trees in a Panamanian rainforest. New Phytol. 2017, 213, 170–180. [Google Scholar] [CrossRef] [Green Version]
  41. Ewers, F.W. Xylem’ Structure and Water Conduction in Conifer Trees, Dicot Trees, and Llanas. IAWA J. 1985, 6, 309–317. [Google Scholar] [CrossRef]
  42. Wheeler, E.A.; Baas, P.; Rodgers, S. Variations in Dieot Wood Anatomy: A Global Analysis Based on the Insidewood Database. IAWA J. 2007, 28, 229–258. [Google Scholar] [CrossRef]
  43. Zhu, S.-D.; Chen, Y.-J.; Fu, P.-L.; Cao, K.-F. Different hydraulic traits of woody plants from tropical forests with contrasting soil water availability. Tree Physiol. 2017, 37, 1469–1477. [Google Scholar] [CrossRef] [PubMed]
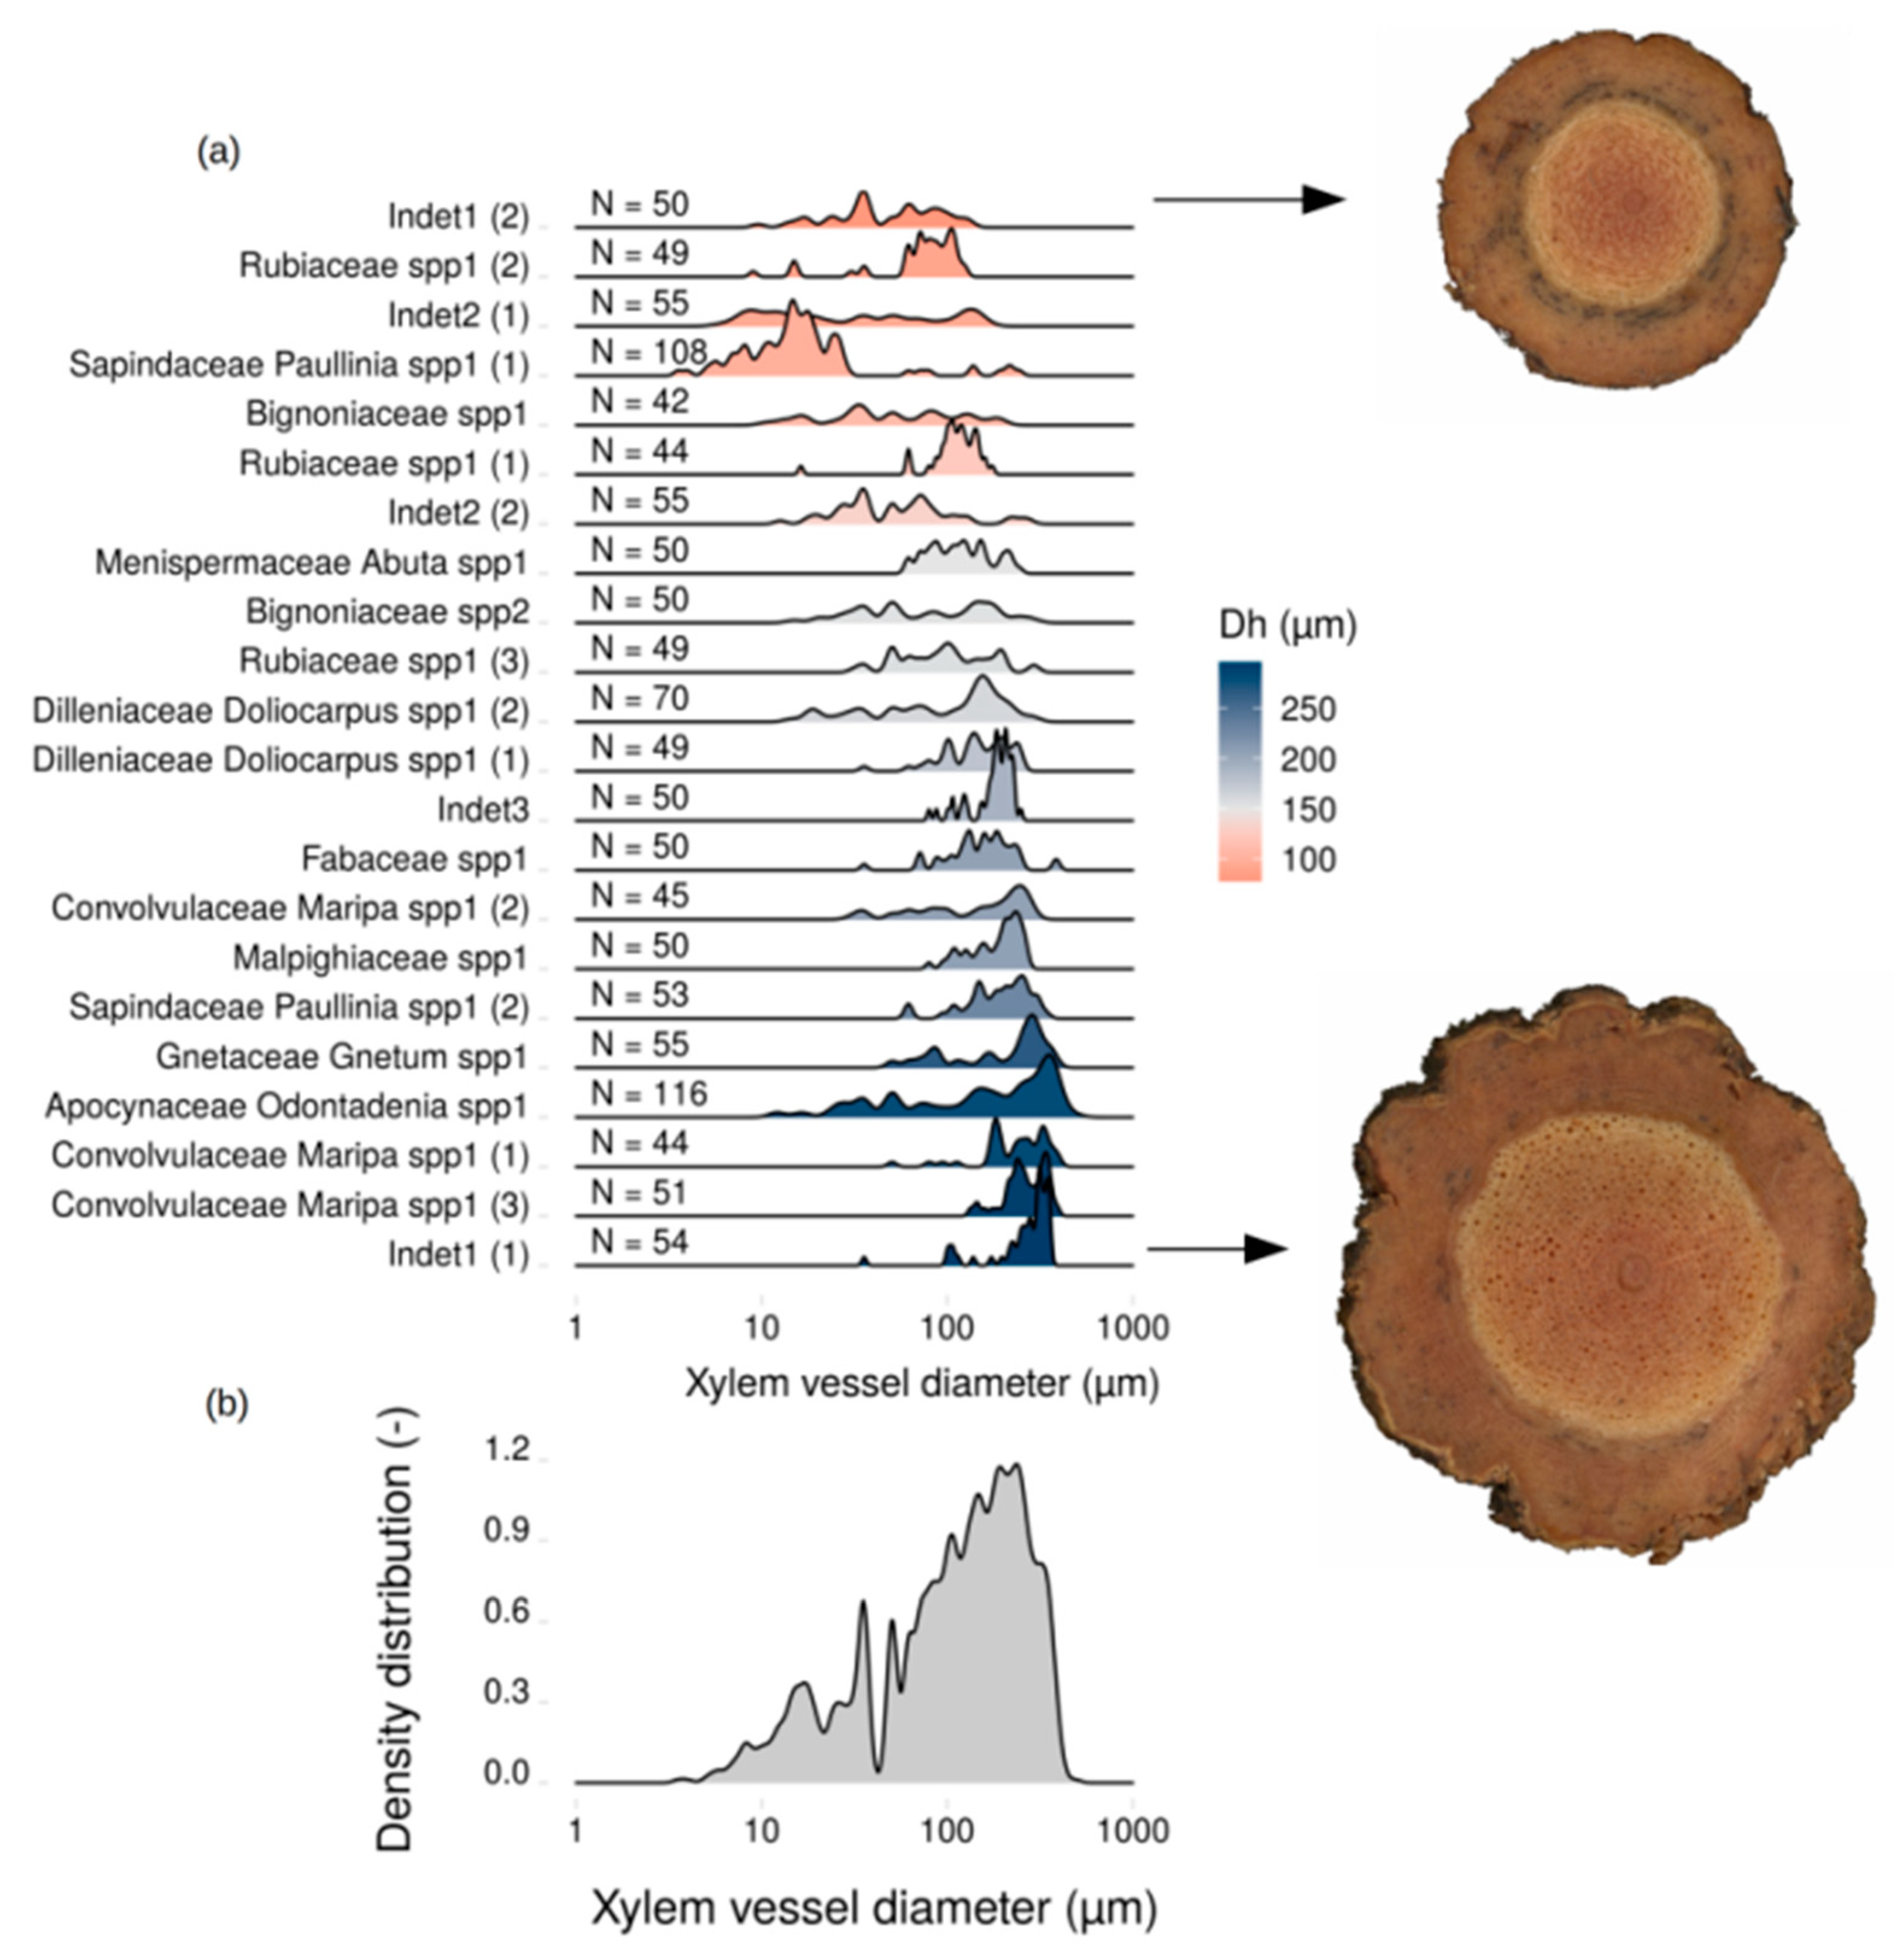
Figure 1. Vessel diameter frequency distribution of the 22 liana individuals (a) and of the whole liana dataset (b). In (a), lianas were sorted by their hydraulic diameter Dh (increasing from top to bottom) and the values of N indicate the number of measured xylem vessel diameters for each individual. The two most extreme lianas (in terms of Dh) are illustrated by their cross-sections (scaled by their respective DBH, see Table 1). The numbers in parentheses are subjective identifiers which distinguish individuals from the same morpho-species.
Forests 11 00523 g001
Figure 2. Correlogram between individual wood sample traits of the whole liana dataset. The main diagonal shows the frequency distributions of these variables while the other plots represent the correlation between the corresponding variables alongside with the Pearson’s coefficient and its significance according to the no-correlation test (*** p-value < 0.001, ** p-value < 0.01, * p-value < 0.05). Vessel density, mean diameter D, hydraulically-weighted diameter Dh, and maximum stem hydraulic conductivity Kp, were log10-transformed to compute the Pearson correlation coefficients. Some of the significant correlations are obvious (D and Dh for instance) and derive from the way we calculated them from one another (see Section 2). DBH = diameter at breast height, D = mean vessel diameter, Dh = hydraulically weighted mean diameter, Kp = maximum stem conductivity.
Forests 11 00523 g002
Figure 3. Contribution to the maximum stem hydraulic conductivity of each xylem vessel according to its diameter. All 22 studied individuals were ranked, and hence colored according to their hydraulically-weighted diameter Dh.
Forests 11 00523 g003
Figure 4. Relationship between the hydraulic diameter Dh and the vessel density VD. The data of this study are the blue solid dots and can be compared with non-self-supporting species (blue open dots) and self-supporting species (red open dots) published by Rosell and Olson [29]. The right and top subplots compare the marginal distributions along both axes, and the dashed distributions arising from the data of this study.
Forests 11 00523 g004
Figure 5. Principal-component analysis of the 8 wood traits of 22 liana individuals analyzed in this study (blue arrows) together with the species distribution in the principal component space. DBH = diameter at breast height, D = mean vessel diameter, Dh = hydraulically-weighted diameter, Dmax = largest vessel diameter, Kp = maximum stem hydraulic conductivity, VD = vessel density, Gb = basic specific gravity, and VA = vessel area fraction. VD, D, Dh, and Kp were log10-transformed before analysis. Each studied liana individual was identified by its family and its genus whenever it could be determined with confidence (see Table 1). For comparison, we superimposed the principal component analysis of the overlapping traits from [39] achieved on 42 tropical tree species (red arrows).
Forests 11 00523 g005
Table 1. Wood anatomical, structural, and hydraulic properties of the 22 liana individuals, alongside with the family and whole dataset aggregated values (bold). The numbers in parentheses are subjective identifiers which distinguish individuals from the same morpho-species. DBH = diameter at breast height, Gb = basic specific gravity, N = number of measured vessels, Di = vessel diameter, D = mean vessel diameter, Dh = hydraulically weighted mean diameter, VD = vessel density, VA = vessel area fraction, Kp = maximum stem conductivity.
FamilyGenusDBH
(mm)
Gb
(-)
Vessel N
(-)
Median Di
(min–max)
(µm)
D
(±SD)
(µm)
Dh
(µm)
VD
(mm−2)
VA
(%)
Kp
(kg m−1 s−1 MPa−1)
ApocynaceaeOdontadenia spp1520.38116177 (12–494)194 ± 1322801.88277.54
Bignoniaceaespp1150.544250 (11–192)67 ± 511099.55.232.69
spp2190.535080 (15–292)100 ± 7115410.412.3143.71
17 ± 2.80.54 ± 0.0146 ± 665 (11–292)83 ± 23131 ± 3210 ± 0.78.8 ± 588.2 ± 78.5
ConvolvulaceaeMaripa spp1 (1)520.4244248 (50–393)247 ± 852823.317.8510.76
Maripa spp1 (2)410.5545171 (30–292)162 ± 842067.820.3344.4
Maripa spp1 (3)410.551265 (134–394)271 ± 652934.124.8734.17
44.7 ± 6.40.49 ± 0.0747 ± 4248 (30–394)227 ± 57260 ± 475.1 ± 2.420.9 ± 3.6529.78 ± 195.58
DilleniaceaeDoliocarpus spp1 (1)220.4849144 (36–251)154 ± 551789.419.6229.65
Doliocarpus spp1 (2)120.4770126 (14–296)116 ± 7116213.419.5225.45
17 ± 7.10.47 ± 0.0160 ± 15135 (14–296)135 ± 27170 ± 1111.4 ± 2.919.5 ± 0.1227.55 ± 2.97
Fabaceaespp1300.6150158 (36–393)164 ± 682067.719.1342.57
GnetaceaeGnetum spp1530.3355252 (50–379)218 ± 1022672.812.7350.19
Malpighiaceaespp129.50.3450200 (80–272)189 ± 532071133.2495.55
MenispermaceaeAbuta spp1950.5750116 (62–245)125 ± 4915111.416144.15
Rubiaceaespp1 (1)290.5844113 (16–175)113 ± 3012320.622.2114.79
spp1 (2)370.584980 (9–124)78 ± 298918.29.827.88
spp1 (3)350.5849101 (32–296)111 ± 6215730.638.6451.79
33.7 ± 4.20.58 ± 047 ± 3101 (9–296)101 ± 20123 ± 3423.1 ± 6.623.6 ± 14.5198.15 ± 223.91
SapindaceaePaullinia spp1 (1)280.5810815 (4–245)26 ± 439989.317.5206.67
Paullinia spp1 (2)260.5853205 (62–344)199 ± 702286.723.3446.41
27 ± 1.40.58 ± 080 ± 39110 (4–344)112 ± 122163 ± 9248 ± 58.420.4 ± 4326.54 ± 169.52
Indet1(1)260.4554300 (36–355)271± 802965.434.71041.38
(2)160.475050 (10–134)56 ± 32776621.458.27
21 ± 7.10.46 ± 0.0252 ± 3175 (10–355)163 ± 152187 ± 15435.8 ± 42.828.1 ± 9.4549.82 ± 695.16
Indet2(1)330.495529 (6–156)50 ± 489374.428.1137.39
(2)370.585550 (13–276)67 ± 5713121.513.1155.28
35 ± 2.80.53 ± 0.065540 (6–276)59 ± 12112 ± 2748 ± 37.420.6 ± 10.6146.34 ± 12.65
Indet3 300.2650189 (80–250)181 ± 401924.211.3138.66
Entire datasetmean ± sd34.5 ± 17.80.49 ± 0.1056 ± 19142 ± 82144 ± 72180 ± 7119.5 ± 24.519.5 ± 8.7300.43 ± 244.14
min–max12 - 950.26–0.6142–1164–49426–27177–2961.8–89.35.2–38.627.88–1041.38
Table 2. Comparison between species-aggregated variable statistics from this study and tropical trees from Poorter et al. [39] and Hietz and colleagues [40]. Differences between the numbers in Table 1 and Table 2 originate from the aggregation at the species level. Gb = basic specific gravity, D = mean vessel diameter, Dh = hydraulically weighted mean diameter, VD = vessel density, VA = vessel area fraction, Kp = maximum stem conductivity.
Gb
(-)
D
(µm)
Dh
(µm)
VD
(mm−2)
VA
(%)
Kp
(kg m−1 s−1 MPa−1)
This studymean ± sd0.48 ± 0.11145 ± 54184 ± 5616.4 ± 16.017.9 ± 7.7278.8 ± 161.3
(14 liana species)min–max0.26–0.6159–227109–2801.8–48.05.2–33.232.7–549.8.1
Poorter et al. [39]mean ± sd0.55 ± 0.13206 ± 120178 ± 10826.2 ± 52.911.1 ± 5.4186.1 ± 251.9
(42 tree species)min–max0.28–0.7740–49034–4620.5–269.52.7–23.41.2–1298.9
Hietz et al. [40]mean ± sd0.57 ± 0.14 120 ± 5219.5 ± 28.58.4 ± 4.555.8 ± 72.7
(325 tree species)min–max0.17–0.87 29–3101.0–274.01.1–30.52.7–601