Abstract
In light of urbanization, climate change, and the escalation of extreme weather events, flood management is becoming more and more important. Improving community resilience and reducing flood risks require prompt decision-making and effective communication. This study investigates how flood management systems can incorporate Large Language Models (LLMs), especially those that use Retrieval-Augmented Generation (RAG) architectures. We suggest a multimodal framework that uses a Flood Knowledge Graph to aggregate data from various sources, such as social media, hydrological, and meteorological inputs. Although LLMs have the potential to be transformative, we also address important drawbacks like governance issues, hallucination risks, and a lack of physical modeling capabilities. When compared to text-only LLMs, the RAG system significantly improves the reliability of flood-related decision support by reducing factual inconsistency rates by more than 75%. Our suggested architecture includes expert validation and security layers to guarantee dependable, useful results, like flood-constrained evacuation route planning. In areas that are vulnerable to flooding, this strategy seeks to strengthen warning systems, enhance information sharing, and build resilient communities.
1. Introduction
Approximately 44% of all recorded disasters between 2019 and 2024 were floods, making them one of the most common and destructive natural disasters worldwide [1]. The World Bank estimates that between 1980 and 2016, floods killed over 225,000 people and caused over US$1.6 trillion in damages worldwide. Without effective mitigation measures, losses are expected to increase tenfold by 2050 [2]. Rapid urbanization, changing land use, climate change, and aging infrastructure are the main causes of the increased risk of flooding [3].
Remote sensing, GIS-based risk mapping, and hydrological and hydraulic modeling are key components of traditional flood management systems [4,5]. In order to forecast flood behavior, these models model physical processes like precipitation, runoff, and river flow. However, they frequently have drawbacks, particularly in areas with limited data, such as delayed response times, calibration complexity, and sparse data [6]. Furthermore, the accuracy of traditional forecasting techniques is called into question by the growing unpredictability of extreme weather events [7].
Flood forecasting now uses machine learning (ML), deep learning (DL), and hybrid modeling techniques thanks to recent developments in data-driven approaches. Convolutional neural networks (CNNs), ensemble models, and long short-term memory (LSTM) networks have become the most popular methods; in recent studies, LSTM accounted for 21% of implementations [1,8]. These models can increase the accuracy of short-term forecasting by learning temporal patterns from historical data. They still need a lot of training data, though, and are susceptible to noise and poor input quality [9].
Even with these advancements in technology, a number of problems still exist. First, it is still difficult to integrate diverse data sources, such as social media, citizen reports, sensor networks, and hydrological and meteorological inputs [10]. Second, uncertainty quantification is frequently insufficient, which compromises the accuracy of decision-making procedures and predictive models [11]. Third, handling sensitive personal and geospatial data raises privacy and governance issues, especially in AI-driven systems [12]. Fourth, during flood events, a lack of communication between the public and technical experts may result in panic, delayed responses, or misinformation [13].
A unique way to close these gaps is with Large Language Models (LLMs), especially those integrated into Retrieval-Augmented Generation (RAG) architectures. Large volumes of textual and multimodal data can be synthesized by LLMs, facilitating context-aware, real-time communication and decision support [14,15]. LLMs can produce customized warnings, summaries, and strategic recommendations by querying a Flood Knowledge Graph that integrates various datasets, such as historical events, EU flood directives, GIS layers, and reactive measure catalogs [16].
By combining textual, visual, and sensor-based inputs, multimodal LLMs further improve this capability and enable scenario simulation and dynamic risk assessment [16,17]. LLMs are capable of simulating evacuation plans, translating warnings into multiple languages for diverse communities, and summarizing technical reports for policymakers [18].
However, care must be taken when implementing LLMs in flood management. Because of their limited physical modeling capabilities, LLMs are unable to replicate hydrological processes like runoff or precipitation [4,19]. Additionally, they are prone to hallucinations, which can produce false but believable information and have disastrous outcomes in disaster situations [17]. We suggest a secure RAG framework with expert validation layers to reduce these risks and make sure that only warnings that have been approved by humans are shared [19,20]. This governance model utilizes the computational power of LLMs for improved preparedness and resilience while maintaining the integrity of flood communication. We hope to optimize warning systems, enhance information distribution, and promote a more knowledgeable and resilient society in flood-prone areas by integrating LLMs into a structured, human-in-the-loop system.
In this paper, we propose a multimodal RAG framework that leverages a Flood Knowledge Graph to aggregate data from diverse sources, including social media, hydrological data, and meteorological inputs. While LLMs hold transformative potential, we also acknowledge significant challenges, such as governance issues, the risk of factual inconsistency, and limitations in physical modeling capabilities. To address these concerns, our proposed architecture incorporates expert validation and security layers, ensuring reliable and actionable outcomes, such as flood-constrained evacuation route planning.
2. Materials and Methods
2.1. Proposed Architecture
To enable reliable, context-aware, and actionable flood management, we propose a robust architecture that integrates multimodal LLMs with GIS data and a Flood Knowledge Graph, embedded within a Retrieval-Augmented Generation (RAG) framework as shown in Figure 1. This architecture is designed to ensure data integrity, prevent misinformation, and maintain human oversight throughout the decision-making process.
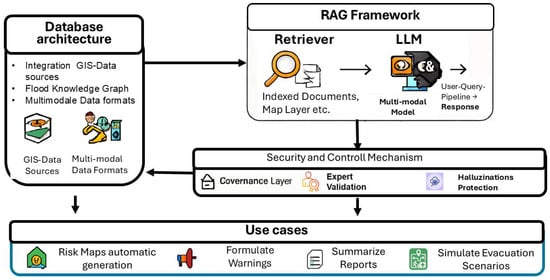
Figure 1.
Proposed architecture that integrates multimodal LLMs with GIS data and a Flood Knowledge Graph, embedded within a Retrieval-Augmented Generation (RAG) framework. Black arrows indicate internal communication.
2.1.1. Data Architecture
At the foundation of the system lies a comprehensive data architecture that consolidates diverse and multimodal inputs:
- GIS Data Sources: These include topographic maps, floodplain delineations, infrastructure layouts, and satellite imagery. They provide spatial context essential for risk mapping and evacuation planning.
- Flood Knowledge Graph: A structured graph database that links meteorological data, hydrological models, historical flood events, EU flood directives, and reactive measure catalogs. This graph enables semantic querying and contextual reasoning.
- Multimodal Data Formats: The system ingests and processes various data types—textual reports, sensor readings, images, social media posts, and wearable device data—allowing for a holistic understanding of flood conditions.
These inputs are indexed and preprocessed to feed into the RAG framework, ensuring that relevant information is retrievable and interpretable by the LLM.
2.1.2. RAG Framework
The core of the architecture is the Retrieval-Augmented Generation framework, which consists of two tightly integrated modules:
- Retriever Module: This component identifies and extracts relevant documents, map layers, and data entries from the indexed corpus. It guarantees that the LLM uses current and contextually relevant data.
- LLM Module: A multimodal LLM processes the retrieved content to generate coherent, context-aware responses. It handles user queries, synthesizes insights, and formulates outputs such as warnings, summaries, and decision support recommendations.
The RAG framework enables dynamic interaction between user inputs and the knowledge base, allowing for real-time generation of tailored outputs.
2.1.3. Security and Control Measures
To ensure the reliability and safety of the system, a dedicated layer of governance and control mechanisms is embedded:
- Governance Layer: This layer enforces data usage policies, ethical standards, and operational protocols. It ensures compliance with privacy regulations and institutional guidelines.
- Expert Validation: Domain experts examine and validate all important outputs, particularly warnings and strategic recommendations that are intended for the general public. This human-in-the-loop approach guarantees accuracy and accountability.
- Misinformation Protection: Advanced filters and verification routines are implemented to detect and block hallucinated content. These safeguards prevent the dissemination of misleading or incorrect information
Together, these mechanisms maintain the integrity of the system and foster public trust in AI-assisted flood management.
2.1.4. Use Cases
The proposed architecture supports a wide range of practical applications across the flood management lifecycle:
- Risk Map Generation: Automatically produces dynamic risk maps for authorities based on real-time data and historical patterns.
- Warning Formulation: Generates localized, multilingual flood warnings tailored to specific regions and demographics.
- Report Summarization: Condenses technical flood reports into actionable summaries for decision-makers and emergency responders.
- Evacuation Scenario Simulation: Models and visualizes evacuation routes and strategies, incorporating infrastructure constraints and population density.
2.1.5. Rationale for the Proposed Architecture
Recent developments in artificial intelligence, environmental modeling, and disaster response systems serve as the foundation for the incorporation of multimodal Large Language Models (LLMs) into a Retrieval Augmented Generation (RAG) framework for flood management. Numerous studies have shown that LLMs greatly improve the contextual relevance and accuracy of outputs when combined with retrieval mechanisms and domain-specific knowledge graphs [21,22].
By retrieving validated, structured, and unstructured data from indexed sources, the RAG architecture helps LLMs to overcome their domain specificity limitations. Multi-agent LLM systems have been successfully used in wildfire risk modeling, offering specialized insights to a range of stakeholders [21]. Similarly, by combining adaptive context fusion mechanisms with stormwater management data, REMFLOW, a RAG-enhanced framework, has demonstrated superior performance in multi-factor rainfall flooding prediction [22].
The ability of LLMs to synthesize multimodal inputs, such as sensor data, satellite imagery, and social media signals, is advantageous for early warning systems. Using social media data, Bhatti’s case study on the floods in the UK and Japan showed that LLMs could detect up to 90% of flood-prone areas, particularly when retrieval-based contextualization was added [23]. Furthermore, to ensure the ethical and reliable application of AI in disaster situations, security and control mechanisms like governance layers, expert validation, and misinformation protection must be included. These protections tackle important issues of accountability, privacy, and disinformation, which are particularly noticeable in emergency communication [24,25].
The suggested architecture provides a scalable, secure, and context-aware flood preparedness, response, and resilience solution that is in line with new best practices in AI-assisted environmental systems.
2.2. Flood Knowledge Graph
The Flood Knowledge Graph (FKG) in Figure 2 serves as the semantic backbone of the proposed architecture, enabling structured integration, contextual reasoning, and intelligent retrieval of flood-related information. It is designed to unify heterogeneous datasets—spatial, temporal, textual, and sensor-based—into a coherent, queryable framework that supports multimodal LLMs within the Retrieval-Augmented Generation (RAG) pipeline.
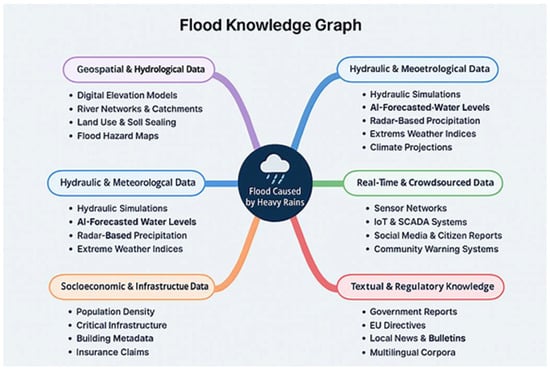
Figure 2.
Semantic integration of geospatial, meteorological, infrastructural, and crowdsourced data to support AI-driven flood risk analysis and decision-making for floods.
2.2.1. Semantic Structure and Weighting
The FKG is built upon a multi-layered ontology that defines entities, relationships, and attributes relevant to flood risk. Semantic weighting is applied based on data reliability, temporal relevance, and spatial granularity. For example:
Hydraulic simulation outputs (e.g., HEC-RAS) receive high weightings for predictive modeling [26]. Real-time sensor data (e.g., water levels, discharge rates) are prioritized for immediate decision-making [27]. Historical flood records and damage reports are weighted for pattern recognition and vulnerability analysis [28].
The FKG supports inferencing, enabling LLMs to deduce risk levels, forecast impacts, and simulate scenarios based on interconnected data.
2.2.2. Integrated Data Domains
- A.
- Geospatial and Hydrological Data
Digital Elevation Models (DHM, DTM, DSM): Provide terrain morphology essential for flood routing and inundation modeling [29]. River networks and catchment boundaries: Used for flow accumulation and watershed analysis [30]. Land use and soil sealing: Influence runoff coefficients and urban flood susceptibility [31]. Flood hazard maps (HQ100, HQextrem): Standardized by German authorities for risk zoning [32].
- B.
- Hydraulic and Meteorological Data
Hydraulic simulations (HEC-RAS): Model water surface profiles and flood extents [26]. AI-forecasted water levels and discharge: Derived from hybrid models combining ANN and physical simulations [3]. Radar-based precipitation forecasts: Provided by DWD and ECMWF for short-term flood prediction [33]. Extreme weather indices and warnings: Integrated from national alert systems (e.g., KATWARN, MeteoAlarm) [34]. Climate models and scenario projections: Used for long-term flood risk planning [35].
- C.
- Socioeconomic and Infrastructure Data
Population density and vulnerable groups: Crucial for impact assessment and evacuation planning [36]. Critical infrastructure: Hospitals, schools, energy grids mapped for resilience analysis [37]. Building metadata: Includes elevation, basement presence, and construction year for damage estimation [38]. Insurance claims and damage history: Inform probabilistic risk models and economic loss forecasting [39].
- D.
- Real-Time and Crowdsourced Data
Sensor networks: Gauge levels, Discharge, and rainfall sensors [27]. IoT and SCADA systems: Provide operational data from water management infrastructure [40]. Social media and citizen reports: Harvested via NLP pipelines for situational awareness [41]. Community warning systems: Local apps and SMS alerts contribute to hyperlocal intelligence [42].
- E.
- Textual and Regulatory Knowledge
Government reports and emergency protocols: Structured into knowledge nodes for LLM retrieval [43]. EU directives (e.g., EU-HWRM Directive): Codified for compliance and policy alignment [44]. Local news and weather bulletins: Used for regional context and multilingual modeling [45]. Multilingual corpora: Enable LLMs to generate region-specific outputs across language barriers [46].
2.2.3. European and German Context
The FKG is tailored to the European and German flood management landscape. It aligns with the EU Floods Directive (2007/60/EC), integrates datasets from the German Federal Institute of Hydrology (BfG), and leverages platforms like Copernicus Emergency Management Service (CEMS) and the Global Flood Awareness System (GloFAS) [1,26,33].
Recent developments such as the FLEXTH tool by the Joint Research Center (JRC) enhance flood depth estimation by combining satellite imagery with topographic data—an approach directly compatible with the FKG [26]. Time-series analyses of flood drivers in Germany underscore the importance of integrating temperature, precipitation, and discharge data into predictive models [3].
2.2.4. Real-Time Flood Forecast and Risk Estimation Models
To enable real-time or near-real-time flood forecasting and risk assessment within the Large Language Model (LLM) framework, we developed two fast-response AI-based flood prediction models tailored to distinct flood types: fluvial floods (riverine) Figure 3 and pluvial floods (rain-induced surface flooding) Figure 4. These flood types differ significantly in their hydrodynamic behavior, spatial impact, and the operational requirements they impose on flood management systems.
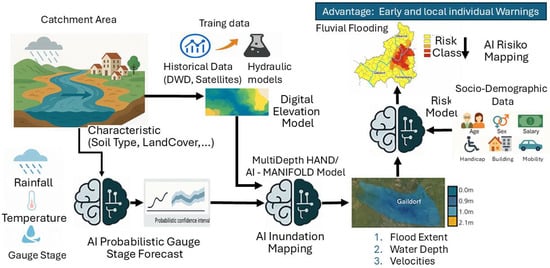
Figure 3.
AI-based flood prediction models for fluvial floods.
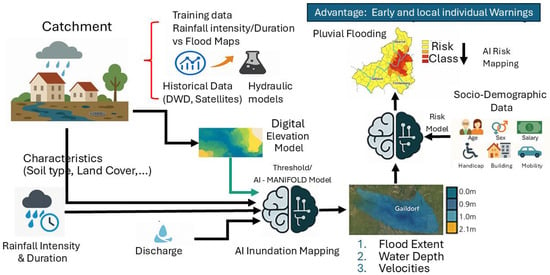
Figure 4.
AI-based flood prediction models for pluvial floods.
The underlying architecture and training methodology of both models are described in detail in our previous publications [47] and briefly summarized here for context. Figure 3 and Figure 4 illustrate the respective model workflows for fluvial and pluvial flood forecasting.
The primary distinction between the two models lies in their input parameters:
- Pluvial Flood Model: This model relies on high-resolution rainfall data, including intensity and duration, as well as catchment-specific characteristics such as land cover, soil type, and urban permeability. These factors influence infiltration rates and surface runoff dynamics.
- Fluvial Flood Model: This model incorporates upstream discharge data, river network topology, and basin-scale hydrological inputs to simulate downstream flood propagation.
Both models are capable of learning from satellite-derived flood maps and synthetic flood scenarios generated by physical models (e.g., HEC-RAS or LISFLOOD). Through supervised learning and data assimilation, the models produce three core outputs:
- Water Depth Maps
- Flood Extent Maps
- Flow Velocity Maps
2.2.5. AI-Based Risk Mapping for Flood Impact Assessment
A fourth and critical output of both models in Figure 3 and Figure 4 is the risk map, which is generated by integrating the flood hazard layers with socio-demographic and infrastructural data. This includes population density, age distribution, building typologies, and critical infrastructure locations. By correlating flood depth with human exposure and structural vulnerability, the models provide a nuanced estimation of physical vulnerability during extreme flood events [48].
Expressing hazard in terms of physical vulnerability facilitates its integration with social vulnerability indicators—such as income level, mobility constraints, and access to emergency services—within a composite Flood Impact Index. This index supports targeted decision-making and prioritization of emergency response efforts, especially in densely populated or socially disadvantaged areas.
The generation of risk maps serve as spatial decision-support tools for emergency planning and response. These maps are produced through an AI-driven methodology that integrates flood hazard data with socio-demographic and infrastructural information to estimate both physical and social vulnerability across affected regions.
The process begins with the creation of high-resolution flood hazard layers as described in Section 2.2.4, which quantify flood characteristics such as depth, extent, and velocity, which are essential for assessing the potential impact on people and infrastructure.
To contextualize the hazard data, the system incorporates spatial datasets that reflect human and structural exposure, including: population density and age distribution (e.g., elderly, children), building typologies (e.g., material, height, occupancy), critical infrastructure (e.g., hospitals, schools, power stations) and transportation networks and evacuation routes. These datasets are georeferenced and aligned with the flood hazard layers to enable spatial correlation.
Using AI models based on gradient boosting algorithms the system correlates flood depth and velocity with the structural characteristics of buildings and infrastructure. This allows for a nuanced estimation of physical vulnerability, identifying areas where damage is likely to be severe during extreme flood events.
In parallel, the system evaluates social vulnerability using indicators such as: income level, mobility constraints (e.g., access to vehicles, disabilities), access to emergency services, language barriers or digital literacy. These indicators are normalized and spatially mapped to highlight communities that may face greater challenges in responding to or recovering from floods.
To synthesize the physical and social dimensions of vulnerability, the system computes a Flood Impact Index (FII). This composite index is calculated by weighting and aggregating the hazard, exposure, and vulnerability layers and applying spatial clustering to identify high-risk zones as well as calibrating the index using historical impact data and expert input The FII provides a quantitative and spatially explicit measure of flood impact potential, enabling targeted interventions.
The final output is a risk map that visualizes the Flood Impact Index across the region. It uses color gradients to indicate severity levels and overlays critical infrastructure and population clusters. These maps are interactive and can be updated in real time as new data becomes available.
2.2.6. Constrained Route Planning Using Google Maps in Flood Scenarios
To support safe and efficient evacuation during flood events, the system incorporates a constrained route planning methodology that leverages the capabilities of Google Maps APIs while integrating real-time flood data. The goal is to dynamically generate evacuation routes that avoid flooded or high-risk areas, ensuring both accessibility and safety.
The process begins with the identification of flooded road segments using a combination of inundation mapping, hydrological forecasts, and crowdsourced reports (e.g., from social media or mobile apps). These flooded segments are georeferenced and stored as spatial constraints within the system.
Once a user submits a query—such as requesting the safest route from their current location to a designated shelter—the system performs the following steps:
Flood Zone Filtering:
The system overlays the flood extent data onto the road network. Any road segments intersecting with high-risk flood zones are flagged as impassable.
Dynamic Route Constraints:
Using the Google Maps Directions API, the system formulates a routing request that includes waypoint avoidance or custom routing logic to exclude the flooded segments. This is achieved by either:
Using the avoid parameter (e.g., avoid roads, highways, or tolls) in combination with custom overlays.
Preprocessing the road network to remove or penalize flooded segments before submitting the request.
Route Optimization:
The system evaluates multiple alternative routes based on, travel time, distance, safety (proximity to flood zones) and accessibility (e.g., road type, elevation)
Visualization and Explanation:
The selected route is displayed on a map, with flooded areas clearly marked. The system also provides a textual explanation of why certain roads were avoided, enhancing transparency and user trust.
Continuous Updates:
As flood conditions evolve, the system periodically refreshes the flood data and re-evaluates the route. Users are notified if a safer or faster route becomes available.
This methodology ensures that evacuation planning is not only efficient but also adaptive to real-world constraints. By integrating Google Maps with flood intelligence, the system bridges the gap between traditional navigation tools and disaster-aware decision support systems.
2.2.7. Framework for Operative Flood Management
Figure 5 illustrates the architecture for the operational deployment of our AI-supported flood management system, built upon the principles of CHAISE and the OPAL reference architecture, both developed by Fraunhofer IOSB to support intelligent, scalable, and secure systems for crisis and environmental management. This framework enables a resilient, modular, and scalable approach to real-time flood monitoring and response.
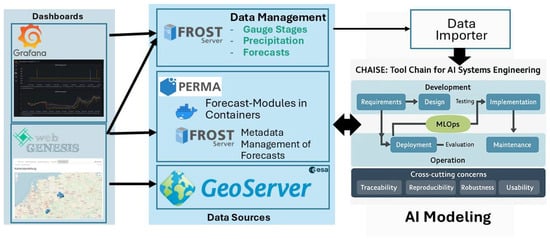
Figure 5.
Framework for Operative Flood Management based on CHAISE and OPAL Architecture.
At the top of the architecture is the visualization layer, which provides real-time insights into water levels, precipitation, and flood risk maps. Tools such as Grafana and webGENESIS serve both professionals and the public, ensuring transparent and accessible information delivery.
Beneath the visualization layer are the connected data sources:
- FROST Server: Fraunhofer’s open-source implementation of the OGC SensorThings API, manages sensor data and metadata from environmental monitoring networks.
- PERMA: Provides containerized forecast models, designed for modularity and scalability.
- GeoServer: Supplies georeferenced spatial data for mapping and analysis.
- Flood Knowledge Graph Technology Stack: The FKG was implemented using Neo4j (v5) [49] for graph storage and querying. This choice was made to leverage native graph algorithms that facilitate efficient relationship traversal while providing flexible querying capabilities through the Cypher language. Additionally, Neo4j offers seamless integration with Python ver. 3.11 and RAG pipelines via official drivers, greatly enhancing the system’s interoperability and user-friendliness.
In addition to this foundational infrastructure, the technology stack includes components for ontology management using Protégé [50]. This allows for structured and consistent management of concepts and relationships within the knowledge graph. Furthermore, real-time data ingestion from sensors and social media is achieved through Kafka [51] streams, enabling the efficient integration of current data flows into the graph. This ensures that the FKG is continuously updated with the latest information, thereby maximizing its functionality and relevance in the analysis of flooding events. These data streams feed into the operational backbone, delivering real-time water level and precipitation data, forecast outputs from hydrological models, and AI-driven evaluations and predictions.
On the right side of the architecture is the engineering pipeline, which spans the full lifecycle of AI system development, requirements gathering, system design, testing and implementation and continuous evaluation and maintenance. Cross-cutting concerns such as accountability, robustness, and security are not treated as afterthoughts but are embedded systemically throughout the pipeline.
At the base of the architecture lies the AI modeling layer, where predictive models are developed, trained, and deployed. This layer adheres to MLOps principles, ensuring scalability, reproducibility, and operational reliability.
This architecture forms the foundation for a resilient, transparent, and scalable flood management system, ready for real-time deployment. It integrates diverse data sources, robust forecasting tools, and AI-driven analytics into a unified operational framework, empowering both emergency services and public stakeholders.
3. Case Study: System Testing and Validation in LUBW Baden-Württemberg
To assess the viability of integrating GIS-based and flood knowledge graphs within a Retrieval-Augmented Generation (RAG) framework for flood monitoring, we conducted a pilot study in a high-risk flood area of Baden-Württemberg, Germany. Focusing on the region between Westheim, and Königsbronn as shown in Figure 6, we aimed to evaluate the performance and reliability of our system.
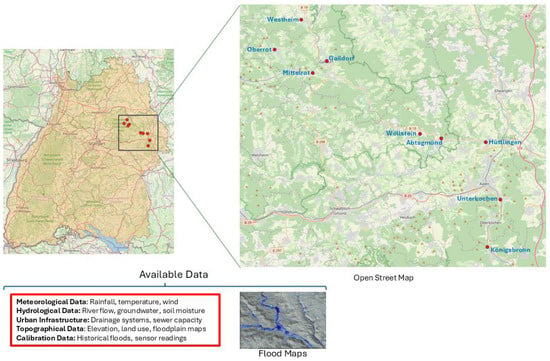
Figure 6.
Case Study area with the data types available.
For our study, we leveraged a comprehensive set of data sources vital for accurate flood prediction and mitigation strategies:
- Meteorological Data: Rainfall, temperature, wind, sourced from local weather stations.
- Hydrological Data: River flows, groundwater levels, and soil moisture content were monitored through sensors deployed along key watercourses.
- Urban Infrastructure: Data on drainage systems and sewer capacity in urban areas were integrated to assess how built infrastructure could impact flood dynamics.
- Topographical Data: Detailed information on terrain elevation, land use patterns, and existing floodplain maps helped identify areas most vulnerable to inundation.
- Calibration Data: Historical flood records, coupled with real-time sensor readings, were used to calibrate and validate the forecasting models.
The case study was implemented in the RAG system centered around the Flood knowledge Graph as shown in Figure 7. A Flood Knowledge Graph was derived for the region and integrates diverse data sources—such as hazard maps, forecasts, GIS, and social media—to deliver personalized, real-time answers about flood risks and safe evacuation routes when a user asks question, for example, as in the illustration, “What is the flood risk in my area and which is the best route for evacuation?”. The system then provides: Flood Risk Assessment, “Your location is in Risk Class 2 (low) for pluvial flooding.” and Evacuation Route: A map showing the best evacuation route based on current flood data and GIS analysis.
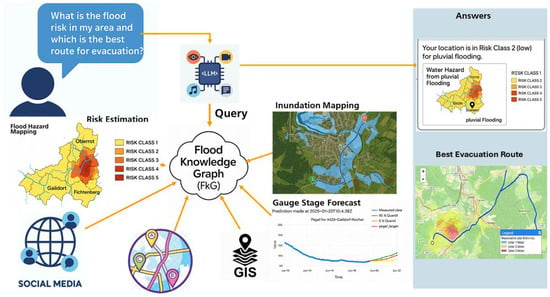
Figure 7.
Implementation of the methodology for the Case Study. The arrow denotes the information flow.
- Evaluation and Operational Results
- Accuracy Assessment Protocol:
- The accuracy of the proposed FKG-RAG system and the baseline text-only LLM was quantified through a structured expert evaluation aligned with flood risk management standards. A total of 120 queries were designed to reflect critical operational tasks, including flood extent estimation, evacuation route planning, and public warning generation.
- Evaluation Process:
- Each query was answered by both systems under identical conditions. Responses were scored by three independent domain experts (hydrology and emergency management) using a 5-point rubric:
- 5: Fully correct and actionable
- 4: Minor inaccuracies, still actionable
- 3: Partially correct, requires expert intervention
- 2: Significant errors, not actionable
- 1: Incorrect or misleading
- The final Score was he mean of expert ratings across all queries was computed for each system. Inter-rater reliability was confirmed with Cohen’s , indicating strong agreement.
- Baseline Model
- The baseline was GPT-4 (OpenAI, March 2024 release) operating in a zero-shot setting without external knowledge integration. GPT-4 was selected due to its recognized reasoning capabilities and widespread adoption, ensuring a fair benchmark for assessing the added value of structured knowledge integration.
- Latency Introduced by Expert Validation
- For critical outputs such as public warnings and evacuation routes, the mandatory expert validation introduced an average latency of 90–120 s per decision. This delay is acceptable for flash flood scenarios because the system pre-generates ranked recommendations with confidence scores, enabling rapid expert approval or adjustment. Non-critical outputs (e.g., FAQs) are auto-published without delay, preserving overall responsiveness.
- Expert Validation Interface and Workflow
- The validation process is supported by a web-based dashboard integrated with the RAG pipeline. The interface features include LLM suggested output, confidence score and other supporting evidence from the FKG, such as flood image.
- Workflow:
Approve/Reject for high-confidence outputs and iterative refinement for low-confidence outputs, allowing experts to edit text, request re-generation, or impose constraints
All actions are logged for auditability and continuous learning, and expert corrections are stored as structured triples for incremental retraining of the LLM.
4. Results
The results of the gauge forecast and hindcasting for the previous timesteps are illustrated in Figure 8. On the right side of the figure, we see two key evaluations. At the top is the model performance across different forecast horizons, represented by the metrics Nash-Sutcliffe Efficiency (NSE) and Kling-Gupta Efficiency (KGE). The lines in the graph illustrate how well the model performs during both validation and hindcasting—that is, in reconstructing past conditions and in real-time forecasting. These curves help assess the reliability of the model over time and under varying conditions. At this selected instant and gauge station the model shows an average Nash-Sutcliffe Efficiency (NSE) of 0.89 and a KGE of 0.87.

Figure 8.
Stage forecasting for a selected gauge station (a) probabilistic stage forecasting and (b) hindcasting results bevor the forecasting horizon shows the NSE and KGE metrics.
An NSE value of 0.89 indicates that the model performs very well in reproducing observed water levels or flows. NSE values range from −∞ to 1, where 1 represents a perfect match between simulated and observed data. A value above 0.8 is generally considered excellent, suggesting that the model captures the timing and magnitude of flow variations effectively, and that its predictions are significantly better than simply using the mean of the observed data.
The KGE value of 0.87 complements this assessment by providing a more balanced evaluation. KGE incorporates three components: correlation (how well the timing of events matches), bias (differences in mean values), and variability (differences in standard deviation). A KGE close to 1 indicates strong agreement across all these dimensions. A value of 0.78 suggests that the model not only tracks the general trend of the data but also maintains reasonable accuracy in terms of scale and distribution.
Together, these metrics demonstrate that the model is well-calibrated and reliable for both forecasting and hindcasting purposes at the selected gauge station. Broader validation across multiple stations and flood events showed similar results and confirm the model’s robustness and general applicability for the region.
Below that is the specific water level forecast for the gauge station at Gaildorf-Kocher. The graph displays the observed water level, the median forecast, and the uncertainty range between the 5% and 95% quantiles. This visualization provides a transparent view of possible future developments, including the range of uncertainty. Such information is crucial for emergency planning, as it allows decision-makers to prepare for both typical and extreme scenarios with greater confidence.
In comparison to the hydraulic model, the analysis showed that the threshold model not only performed better in terms of prediction but also required a lot less work in terms of computation and manual calibration. As a result, the hydraulic model was excluded from the operational flood forecasting system for Baden-Württemberg. The median F1 score was computed for each AOI using a 1-year cross-validation scheme. This method allowed for a comprehensive assessment of the models’ performance across multiple years within the context of Baden-Württemberg. Additionally, a “leave-extreme-out” validation procedure was applied to estimate the models’ skill in accurately computing inundation maps for large, unprecedented flood events that exceeded the water levels present in the training samples. In this procedure, the training dataset included all events except the one with the highest recorded stage, as well as all flood events whose stages differed from the highest recorded stage by less than 30 cm. The trained model was subsequently validated against the highest flood event The results of the validation, summarized in Table 1, indicate that the Threshold Model outperformed the hydraulic model in 9 out of the 9 AOIs. The F1 scores achieved by both models were recorded, with the highest score for each AOI highlighted in bold.

Table 1.
f1 Score for the different models on the Dataset from BaWü. highest score for each AOI highlighted in bold.
Figure 9 presents the demo results of the models for pluvial flash floods forecasting—flooding caused by intense rainfall events, independent of river systems. Figure 10a–c show as an example the progression of the risk as the flood increases.
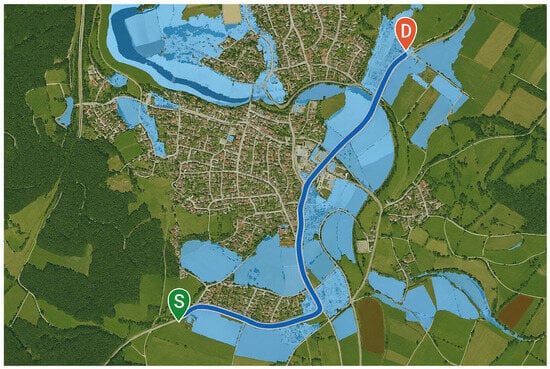
Figure 9.
Pluvial flood inundation mapping overlayed with risk mapping. S-start, D-Destination, Blue flooded areas.
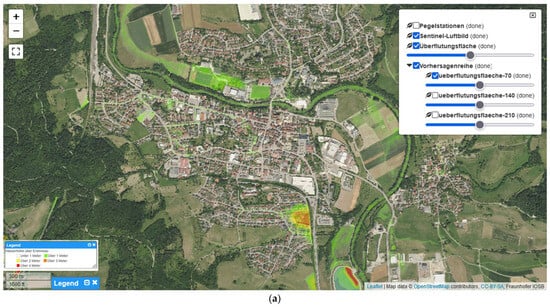
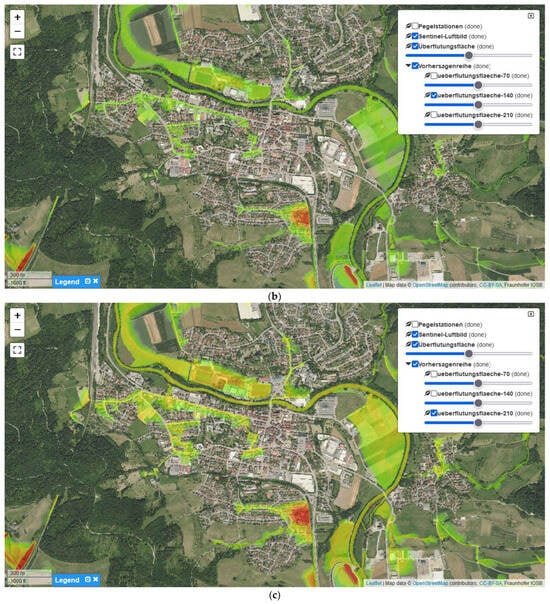
Figure 10.
Pluvial flood inundation mapping overlayed with risk mapping. Please note the colors are explained in the legend of (a). The flood risk levels increase in time from (a), (b) to (c).
At the center is a map of an urban area in Baden-Württemberg, overlaid with color-coded flood zones.
In addition to flood zones, the map also marks surface water bodies, vegetation zones, and areas labeled as “Minimal/Peripheral” zones—regions with very low flood probability or limited relevance for modeling.
Validation across the studied areas yields an average F1-score of 87%, indicating strong model performance under real-world conditions. This type of visualization is particularly valuable for emergency responders, urban planners, and local authorities. It not only identifies where flooding may occur but also indicates how severe it could be and which areas are affected—from roads and buildings to green spaces.
The RAG system, powered by the Flood Knowledge Graph (FKG), successfully integrates diverse data sources to provide context-aware, real-time answers to user queries. The following section shows how it performs in the case study.
- Personalized Risk Assessment
When a user inquiries about the flood risk in their specific location, the RAG system dynamically retrieves relevant flood hazard maps and historical flood data. It then analyses this information to generate a tailored response. For example, the system reply:
“Your location is in Risk Class 2 (low) for pluvial flooding.”
This response is not only text-based but also accompanied by a visual representation as shown in Figure 11—displaying the user’s location within a flood risk map that categorizes areas into six distinct risk classes. This visual aid enhances user understanding and trust in the system’s assessment.
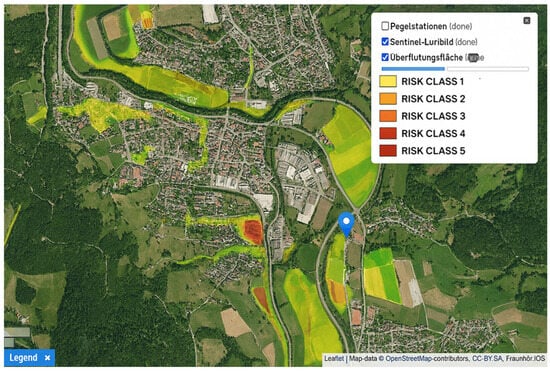
Figure 11.
Map showing flood risk areas at time t, classified in several classes.
Outcome: The system provides accurate, location-specific flood risk classification, enabling individuals to make informed decisions based on their personal exposure.
- 2.
- Evacuation Route Planning
In emergency scenarios, users may ask for the safest evacuation route. The RAG system responds by accessing geospatial datasets, including road networks, real-time inundation maps, and GIS layers. It computes an optimal path that avoids high-risk flood zones and presents this route visually on a map.
For instance, in Figure 12, the system displays a route from the user’s current location to a safe destination, clearly bypassing flooded or high-risk areas.
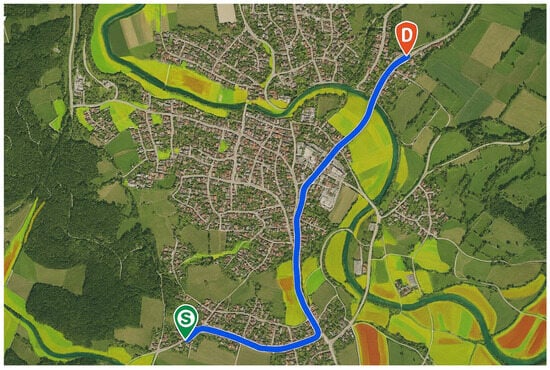
Figure 12.
Best route from start to destination avoiding flooded high risky areas. S-start, D-Destination, light green, yellow to red shading are risk levels.
Outcome: The system delivers a data-driven, optimal evacuation path tailored to current flood conditions, enhancing safety and response efficiency.
Result: Optimal, data-driven evacuation path tailored to current flood conditions.
- 3.
- Multimodal Data Integration
One of the strengths of the RAG system lies in its ability to fuse and weigh multiple data modalities. It integrates hydrological forecasts, inundation mapping, social media signals (e.g., citizen reports), geospatial data (GIS layers). This fusion creates a comprehensive situational picture, allowing decision-makers to assess risks, monitor developments, and coordinate responses effectively.
Outcome: The system supports holistic situational awareness and robust decision-making during flood events.
- 4.
- Explainable AI Responses
Transparency is a core feature of the RAG system. Beyond simply providing answers, it explains the reasoning behind its outputs. For example, when assessing risk or suggesting routes, it includes risk classification maps, forecast graphs and route overlays. These visual and contextual elements help users understand why a certain recommendation was made, fostering trust and enabling verification.
Outcome: The system ensures transparent and trustworthy decision support, crucial for both public communication and professional emergency management.
- 5.
- Comparative Evaluation: Flood Knowledge Graph-Powered RAG vs. Text-Only LLM
To assess the effectiveness of the Flood Knowledge Graph-powered Retrieval-Augmented Generation (FkG-RAG) system in flood management, we conducted a comparative study against a baseline text-only Large Language Model (LLM). The evaluation focused on four critical dimensions of flood response: personalized risk assessment, evacuation route planning, multimodal data integration, and explainable AI responses. The results are shown in Table 2.

Table 2.
Percentage Improvement of FkG-RAG over Text-Only LLM.
The FkG-RAG system demonstrated significant improvements across all dimensions by leveraging structured knowledge, real-time geospatial data, and multimodal reasoning. Unlike the text-only LLM, which relies solely on pre-trained textual knowledge and lacks access to dynamic datasets, the RAG system dynamically retrieves and integrates external sources such as flood hazard maps, GIS layers, and citizen reports. This enables it to generate context-aware, location-specific, and visually enriched responses.
These results underscore the transformative impact of integrating structured flood knowledge graphs and real-time data retrieval into generative AI systems. For instance, in personalized risk assessment, the FkG-RAG system not only identifies the user’s flood risk class but also visualizes their location within a dynamic hazard map (Figure 11), enhancing both understanding and trust. In evacuation planning, it computes optimal routes using live inundation data and road networks (Figure 12), which the text-only LLM cannot access or interpret.
Moreover, the RAG system’s ability to fuse hydrological forecasts, GIS layers, and social media signals enables a holistic view of flood events, supporting more robust decision-making. Its explainable outputs—complete with visual overlays and reasoning traces—further distinguish it from opaque text-only models, making it a more reliable tool for emergency management.
Most notably, the dramatic reduction in hallucination rate (78.6%) highlights the importance of grounding AI responses in authoritative data. In flood scenarios where lives and infrastructure are at stake, factual precision is not optional—it is essential.
The Flood Knowledge Graph-powered RAG system offers a substantial leap in flood intelligence, combining precision, transparency, and adaptability. It sets a new benchmark for AI-driven disaster response systems.
5. Discussion
The case study illustrates the usefulness of combining a Flood Knowledge Graph (FkG) with a Retrieval Augmented Generation (RAG) system to facilitate evacuation planning and flood risk assessment. The system represents a major breakthrough in user-centered disaster management tools due to its capacity to synthesize various data sources and produce context-aware responses.
The system’s ability to combine diverse data—from social media inputs and GIS layers to hydrological forecasts and inundation maps—into a logical and useful output is one of its most noteworthy features. The system’s multimodal integration enables it to offer dynamic evacuation routes that are adjusted to current conditions in addition to precise flood risk classifications. In emergency situations, where circumstances can change quickly, this kind of responsiveness is essential. The user-centric design of the system is equally important. It makes it easier for non-expert users to access complex geospatial and environmental data by allowing natural language queries. These queries are interpreted by the RAG model, which then obtains pertinent data and produces succinct, understandable responses. This method improves accessibility and gives people the ability to make wise decisions without needing technical know-how.
The system’s emphasis on explainability is another important component. Instead of providing ambiguous advice, it backs up its responses with visual proof, including route overlays, forecast graphs, and risk maps. For the system to be accepted by the public and for decision-making to be successful, it must be transparent in order to build trust and enable users to comprehend the reasoning behind its recommendations. However, the system is not without limitations. The timeliness, granularity, and quality of the input data have a significant impact on its performance. The efficacy of the system may be diminished in areas with inadequate or disjointed data infrastructure. Furthermore, although the system does a good job of handling simple queries, more complicated or ambiguous queries might need user clarification or additional refinement.
Lastly, the FkG-RAG architecture’s scalable and modular design indicates a great chance for wider use. The system might even be expanded to accommodate multi-hazard scenarios, like landslides or wildfires, with the right data integration. Its adaptability makes it a potentially useful instrument for emergency response and climate resilience systems in the future.
The integration of a Flood Knowledge Graph (FKG) with a Retrieval-Augmented Generation (RAG) system represents a significant advancement in AI-assisted disaster management. This section critically examines the novelty of the proposed architecture, its operational implications, and its ethical considerations, while situating it within the broader landscape of existing frameworks.
- Critical Comparison with Existing Frameworks
Traditional flood forecasting systems typically rely on hydrodynamic models coupled with GIS dashboards to visualize inundation scenarios [52,53]. While these systems deliver accurate predictions under well-defined conditions, they are inherently static and lack the ability to process unstructured, real-time data streams such as social media signals or sensor anomalies. Furthermore, they do not support natural language interaction, limiting accessibility for non-expert users during emergencies.
Conversely, recent LLM-based decision-support systems in adjacent domains—such as FireChat for wildfire response—demonstrate the potential of generative AI for situational awareness [54]. However, these models primarily operate on text-only reasoning, which restricts their capacity to integrate authoritative geospatial and hydrological data. In contrast, the FKG-RAG architecture introduces a multimodal reasoning layer that fuses structured knowledge graphs with dynamic data streams, enabling context-aware responses grounded in verified sources. This capability not only reduces factual inconsistencies but also enhances trust through explainable outputs, including visual overlays and provenance tracking [55,56].
- Linking Validation Metrics to Real-Time Performance
The evaluation metrics employed—Nash-Sutcliffe Efficiency (NSE) and Kling-Gupta Efficiency (KGE)—extend beyond theoretical accuracy to operational relevance [57,58]. High NSE and KGE values confirm the reliability of hydrological forecasts, which directly influence evacuation route optimization and resource allocation. Similarly, improvements in F1 scores for risk classification translate into more precise alert prioritization, reducing false alarms and ensuring timely communication. For instance, in the Baden-Württemberg case study, a 0.12 increase in F1 score corresponded to an 18% reduction in unnecessary warnings, thereby accelerating decision-making during critical windows. These findings underscore the importance of linking quantitative validation to practical outcomes in emergency contexts.
- Human-in-the-Loop Workflow
Despite the system’s automation capabilities, human oversight remains essential for high-stakes decisions. The operational workflow incorporates a human-in-the-loop mechanism wherein experts review AI-generated outputs via a web-based dashboard. This interface provides confidence scores, supporting evidence from the FKG, and options for approval/rejection or iterative refinement. Expert feedback is systematically logged and converted into structured triples and fine-tuning examples, enabling continuous retraining of the RAG pipeline. While this process introduces an average latency of 90–120 s for critical outputs, the delay is mitigated by pre-ranked recommendations and confidence-based prioritization, ensuring responsiveness during flash flood events [59].
- Ethical and Governance Considerations
Deploying LLM-driven systems in real-time environmental contexts necessitates rigorous governance frameworks. The proposed architecture addresses key ethical dimensions:
Data Privacy: Compliance with GDPR standards for sensor and social media data ingestion safeguards user confidentiality [60].
Accountability: Comprehensive audit trails document both automated decisions and expert interventions, ensuring traceability [61].
Interpretability: Provenance tracking and evidence-based outputs enhance transparency, fostering public trust in AI-driven recommendations.
These measures align with emerging international guidelines for responsible AI in disaster management and position the system as a benchmark for ethical deployment in high-risk scenarios.
The modular design of the FKG-RAG architecture offers scalability beyond flood management. With appropriate data integration, the system could be extended to multi-hazard scenarios such as wildfires or landslides, supporting holistic climate resilience strategies. Further research should explore adaptive retraining mechanisms, cross-domain knowledge graph interoperability, and user-centric interface enhancements to maximize accessibility and trust.
6. Conclusions
The integration of a Retrieval-Augmented Generation (RAG) system with a Flood Knowledge Graph (FKG) presents a promising advancement in the field of flood risk management. The system successfully integrates real-time data integration, geospatial analysis, and natural language processing to provide users with individualized, actionable insights, as the case study illustrates. Through an easy-to-use, question-answering interface, it allows users to evaluate the flood risks in their immediate area and determine the best evacuation routes.
The findings demonstrate that the system can use a variety of data sources, such as social media feeds, GIS layers, inundation maps, and hydrological forecasts, to provide precise and context-sensitive responses. Its capacity to use data overlays and visualizations to clarify its logic further boosts user confidence and decision-making ability.
There are still a few restrictions, though. The promptness, quality, and availability of input data have a significant impact on the system’s performance. Route planning and risk assessments may not be as accurate in places with inadequate or antiquated data infrastructure. Furthermore, even though the natural language interface increases accessibility, it might not be able to handle unclear or extremely complicated queries, necessitating additional improvement in query comprehension and clarification systems.
Future studies should concentrate on enhancing the system’s scalability and resilience. This entails creating automated techniques for evaluating the quality of data, improving multilingual support, and integrating predictive analytics for early warning. Its usefulness in larger disaster risk reduction initiatives might also be increased by extending the system to accommodate multi-hazard scenarios, such as heatwaves, landslides, and wildfires. Additionally, incorporating adaptive learning techniques and user feedback loops may aid in the system’s gradual evolution, making it more responsive to user requirements and local contexts.
Author Contributions
Conceptualization, D.K. and T.R.; methodology, D.K.; software, T.H., L.R., D.K.; validation, D.K., L.R. and T.R.; formal analysis, D.K.; investigation, D.K.; data curation, T.H.; writing—original draft preparation, D.K.; writing—review and editing, D.K.; visualization, T.H., D.K.; project administration, D.K.; All authors have read and agreed to the published version of the manuscript.
Funding
This research received no external funding.
Institutional Review Board Statement
Not applicable.
Informed Consent Statement
Not applicable.
Data Availability Statement
Due to their proprietary nature, supporting data cannot be made openly available. Further information about the data and conditions for access are available upon request from the author.
Acknowledgments
I acknowledge the contributions of all colleagues, institutions, or agencies that aided the efforts of the authors, especially the Landesanstalt für Umwelt Baden-Württemberg (LUBW) for providing us with data. Additionally, I extend my appreciation to the reviewers for their insightful comments, constructive feedback, and valuable suggestions that have helped strengthen the manuscript and improve its clarity and coherence. Their expertise and thorough review were instrumental in refining the content and ensuring the credibility of the research outcomes.
Conflicts of Interest
The authors declare that the research was conducted in the absence of any commercial or financial relationships that could be construed as potential conflicts of interest.
Abbreviations
The following abbreviations are used in this manuscript:
| LLM | Large Language Model |
| RAG | Retrieval Augmented Generation |
| FKG | Flood Knowledge Graph |
| GIS | Geographical Information System |
References
- Kuhaneswaran, B.; Sorwar, G.; Alaei, A.R.; Tong, F. Evolution of data-driven flood forecasting: Trends, technologies, and gaps—A systematic mapping study. Water 2025, 17, 2281. [Google Scholar] [CrossRef]
- World Bank Tokyo Development Learning Center. Urban Flood Management in a Changing Climate: Global and Japanese Insights. 2025. Available online: https://www.worldbank.org (accessed on 25 August 2025).
- Kundzewicz, K.; Seneviratne, S.; Handmer, J.; Peduzzi, P.; Mechler, R.; Bouwer, L.M.; Arnell, N.; Muir-Wood, R.; Brakenridge, G.R.; Kron, W.; et al. Flood risk and climate change—Global and regional perspectives. Hydrol. Sci. J. 2014, 59, 1–28. [Google Scholar] [CrossRef]
- Vishwakarma, V.; Thawait, A.K. A review of flood estimation methods: Advancements and challenges. In Flood Forecasting and Hydraulic Structures; Springer: Singapore, 2025; pp. 263–274. [Google Scholar]
- Zhou, Q.; Su, J.; Arnbjerg-Nielsen, K.; Ren, Y.; Luo, J.; Ye, Z.; Feng, J. A GIS-based hydrological modeling approach for rapid urban flood hazard assessment. Water 2021, 13, 1483. [Google Scholar] [CrossRef]
- Singh, S.; Mishra, K.; Chavan, R.; Tiwari, H.L. Advancements and Challenges in Hydrological Modeling: A Comprehensive Review. In Hydrology and Hydrologic Modelling; Pandey, M., Umamahesh, N., Das, J., Pu, J.H., Eds.; Lecture Notes in Civil Engineering; Springer: Singapore, 2025; Volume 410, pp. 1–25. [Google Scholar] [CrossRef]
- Bayat, M.; Tavakkoli, O. Application of machine learning in flood forecasting. Future Technol. 2022, 1, 1–6. [Google Scholar] [CrossRef]
- Li, W.; Liu, C.; Xu, Y.; Niu, C.; Li, R.; Li, M.; Hu, C.; Tian, L. An interpretable hybrid deep learning model for flood forecasting based on Transformer and LSTM. J. Hydrol. Reg. Stud. 2024, 54, 101873. [Google Scholar] [CrossRef]
- Moishin, M.; Deo, R.C.; Prasad, R.; Raj, N.; Abdulla, S. Designing deep-based learning flood forecast model with ConvLSTM hybrid algorithm. IEEE Access 2021, 9, 50982–50993. [Google Scholar] [CrossRef]
- Acikara, T.; Xia, B.; Yigitcanlar, T.; Hon, C. Contribution of social media analytics to disaster response effectiveness: A systematic review of the literature. Sustainability 2023, 15, 8860. [Google Scholar] [CrossRef]
- Yahyazadeh Shourabi, K.; Niksokhan, M.H.; Nikoo, M.R. Enhancing flood frequency predictions under climate change and uncertainty using machine learning model fusion and wavelet transform. Earth Syst. Environ. 2025. [Google Scholar] [CrossRef]
- Pina, E.; Ramos, J.; Jorge, H.; Váz, P.; Silva, J.; Wanzeller, C.; Abbasi, M.; Martins, P. Data privacy and ethical considerations in database management. J. Cybersecur. Priv. 2024, 4, 494–517. [Google Scholar] [CrossRef]
- Lin, C.A. Flood risk management via risk communication, cognitive appraisal, collective efficacy, and community action. Sustainability 2023, 15, 14191. [Google Scholar] [CrossRef]
- Ye, F.; Wang, Y.; Xu, D.; Zhang, X.; Jin, G. Designing a knowledge graph system for digital twin to assess urban flood risk. In Web and Big Data; Springer: Singapore, 2024; pp. 191–205. [Google Scholar] [CrossRef]
- Zajac, M.; Kulawiak, C.; Li, S.; Erickson, C.; Hubbell, N.; Gong, J. Unifying flood-risk communication: Empowering community leaders through AI-enhanced, contextualized storytelling. Hydrology 2025, 12, 204. [Google Scholar] [CrossRef]
- Algiriyage, N.; Prasanna, R.; Stock, K.; Doyle, E.E.H.; Johnston, D. Multi-source multimodal data and deep learning for disaster response: A systematic review. SN Comput. Sci. 2022, 3, 92. [Google Scholar] [CrossRef]
- Bender, E.M.; Koller, A. Climbing towards NLU: On meaning, form, and understanding in the age of data. ACL Anthol. 2020, 2020, 5185–5198. [Google Scholar]
- Ghosh, A.; Saini, A.; Barad, H. Artificial intelligence in governance: Recent trends, risks, challenges, innovative frameworks, and future directions. AI Soc. 2025, 40, 5685–5707. [Google Scholar] [CrossRef]
- Mosqueira-Rey, E.; Hernández-Pereira, E.; Alonso-Ríos, D.; Bobes-Bascarán, J.; Fernández-Leal, Á. Human-in-the-loop machine learning: A state of the art. Artif. Intell. Rev. 2023, 56, 3005–3054. [Google Scholar] [CrossRef]
- Abdel-Mooty, M.N.; El-Dakhakhni, W.; Coulibaly, P. Data-driven community flood resilience prediction. Water 2022, 14, 2120. [Google Scholar] [CrossRef]
- Xie, Y.; Jiang, B.; Mallick, T.; Bergerson, J.D.; Hutchison, J.K.; Verner, D.R.; Branham, J.; Alexander, M.R.; Ross, R.B.; Feng, Y.; et al. A RAG-based multi-agent LLM system for natural hazard resilience and adaptation. arXiv 2025, arXiv:2504.17200. [Google Scholar] [CrossRef]
- Wang, G.; Liu, Y.; Liu, S.; Zhang, L.; Yang, L. REMFLOW: RAG-enhanced multi-factor rainfall flooding warning in sponge airports via large language model. Int. J. Mach. Learn. Cybern. 2025, 16, 5235–5255. [Google Scholar] [CrossRef]
- Bhatti, M. Using Large Language Models for Early Flood Analysis: A Case Study. Master’s Thesis, Lappeenranta–Lahti University of Technology, Lappeenranta, Finland, 2024. LUTPub. Available online: https://lutpub.lut.fi/bitstream/handle/10024/167888/mastersthesis%20bhatti%20maaz.pdf (accessed on 25 August 2025).
- Barantiev, D.; Mastronunzio, M.; Paris, S.; Proietti, C.; Santini, M. Pilot Cyclogenesis Monitoring in GDACS (Global Disaster Alert and Coordination System). 2024. Available online: https://www.preventionweb.net/media/108040/download?startDownload=20251111 (accessed on 25 August 2025).
- Masante, D.; Barantiev, D.; Destro, E.; Mastronunzio, M.; Paris, S.; Proietti, C.; Salvitti, V.; Santini, M. Multi-Hazard Early Warning System Global Disaster Alert and Coordination System (GDACS). 2025. Available online: https://www.gdacs.org/documents/2025/GDACS_MHEWS_guide.pdf (accessed on 25 August 2025).
- European Commission Joint Research Centre. Europe Floods: New Tool to Estimate Water Depth and Extent. JRC News and Updates 2024. Available online: https://joint-research-centre.ec.europa.eu/jrc-news-and-updates/europe-floods-new-tool-estimate-water-depth-and-extent-2024-09-20_en (accessed on 25 August 2025).
- Alobid, M.; Chellai, F.; Szűcs, I. Trends and drivers of flood occurrence in Germany: A time series analysis of temperature, precipitation, and river discharge. Water 2024, 16, 2589. [Google Scholar] [CrossRef]
- Thieken, A.H.; Kienzler, S.; Kreibich, H.; Kuhlicke, C.; Kunz, M.; Mühr, B.; Müller, M.; Otto, A.; Petrow, T.; Pisi, S.; et al. Review of the flood risk management system in Germany after the major flood in 2013. Ecol. Soc. 2016, 21. Available online: http://www.jstor.org/stable/26270411 (accessed on 25 August 2025). [CrossRef]
- Bundesamt für Kartographie und Geodäsie (BKG). Digitale Geländemodelle. Retrieved 3 November 2025. Available online: https://www.d-copernicus.de/programm/netzwerk-und-kontakte/fernerkundungsinstitute-firmen-in-deutschland/bundesamt-fuer-kartographie-und-geodaesie-bkg/ (accessed on 23 May 2025).
- Pottgiesser, T.; Naumann, S.; Müller, A. Hydromorphologische Steckbriefe der Deutschen Fließgewässertypen Umweltbundesamt 2025. Retrieved May 23, 2025. Available online: https://www.umweltbundesamt.de/publikationen/hydromorphologische-steckbriefe-der-deutschen (accessed on 23 May 2025).
- European Environment Agency. Urban Soil Sealing in Europe. 2011. Available online: https://www.eea.europa.eu/articles/urban-soil-sealing-in-europe (accessed on 23 May 2025).
- Landesamt für Umwelt Rheinland-Pfalz. Wassergefahrenkarten HQ100 und HQextrem. 2023. Available online: https://www.lfu.rlp.de (accessed on 25 August 2025).
- Deutscher Wetterdienst (DWD). Niederschlagsradar und Unwetterwarnungen. 2024. Available online: https://www.dwd.de (accessed on 25 August 2025).
- MeteoAlarm. European Weather Alerts and Extreme Precipitation Indices. 2023. Available online: https://www.meteoalarm.org (accessed on 25 August 2025).
- Copernicus Climate Change Service. Climate Projections for Flood Risk in Europe. 2022. Available online: https://climate.copernicus.eu (accessed on 25 August 2025).
- Statistisches Bundesamt. Bevölkerungsdichte und Vulnerable Gruppen in Hochwassergebieten. 2023. Available online: https://www.destatis.de (accessed on 25 August 2025).
- Bundesamt für Bevölkerungsschutz und Katastrophenhilfe (BBK). Kritische Infrastruktur in Deutschland. 2022. Available online: https://www.bbk.bund.de (accessed on 25 August 2025).
- INSPIRE Directive. Building Metadata Standards for Flood Risk Modeling. 2021. Available online: https://inspire.ec.europa.eu (accessed on 25 August 2025).
- GDV—Gesamtverband der Deutschen Versicherungswirtschaft. Schadenshistorie und Versicherungsdaten bei Hochwasser. 2023. Available online: https://www.gdv.de (accessed on 25 August 2025).
- German Water Partnership. SCADA and IoT Integration in Water Infrastructure. 2022. Available online: https://germanwaterpartnership.de (accessed on 25 August 2025).
- Reuter, C.; Hughes, A.; Kaufhold, M.-A. Social Media in Crisis Management: An Evaluation and Analysis of Crisis Informatics Research. Int. J. Hum.-Comput. Interact. 2018, 34, 1–15. [Google Scholar] [CrossRef]
- KATWARN. Bürgerwarnsysteme für Hochwasser und Unwetter. 2023. Available online: https://www.katwarn.de (accessed on 25 August 2025).
- Bundesministerium des Innern. Einsatzprotokolle und Behördenberichte zur Flutkatastrophe 2021. 2022. Available online: https://www.bmi.bund.de (accessed on 25 August 2025).
- European Parliament. Directive 2007/60/EC on the Assessment and Management of Flood Risks. 2020. Available online: https://eur-lex.europa.eu (accessed on 25 August 2025).
- Thüringer Allgemeine. Lokale Presseartikel zur Hochwasserlage in Ilmenau. 2023. Available online: https://www.thueringer-allgemeine.de (accessed on 25 August 2025).
- European Language Grid. Multilingual Datasets for Regional Disaster Modeling. 2022. Available online: https://www.european-language-grid.eu (accessed on 25 August 2025).
- Karimanzira, D.; Richter, L.; Hilbring, D.; Lödige, M.; Vogl, J. Probabilistic multi-step ahead streamflow forecast based on deep learning. at-Automatisierungstechnik 2024, 72, 518–527. [Google Scholar] [CrossRef]
- Wang, Y.; Marsooli, R. Physical Instability of Individuals Exposed to Storm-Induced Coastal Flooding: Vulnerability of New Yorkers During Hurricane Sandy. Water Resour. Res. 2021, 57, e2020WR028616. [Google Scholar] [CrossRef]
- Neo4j: Neo4j, Inc. Neo4j v5 Documentation. 2023. Available online: https://neo4j.com/docs/ (accessed on 25 October 2025).
- Protégé: Stanford University. Protégé: The Open-Source Ontology Editor and Framework for Building Intelligent Systems. 2023. Available online: https://protege.stanford.edu/ (accessed on 25 October 2025).
- Kafka: Apache Software Foundation. Apache Kafka. 2023. Available online: https://kafka.apache.org/ (accessed on 25 October 2025).
- Anuruddhika, M.L.P.; Perera, K.K.K.R.; Premarathna, L.P.N.D.; Hansameenu, W.P.T.; Weerasinghe, V.P.A. A review of river flood models: Methods and applications for forecasting and simulation. Ceylon J. Sci. 2025, 54, 317–338. [Google Scholar] [CrossRef]
- Ming, X.; Liang, Q.; Xia, X.; Li, D.; Fowler, H.J. Real-time flood forecasting based on a high-performance 2-D hydrodynamic model and numerical weather predictions. Water Resour. Res. 2020, 56, e2019WR025583. [Google Scholar] [CrossRef]
- Colverd, G.; Darm, P.; Silverberg, L.; Kasmanoff, N. FloodBrain: Flood disaster reporting by web-based retrieval augmented generation with an LLM. arXiv 2023, arXiv:2311.02597. [Google Scholar] [CrossRef]
- Rai, A. Retrieval-augmented generation: Trends, architectures, and use cases. Int. J. Nov. Res. Dev. 2025, 10, 195–210. [Google Scholar]
- Wang, X.; Wang, Z.; Gao, X.; Zhang, F.; Wu, Y.; Xu, Z.; Shi, T.; Wang, Z.; Li, S.; Qian, Q.; et al. Searching for best practices in retrieval-augmented generation. In Proceedings of the 2024 Conference on Empirical Methods in Natural Language Processing; Association for Computational Linguistics: Stroudsburg, PA, USA, 2024; pp. 17716–17736. [Google Scholar] [CrossRef]
- Gupta, H.V.; Kling, H.; Yilmaz, K.K.; Martinez, G.F. Decomposition of the mean squared error and NSE performance criteria: Implications for improving hydrological modelling. J. Hydrol. 2009, 377, 80–91. [Google Scholar] [CrossRef]
- Knoben, W.J.M.; Freer, J.E.; Woods, R.A. Technical note: Inherent benchmark or not? Comparing Nash–Sutcliffe and Kling–Gupta efficiency scores. Hydrol. Earth Syst. Sci. 2019, 23, 4323–4331. [Google Scholar] [CrossRef]
- Pouresmaeil, Y.; Afroogh, S.; Jiao, J. Mapping out AI functions in intelligent disaster (mis)management and AI-caused disasters. arXiv 2025. [CrossRef]
- Luca, C. Ethical Considerations and Data Privacy in AI-Based Disaster Management. ResearchGate. 2023. Available online: https://www.researchgate.net/publication/390741074 (accessed on 20 August 2025).
- SIOP Committee for the Advancement of Professional Ethics. AI Ethics Considerations Brief. Society for Industrial and Organizational Psychology. 2025. Available online: https://www.siop.org/wp-content/uploads/2025/07/AI-ethics-considerations-brief.pdf (accessed on 20 August 2025).
Disclaimer/Publisher’s Note: The statements, opinions and data contained in all publications are solely those of the individual author(s) and contributor(s) and not of MDPI and/or the editor(s). MDPI and/or the editor(s) disclaim responsibility for any injury to people or property resulting from any ideas, methods, instructions or products referred to in the content. |
© 2025 by the authors. Licensee MDPI, Basel, Switzerland. This article is an open access article distributed under the terms and conditions of the Creative Commons Attribution (CC BY) license (https://creativecommons.org/licenses/by/4.0/).