Abstract
Nowadays, eye fatigue is becoming more common globally. However, there was no objective and effective method for eye fatigue detection except the sample survey questionnaire. An eye fatigue detection method by machine learning based on the Single-Channel Electrooculography-based System is proposed. Subjects are required to finish the industry-standard questionnaires of eye fatigue; the results are used as data labels. Then, we collect their electrooculography signals through a single-channel device. From the electrooculography signals, the five most relevant feature values of eye fatigue are extracted. A machine learning model that uses the five feature values as its input is designed for eye fatigue detection. Experimental results show that there is an objective link between electrooculography and eye fatigue. This method could be used in daily eye fatigue detection and it is promised in the future.
1. Introduction
With the rapid development of modern society, the production modes are constantly being innovated, people are suffering from the overuse of their eyes because they have to spend excessive time facing computers and mobile phones [1]. Our eyes struggle to cope with such a high workload that is causing eye fatigue and even some eye diseases [2]. To reduce eye fatigue, timely measurement of eye fatigue has become an urgent research topic. However, individuals often judge the state of fatigue relying on their subjective feelings which cannot distinguish mental fatigue from eye fatigue. Therefore, it is necessary to evaluate eye fatigue by objective and scientific methods.
At present, there are three main ways to measure fatigue, and they mainly focus on mental fatigue. However, there is a lack of investigations on eye fatigue [3]. External cameras were used in the latest fatigue detection method to record the human face. All movements of human heads (such as facial expressions, the direction and amplitude of the head movements, eyelid movement, the direction of the line of sight, etc.) are captured by the cameras and modeled by image processing technology. Fatigue levels would be evaluated according to the image data processing results. The main disadvantage of this method is the low accuracy resulting from the instability of the video signal. It is also easy to be affected by the external environment (such as light, device jitter, and human body movements) [1,4].
Another method of detecting fatigue is using machine learning to measure the fatigue level comprehensively by collecting multimodal physiological signals as the input of the machine learning model. The multimodal physiological signals mentioned above consist of electroencephalographic (EEG), electrocardiogram (ECG), respiratory signals electrooculography (EOG), blood pressure, pulse, skin impedance, body temperature, etc. [5,6]. A major advantage of this method is the relatively high accuracy as a consequence of the comprehensiveness of physiological signals used in this method. Nevertheless, a multitude of devices has to be worn by subjects in this kind of experiment, which is intensely inconvenient and costly. Furthermore, a host of parameters used for the analysis can easily lead to a dimensional disaster of the algorithm. Accordingly, this type of fatigue assessment method is inconvenient in practical use and can only be tested in the laboratory environment.
There is also a traditional fatigue detection method that is based on external parameters [7]. In this method, subjects are asked to complete a prescribed series of tasks under some set-up special experimental scenarios (such as driving stimulation) [8]. The level of fatigue is classified by the degree of completion of the tasks. This kind of method has long been used in detecting fatigued driving. However, due to its high experimental complexity, long experiment time, and large differences between subjects, resulting in its poor robustness, therefore, can only be used for special purposes [9].
This section has reviewed the three dominant methods of measuring fatigue. Nevertheless, the above methods are aimed at measuring mental fatigue or physical fatigue. There is practically no specific research on eye fatigue detection. This article presented a system for eye fatigue detection, the algorithm of the system can evaluate the level of eye fatigue only by analyzing the single-channel EOG signal. The self-developed eye fatigue detection device is convenient to use and low in cost. The system can be integrated and interacted with using a mobile phone, which is straightforward for the users to operate, save and check historical data. The problems of inconvenient installation, high cost, and difficulty in using traditional equipment are optimized in this article. Furthermore, the importance and originality of this study are that it explores the link between EOG and eye fatigue and it provides an opportunity to advance the detection of eye fatigue.
The paper is organized as follows: Section 1 describes the background and motivations, an overview of the fatigue detection techniques. Section 2 introduces the system structure and the EOG working principle. The design of the hardware system is explained in this section. Section 3 considers the eye fatigue experiments, introduces the experimental process and the data collection. Section 4 is devoted to introduce the EOG signal preprocessing, several major feature extraction and classification methods. Section 5 provides the experimental setting and results to demonstrate the effectiveness of our model. The main conclusion of our research is presented in Section 6. Finally, Section 7 states the limitations of this study and indicates the possible direction of our future work.
2. System Structure and Working Principle
2.1. How EOG Works
Electrooculography (EOG) is a technique that detects eye movements by measuring the electrical potential between the cornea and the retina. The eye assumes the role of the electrode between the cornea (positive electrode) and the retina (negative electrode). Any rotation of the eye in any direction causes a change in the electrical signal of the eye [10]. Previous research has established that the amplitude of the EOG signal typically varies between 50 uv and 3500 uv, with a frequency of 0–100 Hz. The amplitude of EOG and the angle of eye movement showed a similar linear trend when the eye movement direction is in the range of ±50 degrees horizontally and ±30 degrees vertically [11]. Figure 1 and Figure 2, respectively, show the schematic diagram of the change in the amplitude of EOG caused by right eye movement and left eye movement.

Figure 1.
The change of EOG in right eye movement.

Figure 2.
The change of EOG in left eye movement.
2.2. System Structure
As can be seen from Figure 3, the electrode GND (GND is the ground electrode) located on the forehead produces the common reference ground voltage for the system to reduce interference [12]. The two electrodes EOGL and EOGR are located midway between the left and right eye and the left and right temple, respectively, to obtain eye movement information. The chart below shows the system block diagram for EOG measurement.
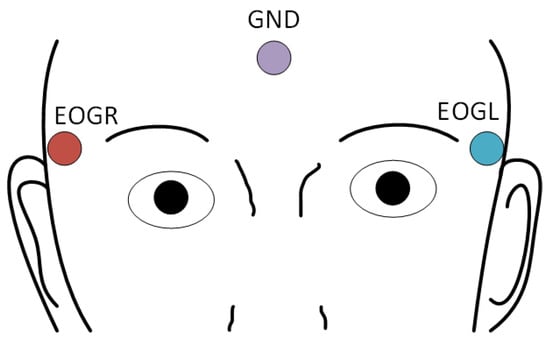
Figure 3.
Schematic diagram of the EOG measurement.
As shown in Figure 4, the system is composed of the signal acquisition module which consists of three electrodes, signal amplifying circuit, off-chip EMI filter, multiplexer, low noise amplifying module, high precision sampling circuit ADS1191 (ADS1191 is a chip with Low-Power, 2-Channel, 16-Bit Analog Front-End for biopotential measurements, produced by Texas Instruments), main control module CC2640 as the MCU for this system (CC2640 is a low power Bluetooth wireless microcontroller, produced by Texas Instruments), peripheral button, and led indicator lamp. The electrodes and the Electro Magnetic Interference (EMI) filter circuit form the front end of the EOG signal acquisition, which extracts the EOG signal and sends it to the multiplexer (MUX, integrated in ADS1191) module after it has been filtered by the EMI filter. The signal is then converted from a weak current signal into a voltage signal by an amplifier circuit, which is sampled by a high-precision sampling module at a frequency of 256 Hz and sent to the microcontroller (MCU) master control module. Additionally, the peripheral devices, such as buttons and LED indicators are used for external interaction with the system.
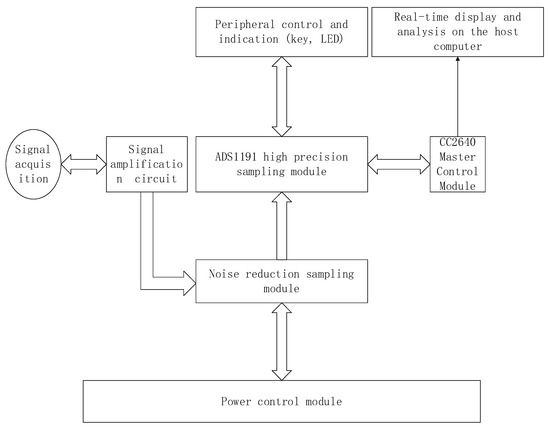
Figure 4.
System block diagram of EOG measurement.
3. Experiment Task
This study intends to explore a reliable and efficient method for eye fatigue detection; therefore, it is indispensable to present an objective eye fatigue experiment. After comprehensive research, there is a lack of authoritative and objective evaluation systems for quantitative indicators of eye fatigue worldwide. Until 18 July 2019, the China Electronic Video Industry Association released an industry standard in Beijing: “Display Terminal Visual Fatigue Test and Evaluation Method Part 2 Scale Evaluation Method” [13] (Figure 5). This standard combines the experience of domestic and international research and designs a highly relevant visual fatigue test scale. The test content mainly includes dry eyes, blurred eyes, double vision, eye tears, eye burning, eye pain, eye tearing, eye strain, eye irritation, etc. The scale is shown as below (the original version is in Chinese, the version shown below is translated and edited into English by ourselves):
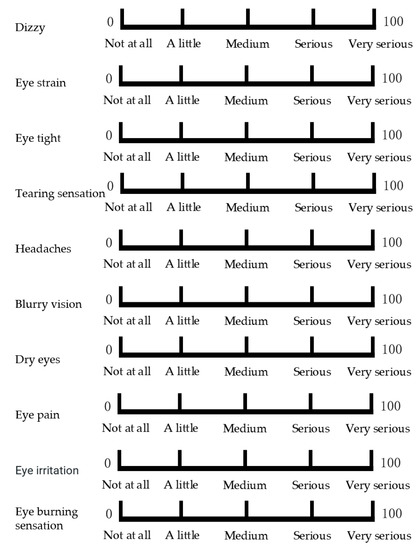
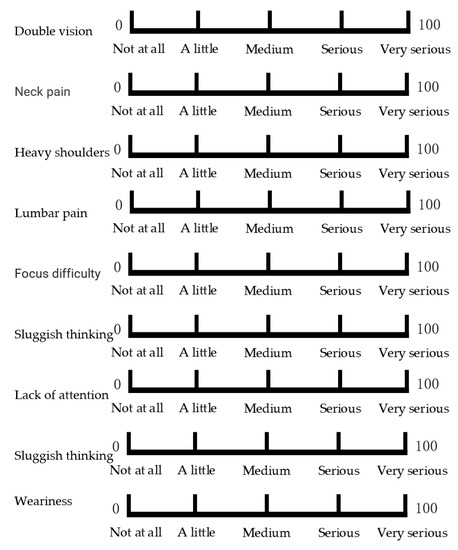
Figure 5.
Display terminal visual fatigue test and evaluation method part 2 scale evaluation method [13].
Upon its release, the scale became the only visual industry official standard scale for eye fatigue and provided an authoritative method of measuring eye fatigue. In this article, 12 subjects aged between 24 and 32 years old, with no eye disease other than myopia, were selected and tested over a period. To make the test scenario more relevant to characters’ daily eye habits, the test was divided into three periods daily. The first period is from 8:00 a.m.–9:00 a.m., when most folks are just starting to work and study, the level of eye fatigue is usually low. The second period is from 11:30 a.m.–12:00 a.m. when individuals are finishing their intensive work in the morning and the fatigue level is usually high. The third period is from 5:30 p.m.–6:00 p.m., during which the subjects showed a more pronounced variation in eye fatigue. Figure 6 presents the eye fatigue experiment process.
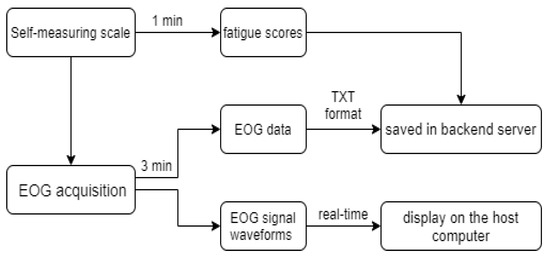
Figure 6.
Eye fatigue experiment process.
Participants were asked to respond using the above eye fatigue scale in one minute, the self-test results were stored in the backend server. After the self-test, subjects wearing the self-study eye fatigue detection device begin a 3 min EOG acquisition. During this process, the subjects were asked to close their eyes the entire time and to be in a state of complete natural relaxation. The EOG signal is displayed in real-time and synchronously on the host computer designed in this article, and the data is saved in PC local as TXT format for follow-up analysis. After a sustained period of testing, over 300 sets of EOG data were obtained for this article.
4. Method
4.1. Signal Pre-Processing
Initially extracted EOG signal was interspersed with significant industrial frequency interference and unavoidable baseline drift which needs to be pre-processed [14]. The frequency of the EOG signal is in the range of 0.2–30 Hz. The main interference sources are baseline drift and power frequency noise. To eliminate power line interference and baseline drift, a notch wave of 50 Hz and a fourth-order band-pass filter of 0.2–30 Hz is devised in this article.
From Figure 7, it is apparent that the EOG signal becomes smooth and clear after it has been filtered by the two filters. The quality of the EOG signal has been improved significantly therefore it has a high signal-to-noise ratio.
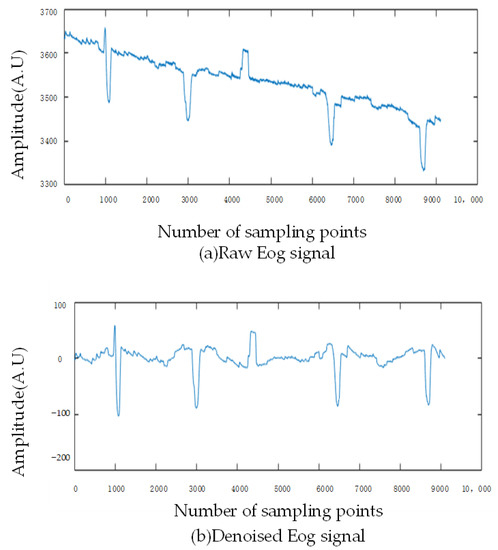
Figure 7.
Comparison of raw EOG signal and processed EOG signal.
4.2. Feature Extraction
After pre-processing of the raw EOG signal to remove the IFR and baseline drift, as the input features for the model, the eigenvalues related to eye fatigue are extracted. Eye rotation, according to the different rotation angles and amplitude, will produce the EOG signal with different directions and amplitude [15]. There are more than 20 features of EOG signal: Proportion of slow eye movements, the average amplitude of slow eye movements, the variance of slow eye movements, proportion of fast eye movements, peak speed of fast eye movements, average amplitude of fast eye movements, the variance of fast eye movements, blink duration, eye closure duration, eye-opening duration, eye-opening delay, eye-opening delay to blink duration ratio, blink interval, the average amplitude of blink, the peak speed of eye closure, the peak speed of eye-opening, the average speed of eye closure, eye-opening average blink amplitude, peak eye closing velocity, peak eye-opening velocity, average eye closing velocity, average eye-opening velocity, horizontal eye low frequency to high-frequency energy ratio, vertical eye low frequency to high-frequency energy ratio, etc. However, not all of these features mentioned above correlate closely with eye fatigue, blindly extracting all these features as a basis for eye fatigue analysis could lead to the dimensional disaster in the model. To avoid this problem, this paper designs several different arrangement combinations of these characteristic values and carries on the verification experiment. In this verification experiment, the pairing t-test method is used to rank the importance of the two-two characteristics in descending order. As the result, 5 features of 5 EOG signals, which are greatest correlated with eye fatigue, were selected. The 5 features contain slow eye movement features, fast eye movement features; energy peak frequency features, number and ratio of eye movement peaks features, and alignment entropy features. The following two illustrations (Figure 8 and Figure 9) showed the extracted features and the rank of all features and the five selected features in the form of a directional diagram.
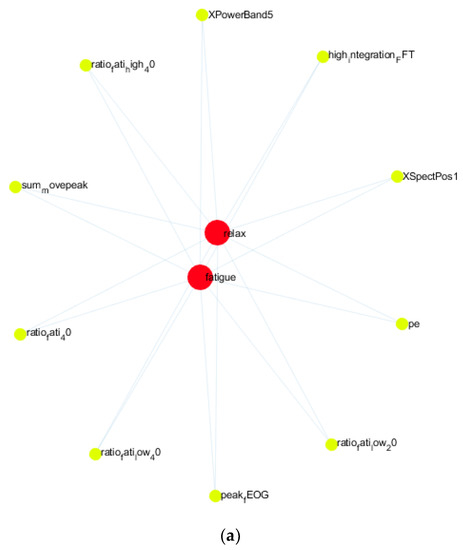
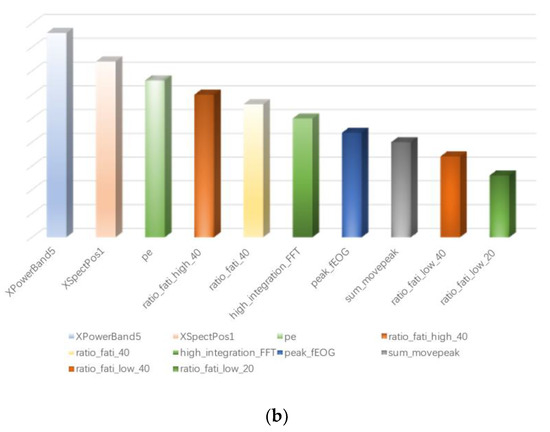
Figure 8.
(a) The extracted features as a directed graphical. (b) Correlation ranking of all features.
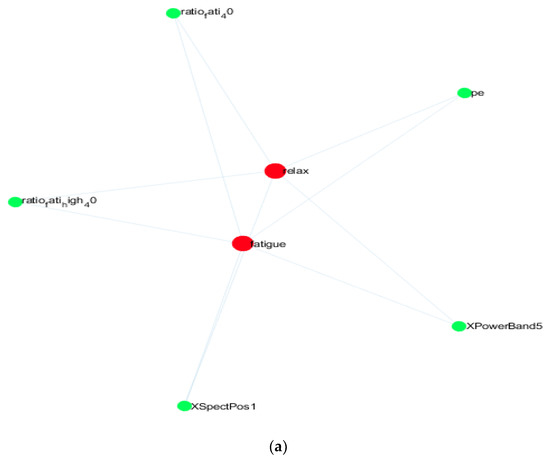
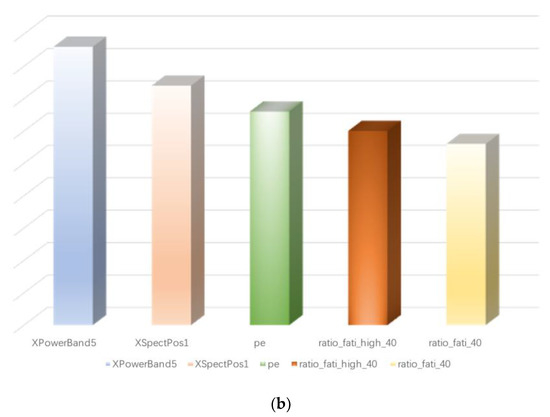
Figure 9.
(a) The 5 selected features as a directed graphical. (b) Correlation ranking of the 5 selected features.
As the Figure 8b shows, the ranking of correlation between all EOG features and eye fatigue is as follows: XPowerBand5 (Energy spectrum value), XSpectPos1 (Spectrum peak value), pe (Arrange entropy values), ratio_fati_high_40 (Percentage of right eye movement amplitude), ratio_fati_40 (Percentage of eye movement), high_integration_FFT (Spectrum integration), peak_fEOG (Number of peak right eye movement points), sum_movepeak (Total number of peak points), ratio_fati_low_40 (Proportion of left eye movement_1), ratio_fati_low_20 (Proportion of left eye movement_2).
Figure 9b shows the correlation ranking of the 5 selected features. In the next several sub-chapters, the details and extraction methods for these five features would be described in detail below.
4.2.1. Slow and Fast Eye Movement Feature Extraction
Medical researchers have proven that slow eye movements reflect the three different states of drowsiness, wakefulness, and light sleep, which are closely related to mental fatigue and eye fatigue of humans [16,17]. There are three types of eye movements belonging to slow eye movements, which are drifting, rolling, and oscillating with frequencies between 0.1 Hz and 1 Hz [18]. The above three eye movements could be treated as one type during the processing of the EOG signal. From experiments, it has been proven that slow eye movements have the most obvious signal characteristics in the range of 0.2–0.6 Hz. For efficiently extracting slow eye movement features, this paper designed a band-pass filter. A 16-fold downsampling operation is first performed on the EOG signal. Then, the signal is transformed by a 256-point FFT to obtain the spectrum. Finally, the spectral integration values, which are frequencies in the range of 0.2–0.6 Hz, were taken as the slow eye movement features. The extraction process for fast eye movement features is the same as slow eye movement, except that the downsampling fold is 16 and the frequencies range of spectral integration values is 1–2 Hz.
4.2.2. Energy Peak Frequency Feature Extraction
To extract the energy peak frequency feature, this paper introduces a Welch spectrum estimation method that differs from the standard periodic one. As an improved method of standard periodic spectrum estimation, the Welch spectral estimation method can reduce the noise. In the process of extracting the Welch spectrum, the signal is firstly windowed by a rectangular function. The power spectrum of the windowed signal is estimated by Welch, then the peak of the power spectrum is obtained by differential threshold algorithm. Finally, the first 6 maximum amplitude values of this peak point and their corresponding frequencies are extracted as the energy peak frequency features of this segment. As shown in Figure 10, the six values and frequencies are denoted as the red makers named Pw1, Pw2, Pw3, Pw4, Pw5, Pw6; Fw1, Fw2, Fw3, Fw4, Fw5, and Fw6, respectively.
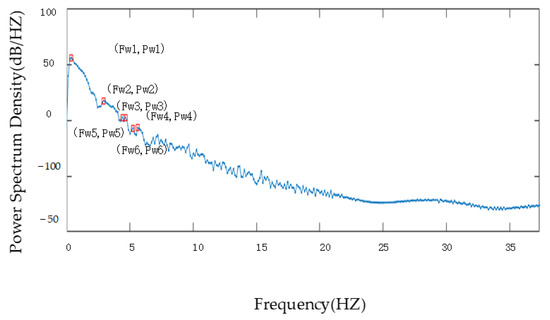
Figure 10.
Welch spectral estimation of the denoised signal (Figure 7b).
4.2.3. Eye Movement Peak Ratio Feature Extraction
The prominent patterns of eye movements are classified as moving to the left eye movements, right eye movements, and blinking. To simplify the complexity of the EOG measuring device and therefore improve the comfort when wearing, this paper designs a single-channel device with three electrodes. Electrodes are not placed on the upper and lower part of the eye for testing, so the blink signal is not detected. To extract the eye movement peak ratio feature, firstly, the baseline threshold THB is set and the signal is rectangular-sized (as shown in Figure 11). Then, use the differential thresholding algorithm to extract the peak and trough values of the eye movement signal. Finally, the ratio of the number of peaks and troughs to the number of points sampled is counted separately. As the eye movement peak ratio feature, this ratio is expressed in a physiological sense as the frequency of eye movements to the right and the frequency of eye movements to the left, respectively. Equations (1) and (2) show the calculation method.
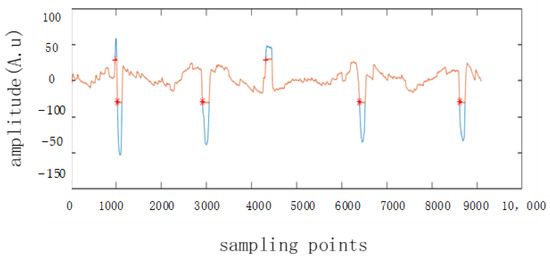
Figure 11.
Eye movement signal recognition (red+ indicates right movement, red* indicates left movement).
The above represents the percentage of right eye movement and the TotalN is the total number of eye movements to the right and the left. The percentage of right eye movement is calculated in the same way as in Formula (1).
4.2.4. Permutation Entropy Extraction
The permutation entropy reflects the degree of regularity of EOG signal in different states and is calculated as follows:
Express the electrooculogram signal as a matrix X2(), = 1, 2, n. First, the phase space of the signal is constructed and the reconstructed space is as in Formula (3): Where is the reconstruction component, , denotes the delay time.
Second, extract the sequence of symbols, the th component, which is the row of the reconstructed matrix, is sorted in ascending numerical order. The sorted index value then forms a set of symbolic sequences , where the reconstruction matrix has columns, i.e., dimensions. There is kinds of permutations from the reconstruction matrix. Then, accumulate the number of the occurrences of each permutation as , and calculate the probability of occurrence of each symbol sequence, as shown in Formula (4):
Finally, the permutation entropy can be calculated based on the probability :
4.3. Eye Fatigue Detection Algorithm
The CART classifier, known as the Classification and Regression Tree, is the advanced Decision Tree that has favorable performance in both classification and regression tasks. In contrast to traditional ID3 that uses information gain as the basis for feature selecting, the CART uses the Gini coefficient to select features. The Gini coefficient represents the impurity of the model, the smaller Gini coefficient means lower impurity, and at the same time, the better features. The Gini coefficient is defined as:
where is the probability of and n represents the number of classifications. The Gini coefficient for sample D with the A attribute is defined as:
The number of sample dataset is and it is divided into two parts: and , according to whether feature A takes the value of a. Consequently, the CART builds up binomial trees instead of multinomial trees. According to the Gini index minimum criterion, the most appropriate feature in one partition is defined as:
where A represents all feature sets and the data set is divided into and based on the value of .
The five features extracted in Section 4.2 from a feature dataset and the data set is divided into 70% training data and 30% test data by the leave-out method, and to maintain the consistency data distribution, a stratified sampling is used. The training data is then further divided into the training set and validation set. After the partition, the data set is classified by the CART algorithm in three steps. First, the tree is generated based on training data according to the Gini index minimization criterion, then pruned based on the validation set to obtain the best subtree. To improve the generalization performance of the tree, the post-pruning method is adopted. During the post-pruning process, the non-leaf nodes of the original tree are examined from the bottom up. Then, the subtree corresponding to these non-leaf nodes is replaced with the new subtree which corresponds to leaf nodes. Finally, the best subtree used to evaluate the model performance based on the test dataset. If the accuracy of the new classification tree is improved compared to the original one, the new classification tree is divided again, otherwise, the original tree is performed, until all non-leaf nodes are traversed.
5. Results
After continuous testing 12 subjects a period, an EOG eye fatigue dataset is generated. Each experiment produces EOG data with 3 min length, which is downsampled 16 times, then 256 points are taken as a sample. The size of the processed dataset is shown in Table 1:

Table 1.
Size of processed dataset.
The classification decision tree structure is determined after pruning the tree using the cross-validation method based on the processed dataset, it is shown in Figure 12:
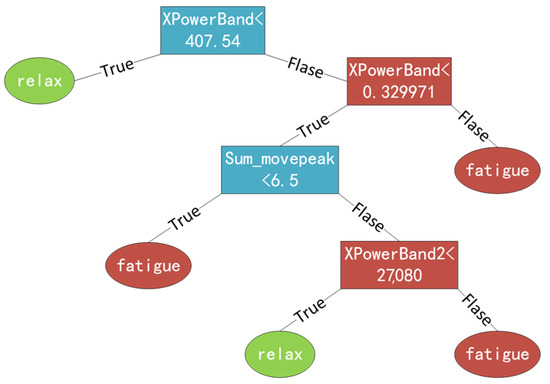
Figure 12.
The structure of the pruned classification decision tree.
Concerning the evaluation, common classification metrics were employed to determine the anomaly detection effectiveness of the model, i.e., Accuracy, Precision, TPR (Recall), FPR (False Positive Rate), and SPC (Specificity).
These metrics are computed analyzing as follows:
where relax is classified as a positive category and fatigue is classified as a negative category.
TP (True Positive): Values that are actually positive and predicted as positive,
FP (False Positive): Values that are actually negative, but predicted as positive,
FN (False Negative): Values that are actually positive, but predicted to negative,
TN (True Negative): Values that are actually negative and predicted to negative.
The Precision is all the points that are declared to be positive, but what percentage of them are actually positive, calculated as Precision = TP/(TP + FP).
TPR (True Positive Rate) is all the points that are actually positive, but what percentage declared positive, calculated as TPR = TP/(TP + FN).
FPR (False Positive Rate) is all the points that are actually positive, but what percentage declared negative, calculated as FPR = FP/(FP + TN).
SPC (Specificity) is all the points that are actually negative, but what percentage declared negative, calculated as SPC = TN/(FP + TN).
Table 2 shows the eye relax and fatigue state analysis results:

Table 2.
State analysis results.
As shown, this system performs better in classifying the fatigue state than classifying the relax state which further verifies the correlation between EOG signal and eye fatigue and demonstrates that the EOG signal can be used as a test for eye fatigue.
6. Conclusions
Based on a comprehensive measurement of 12 subjects, this article discusses the correlation between EOG signal and scenarios on individuals’ eye fatigue. This study develops portable EOG measuring equipment and proposes a method for detecting eye fatigue based on a single-channel EOG signal only. Despite the current model needs to be improved for detection in the eye relax state, this article still objectively demonstrated that EOG signal could be used as a significant basis for detecting eye fatigue which introduces a possibility of a new self-testing model for daily eye health and has a broad application prospect in the field of eye health care.
7. Future Work
There are still some limitations of this study. In further work, we will make the sampling in this study more diversity. Subjects would contain of people with different ages and different eye health conditions. Moreover, the current accuracy performance has the possibility to improve. In the further work of this study, we will increase the number of test samples and try to develop the deep learning model based on the new dataset to improve the accuracy. If the new dataset has a large enough size, we are fully confident that developing some deep learning models could improve the accuracy performance.
Author Contributions
Conceptualization, Y.W.; methodology, Y.W.; software, Y.W.; formal analysis, Y.W.; investigation, Y.W.; data curation, Y.W.; writing—original draft preparation, Y.W.; writing—review and editing, Y.W.; visualization, Y.W.; validation, L.Z.; resources, Z.F.; supervision, L.Z.; project administration, L.Z.; funding acquisition, Z.F.; All authors have read and agreed to the published version of the manuscript.
Funding
This research received no external funding.
Institutional Review Board Statement
Not applicable.
Informed Consent Statement
Informed consent was obtained from all subjects involved in the study.
Data Availability Statement
The data presented in this study are available on request from the corresponding author.
Conflicts of Interest
The authors declare no conflict of interest.
References
- Abdulin, E.; Komogortsev, O. User eye fatigue detection via eye movement behavior. In Proceedings of the 33rd Annual ACM Conference Extended Abstracts on Human Factors in Computing Systems, Seoul, Korea, 18–23 April 2015; pp. 1265–1270. [Google Scholar] [CrossRef]
- Bali, J.; Neeraj, N.; Bali, R. Computer vision syndrome: A review. J. Clin. Ophthalmol. Res. 2014, 2, 61. [Google Scholar] [CrossRef]
- Liu, Y.; Guo, X.; Fan, Y.; Meng, X.; Wang, J. Subjective assessment on visual fatigue versus stereoscopic disparities. J. Soc. Inf. Disp. 2021, 29, 497–504. [Google Scholar] [CrossRef]
- McKinley, R.A.; McIntire, L.K.; Schmidt, R.; Repperger, D.W.; Caldwell, J.A. Evaluation of eye metrics as a detector of fatigue. Hum. Factors 2011, 53, 403–414. [Google Scholar] [CrossRef] [PubMed]
- Wang, D.; Wang, X.; Song, Y.; Xing, Q.; Zheng, N. Visual Fatigue Assessment Based on Multi-task Learning. J. Imaging Sci. Technol. 2019, 63, 60414. [Google Scholar] [CrossRef]
- Jia, L. Study of the Display Image Quality and Visual Comfort Assessment Based on Multimodal Technology. Ph.D. Dissertation, Southeast University, Nanjing, China, 2019. [Google Scholar]
- Yue, K.; Wang, D.; Chiu, S.C.; Liu, Y. Investigate the 3D Visual Fatigue Using Modified Depth-Related Visual Evoked Potential Paradigm. IEEE Trans. Neural Syst. Rehabil. Eng. 2020, 28, 2794–2804. [Google Scholar] [CrossRef]
- Savas, B.K.; Becerikli, Y. Real Time Driver Fatigue Detection System Based on Multi-Task ConNN. IEEE Access 2020, 8, 12491–12498. [Google Scholar] [CrossRef]
- Zhan, Q.; Zhou, W.; Gao, J.; Li, W.; Zhang, X. A Review of Driver Fatigue Detection and Warning Based on Multi-Information Fusion. SAE Tech. Pap. Ser. 2020, 1, 6. [Google Scholar] [CrossRef]
- Bronzino, J.D. Biomedical Engineering Handbook 2; Springer Science & Business Media: Berlin/Heidelberg, Germany, 2000; Volume 97, pp. 1–4. [Google Scholar]
- Chen, Y.; Newman, W. A human-robot interface based on electrooculography. In Proceedings of the IEEE International Conference on Robotics and Automation, New Orleans, LA, USA, 26 April–1 May 2004; Volume 1, pp. 243–248. [Google Scholar] [CrossRef]
- Úbeda, A.; Iáñez, E.; Azorin, J.M. Wireless and portable EOG-based interface for assisting disabled people. IEEE/ASME Trans. Mechatron. 2011, 16, 870–873. [Google Scholar] [CrossRef]
- Testing and Evaluation Method of Vision Fatigue Part 2: Scale Evaluation Method. Available online: http://www.cvianet.org.cn/download/?page=2 (accessed on 19 February 2022).
- Nann, M.; Peekhaus, N.; Angerhöfer, C.; Soekadar, S.R. Feasibility and Safety of Bilateral Hybrid EEG/EOG Brain/Neural–Machine Interaction. Front. Hum. Neurosci. 2020, 14, 521. [Google Scholar] [CrossRef] [PubMed]
- Williams, G.; Lee, Y.S.; Ekanayake, S.; Pathirana, P.N.; Andriske, L. Facilitating communication and computer use with EEG devices for non-vocal quadriplegics. In Proceedings of the 7th International Conference on Information and Automation for Sustainability, Colombo, Sri Lanka, 22–24 December 2014; pp. 1–5. [Google Scholar] [CrossRef]
- Jiao, Y.; Deng, Y.; Luo, Y.; Lu, B.-L. Driver sleepiness detection from EEG and EOG signals using GAN and LSTM networks. Neurocomputing 2020, 408, 100–111. [Google Scholar] [CrossRef]
- Aserinsky, E.; Kleitman, N. Two types of ocular motility occurring in sleep. J. Appl. Physiol. 1955, 8, 1–10. [Google Scholar] [CrossRef] [PubMed]
- Cona, F.; Pizza, F.; Provini, F.; Magosso, E. An improved algorithm for the automatic detection and characterization of slow eye movements. Med. Eng. Phys. 2014, 36, 954–961. [Google Scholar] [CrossRef] [PubMed]
Publisher’s Note: MDPI stays neutral with regard to jurisdictional claims in published maps and institutional affiliations. |
© 2022 by the authors. Licensee MDPI, Basel, Switzerland. This article is an open access article distributed under the terms and conditions of the Creative Commons Attribution (CC BY) license (https://creativecommons.org/licenses/by/4.0/).