
Failure Behavior of Damaged Reinforced Concrete Pipe Rehabilitated with Fiber-Reinforced Mortar Lining

 ,
, 

Abstract
1. Introduction
2. Failure Process of Mortar-Lined RCPs
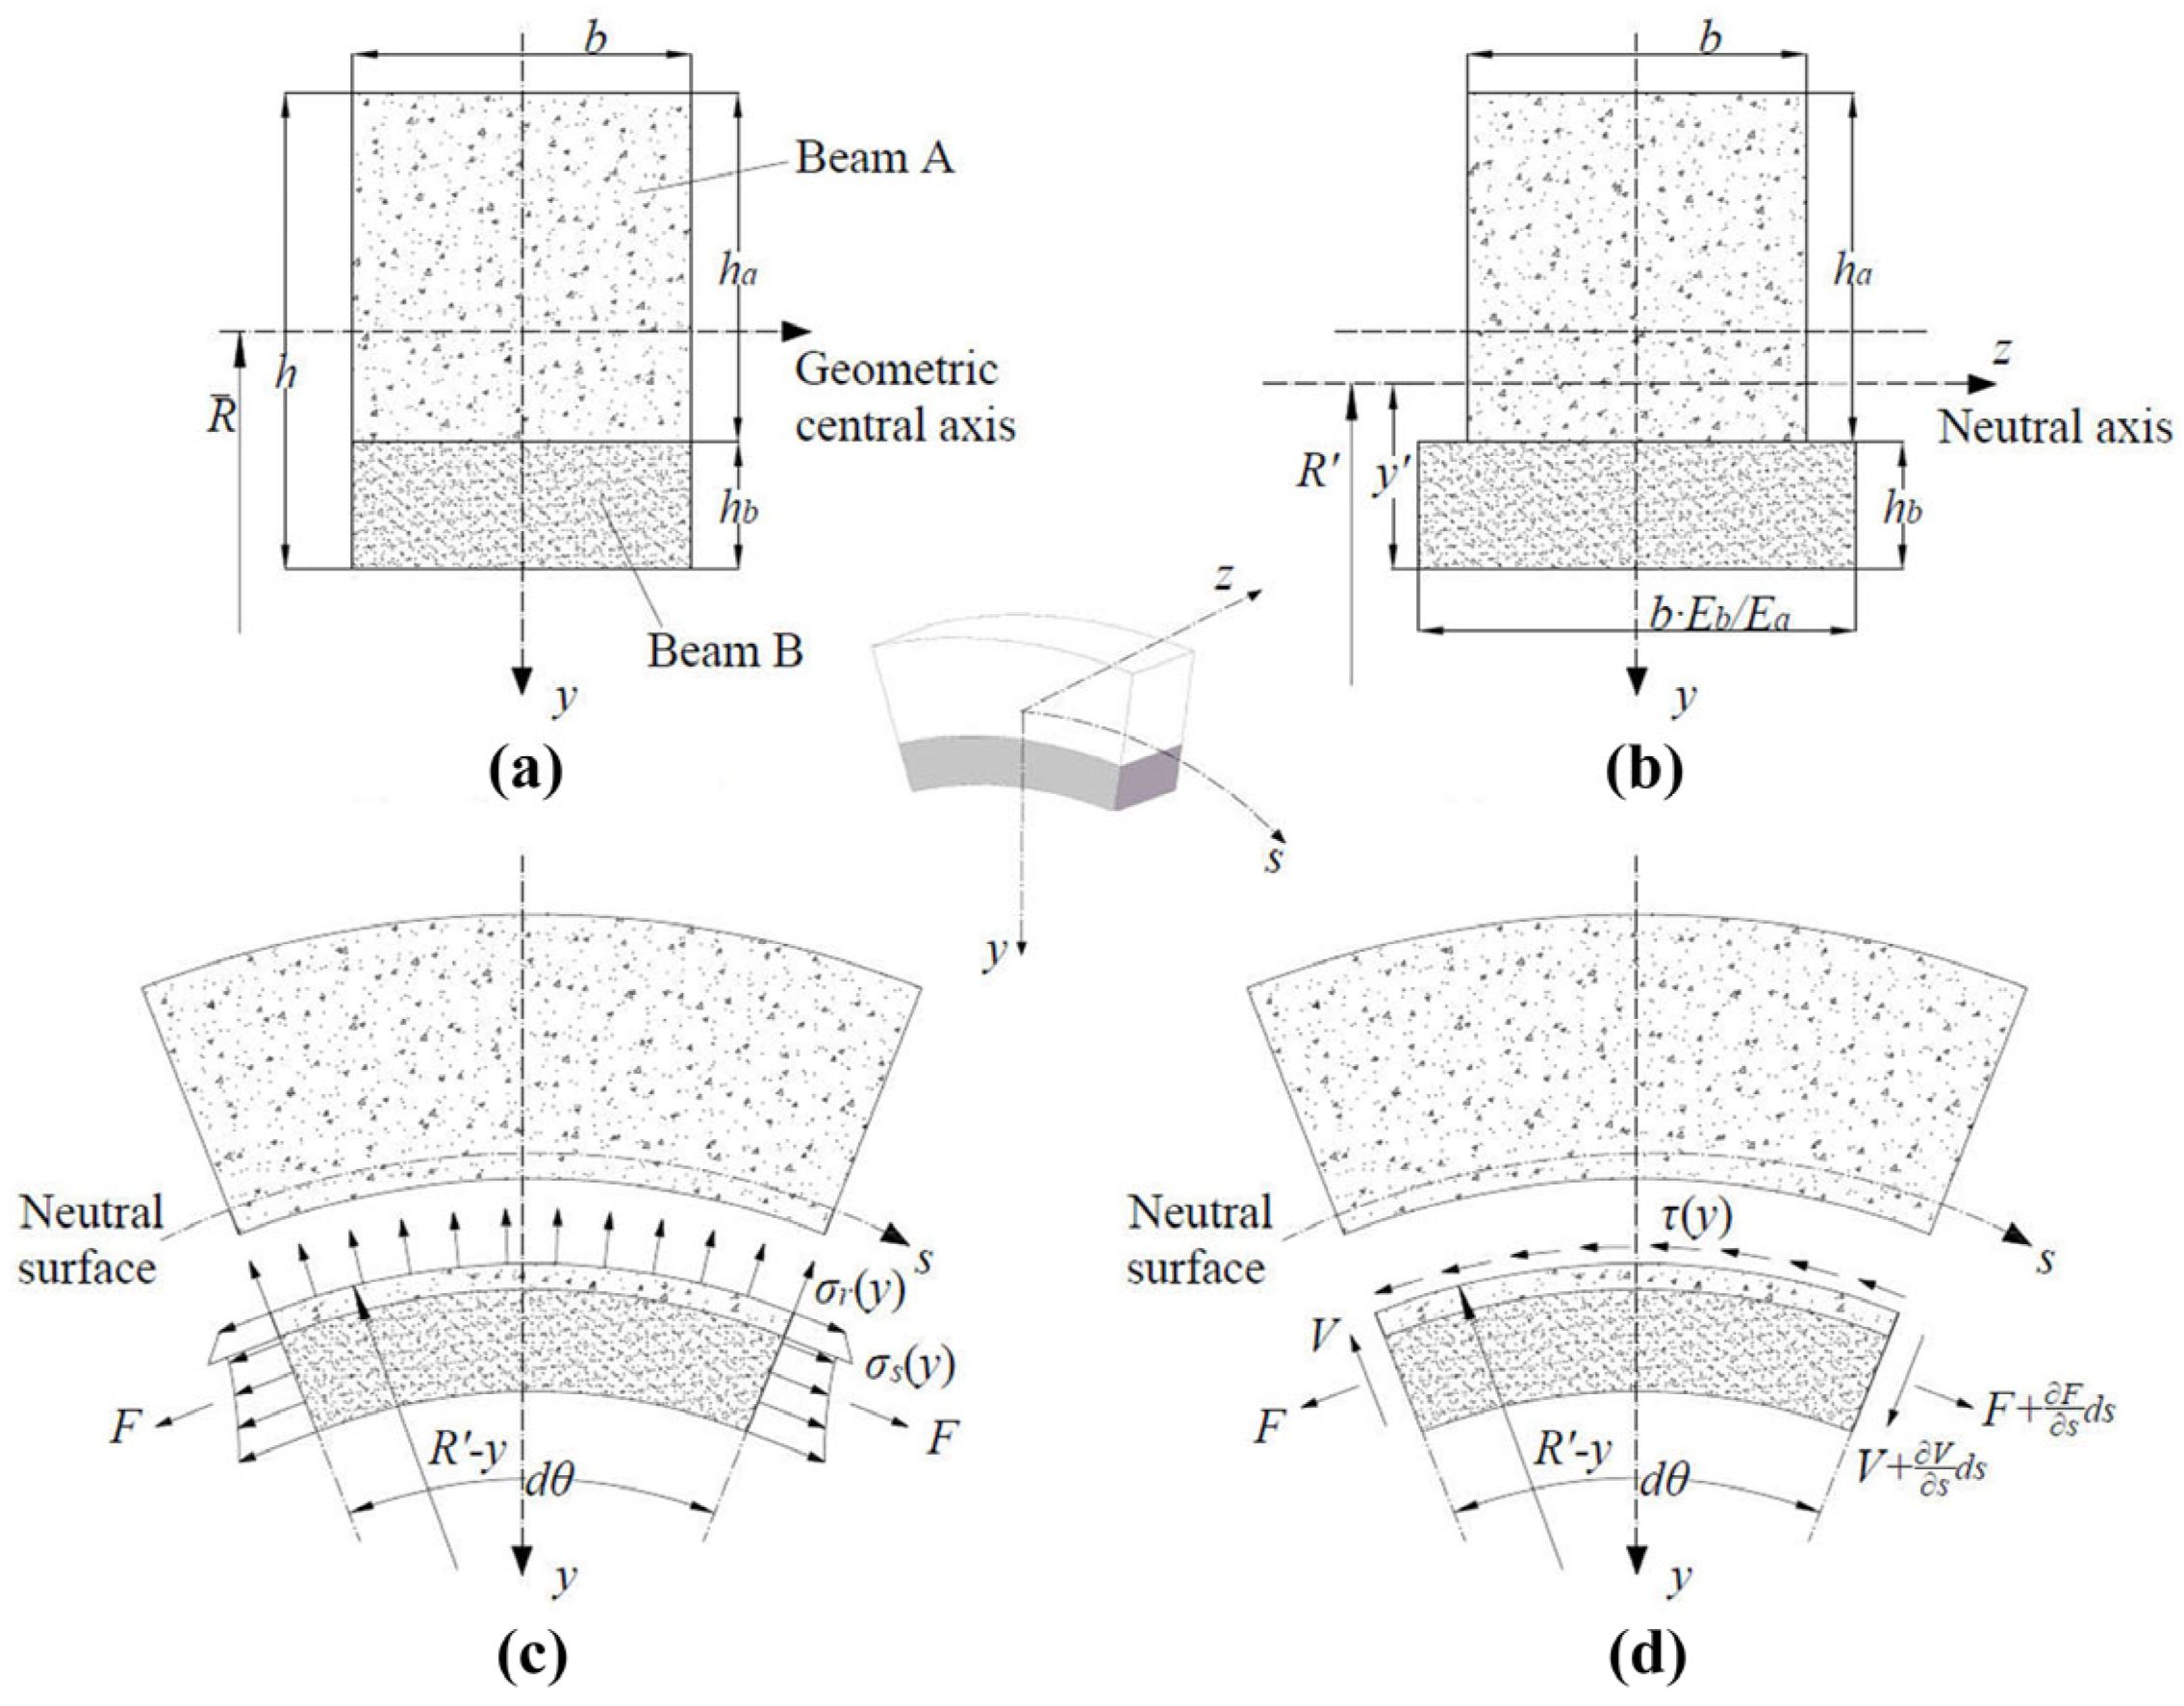
2.1. Analytical Model
2.2. Interface Failure Criteria in SCB Model
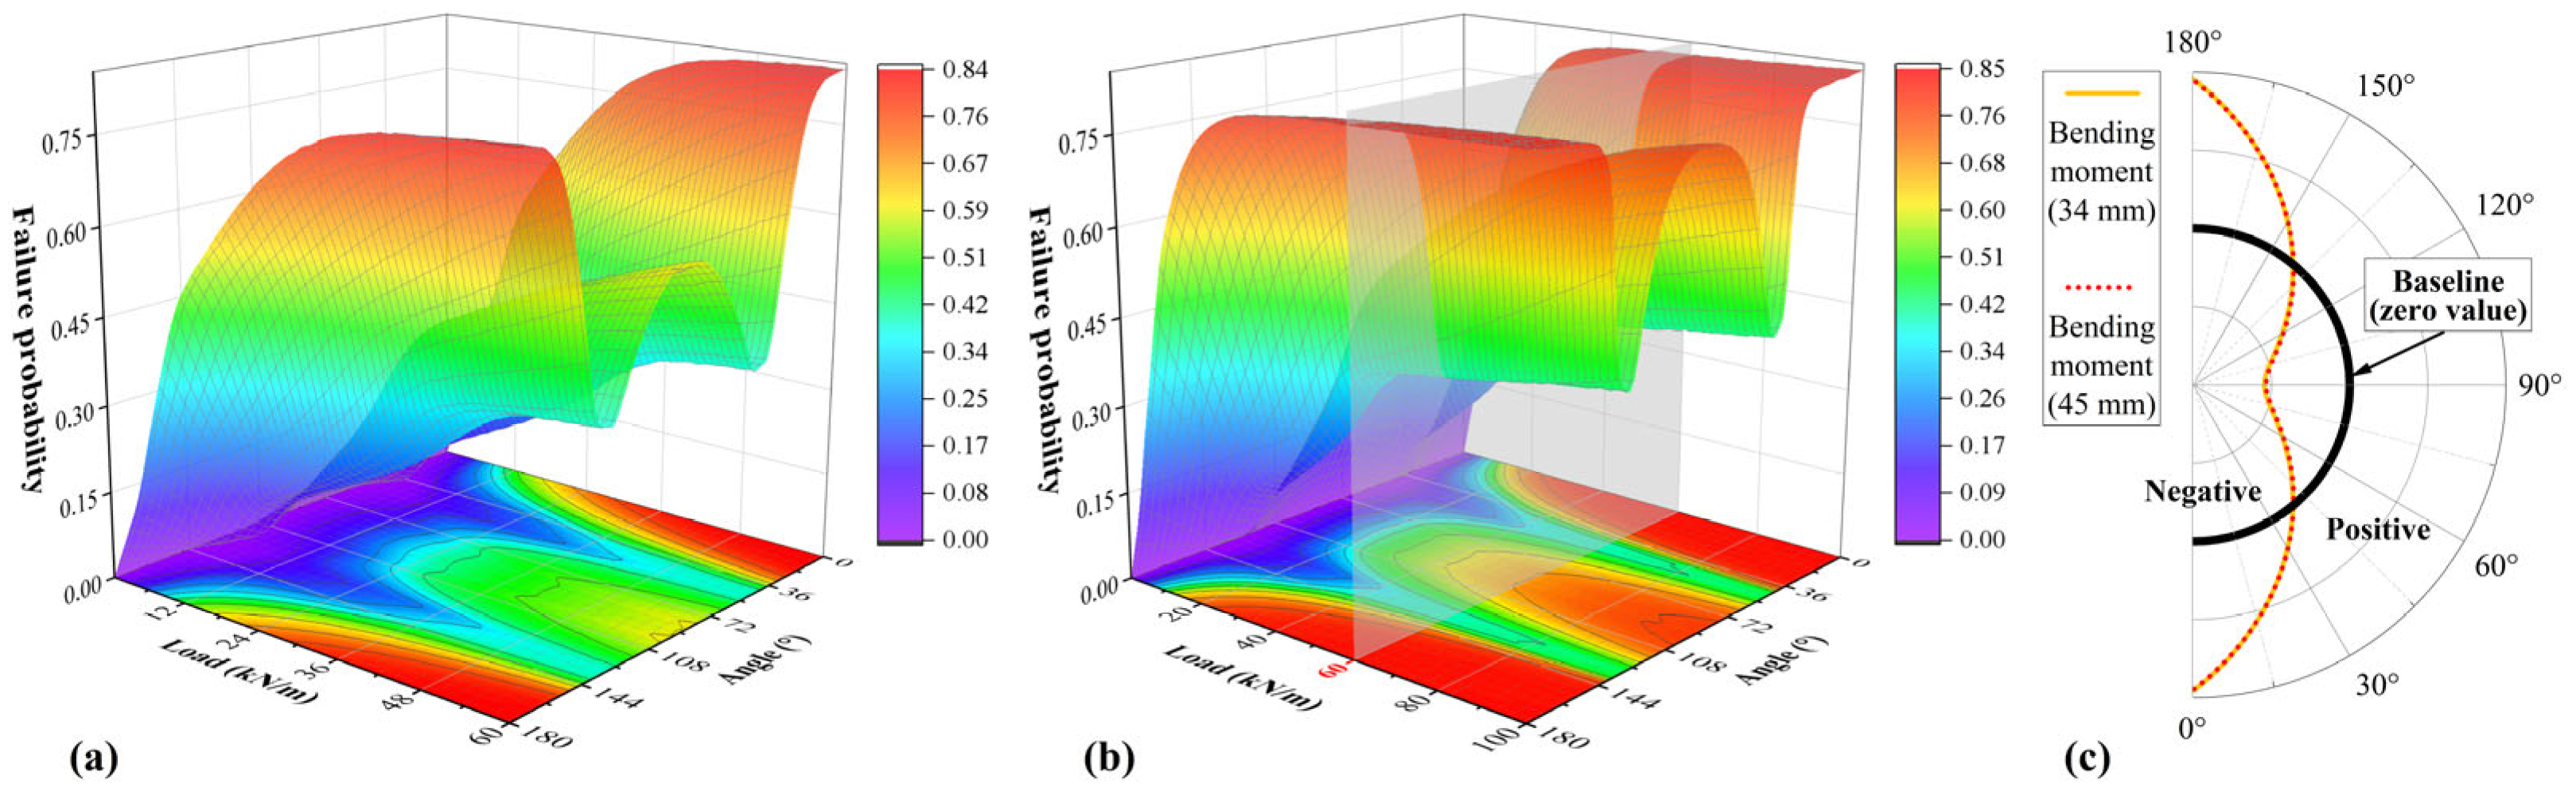
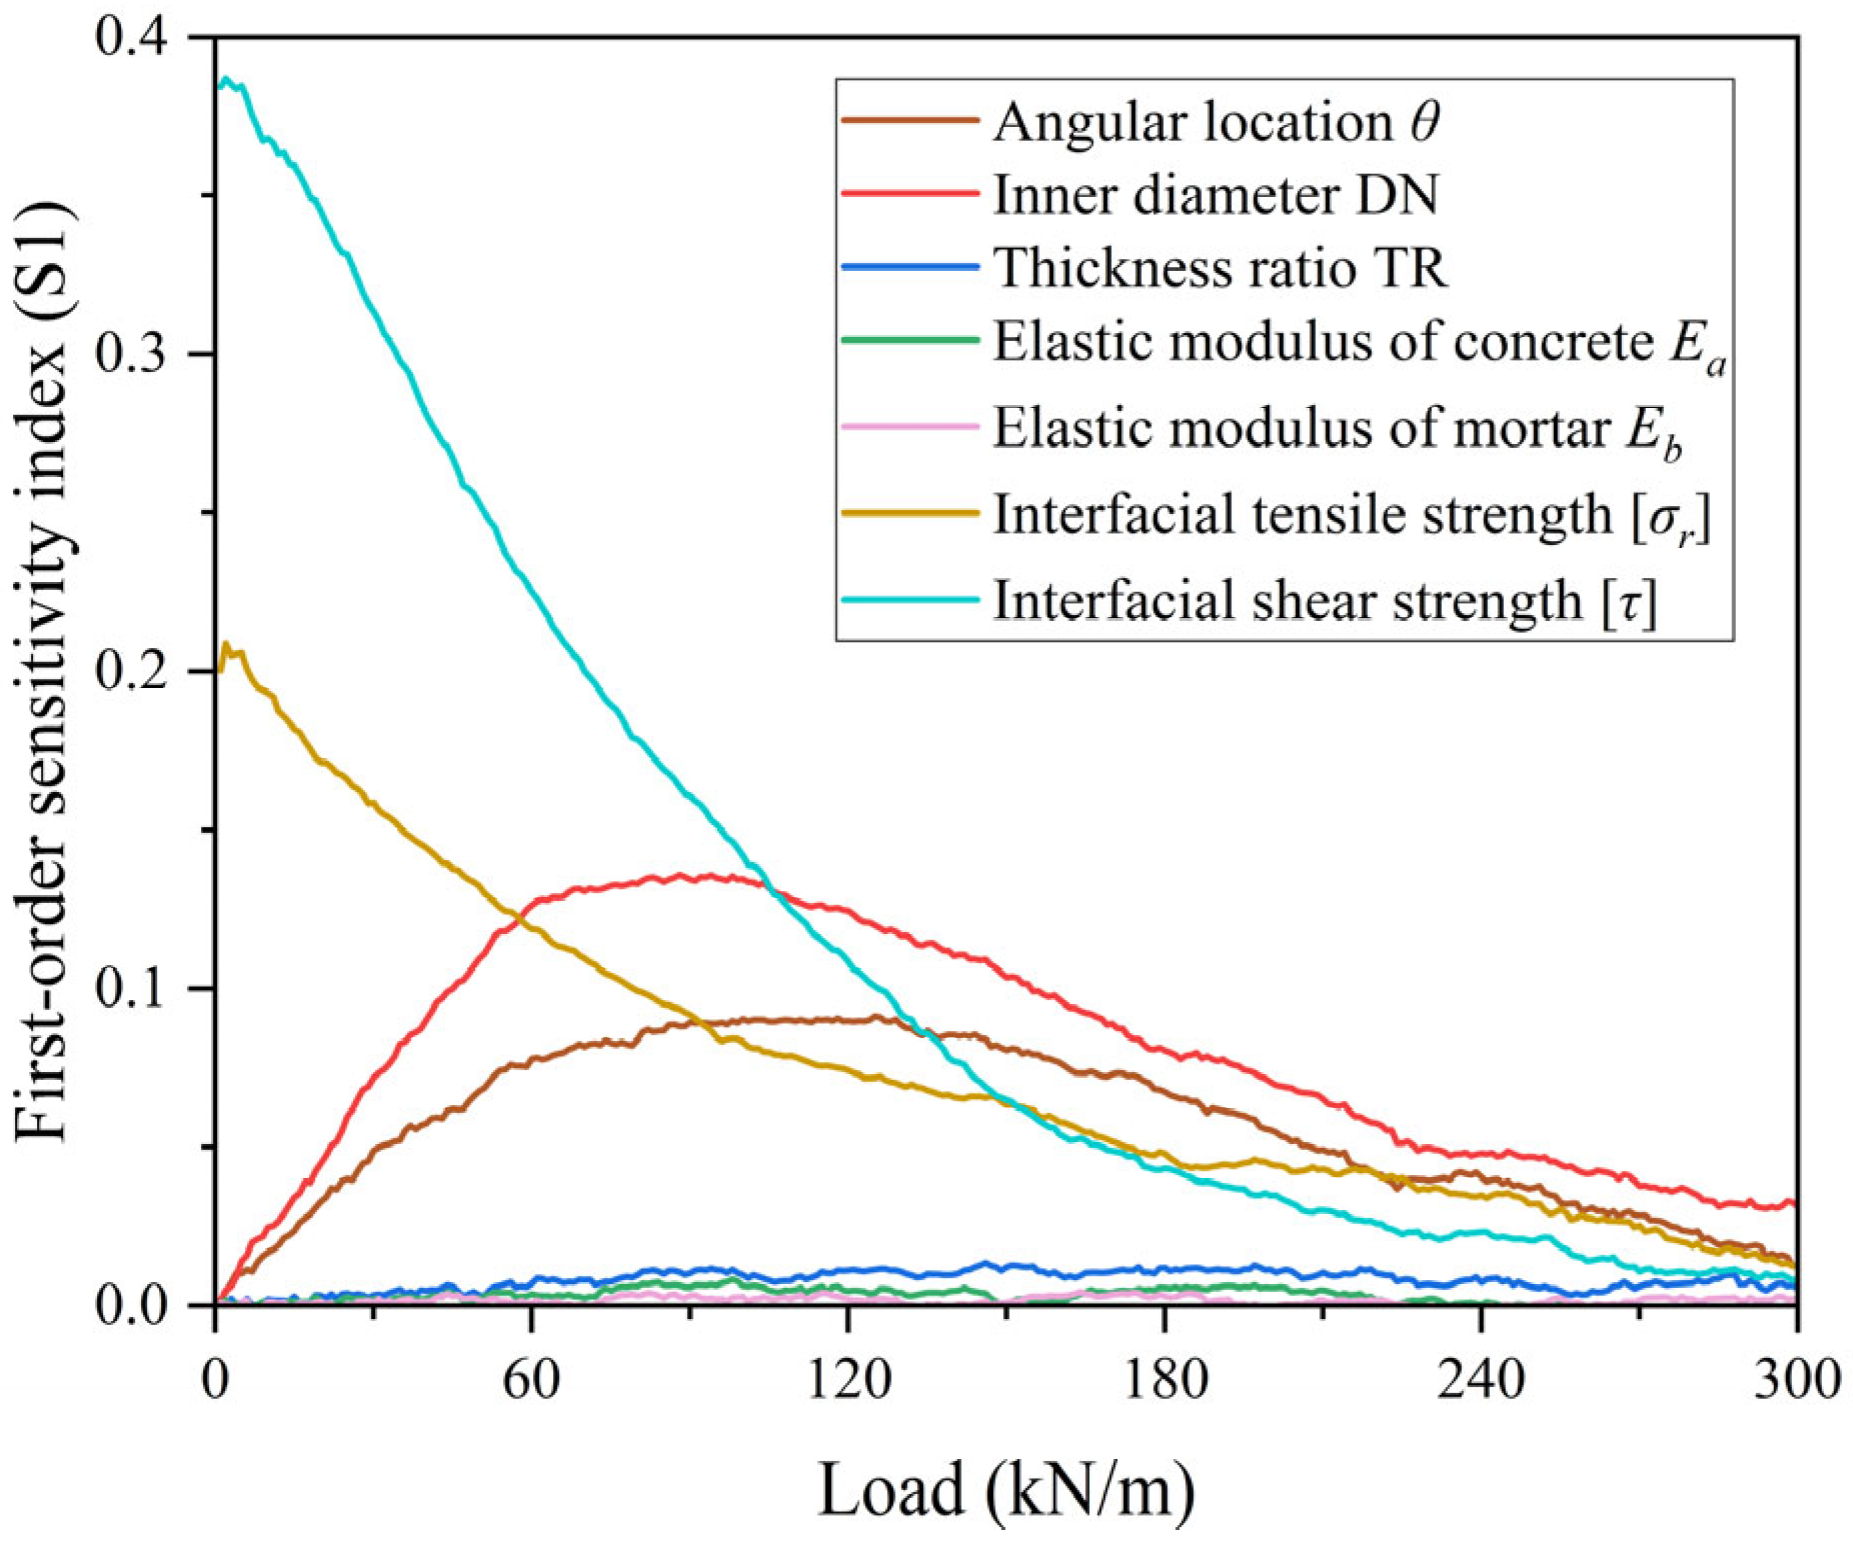
2.3. Uncertainty Analysis of Interface Failure
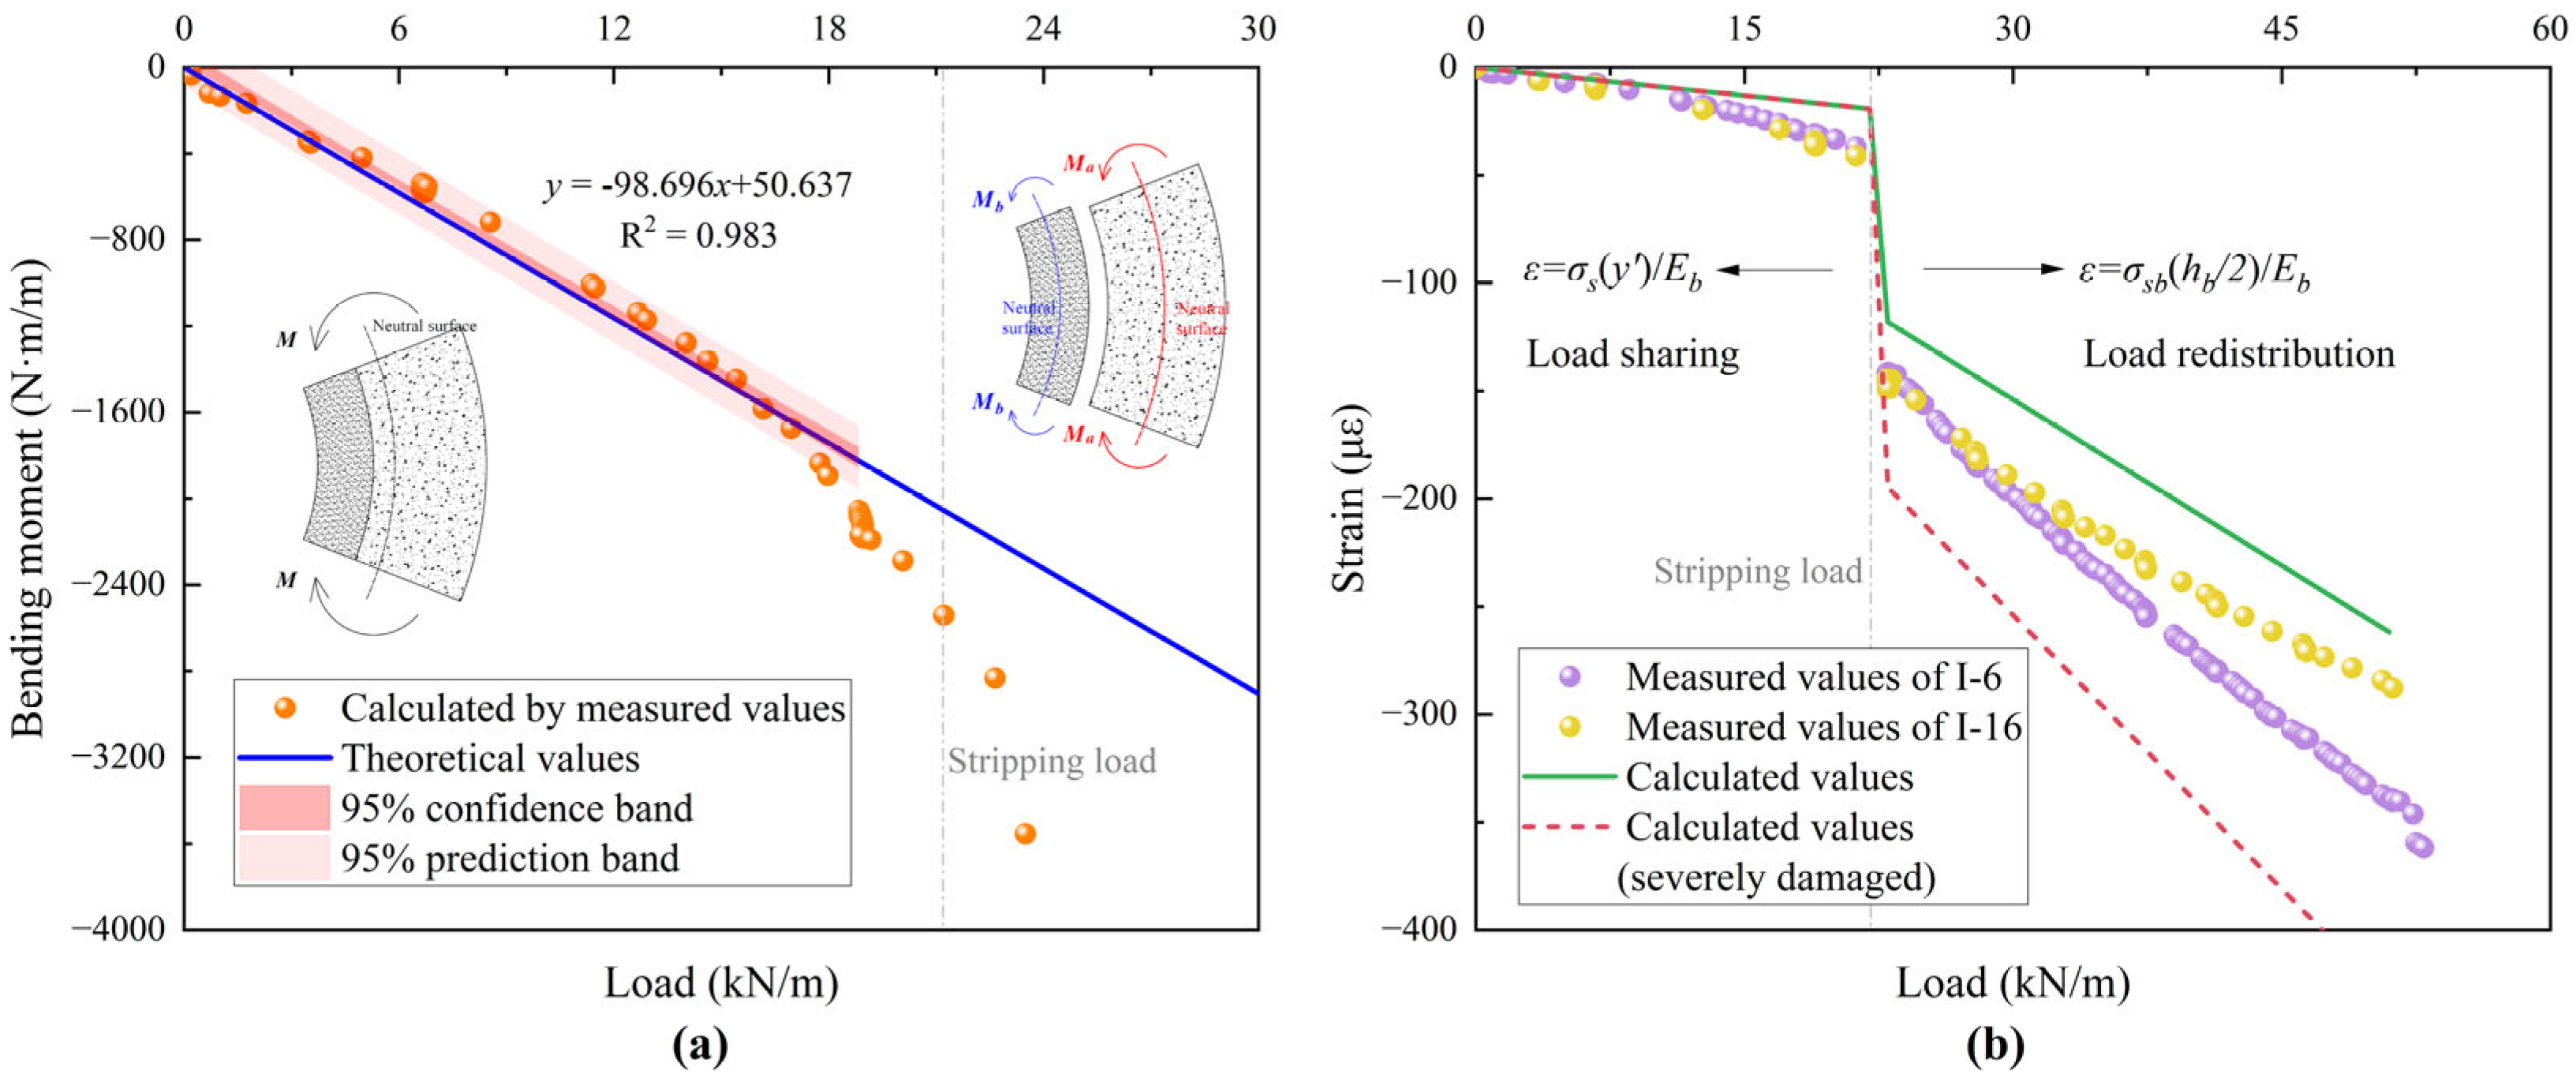
2.4. Load Redistribution in CCB Models
3. Experimental Design
3.1. Pipe Specimens and Materials
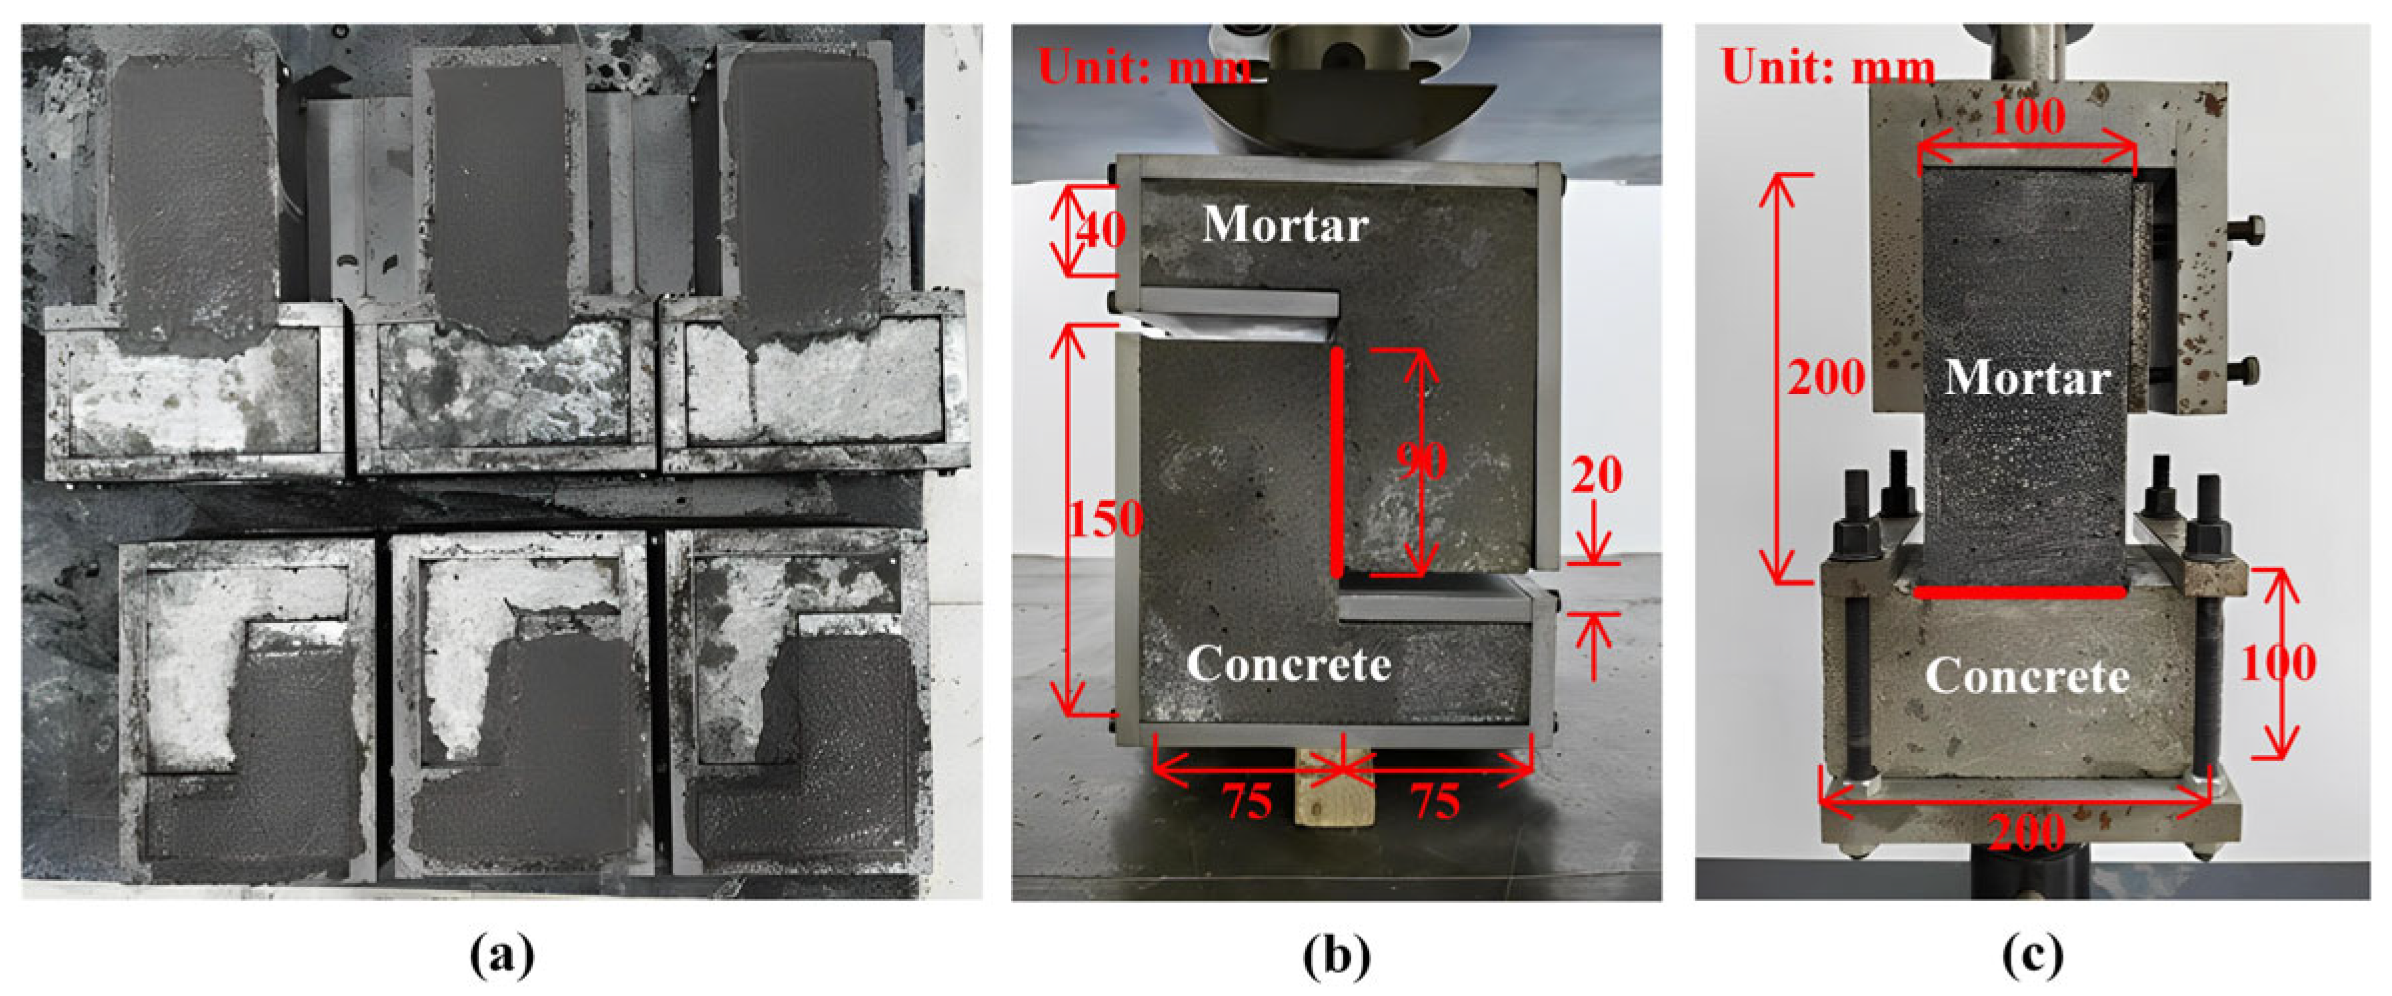
3.2. Material and Interface Tests
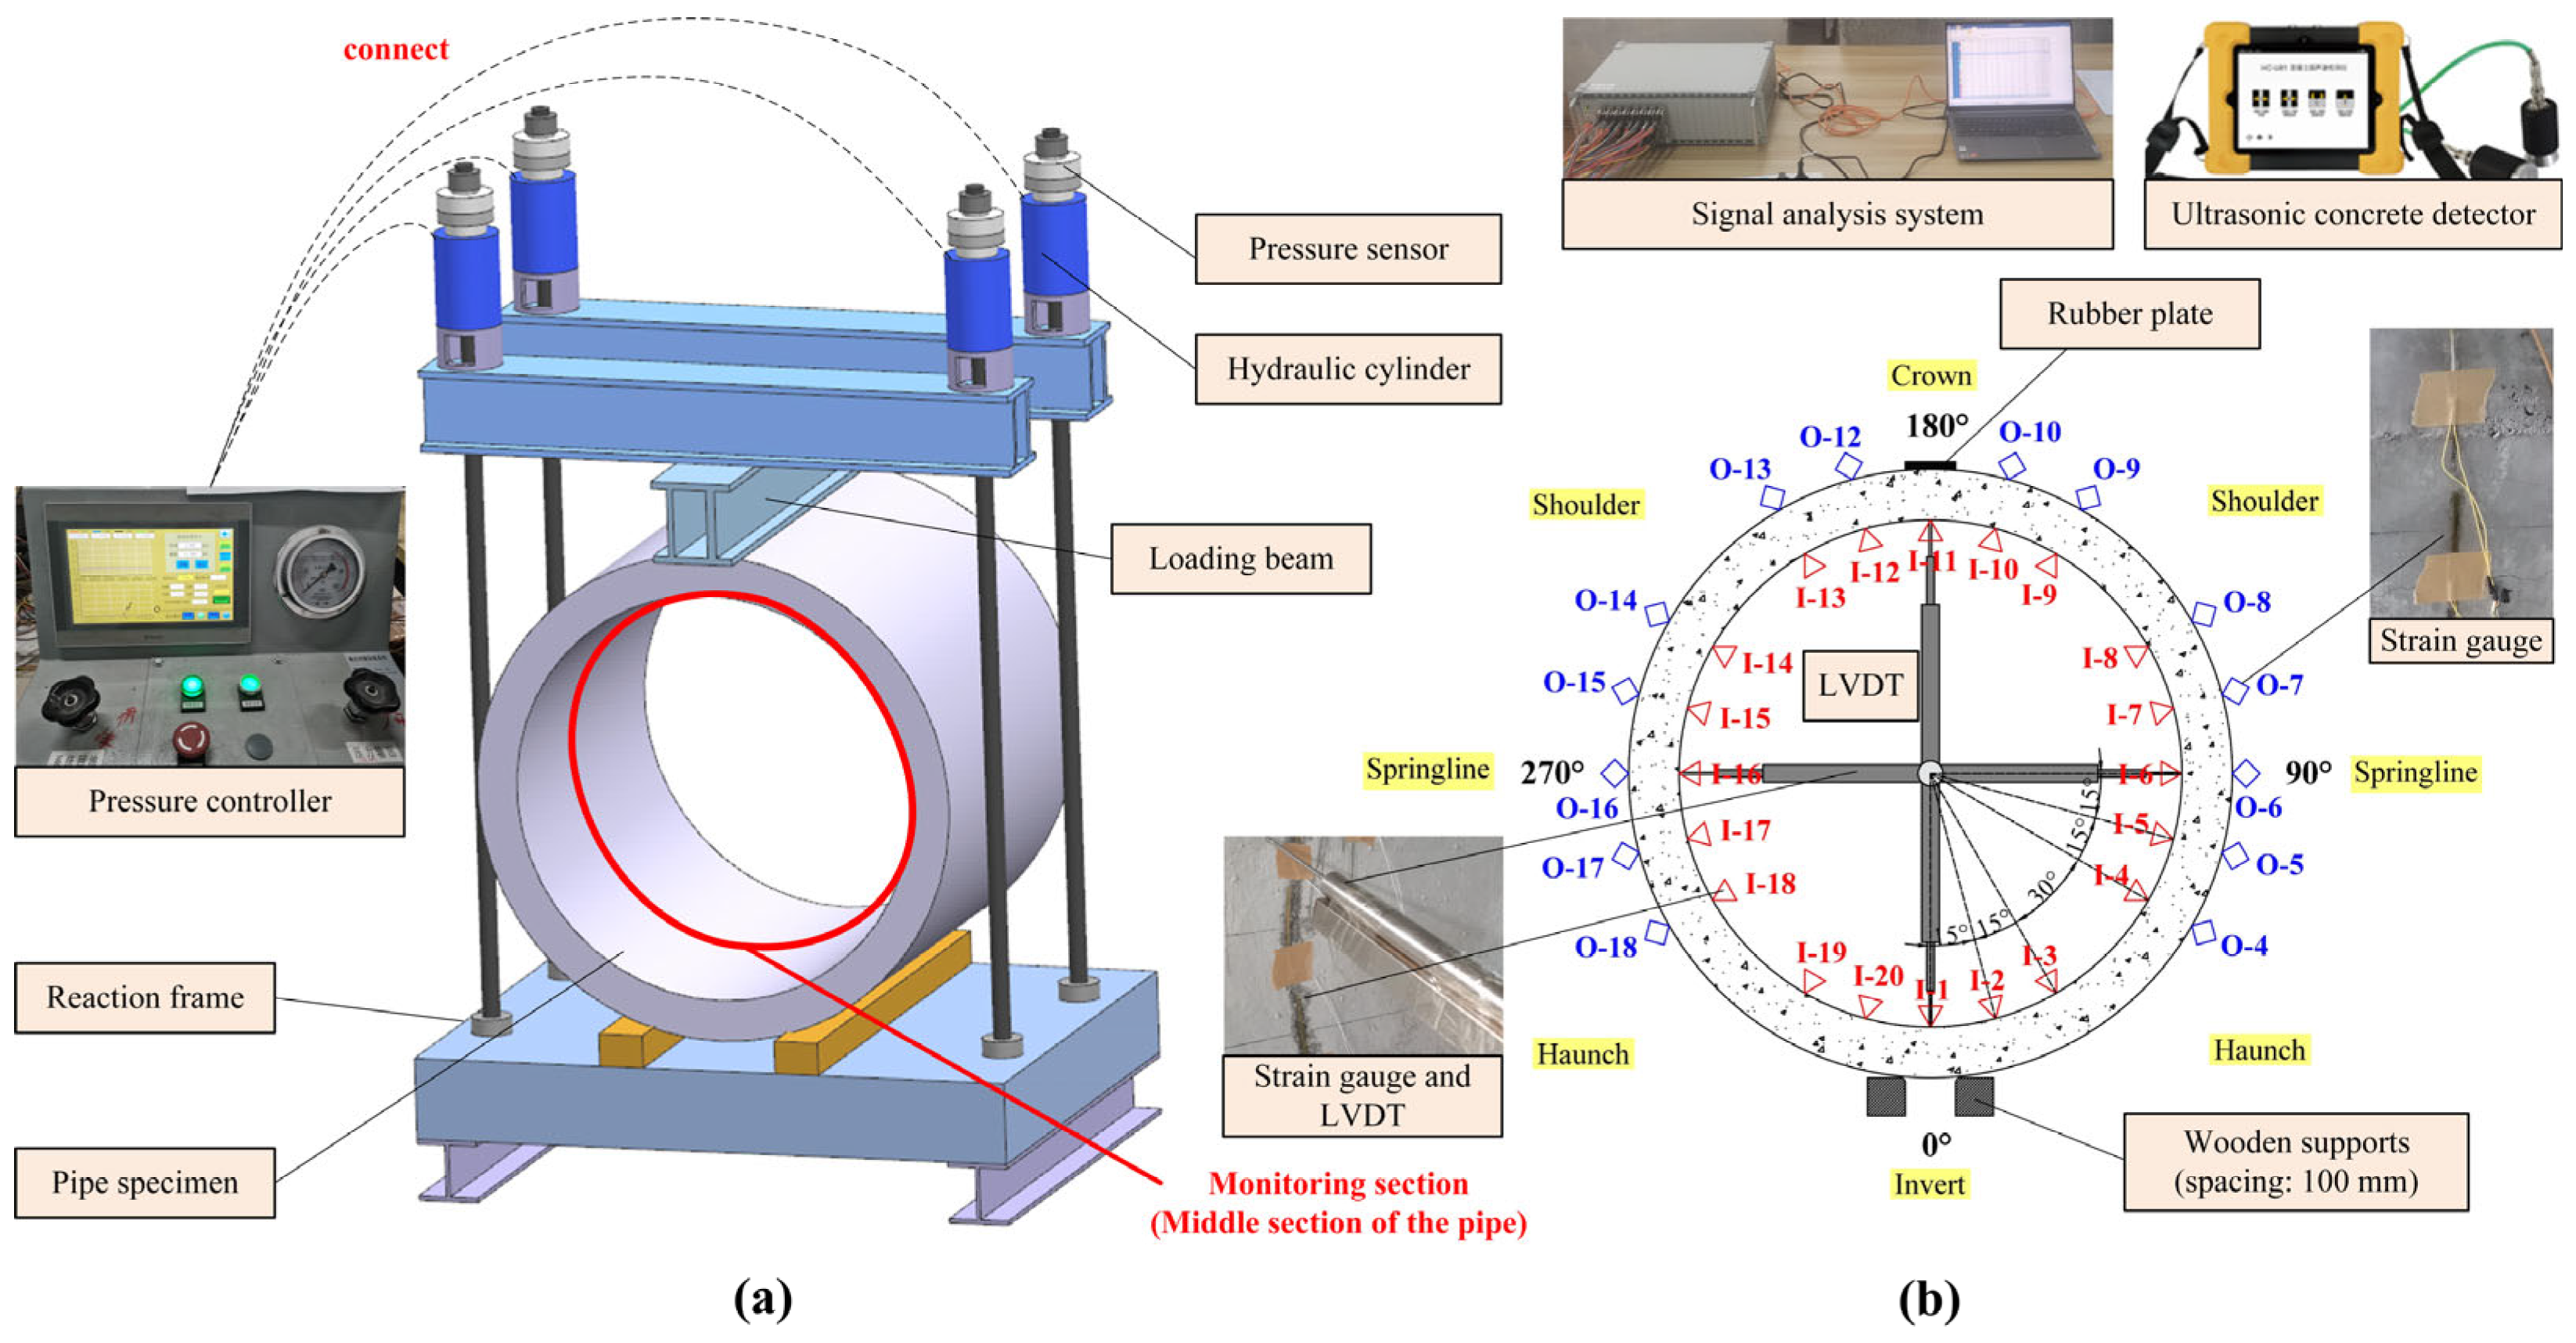
3.3. Equipment and Procedure of TEB Tests
- Before a test began, the internal and external surfaces of the monitoring section were cleaned, and the monitoring systems were set up.
- The hydraulic loading system was activated, and load was applied synchronously using four cylinders. The force discrepancy between each cylinder was consistently controlled to remain within a minor margin.
- Graded loading was applied, with each increment ranging from 5 to 6 kN over 1 to 3 min. During the loading process, cracks were monitored and measured. The system continued loading until the ultimate load was reached.
- After unloading the damaged pipe, its shape was restored. It was then rehabilitated with a centrifugally sprayed mortar lining and cured for 28 d.
- The actual thickness of the mortar lining was measured at the same locations as the strain gauges. Finally, the steps described above were repeated to test the repaired pipe. The testing procedure is shown in Figure 5.
3.4. Internal Forces of Pipes
4. Results and Discussion
4.1. Material and Interface Properties
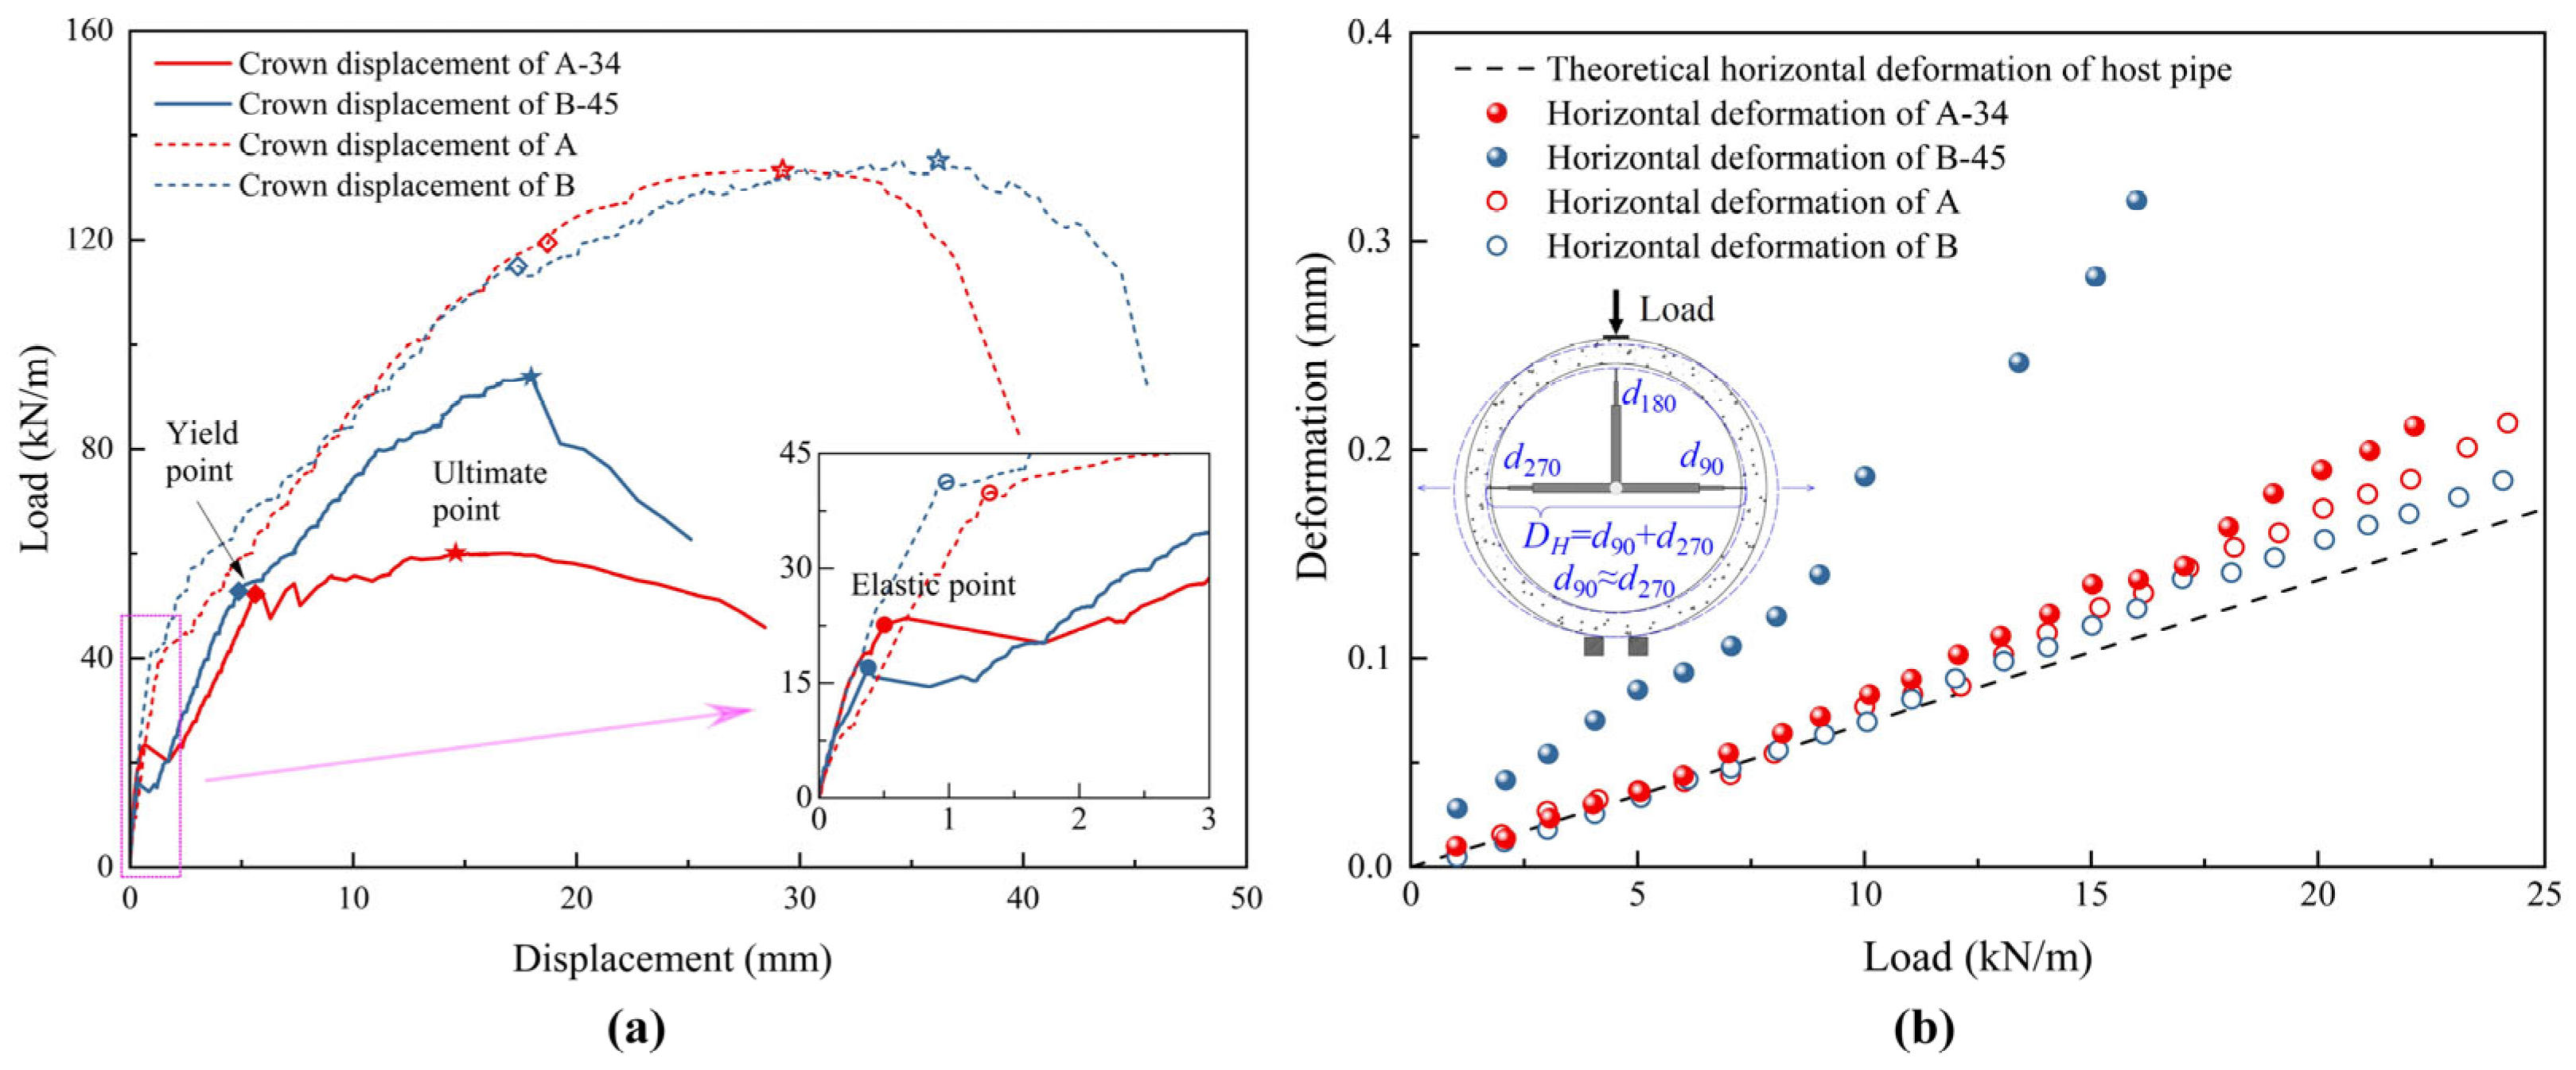
4.2. Displacement and Deformation Responses
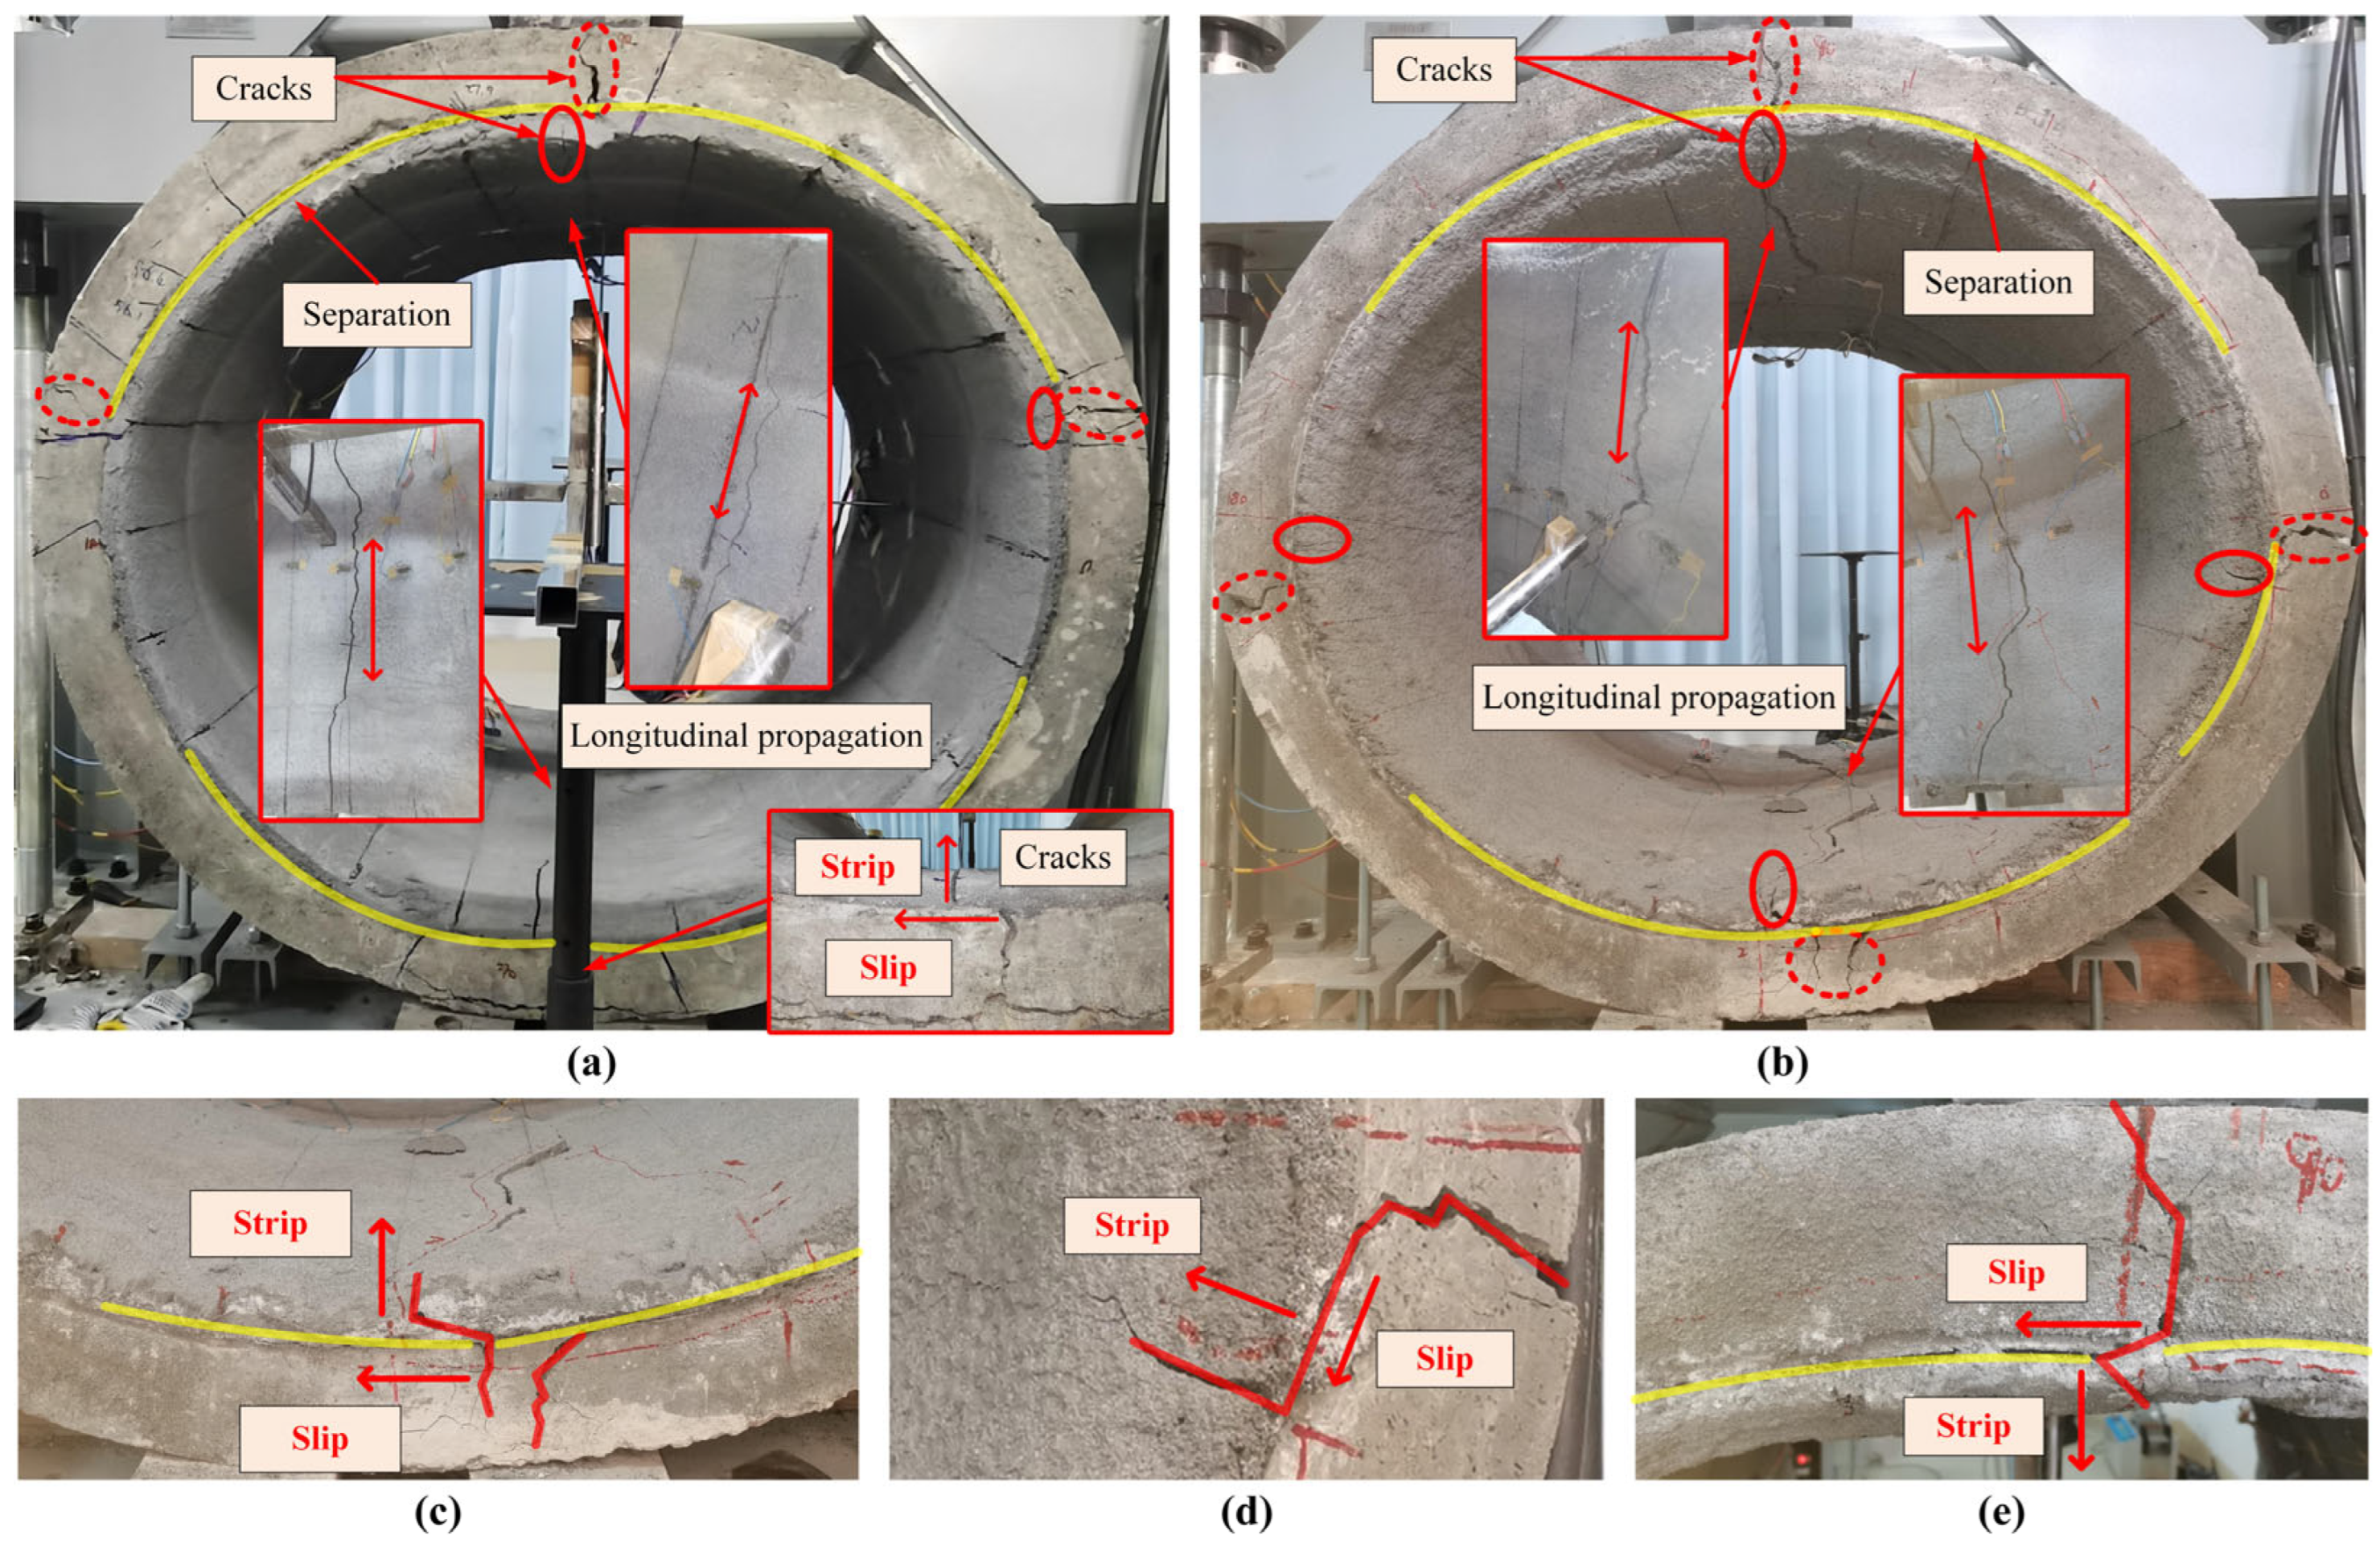
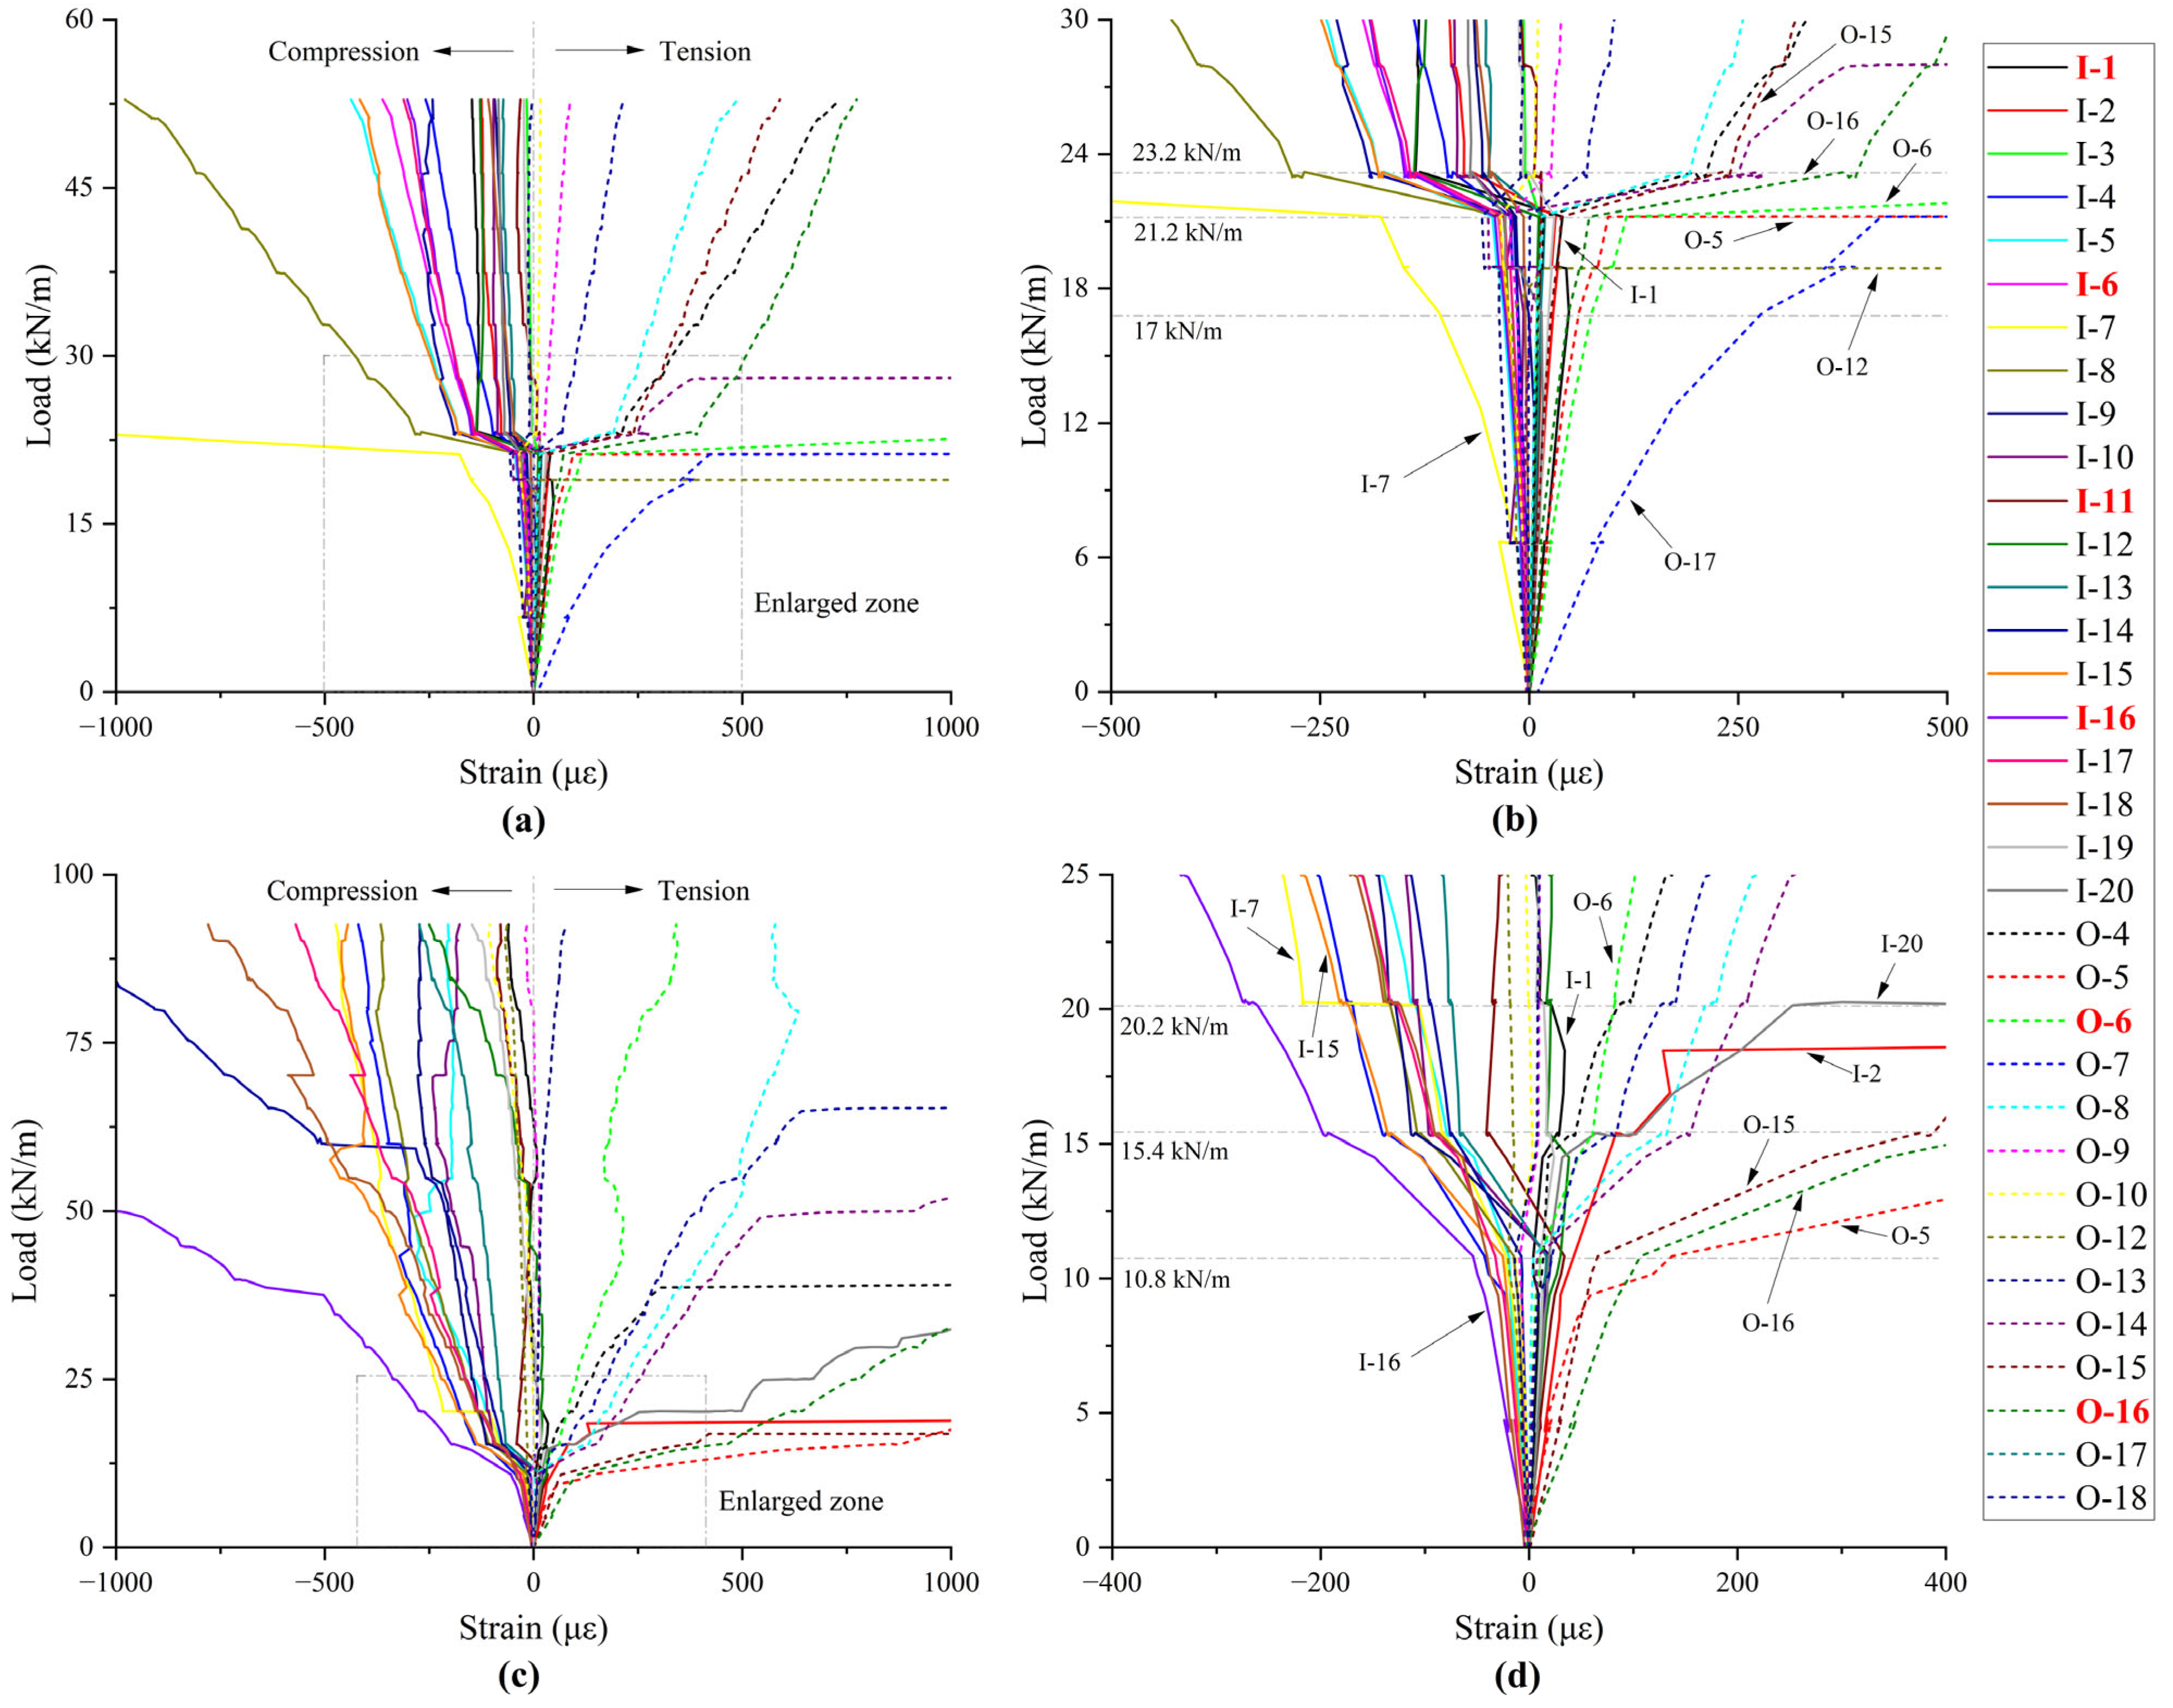
4.3. Damage Pattern and Strain Variation
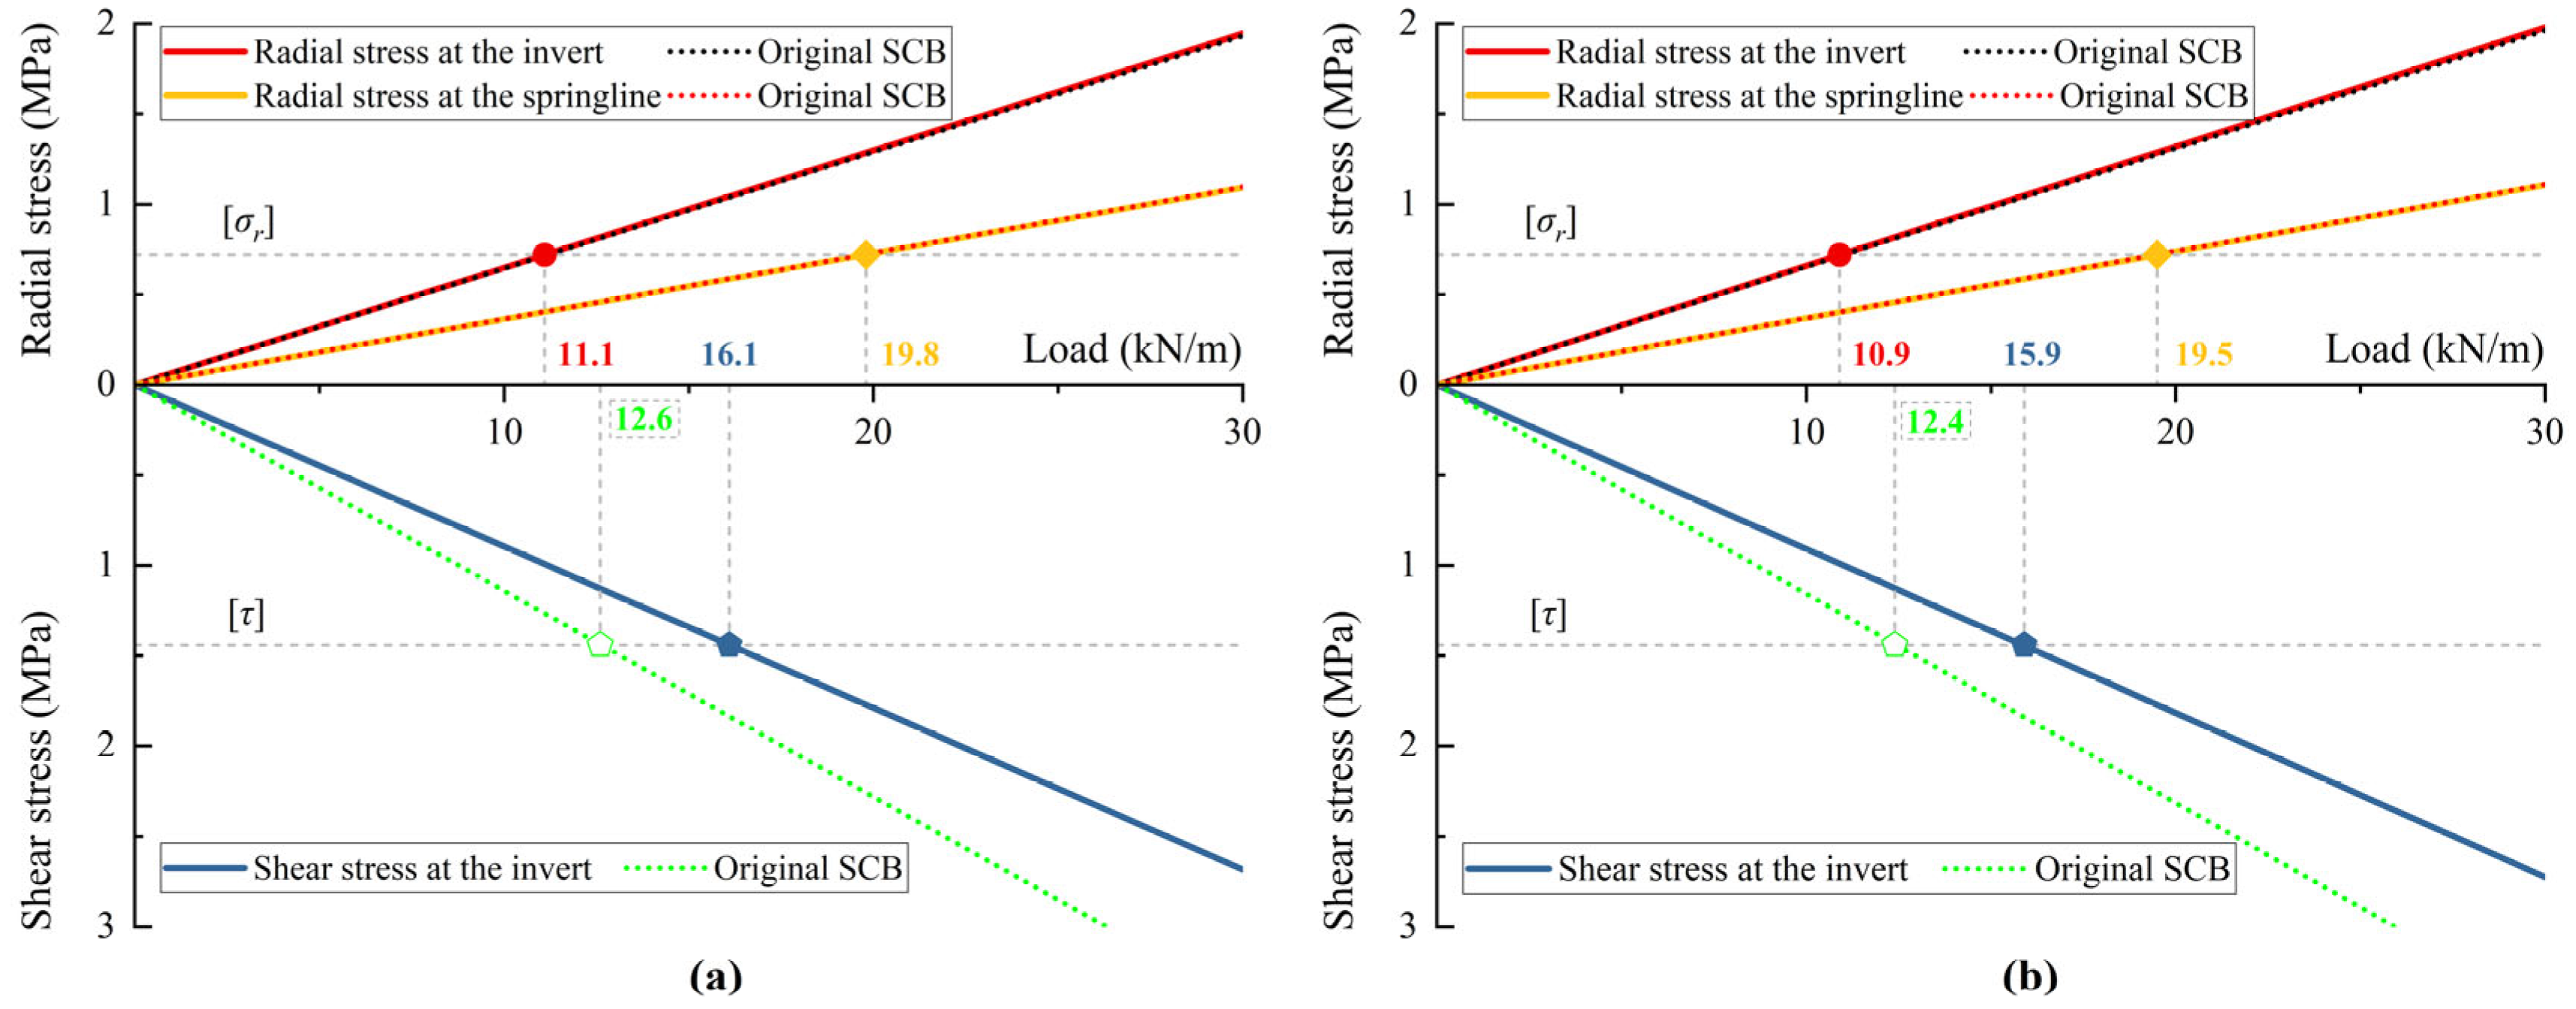
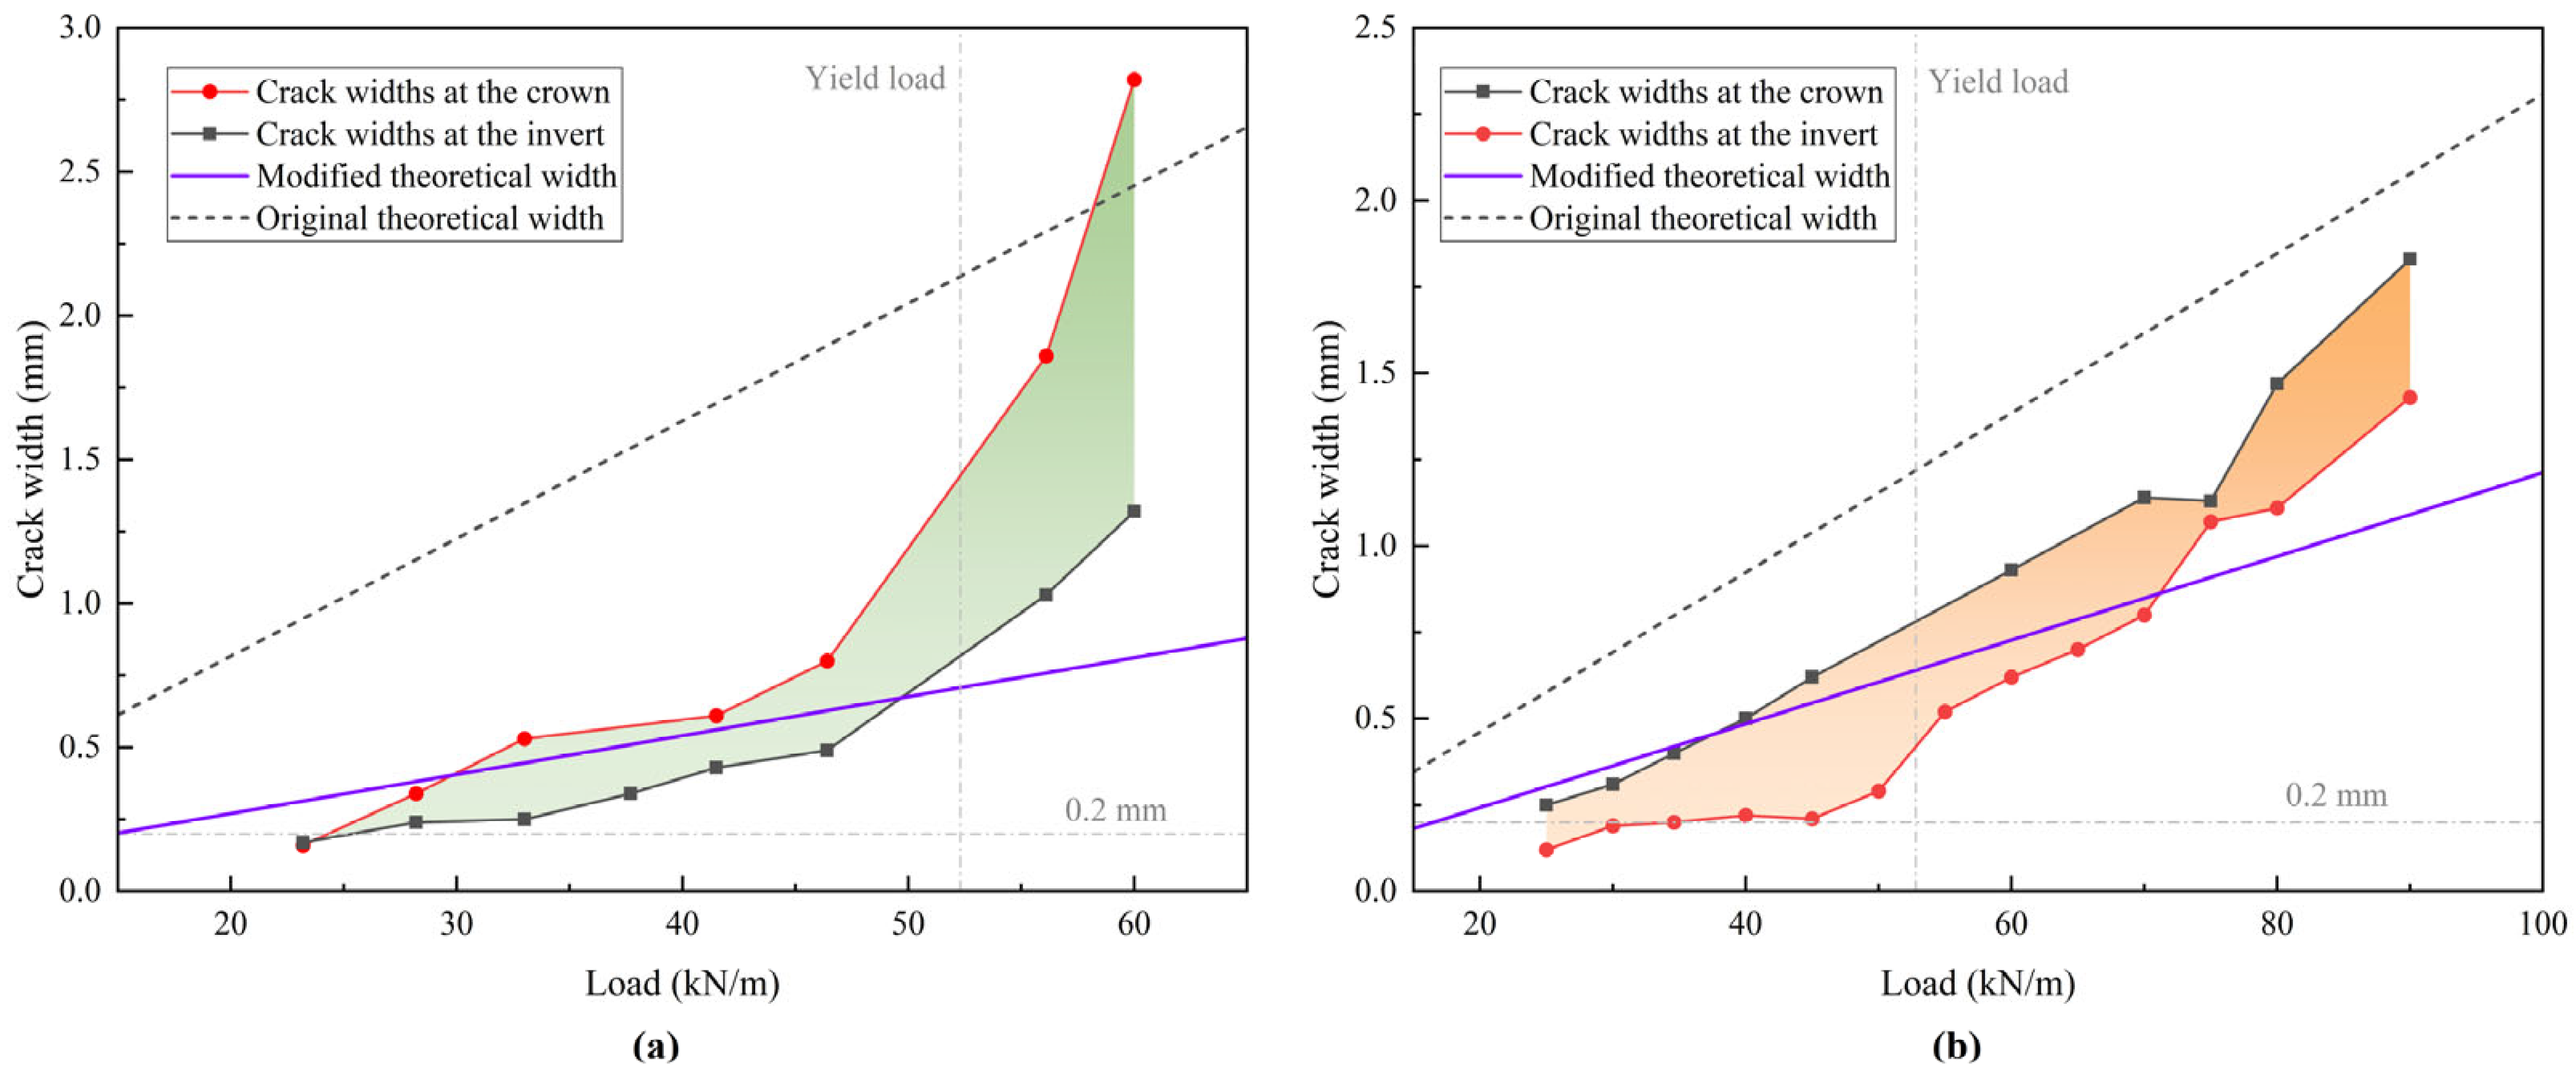
4.4. Interface Failure Behavior
4.5. Result of Interface Failure
4.6. Discussion on the Entire Failure Process
5. Conclusions
Author Contributions
Funding
Institutional Review Board Statement
Informed Consent Statement
Data Availability Statement
Conflicts of Interest
References
- National Bureau of Statistics of China. China Statistical Yearbook 2023; China Statistics Press: Beijing, China, 2023. [Google Scholar]
- Haurum, J.B.; Moeslund, T.B. A Survey on Image-Based Automation of CCTV and SSET Sewer Inspections. Autom. Constr. 2020, 111, 103061. [Google Scholar] [CrossRef]
- Li, B.; Wang, X.; Yang, Y.; Fang, H.; Du, X.; Wang, N.; Zhai, K.; Di, D.; Shi, M. Long-Term Performance of Concrete Pipes under Fatigue Traffic Loads. Eng. Fail. Anal. 2024, 165, 108778. [Google Scholar] [CrossRef]
- Parande, A.K.; Ramsamy, P.L.; Ethirajan, S.; Rao, C.R.K.; Palanisamy, N. Deterioration of Reinforced Concrete in Sewer Environments. Proc. Inst. Civ. Eng. Munic. Eng. 2006, 159, 11–20. [Google Scholar] [CrossRef]
- Younis, R.; Knight, M.A. A Probability Model for Investigating the Trend of Structural Deterioration of Wastewater Pipelines. Tunn. Undergr. Space Technol. 2010, 25, 670–680. [Google Scholar] [CrossRef]
- Zhang, Z.; Fang, H.; Li, B.; Wang, F. Mechanical Properties of Concrete Pipes with Pre-Existing Cracks. Appl. Sci. 2020, 10, 1545. [Google Scholar] [CrossRef]
- Najafi, M.; Gokhale, S. Trenchless Technology: Pipeline and Utility Design, Construction, and Renewal, 2nd ed.; McGraw Hill: New York, NY, USA, 2021; pp. 1–23. [Google Scholar]
- Najafi, M. Pipeline Infrastructure Renewal and Asset Management, 1st ed.; McGraw Hill: New York, NY, USA, 2016; pp. 397–418. [Google Scholar]
- Najafi, M.; Yu, X.; Kohankar Kouchesfehani, Z.; Darabnoush Tehrani, A.; Korky, S.; Serajiantehrani, R.; Raut, S.; Kampbell, E.; Osborn, L. Structural Design Methodology for Spray Applied Pipe Liners in Gravity Storm Water Conveyance Conduits; Dept. of Transportation: Columbus, OH, USA, 2021; pp. 76–137. [Google Scholar]
- Dong, S.; Wang, D.; Hui, E.; Gao, C.; Zhang, H.; Tan, Y. An Overview of the Application of Fiber-Reinforced Cementitious Composites in Spray Repair of Drainage Pipes. Buildings 2023, 13, 1119. [Google Scholar] [CrossRef]
- Jackson, R.J.; Moore, I.D.; Genikomsou, A.S. A Linear Elastic Design Model for Sprayed Liners in Damaged Reinforced Concrete Pipes. Tunn. Undergr. Space Technol. 2023, 132, 104901. [Google Scholar] [CrossRef]
- Wang, Y.; Qian, X.; Liew, J.Y.R.; Zhang, M.-H. Experimental Behavior of Cement Filled Pipe-in-Pipe Composite Structures under Transverse Impact. Int. J. Impact Eng. 2014, 72, 1–16. [Google Scholar] [CrossRef]
- Zhao, J.Q.; Daigle, L. Structural Performance of Sliplined Watermain. Can. J. Civ. Eng. 2001, 28, 969–978. [Google Scholar] [CrossRef]
- McAlpine, G. Structural Rehabilitation of Semi Elliptical Concrete Sewers. In Pipelines 2006; American Society of Civil Engineers: Chicago, IL, USA, 2006; pp. 1–7. [Google Scholar]
- Shi, Z. Structural Analysis and Renovation Design of Ageing Sewers: Design Theories and Case Studies, 1st ed.; De Gruyter Open: Warsaw, Poland; Berlin, Germany, 2016; pp. 65–212. [Google Scholar]
- Moore, I.D.; Hoult, N.A.; MacDougall, K. Establishment of Appropriate Guidelines for Use of the Direct and Indirect Design Methods for Reinforced Concrete Pipe; AASHTO Standing Committee on Highways: Washington, DC, USA, 2014; pp. 5–26. [Google Scholar]
- Moore, I.D. Design of Sprayed Cementitious Liners within Corrugated Steel Pipes. In Pipelines 2019; American Society of Civil Engineers: Reston, VA, USA, 2019; pp. 485–492. [Google Scholar]
- Moore, I.D.; García, D.B. Ultimate Strength Testing of Two Deteriorated Metal Culverts Repaired with Spray-on Cementitious Liners. Transp. Res. Rec. J. Transp. Res. Board 2015, 2522, 139–147. [Google Scholar] [CrossRef]
- He, C.; Dong, S.; Li, J.; Liao, J.; Wei, Y.; Ma, B.; Huang, S. Experimental Study on the Structural Performance of RCP Rehabilitation by Spraying Method under Preloading. Tunn. Undergr. Space Technol. 2025, 155, 106218. [Google Scholar] [CrossRef]
- Makisha, E. The Research of Reinforced Cement Liner for Reconstruction of Water Supply and Sewer Pipes. J. Appl. Eng. Sci. 2022, 20, 688–699. [Google Scholar] [CrossRef]
- Zhao, Y.; Ma, B.; Ariaratnam, S.T.; Zeng, C.; Yan, X.; Wang, F.; Wang, T.; Zhu, Z.; He, C.; Shi, G.; et al. Structural Performance of Damaged Rigid Pipe Rehabilitated by Centrifugal Spray on Mortar Liner. Tunn. Undergr. Space Technol. 2021, 116, 104117. [Google Scholar] [CrossRef]
- Ugural, A.C.; Fenster, S.K. Advanced Strength and Applied Elasticity, 4th ed.; Pearson College Div: Upper Saddle River, NJ, USA, 2003; pp. 206–211. [Google Scholar]
- Young, W.; Budynas, R.; Sadegh, A. Roark’s Formulas for Stress and Strain, 8th ed.; McGraw Hill: New York, NY, USA, 2011; pp. 267–381. [Google Scholar]
- Joint Committee on Structural Safety (JCSS). Probabilistic Model Code - Part 3: Material Properties. 2001. [Google Scholar]
- Sobol′, I.M. Global Sensitivity Indices for Nonlinear Mathematical Models and Their Monte Carlo Estimates. Math. Comput. Simul. 2001, 55, 271–280. [Google Scholar] [CrossRef]
- Li, B.; Zhu, L.; Fu, X. Influence of Grout Strength and Residual Deformation on Performance of Rehabilitated RC Pipes. J. Pipeline Syst. Eng. Pract. 2020, 11, 04020003. [Google Scholar] [CrossRef]
- GB/T 50010-2010; Code for Design of Concrete Structures. China Construction Industry Press: Beijing, China, 2010.
- GB/T 11836-2023; Concrete and Reinforced Concrete Sewer Pipes. Standards Press of China: Beijing, China, 2023.
- Xu, G.; Wang, J.; Shen, L. Structural Dimension and Reinforcement Design Chart of Reinforced Concrete Drainage Pipe; Concrete Products Quality Supervision and Inspection Center of China: Beijing, China, 2006. [Google Scholar]
- Zhang, X.; Fang, H.; Shi, M.; Du, M.; Yang, K.; Li, B.; Zhang, Z. Structural Performance of Corroded Concrete Pipes after Mortar Spraying Rehabilitation under Traffic Load. Tunn. Undergr. Space Technol. 2022, 128, 104620. [Google Scholar] [CrossRef]
- Beushausen, H.; Alexander, M.G. Bond Strength Development between Concretes of Different Ages. Mag. Concr. Res. 2008, 60, 65–74. [Google Scholar] [CrossRef]
- Espeche, A.D.; León, J. Estimation of Bond Strength Envelopes for Old-to-New Concrete Interfaces Based on a Cylinder Splitting Test. Constr. Build. Mater. 2011, 25, 1222–1235. [Google Scholar] [CrossRef]
- Muzenski, S.; Haber, Z.B.; Graybeal, B. Monolithic and Non-Monolithic Interface Shear Performance of Ultra-High Performance Concrete. Eng. Struct. 2023, 281, 115667. [Google Scholar] [CrossRef]
- Wang, B.; Xu, S.; Liu, F. Evaluation of Tensile Bonding Strength between UHTCC Repair Materials and Concrete Substrate. Constr. Build. Mater. 2016, 112, 595–606. [Google Scholar] [CrossRef]
- GB/T 16752-2017; Test Methods of Concrete and Reinforced Concrete Sewer Pipes. Standards Press of China: Beijing, China, 2017.
- GB/T 50081-2019; Standard for Test Methods of Concrete Physical and Mechanical Properties. China Construction Industry Press: Beijing, China, 2019.
- JGJ/T 70-2009; Standard for Test Method of Basic Properties of Construction Mortar. China Construction Industry Press: Beijing, China, 2009.
- HPFRCC. Recommendations for Design and Construction of High Performance Fiber Reinforced Cement Composites with Multiple Fine Cracks; Japan Society of Civil Engineers (JSCE): Tokyo, Japan, 2008. [Google Scholar]
- GB/T 7897-2008; Test Methods of Properties of Mortar for Ferrocement. Standards Press of China: Beijing, China, 2008.
- Timoshenko, S.P.; Gere, J.M. Theory of Elastic Stability, 2nd ed.; Dover Publications: Mineola, NY, USA, 2009; pp. 278–313. [Google Scholar]
- Xu, S.; Mu, F.; Wang, J.; Li, W. Experimental Study on the Interfacial Bonding Behaviors between Sprayed UHTCC and Concrete Substrate. Constr. Build. Mater. 2019, 195, 638–649. [Google Scholar] [CrossRef]
- Xia, J.; Shan, K.; Wu, X.; Gan, R.; Jin, W. Shear-Friction Behavior of Concrete-to-Concrete Interface under Direct Shear Load. Eng. Struct. 2021, 238, 112211. [Google Scholar] [CrossRef]
- Watkins, R.K. Structural Mechanics of Buried Pipes, 1st ed.; CRC Press: Boca Raton, FL, USA, 1999; pp. 362–383. [Google Scholar]
- Royer, J.R.; Allouche, E. Laboratory Testing and Analysis of Geopolymer Pipe-Lining Technology for Rehabilitation of Sewer & Stormwater Conduits; North American Society for Trenchless Technology (NASTT): Bothell, WA, USA, 2016; pp. 1–10. [Google Scholar]
- ASTM F1216-22; Standard Practice for Rehabilitation of Existing Pipelines and Conduits by the Inversion and Curing of a Resin-Impregnated Tube. ASTM International: West Conshohocken, PA, USA, 2022.


| Internal Diameter (mm) | Thickness (mm) | Cage Position | Circular Rebar | Longitudinal Rebar | ||||
|---|---|---|---|---|---|---|---|---|
| DC (mm) | IDC (mm) | Count | Distance (mm) | DL (mm) | Count | |||
| 1000 | 100 | Inner | 5 | 1040 | 25 | 40 | 5 | 12 |
| Outer | 5 | 1150 | 18.8 | 53.1 | 5 | 12 | ||
| Material | Compressive Strength (MPa) | Tensile Strength (MPa) | Flexural Strength (MPa) | Elastic Modulus (GPa) | Standard |
|---|---|---|---|---|---|
| Concrete | 53.83 (2.71%) 1 | 2.43 (9.27%) 1 | 4.51 (0.13%) 1 | 38.1 (8.01%) 1 | 1. GB/T 50081-2019 [36] 2. JGJ/T 70-2009 [37] 3. HPFRCC [38] 4. GB/T 7897-2008 [39] |
| Mortar | 102.3 (5.19%) 2 | 3.13 (7.23%) 3 | 9.66 (1.02%) 4 | 43.1 (2.95%) 4 |
| Specimen | Elastic Limit Load (kN/m) | Displacement (mm) | Stiffness EI (kN·mm) | Yield Load (kN/m) | Displacement (mm) | Ultimate Load (kN/m) | Displacement (mm) |
|---|---|---|---|---|---|---|---|
| A-34 | 22.6 | 0.50 | 28.19 × 10⁸ | 52.3 | 5.62 | 60.2 | 14.58 |
| B-45 | 16.1 | 0.38 | 27.34 × 10⁸ | 52.8 | 4.88 | 93.8 | 17.97 |
| A | 39.9 | 1.31 | 22.21 × 10⁸ | 119.4 | 18.69 | 133.3 | 28.88 |
| B | 41.3 | 0.98 | 14.25 × 10⁸ | 115.0 | 17.36 | 135.3 | 36.28 |
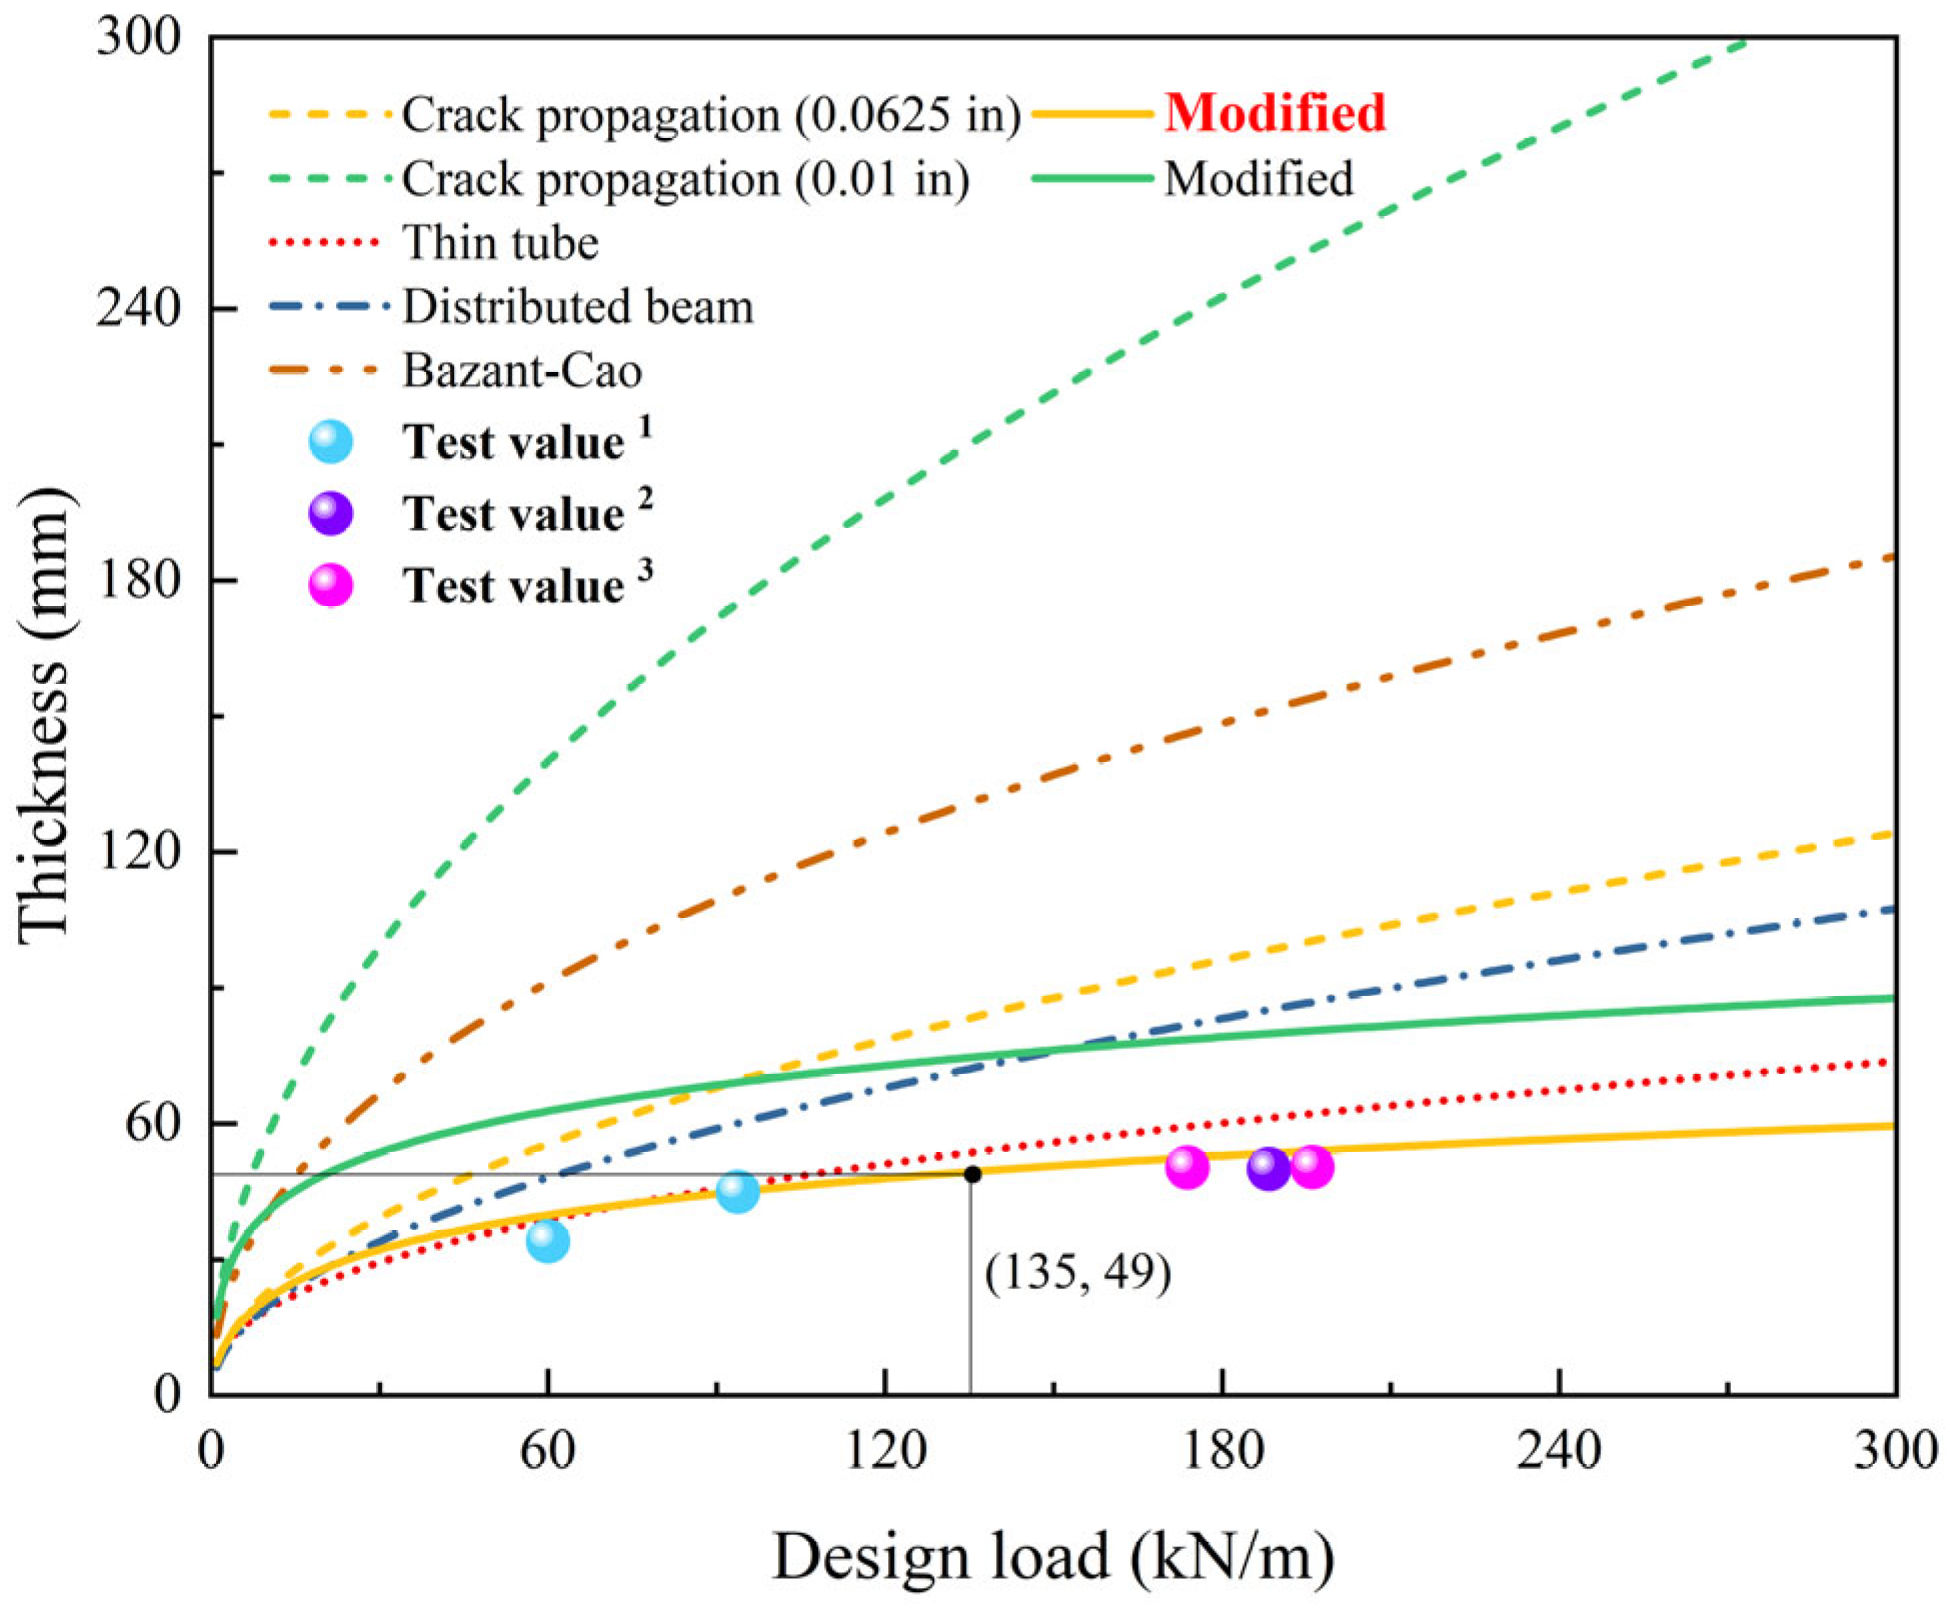
| Thickness Design Model | Calculation Equation | Parameter |
|---|---|---|
| Thin tube model | qt is the external load. L is the effective length caused by surface traffic wheels, which is taken as the pipe length here. r is the inside radius of the host pipe. EL is the elastic modulus of the liner. N is the safety factor, and C is the ovality reduction factor, as defined in ASTM F1216 [45]. | |
| Distributed beam model | SF is the flexural strength of the liner. | |
| Bazant–Cao scaling model | λo and B are the scaling parameters. da is the maximum aggregate size. σTL is the tensile strength of the liner. | |
| Crack propagation model | wd is the design crack width, wd = 0.0625 in (1.59 mm) or 0.01 in (0.25 mm). |
| Specimen | Interface Failure Load | Lining Thickness | ||
|---|---|---|---|---|
| Stripping Load (Crown/Invert) | Stripping Load (Springlines) | Slipping Load (Crown/Invert) | ||
| A-34 | Advanced SCB model | Modified crack propagation | ||
| - | - | 5.6% | 14.5% | |
| Original SCB model | Crack propagation | |||
| - | - | 34.9% | 38.8% | |
| B-45 | Advanced SCB model | Modified crack propagation | ||
| 0.9% | 3.1% | 3.2% | 0.2% | |
| Original SCB model | Crack propagation | |||
| - | - | 24.2% | 35.3% | |
Disclaimer/Publisher’s Note: The statements, opinions and data contained in all publications are solely those of the individual author(s) and contributor(s) and not of MDPI and/or the editor(s). MDPI and/or the editor(s) disclaim responsibility for any injury to people or property resulting from any ideas, methods, instructions or products referred to in the content. |
© 2025 by the authors. Licensee MDPI, Basel, Switzerland. This article is an open access article distributed under the terms and conditions of the Creative Commons Attribution (CC BY) license (https://creativecommons.org/licenses/by/4.0/).
Share and Cite
Li, J.; He, C.; Wei, Y.; Wu, H.; Liao, J.; Dong, S.; Huang, S.; Ma, B. Failure Behavior of Damaged Reinforced Concrete Pipe Rehabilitated with Fiber-Reinforced Mortar Lining. Materials 2025, 18, 3130. https://doi.org/10.3390/ma18133130
Li J, He C, Wei Y, Wu H, Liao J, Dong S, Huang S, Ma B. Failure Behavior of Damaged Reinforced Concrete Pipe Rehabilitated with Fiber-Reinforced Mortar Lining. Materials. 2025; 18(13):3130. https://doi.org/10.3390/ma18133130
Chicago/Turabian StyleLi, Jieyao, Chunliang He, Yingjie Wei, Haoliang Wu, Jiajie Liao, Shun Dong, Sheng Huang, and Baosong Ma. 2025. "Failure Behavior of Damaged Reinforced Concrete Pipe Rehabilitated with Fiber-Reinforced Mortar Lining" Materials 18, no. 13: 3130. https://doi.org/10.3390/ma18133130
APA StyleLi, J., He, C., Wei, Y., Wu, H., Liao, J., Dong, S., Huang, S., & Ma, B. (2025). Failure Behavior of Damaged Reinforced Concrete Pipe Rehabilitated with Fiber-Reinforced Mortar Lining. Materials, 18(13), 3130. https://doi.org/10.3390/ma18133130