


Effect of Pre-Damage on the Behavior of Axially and Eccentrically Compressed Concrete Cylinders Confined with PBO-FRCM


Abstract
1. Introduction
2. Materials and Methods
2.1. Preparation of Concrete Cylinders
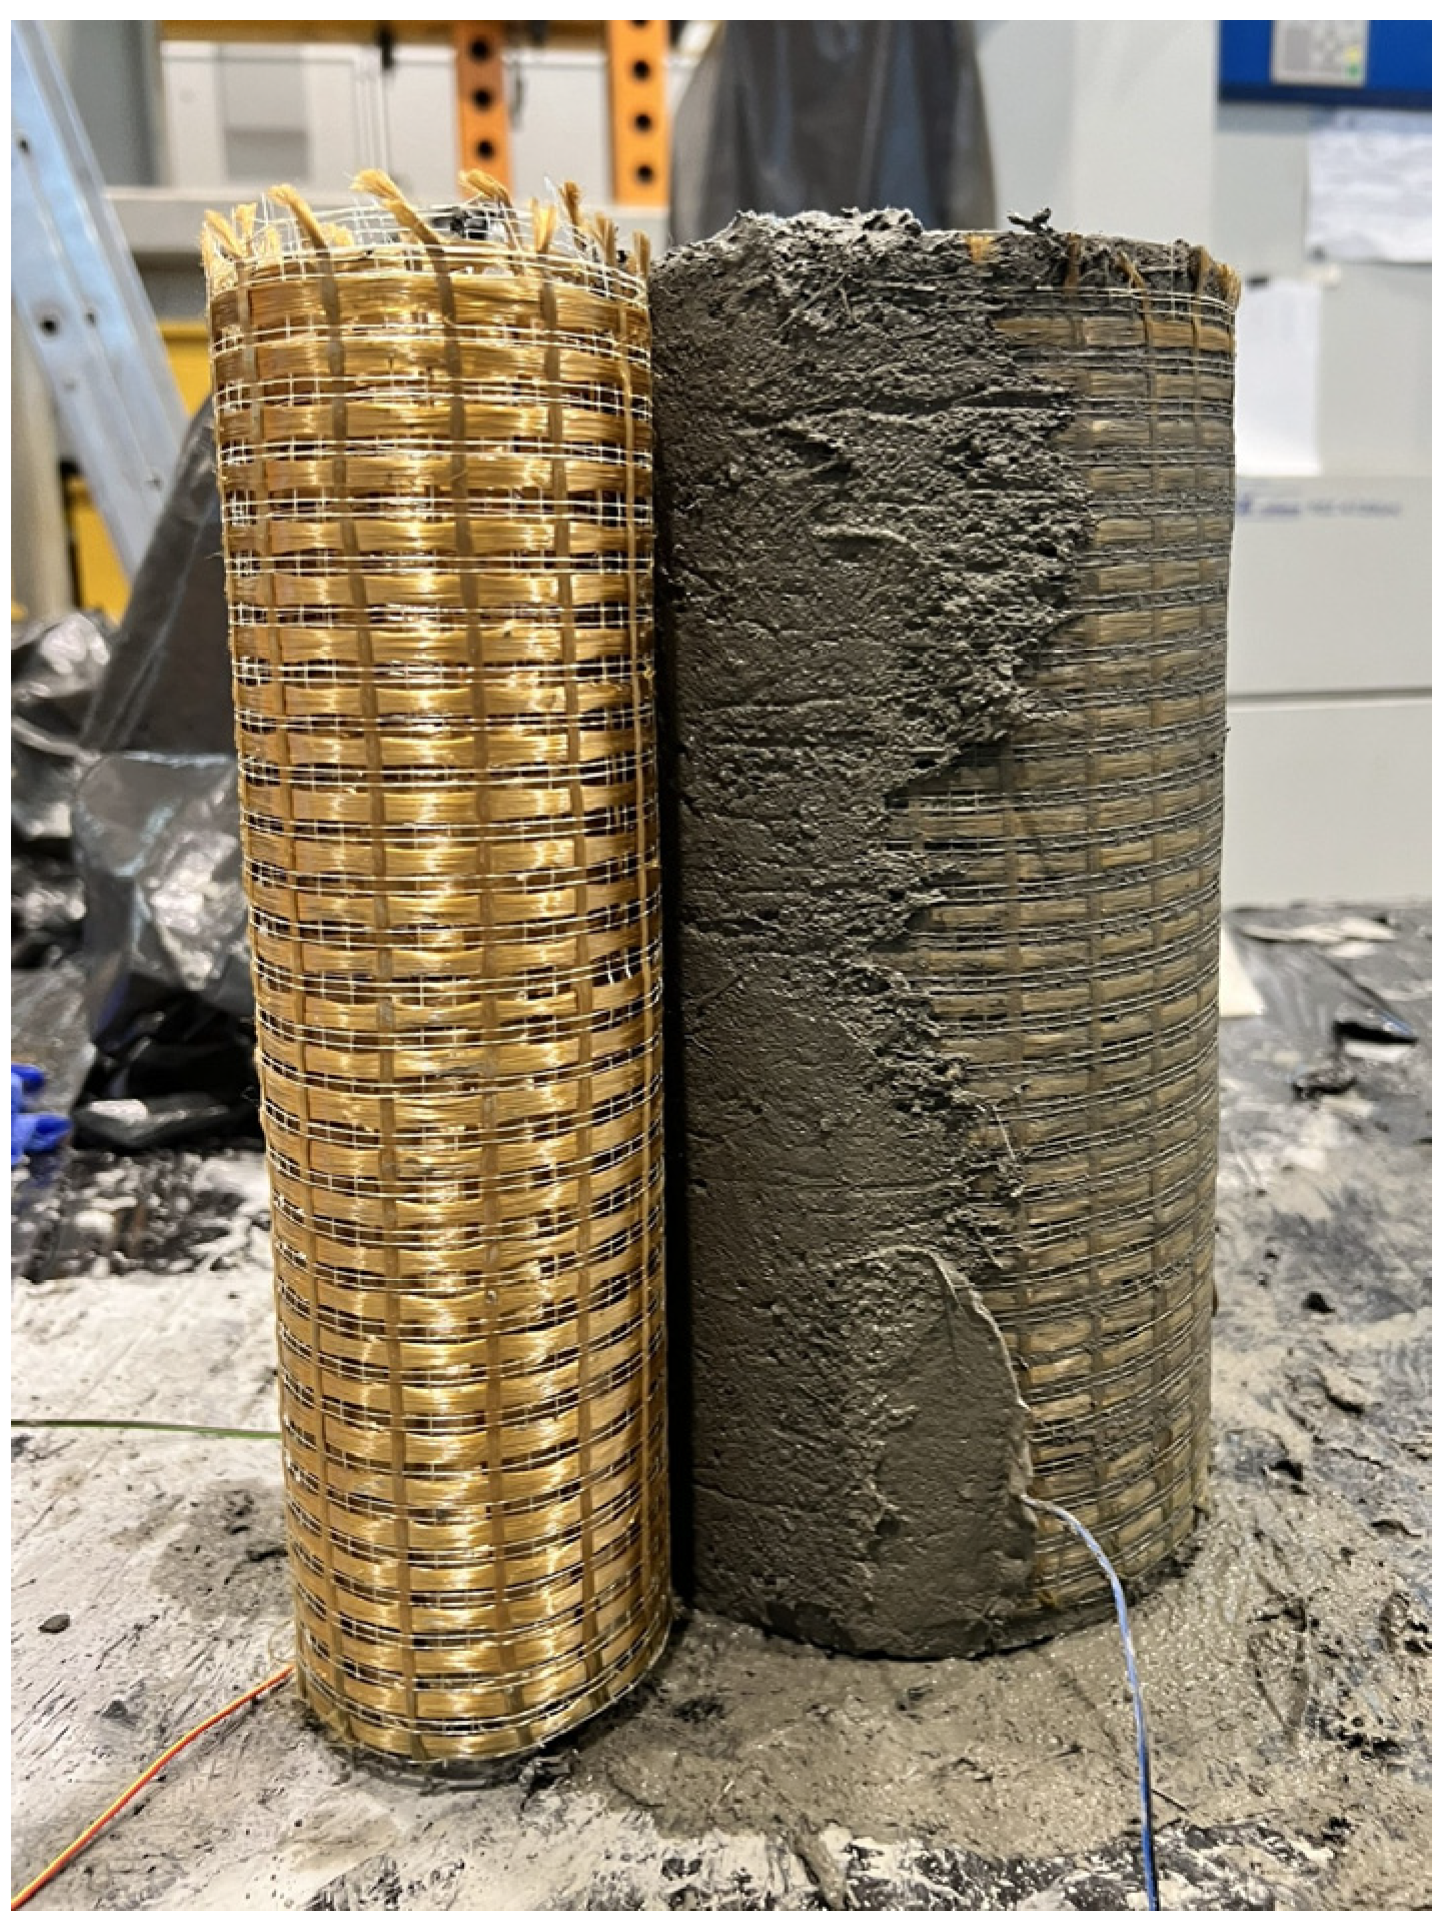
2.2. Strengthening of the Concrete Cylinders
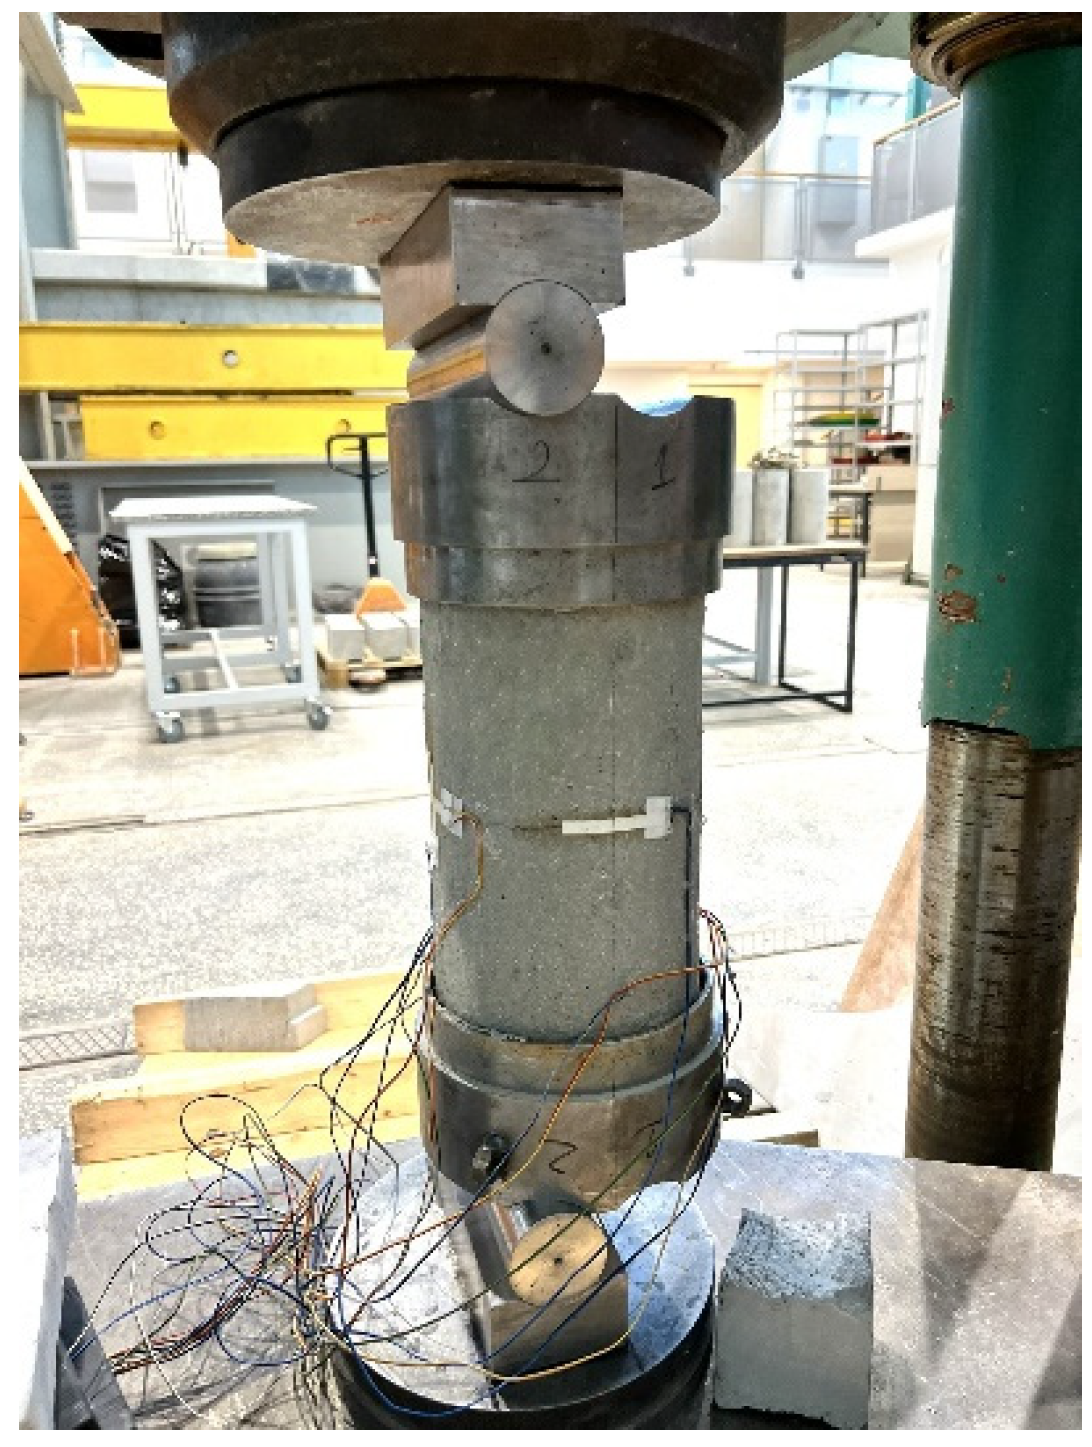
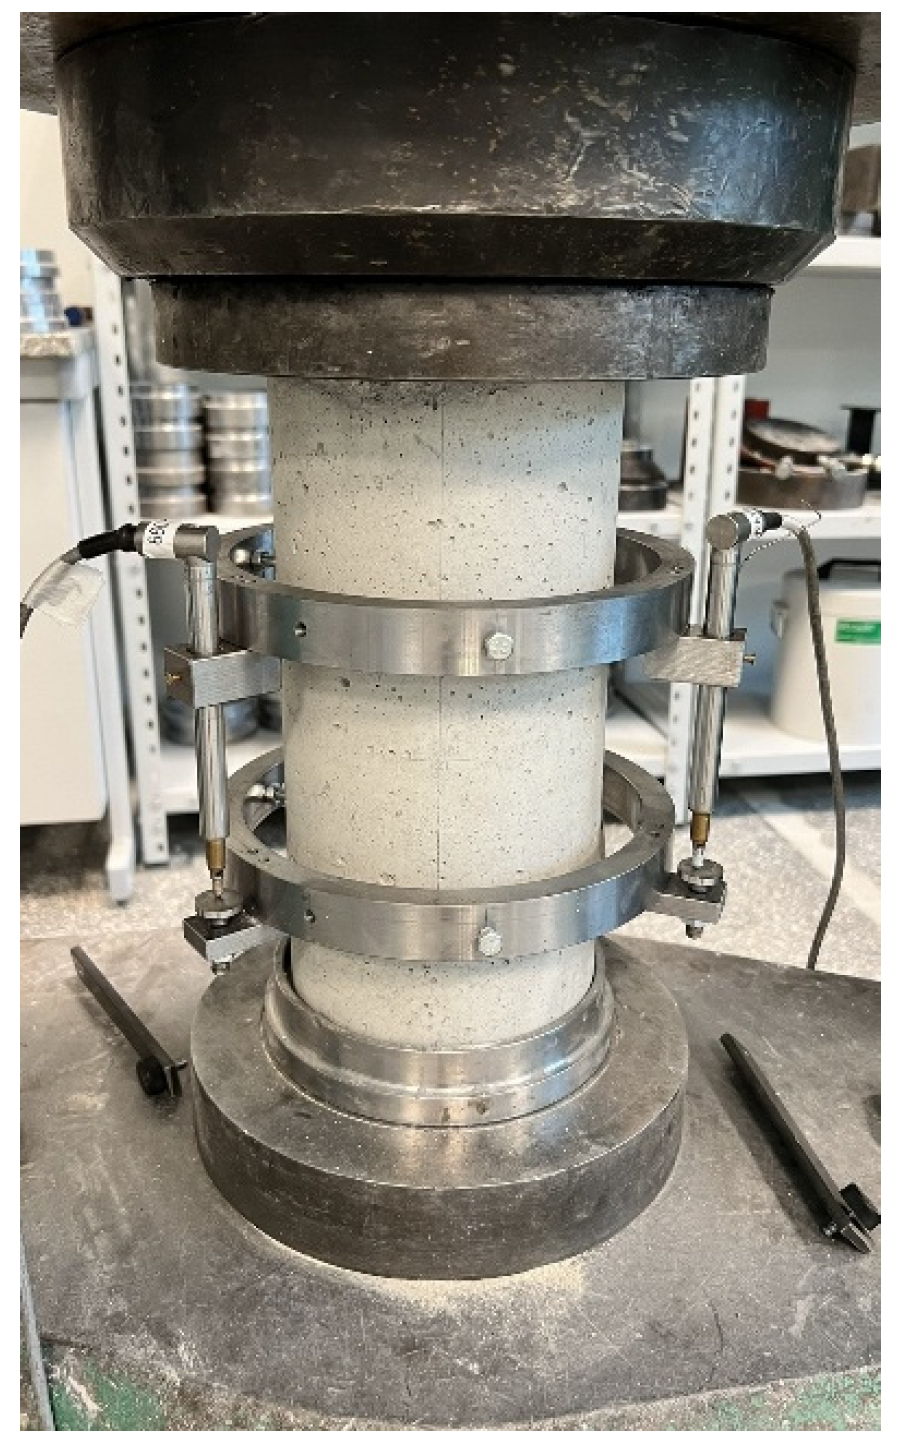
2.3. Preparation of the Specimens for Compression Tests
2.4. Pre-Damage Procedure
3. Results
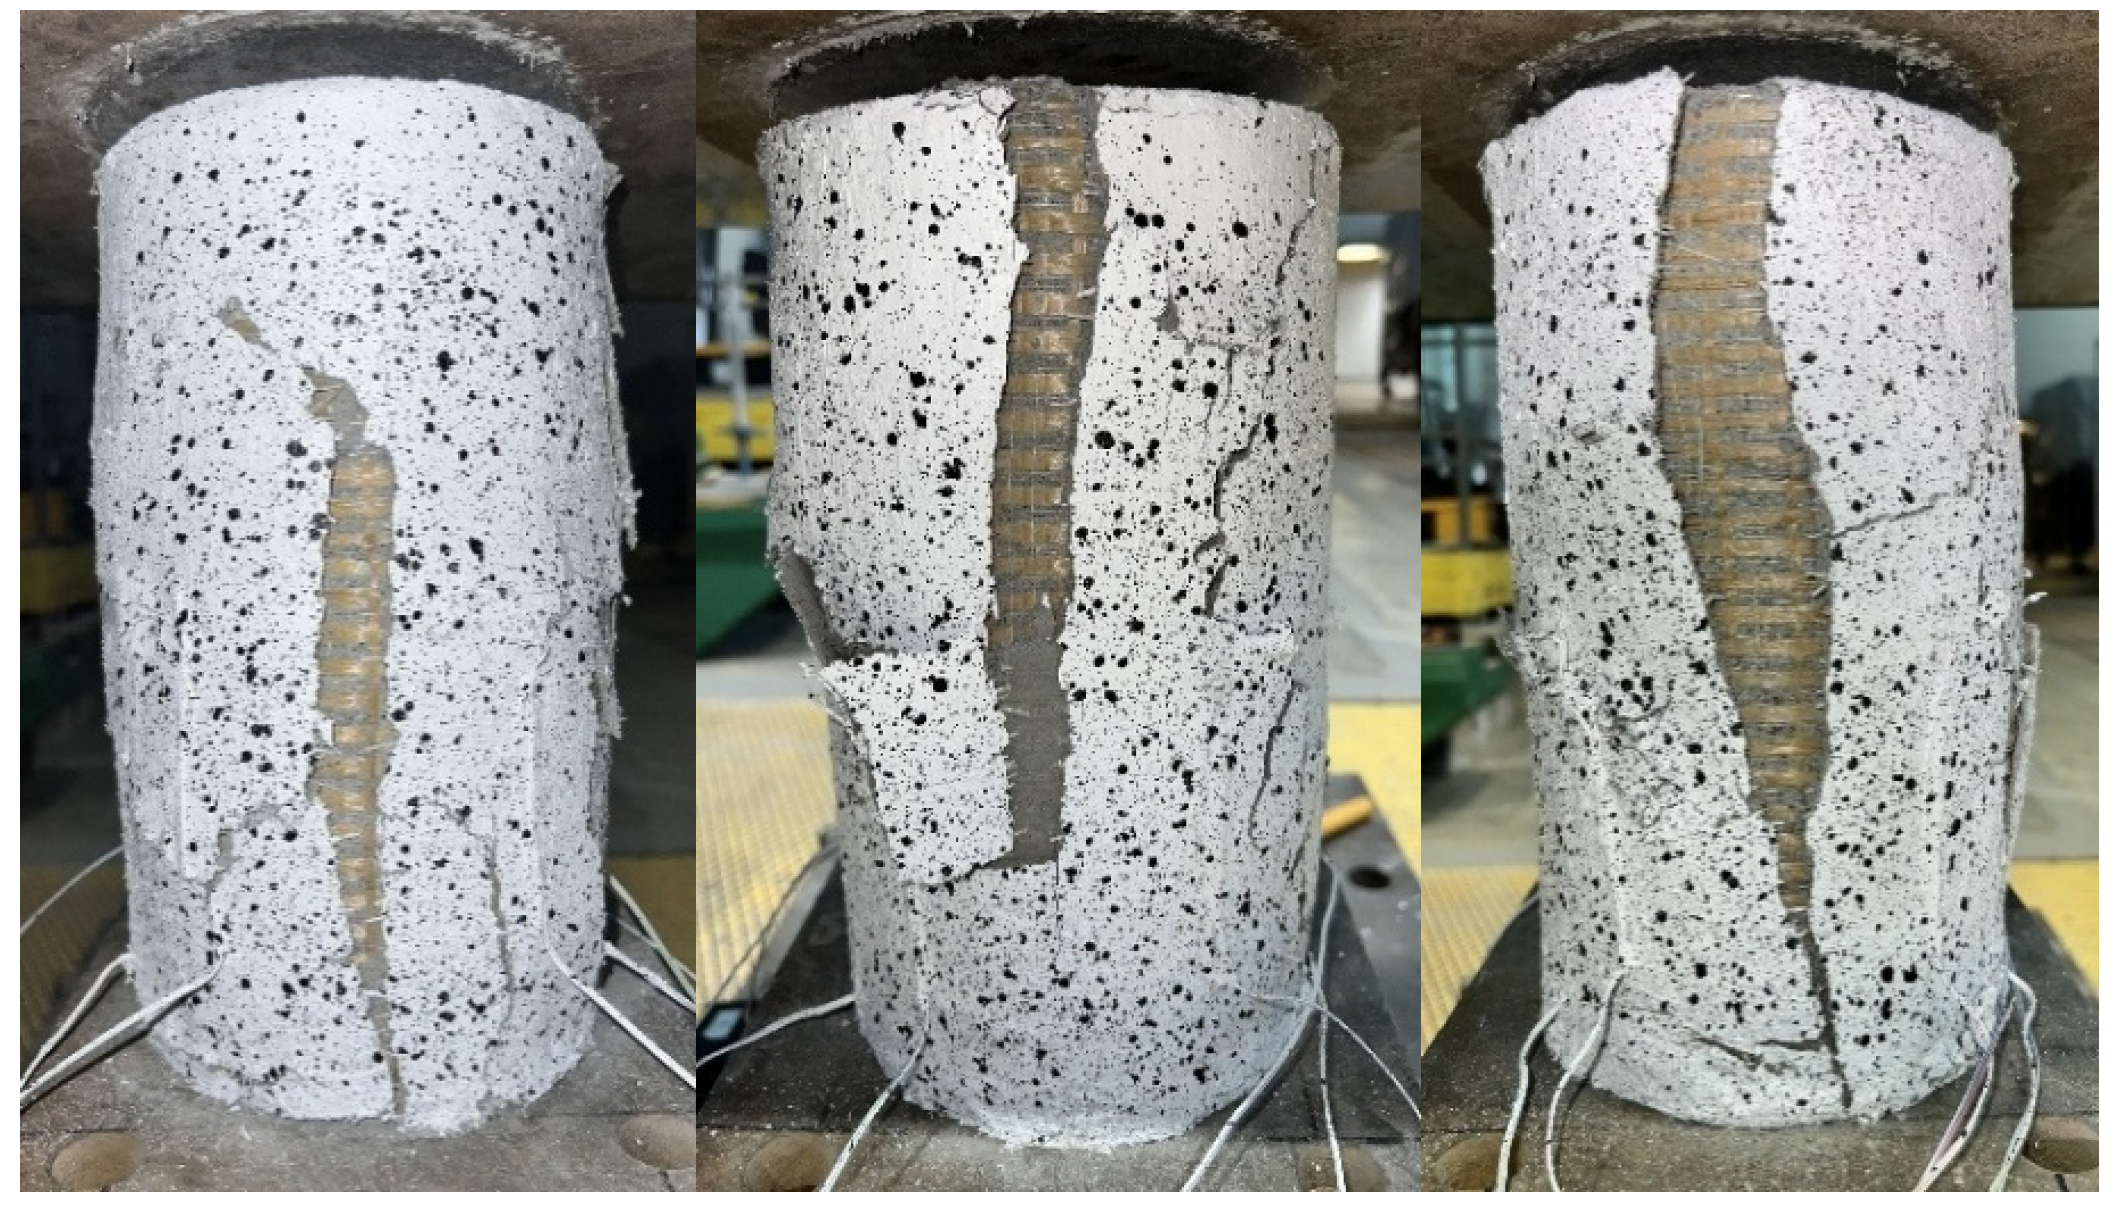
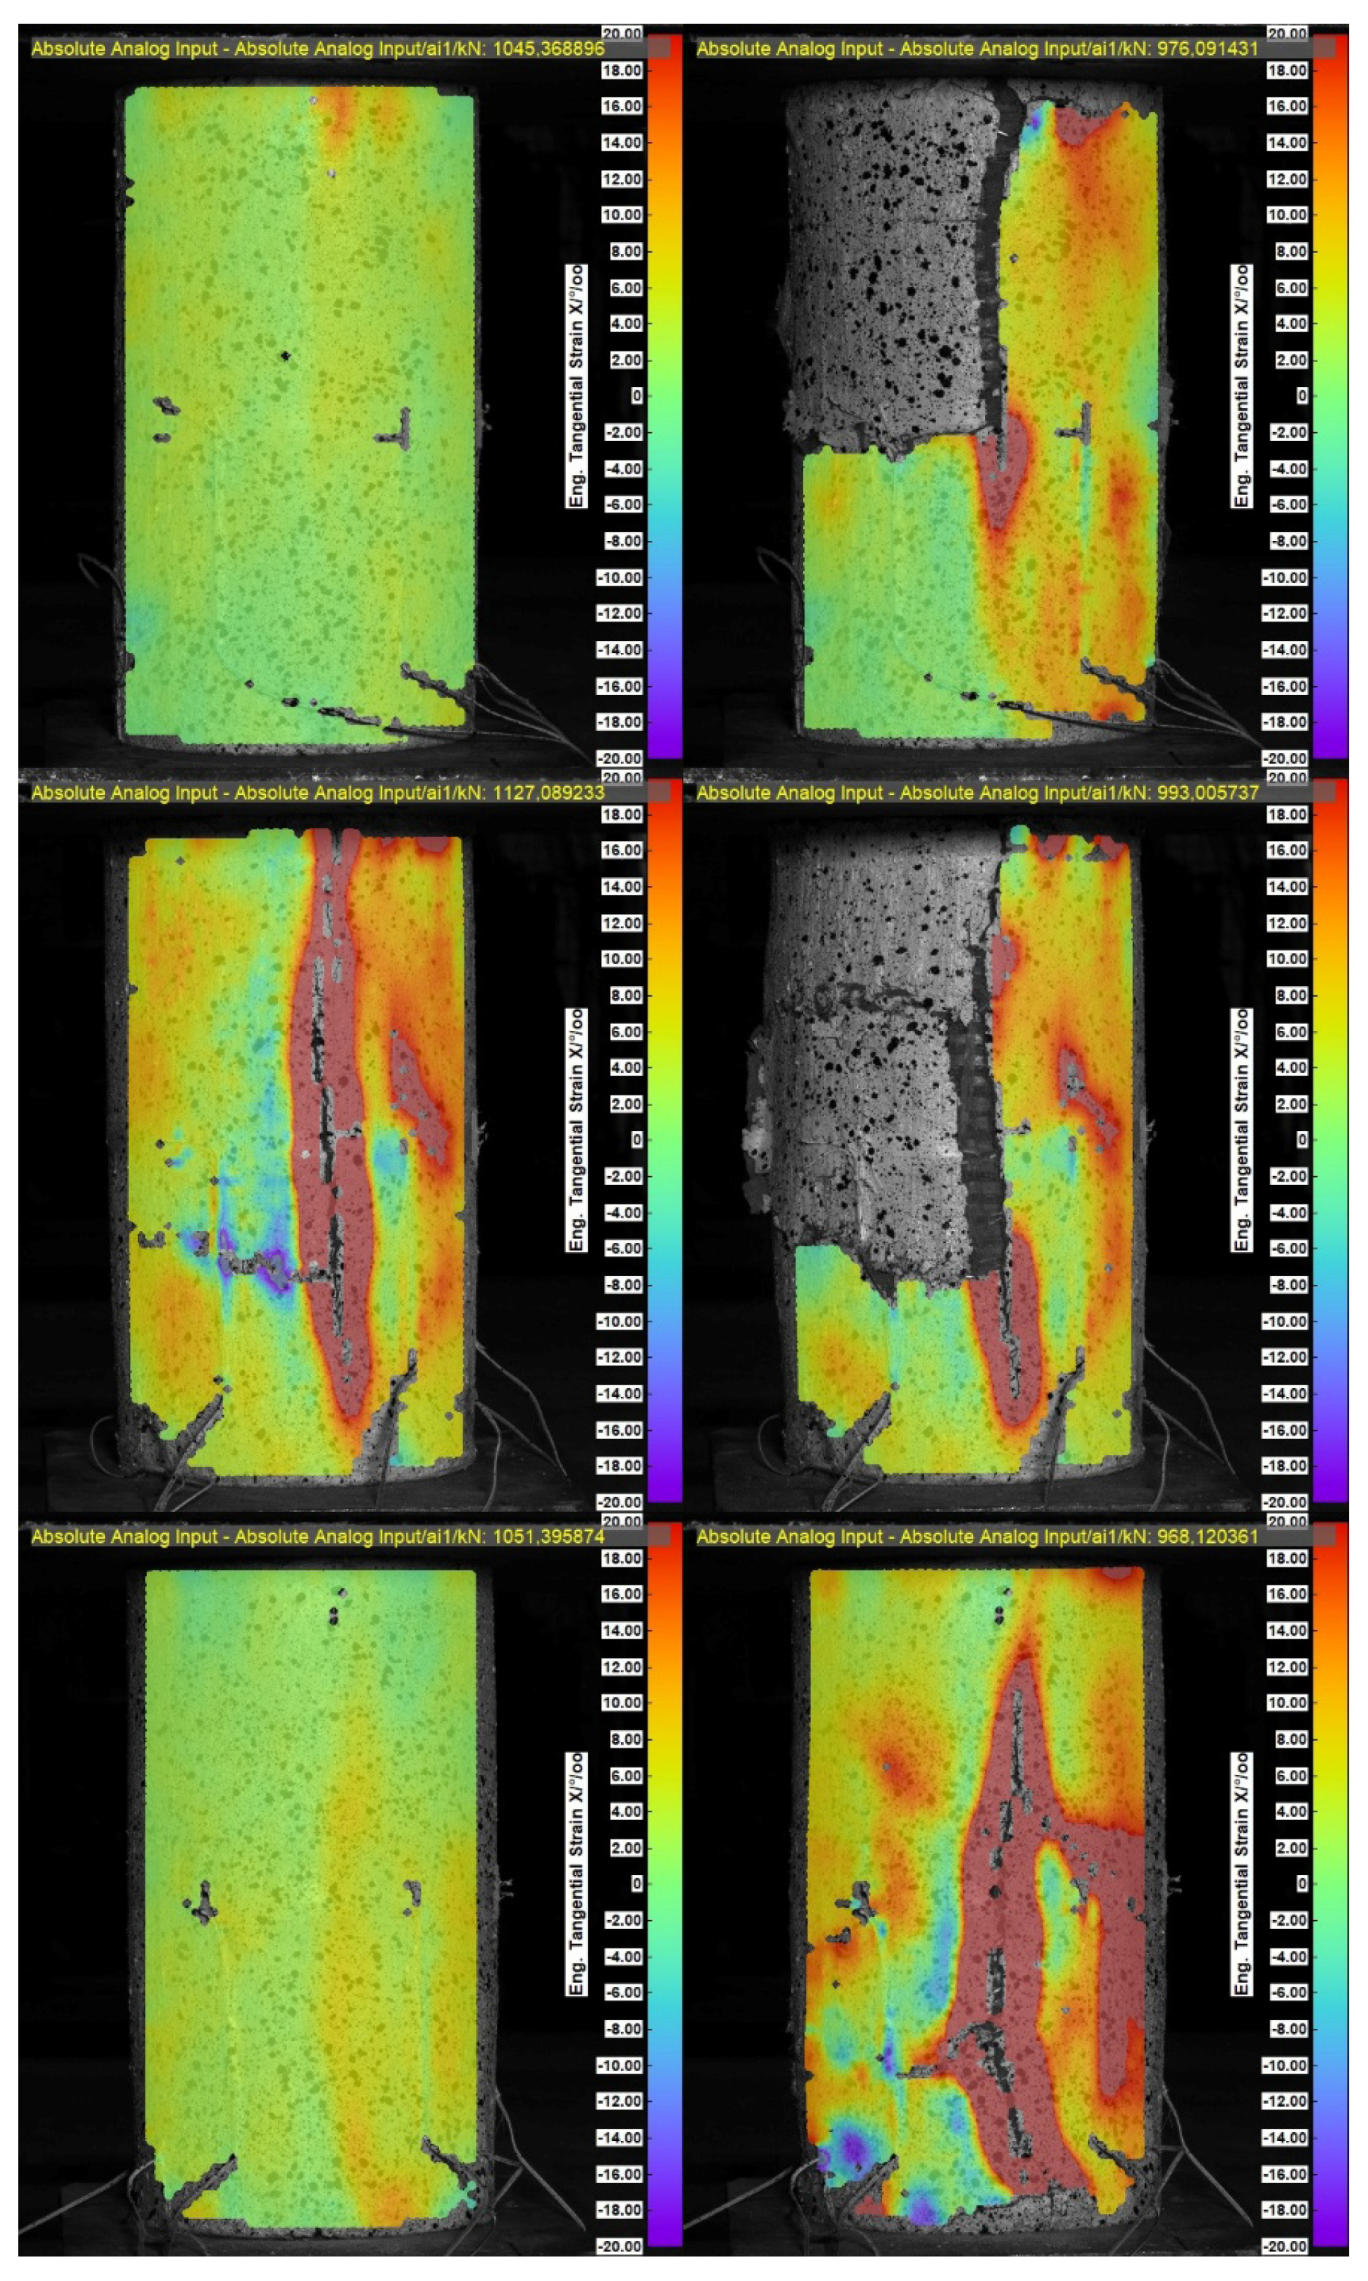
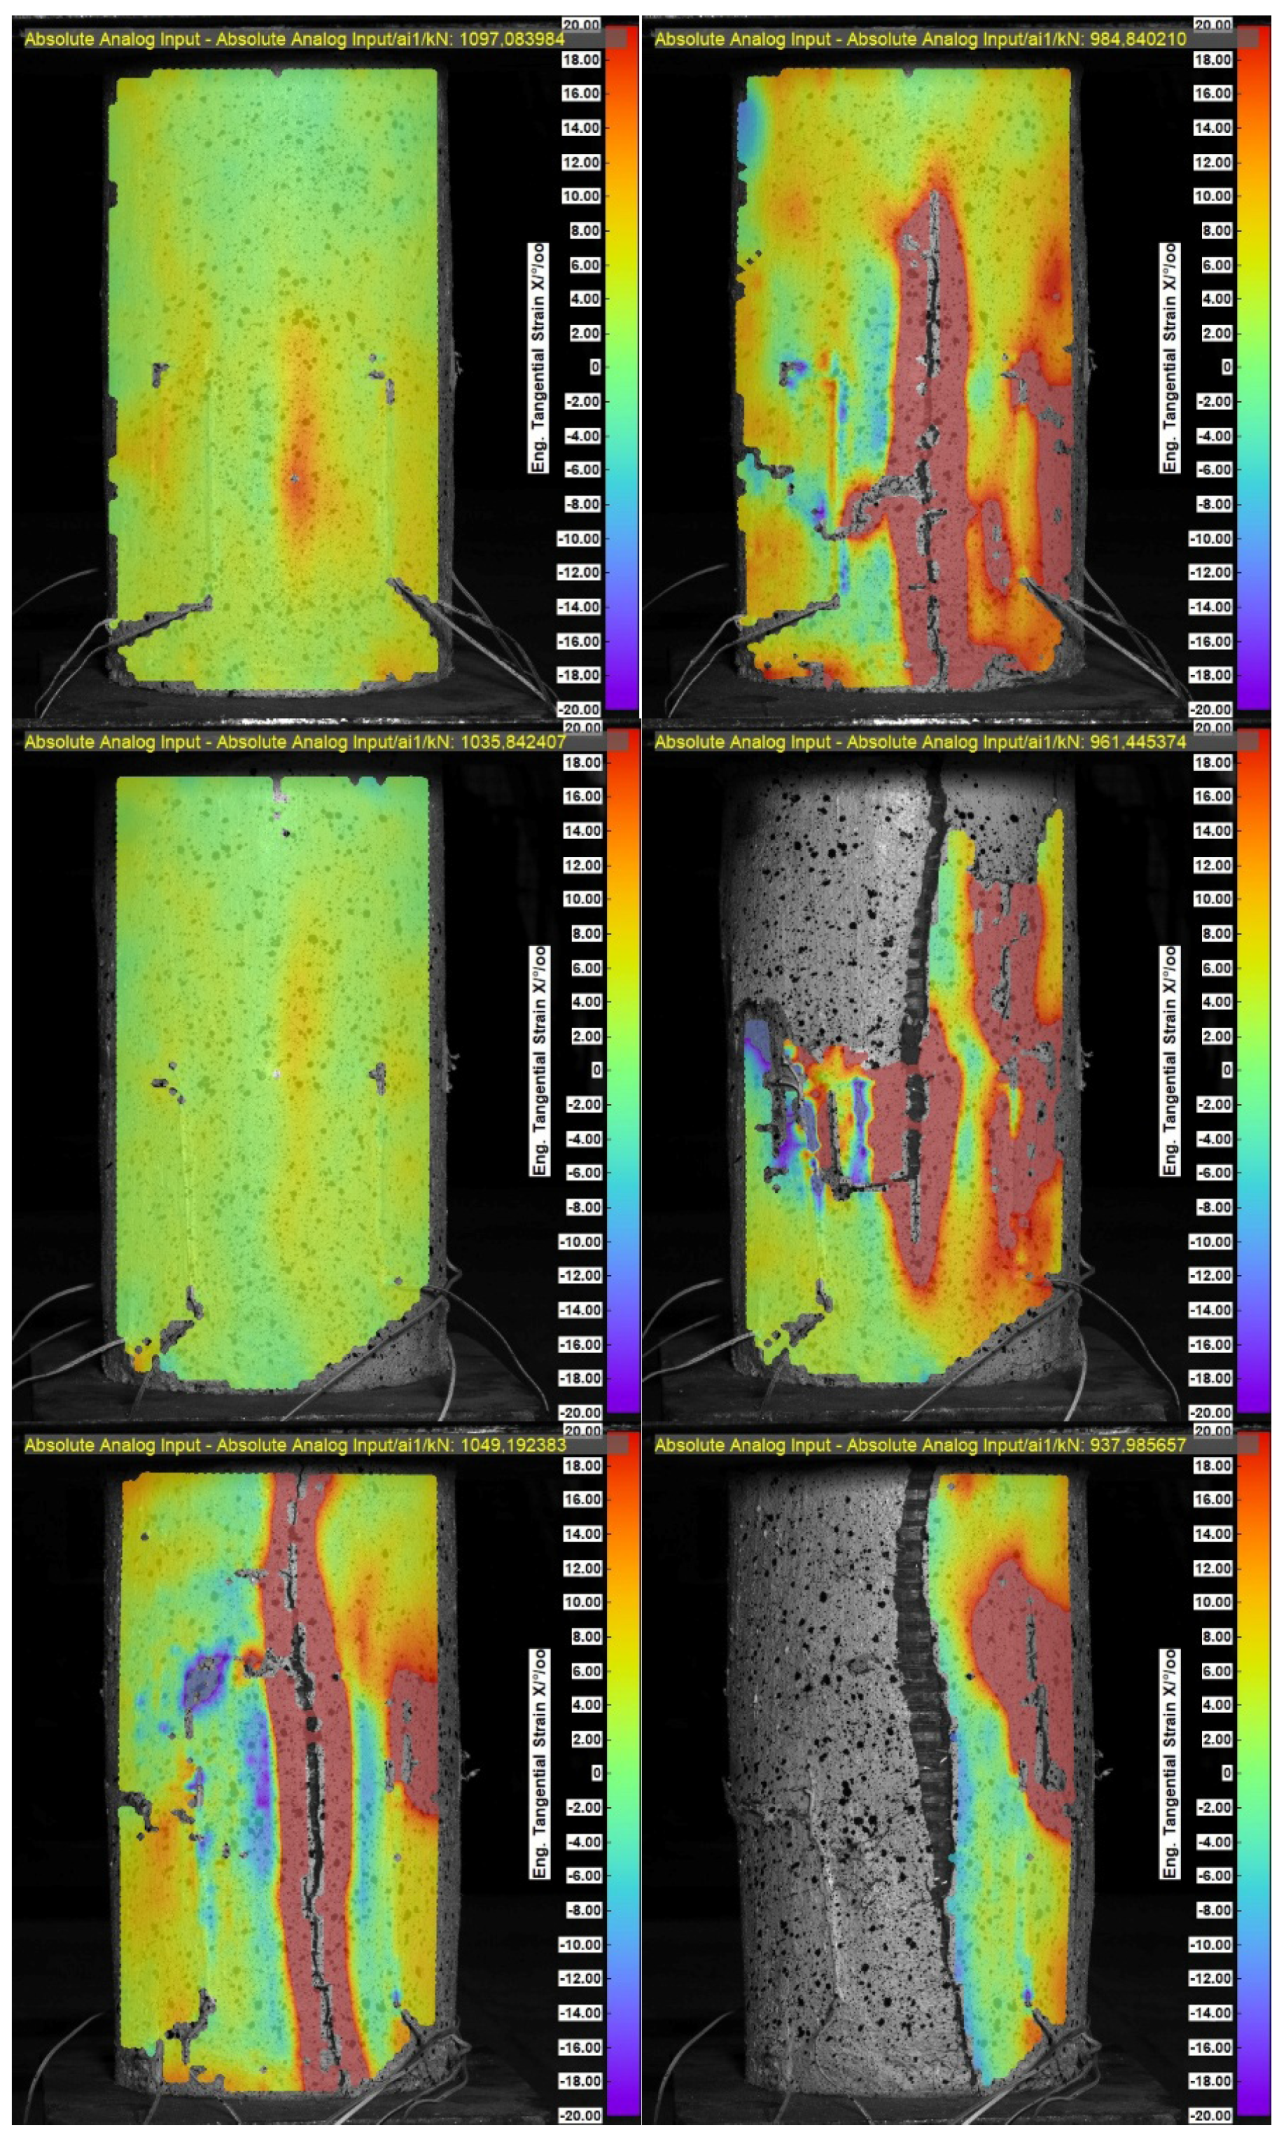
3.1. Failure Modes
3.1.1. Axially Compressed Specimens
3.1.2. Eccentrically Compressed Specimens
3.2. Load-Bearing Capacity and Deformability
3.2.1. Axially Compressed Specimens
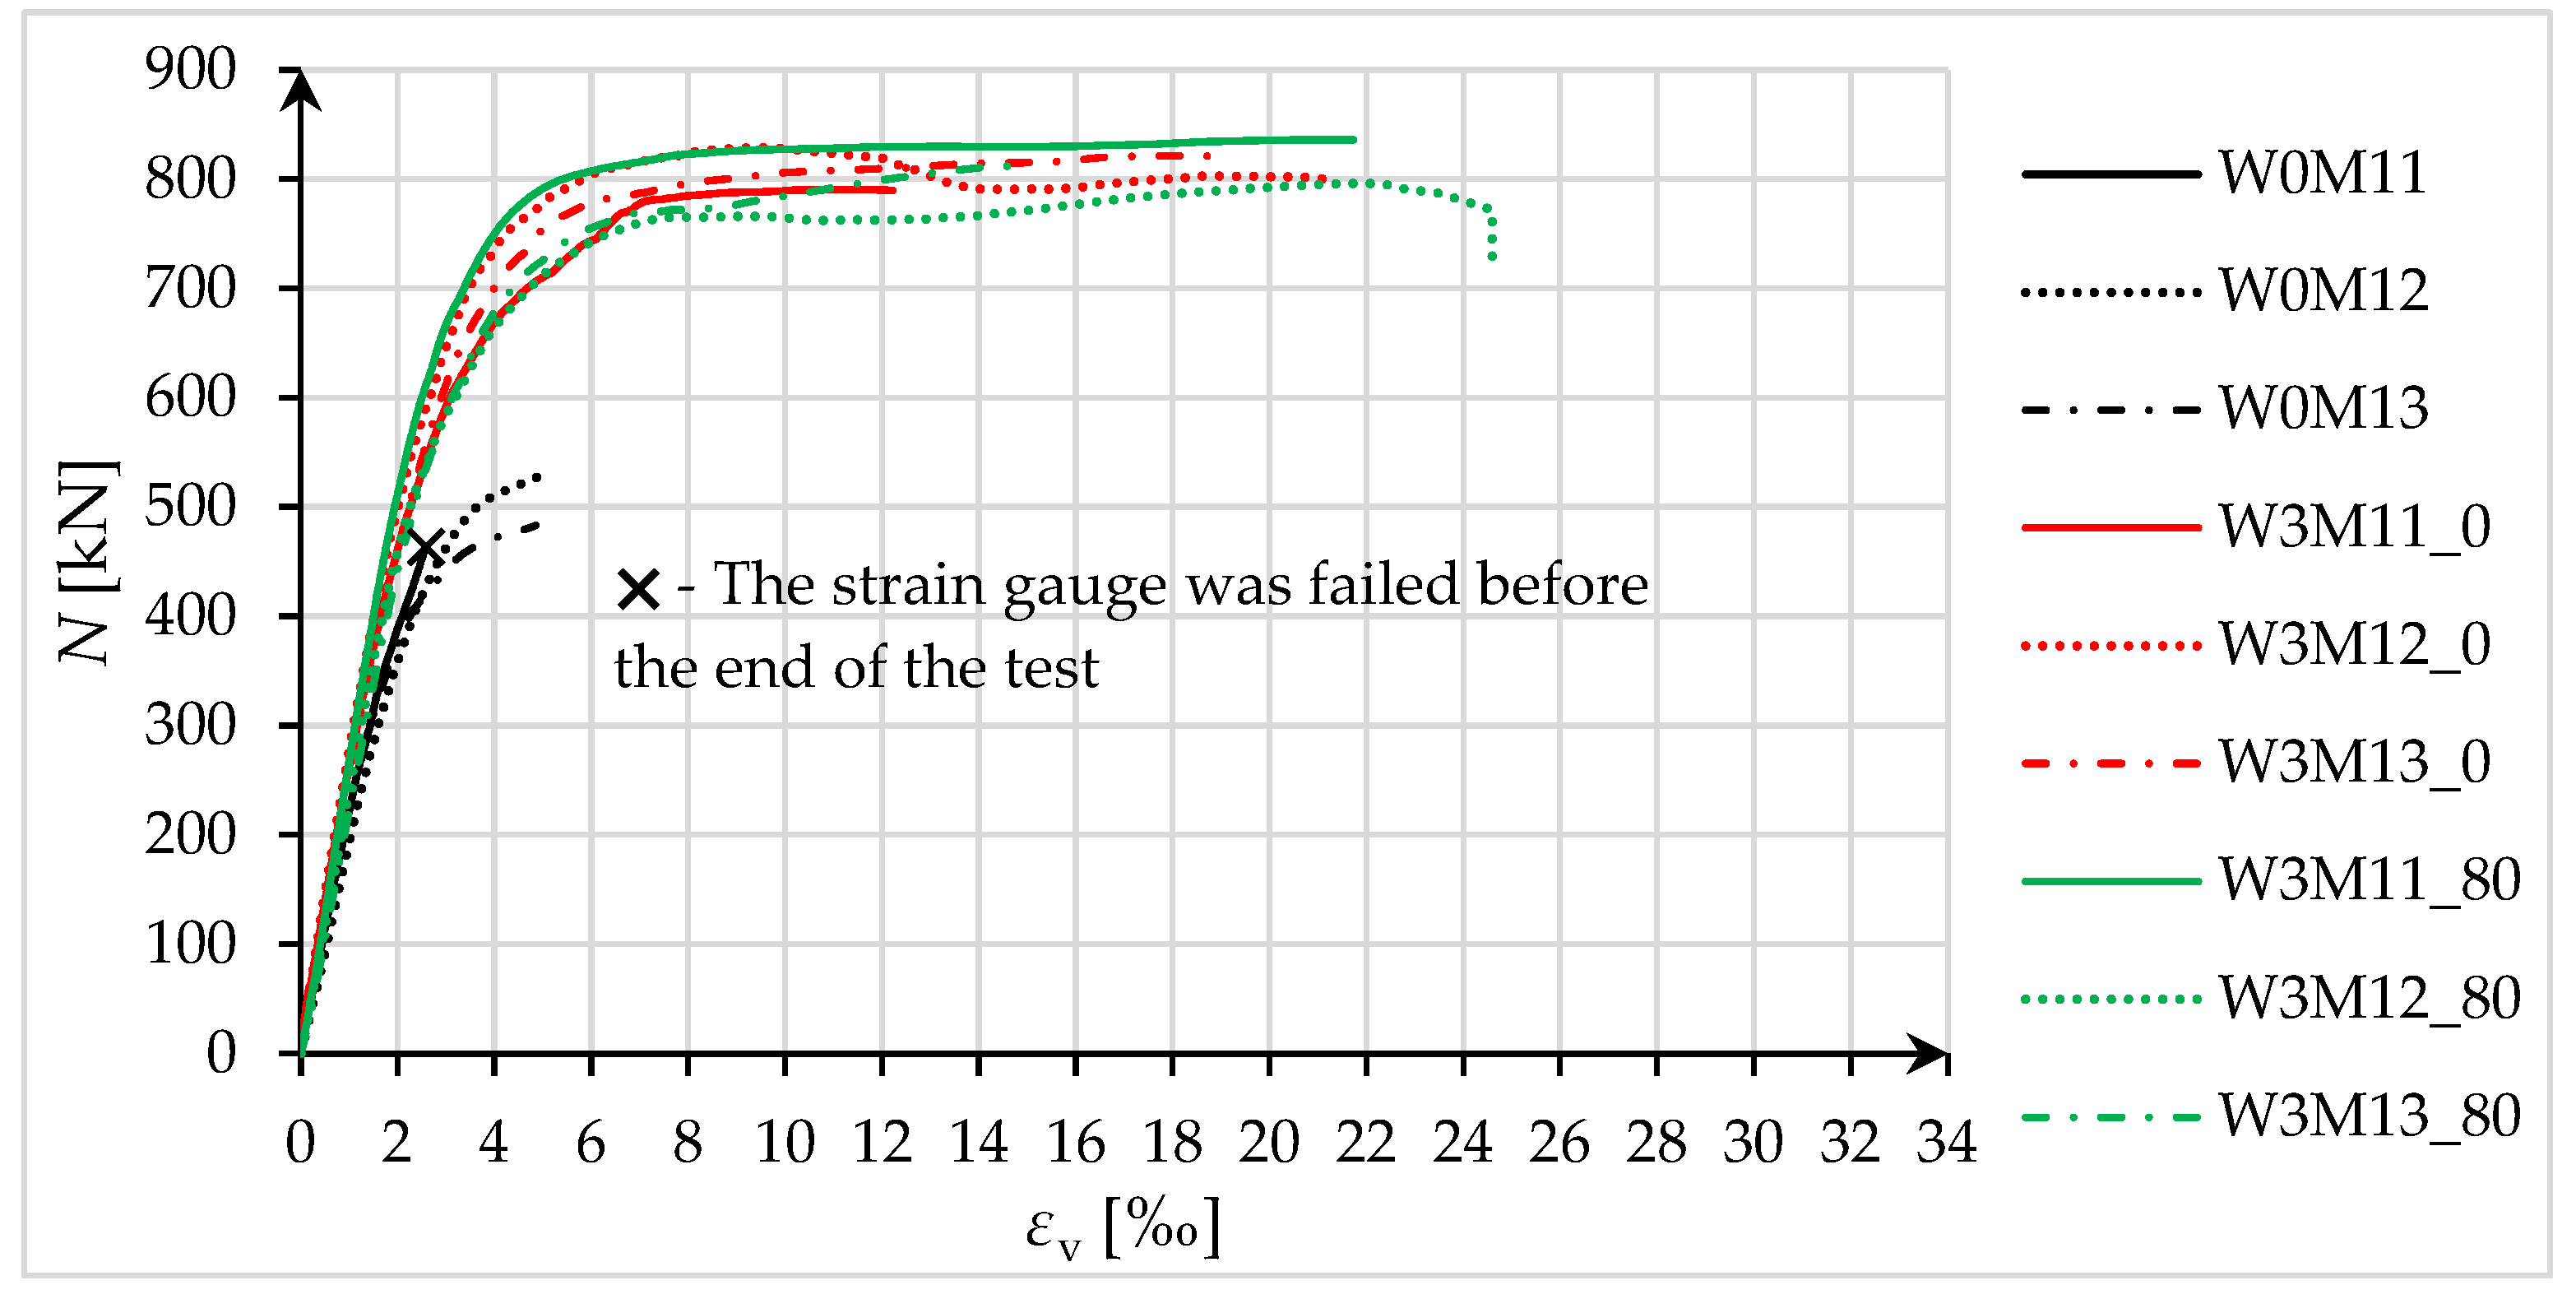
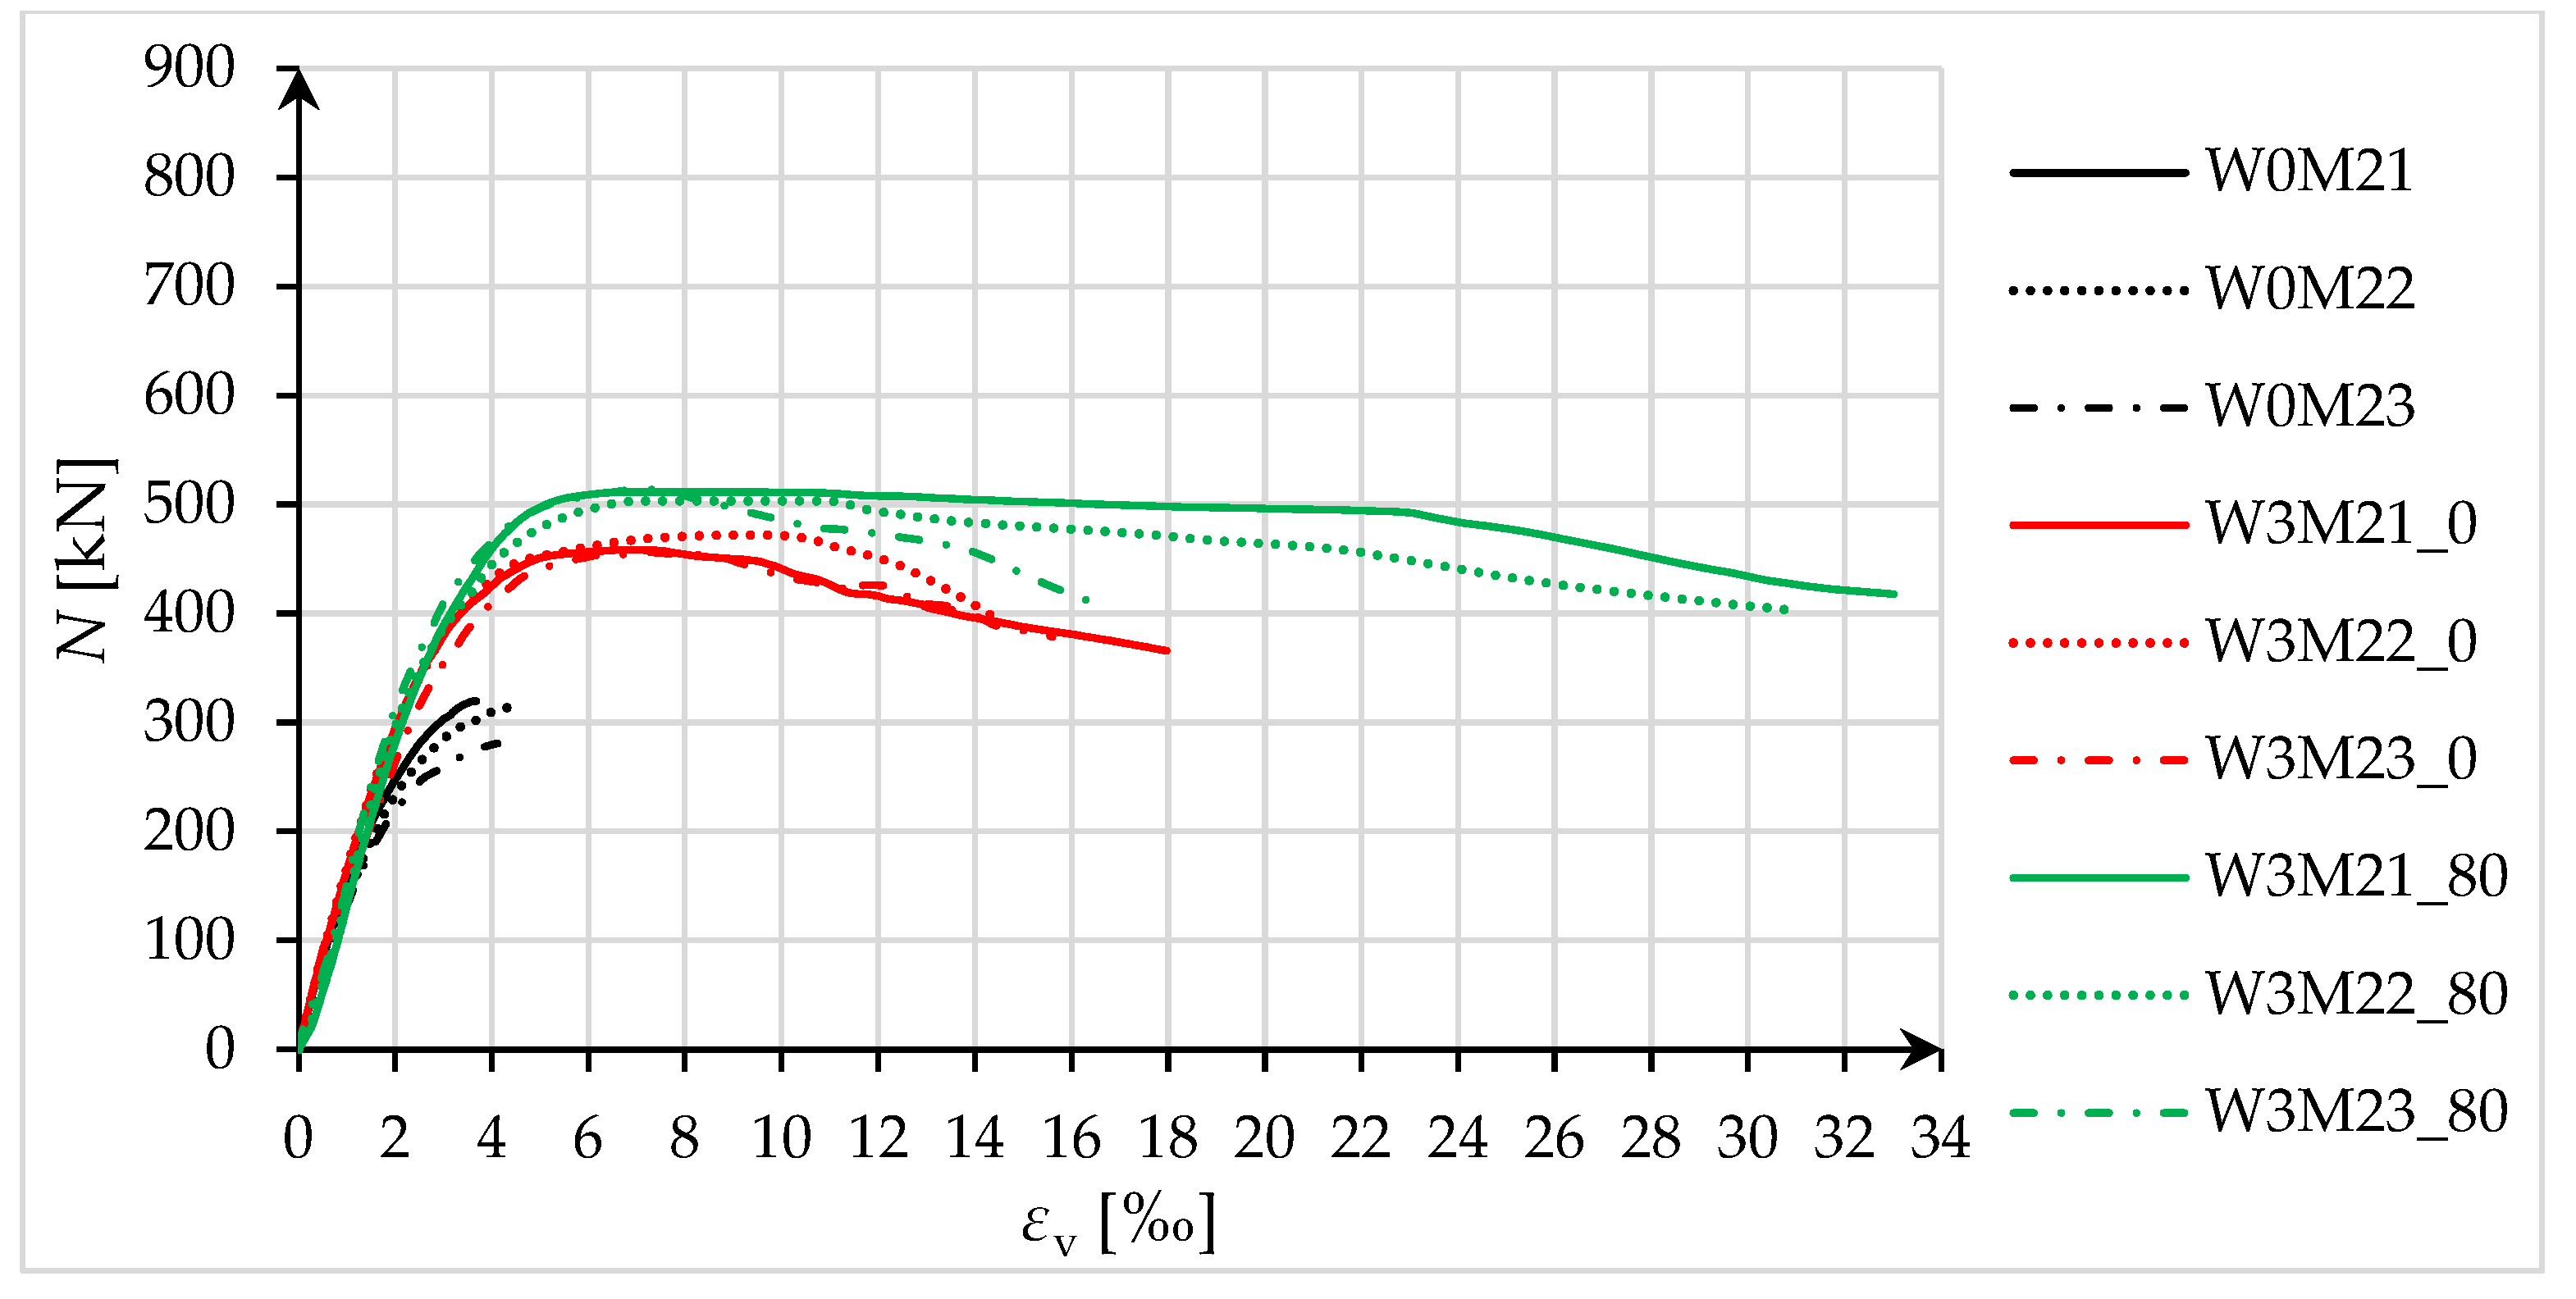
3.2.2. Eccentrically Compressed Specimens
3.3. Ductility
3.3.1. Axially Compressed Specimens
3.3.2. Eccentrically Compressed Specimens
4. Conclusions
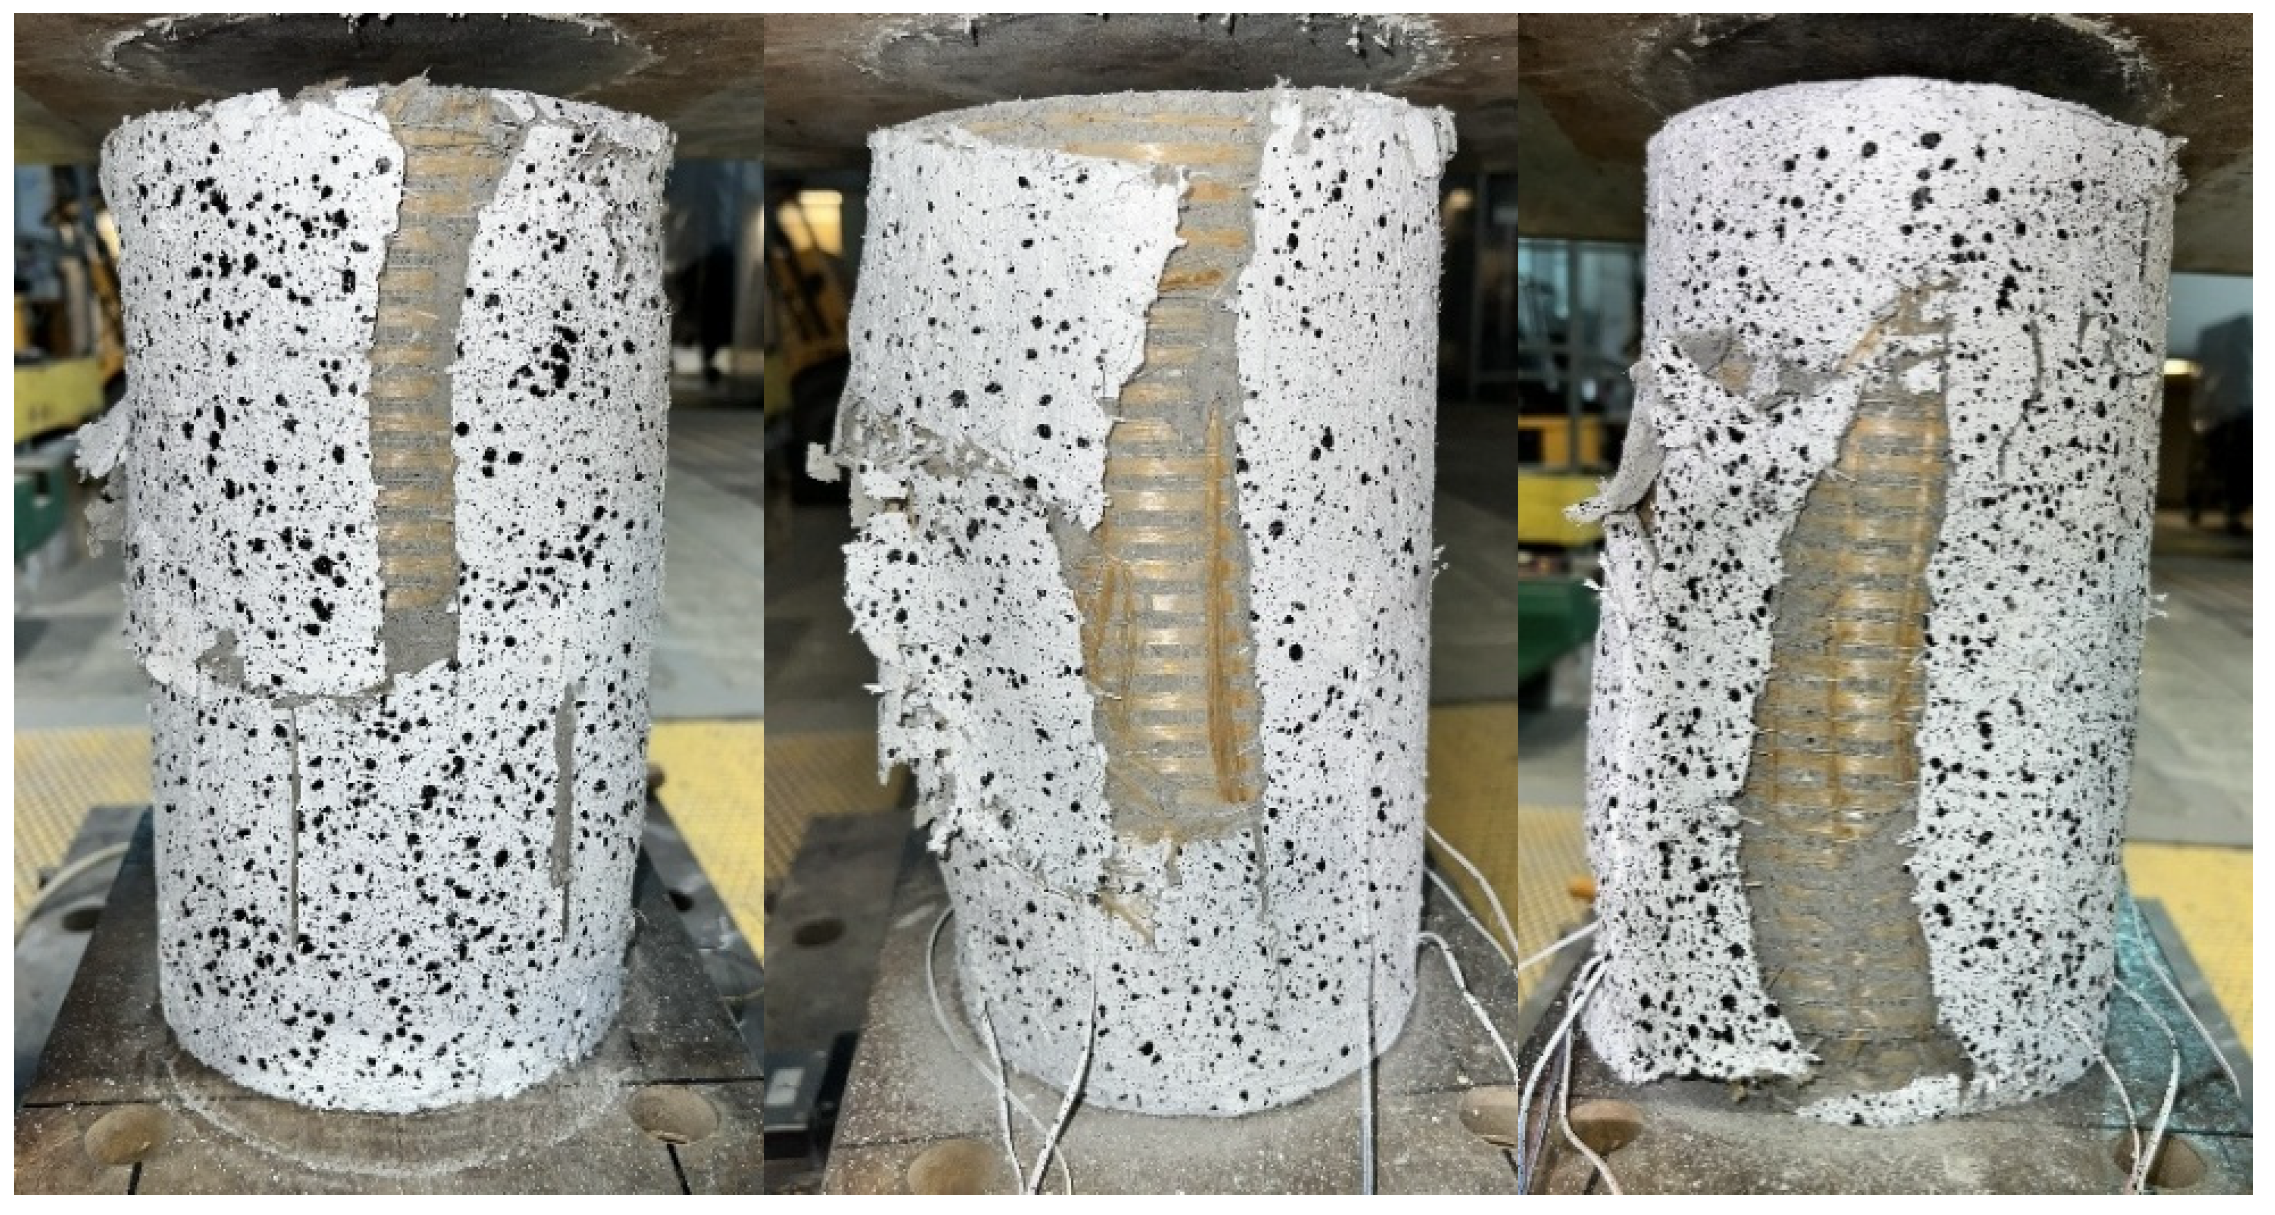
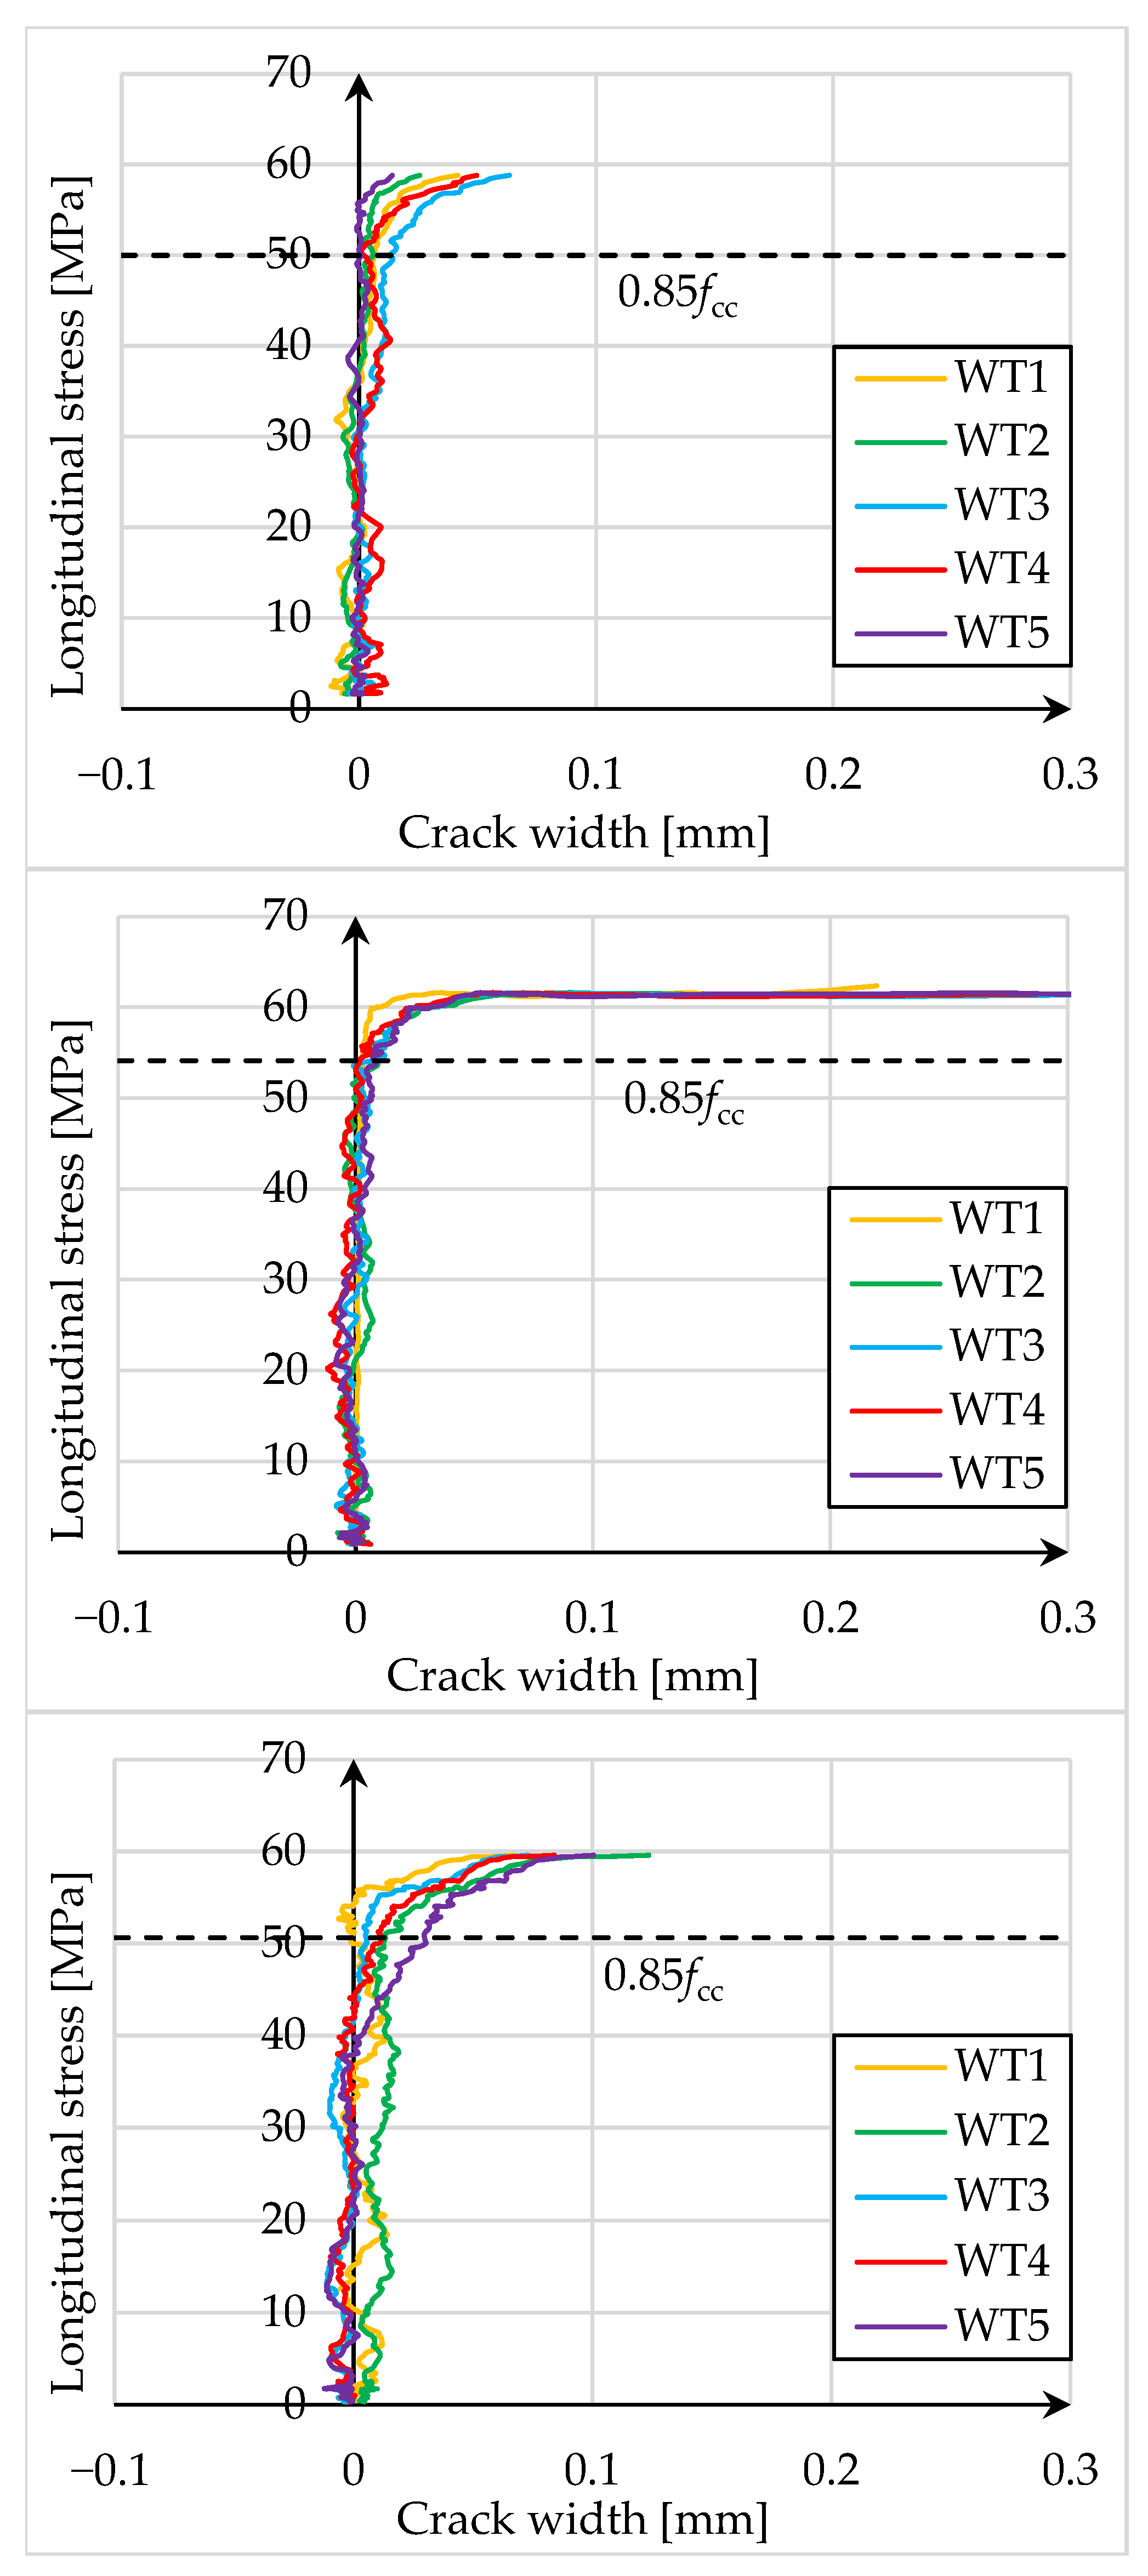
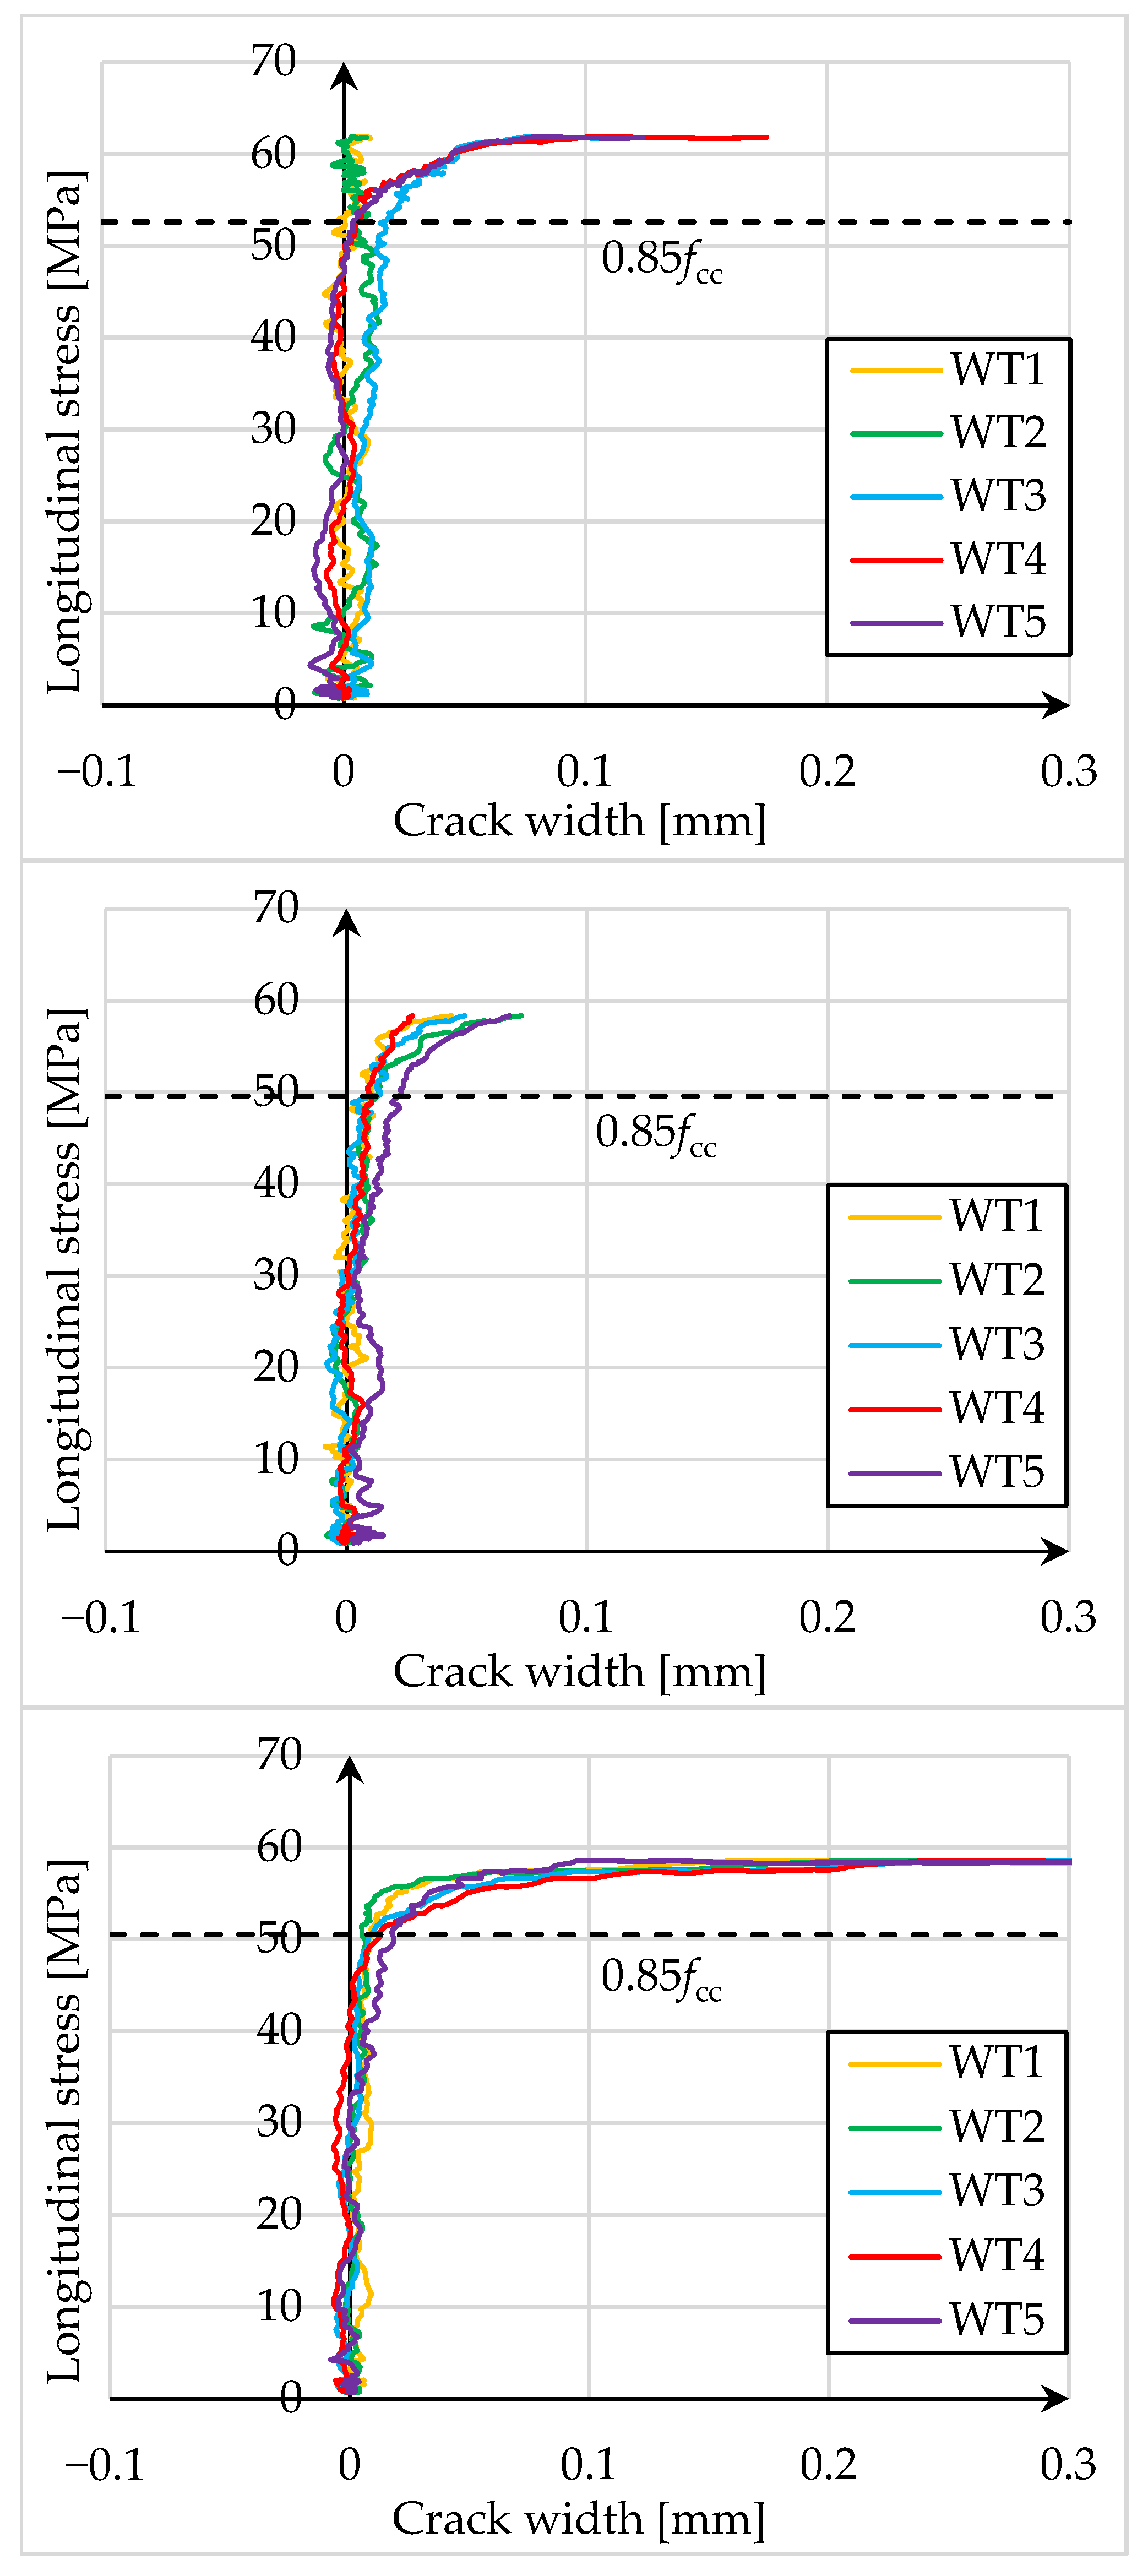
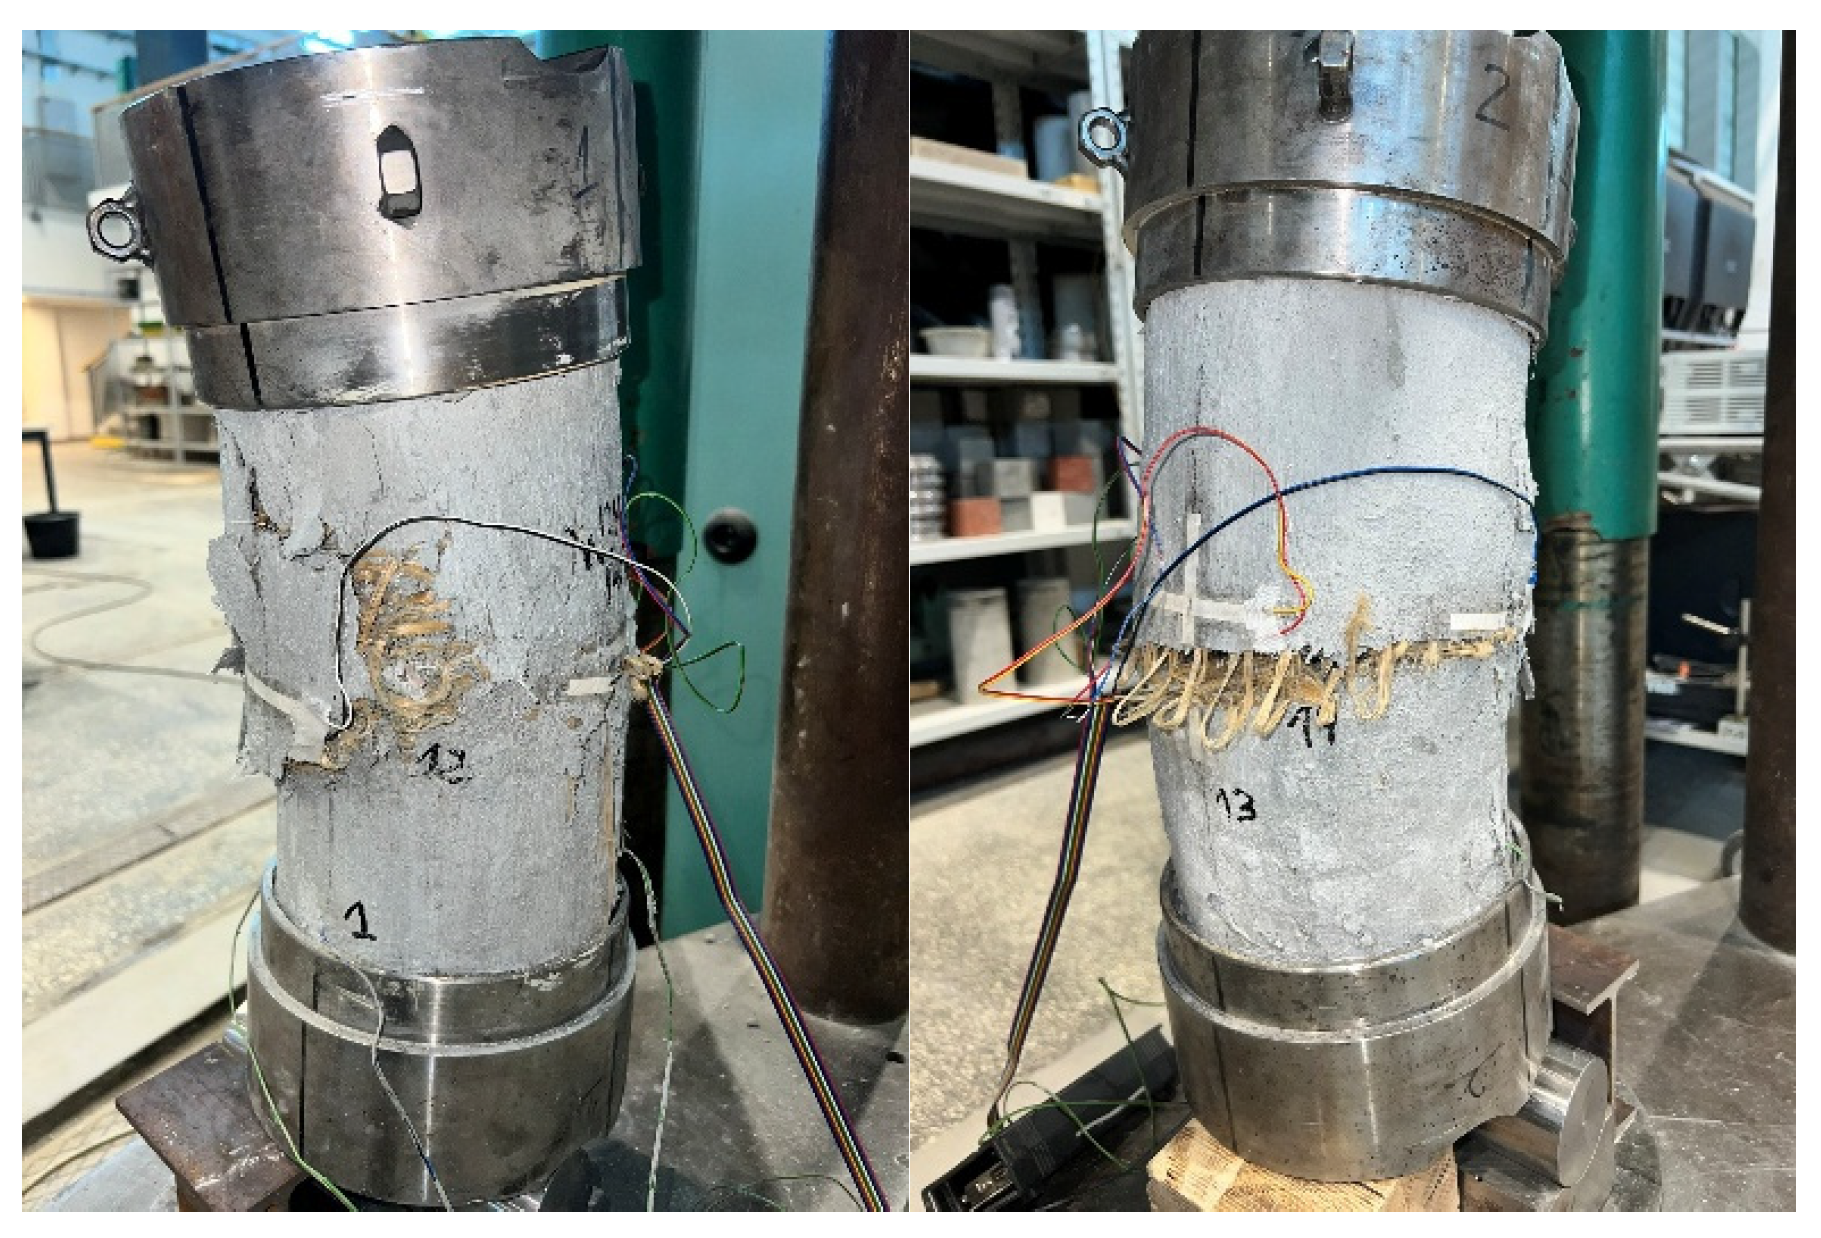
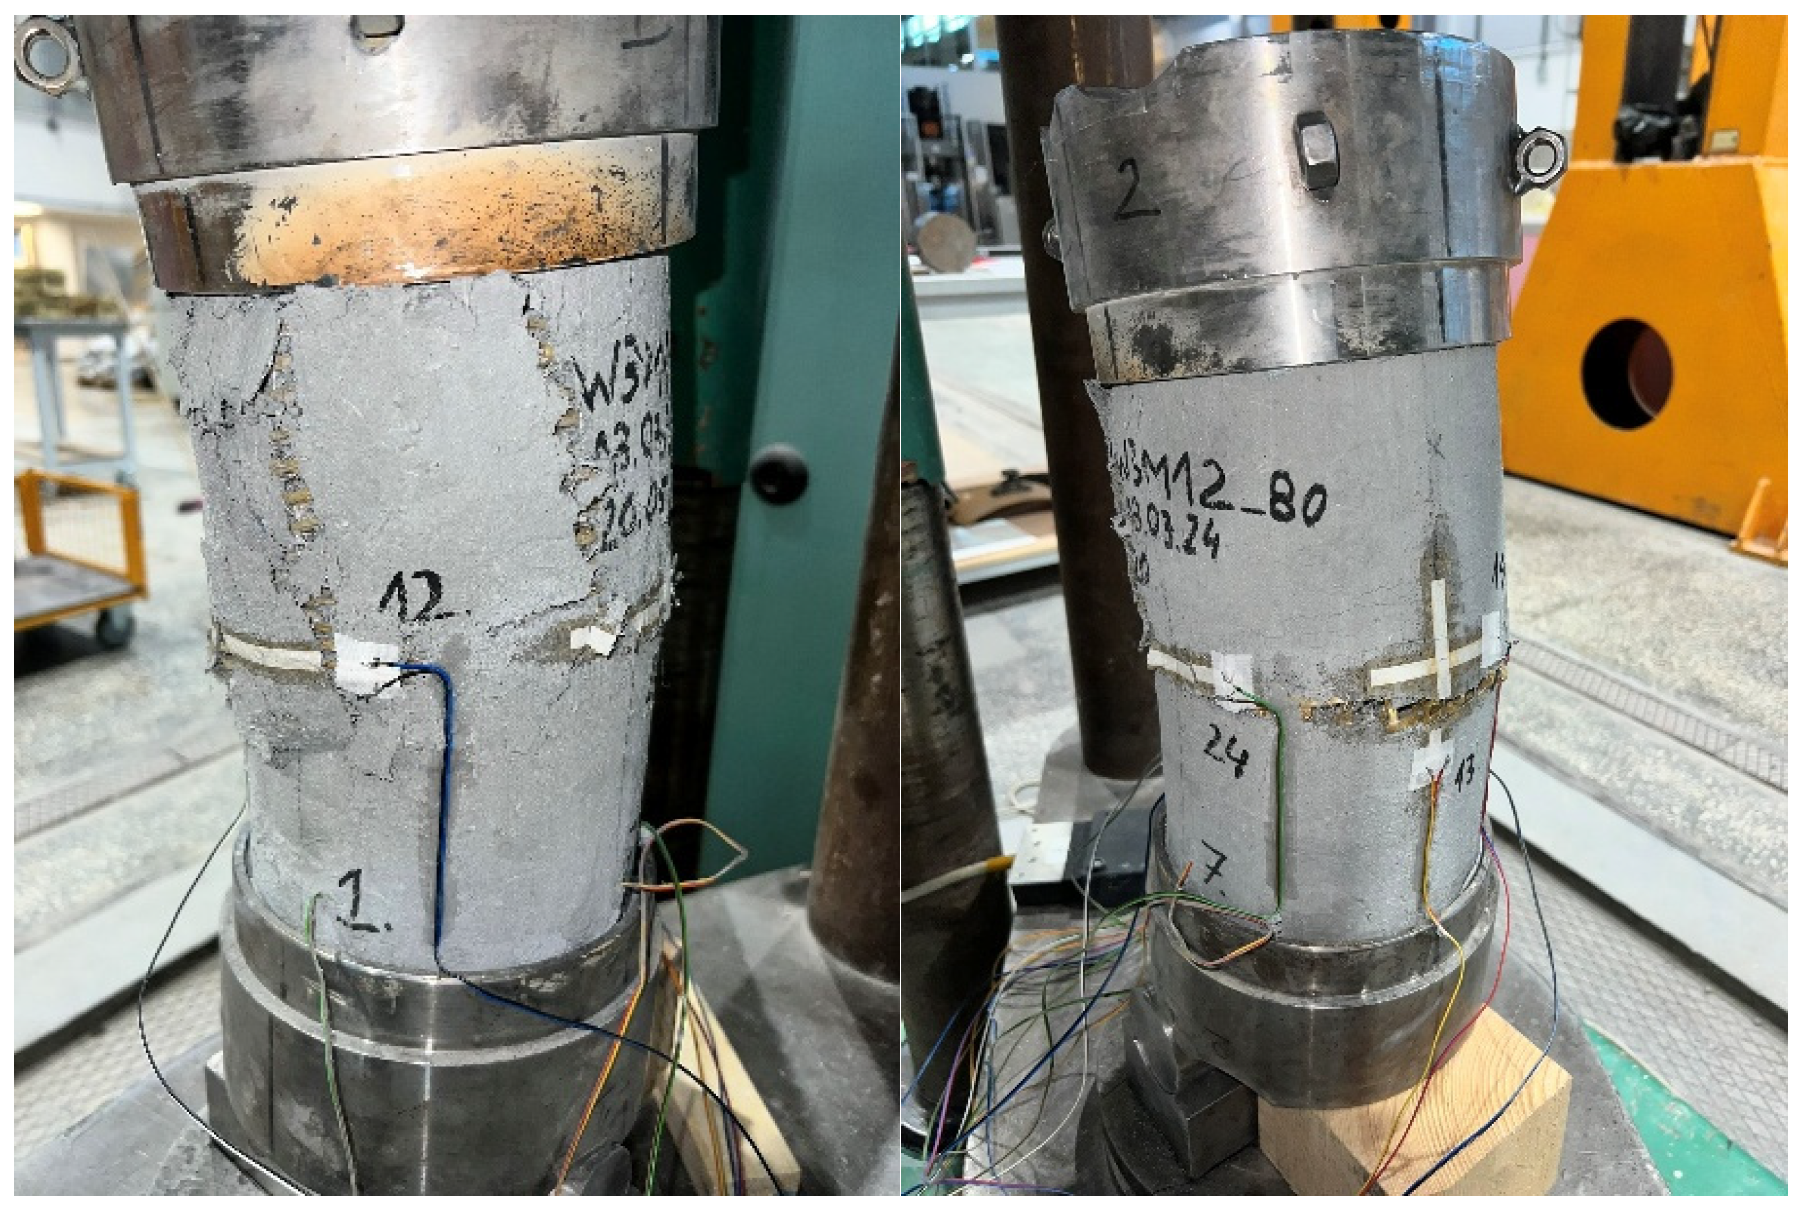
- Based on the failure modes of the axially compressed specimens (Figure 4 and Figure 5), the hoop strain maps (Figure 6 and Figure 7), and the graphs of the stress-crack width relationship, it can be concluded that no clear influence of pre-damage on the failure mechanism was observed in the conducted tests.
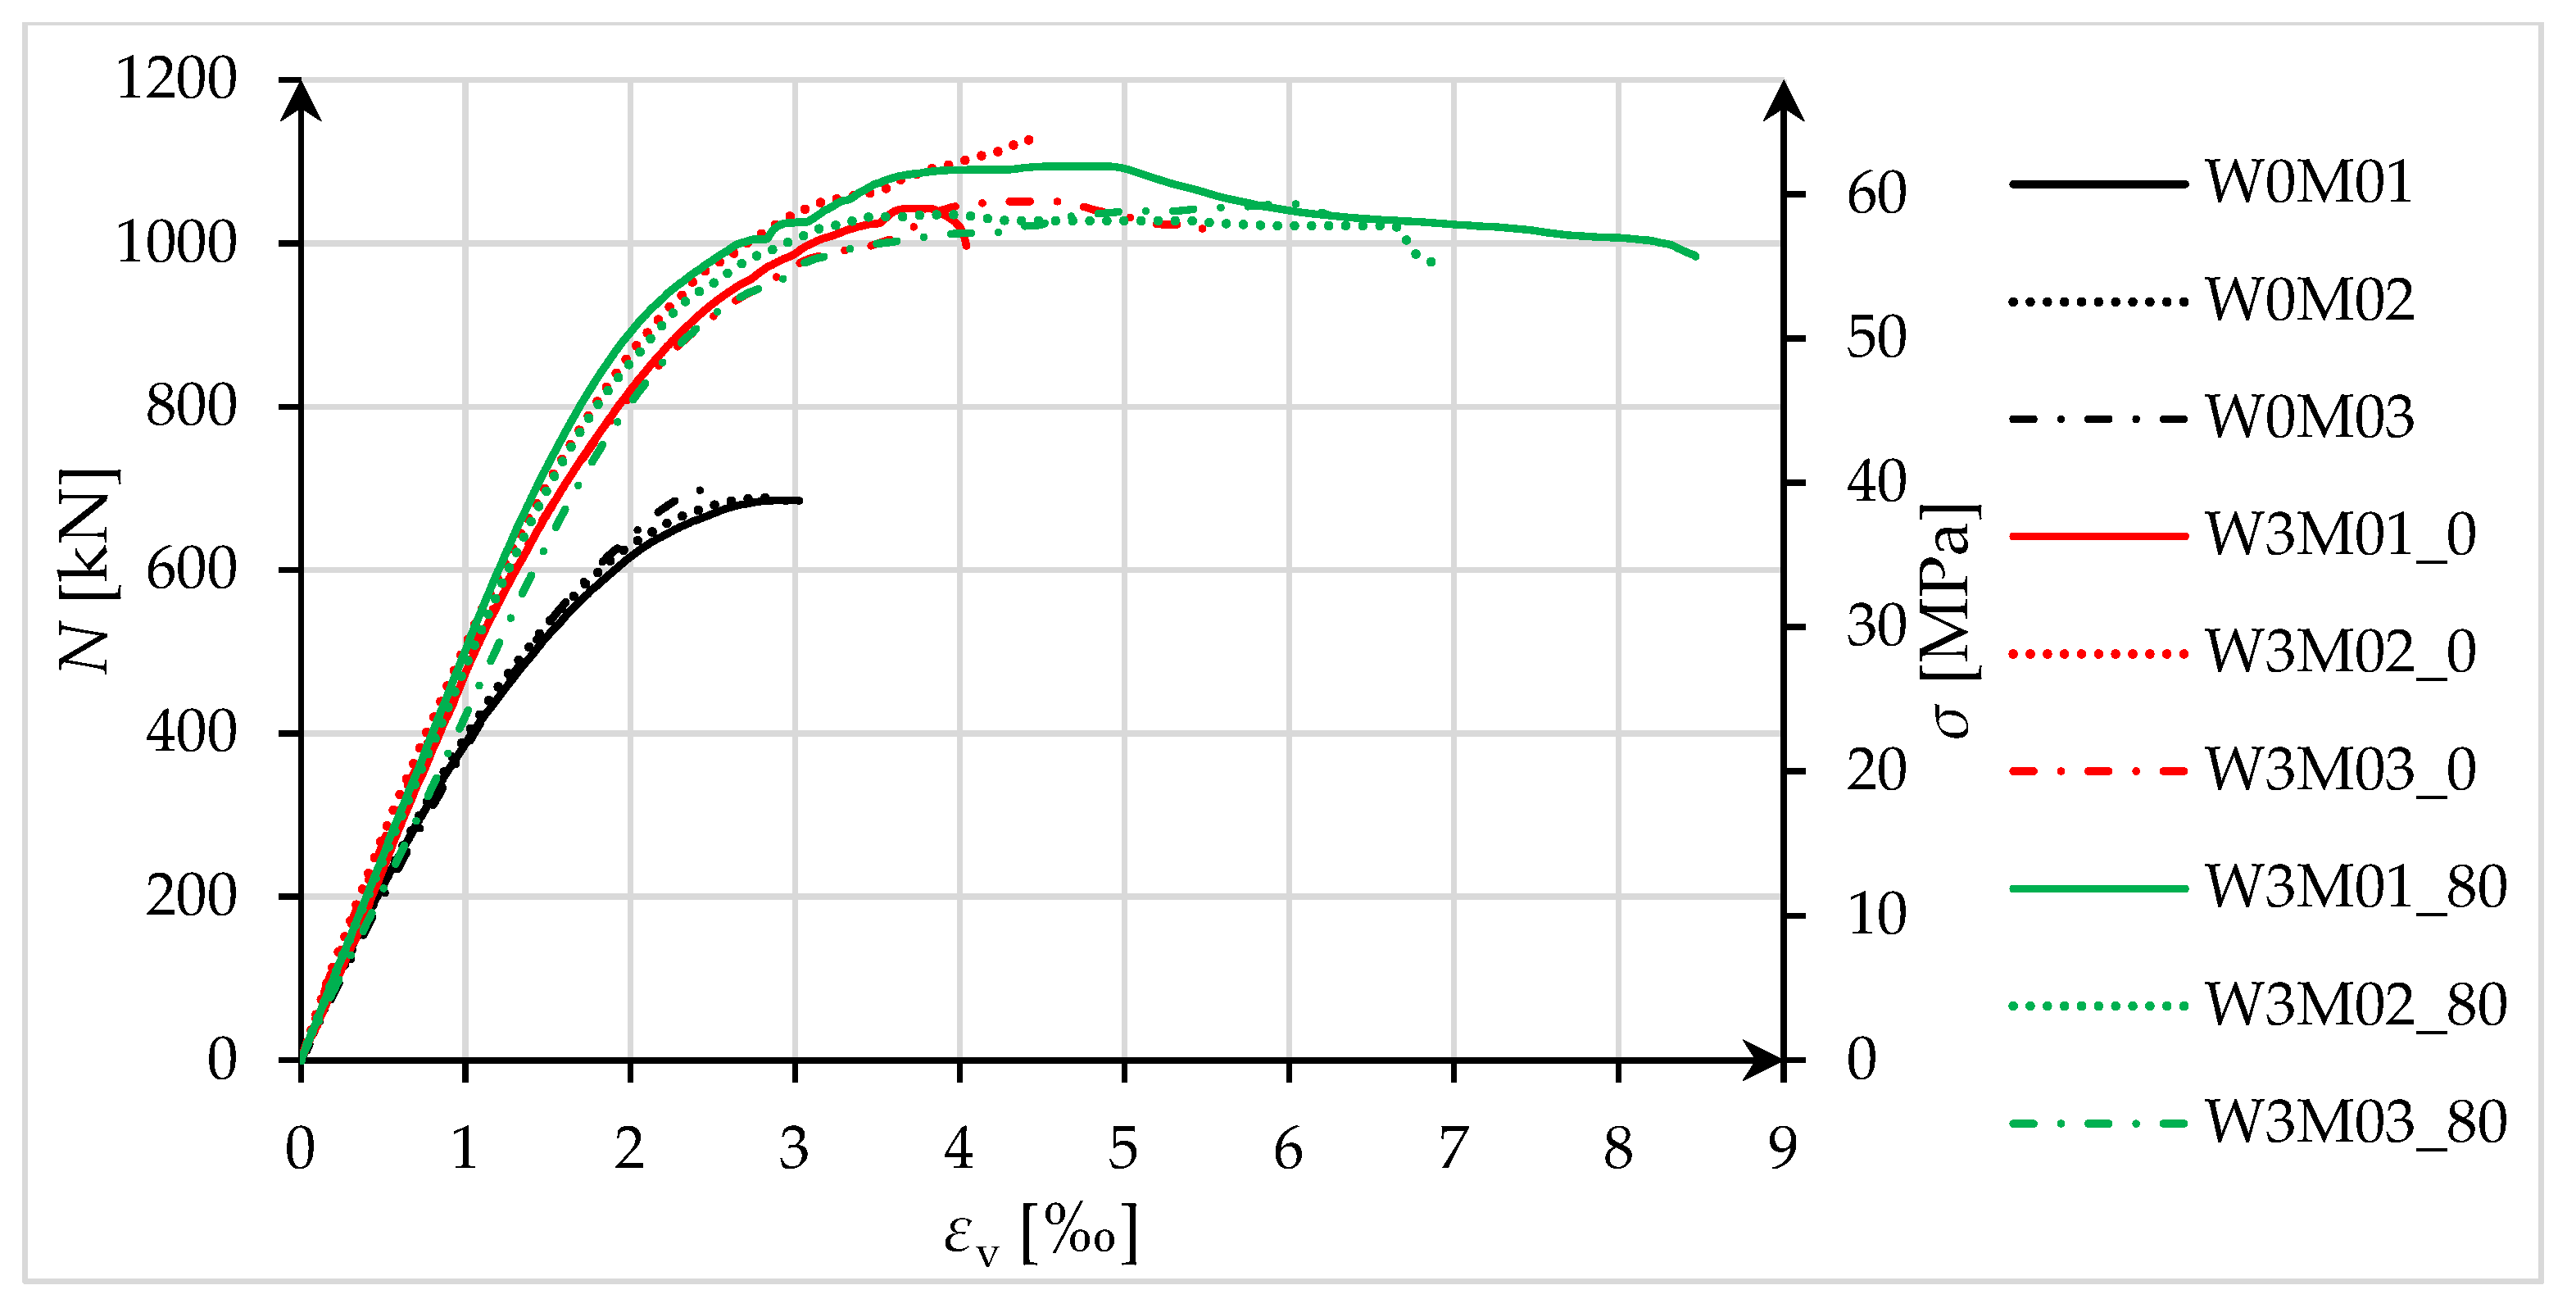
- The pre-damage effect did not affect the load-bearing capacity of axially compressed and eccentrically compressed specimens with eccentricity No. 1. However, for specimens with eccentricity No. 2, it resulted in a slight increase in load-bearing capacity.
- The longitudinal deformability was clearly higher for the pre-damaged specimens, which was most likely due to the degradation of the concrete structure. This degradation caused an increase in the transverse deformation of the concrete at the same stress level and consequently resulted in earlier activation of the strengthening system.
- There was no clear effect of pre-damage on the transverse deformability of strengthened specimens.
- Both axially and eccentrically compressed specimens subjected to pre-damage were more ductile than specimens that were not pre-damaged, which indicates a positive effect of pre-damage in this regard.
Author Contributions
Funding
Institutional Review Board Statement
Informed Consent Statement
Data Availability Statement
Acknowledgments
Conflicts of Interest
References
- Ersoy, U.; Tankut, A.T.; Suleiman, R. Behavior of jacketed columns. Struct. J. 1993, 90, 288–293. [Google Scholar] [CrossRef]
- Campione, G.; Fossetti, M.; Giacchino, C.; Minafò, G. RC columns externally strengthened with RC jackets. Mater. Struct. 2014, 47, 1715–1728. [Google Scholar] [CrossRef]
- Montuori, R.; Piluso, V. Reinforced concrete columns strengthened with angles and battens subjected to eccentric load. Eng. Struct. 2009, 31, 539–550. [Google Scholar] [CrossRef]
- Li, W.; Liang, H.; Lu, Y.; Xue, J.; Liu, Z. Axial behavior of slender RC square columns strengthened with circular steel tube and sandwiched concrete jackets. Eng. Struct. 2019, 179, 423–437. [Google Scholar] [CrossRef]
- Trapko, T. The effect of high temperature on the performance of CFRP and FRCM confined concrete elements. Compos. Part B Eng. 2013, 54, 138–145. [Google Scholar] [CrossRef]
- Ombres, L. Structural performances of thermally conditioned PBO FRCM confined concrete cylinders. Compos. Struct. 2017, 176, 1096–1106. [Google Scholar] [CrossRef]
- Ombres, L.; Mazzuca, P.; Verre, S. Effects of thermal conditioning at high temperatures on the response of concrete elements confined with a PBO-FRCM composite system. J. Mater. Civ. Eng. 2022, 34, 04021413. [Google Scholar] [CrossRef]
- Trapko, T. Fibre reinforced cementitious matrix confined concrete elements. Mater. Des. 2013, 44, 382–391. [Google Scholar] [CrossRef]
- Trapko, T. Confined concrete elements with PBO-FRCM composites. Constr. Build. Mater. 2014, 73, 332–338. [Google Scholar] [CrossRef]
- Ombres, L. Concrete confinement with a cement based high strength composite material. Compos. Struct. 2014, 109, 294–304. [Google Scholar] [CrossRef]
- Faleschini, F.; Zanini, M.A.; Hofer, L.; Pellegrino, C. Experimental behavior of reinforced concrete columns confined with carbon-FRCM composites. Constr. Build. Mater. 2020, 243, 118296. [Google Scholar] [CrossRef]
- Khalaf, S.; Abed, F.; El Refai, A.; Roshan, N.; Hajiloo, H. Circular RC columns Wrapped with PBO-FRCM and CFRP Strengthening Systems in a Standard Fire. Fire Saf. J. 2025, 155, 104424. [Google Scholar] [CrossRef]
- Trapko, T. Behaviour of fibre reinforced cementitious matrix strengthened concrete columns under eccentric compression loading. Mater. Des. 2014, 54, 947–954. [Google Scholar] [CrossRef]
- Trapko, T. Effect of eccentric compression loading on the strains of FRCM confined concrete columns. Constr. Build. Mater. 2014, 61, 97–105. [Google Scholar] [CrossRef]
- Ombres, L.; Verre, S. Structural behaviour of fabric reinforced cementitious matrix (FRCM) strengthened concrete columns under eccentric loading. Compos. Part B Eng. 2015, 75, 235–249. [Google Scholar] [CrossRef]
- Csuka, B.; Kollár, L.P. Analysis of FRP confined columns under eccentric loading. Compos. Struct. 2012, 94, 1106–1116. [Google Scholar] [CrossRef]
- Bisby, L.; Ranger, M. Axial–flexural interaction in circular FRP-confined reinforced concrete columns. Constr. Build. Mater. 2010, 24, 1672–1681. [Google Scholar] [CrossRef]
- Lin, G.; Teng, J.G. Three-dimensional finite-element analysis of FRP-confined circular concrete columns under eccentric loading. J. Compos. Constr. 2017, 21, 04017003. [Google Scholar] [CrossRef]
- Micelli, F.; Cascardi, A.; Aiello, M.A. Pre-load effect on CFRP-confinement of concrete columns: Experimental and theoretical study. Crystals 2021, 11, 177. [Google Scholar] [CrossRef]
- Tello, N.; Abed, F.; ElRefai, A.; El-Maaddawy, T.; Alhoubi, Y. Experimental investigation of pre-damaged circular RC columns strengthened with fabric-reinforced cementitious matrix (FRCM). Struct. Concr. 2023, 24, 1656–1669. [Google Scholar] [CrossRef]
- Alhoubi, Y.; El Refai, A.; Abed, F.; El-Maaddawy, T.; Tello, N. Strengthening pre-damaged RC square columns with fabric-reinforced cementitious matrix (FRCM): Experimental investigation. Compos. Struct. 2022, 294, 115784. [Google Scholar] [CrossRef]
- Pazdan, M.; Trapko, T.; Musiał, M. Nośność i odkształcalność ściskanych mimośrodowo elementów betonowych wzmocnionych kompozytami PBO-FRCM. Mater. Bud. 2024, 11, 1–9. [Google Scholar] [CrossRef]
- Ruregold PBO-MESH 70/18 Data Sheet. Available online: https://ruregold.com/en/product/pbo-mesh-70-18/ (accessed on 30 April 2025).

| Component | Amount (kg/m3) |
|---|---|
| CEM II 32.5R | 404 |
| Sand 0–2 mm | 627 |
| Gravel 2–8 mm | 537 |
| Gravel 8–16 mm | 627 |
| Water | 175 |
| Parameter | Value |
|---|---|
| PBO-MESH 70/18 | |
| Tensile strength of fibers (MPa) | 5800 |
| Young’s modulus of fibers (GPa) | 270 |
| Ultimate strain for fibers (%) | 2.5 |
| Equivalent thickness of mesh in warp (mm) | 0.045 |
| Equivalent thickness of mesh in weft (mm) | 0.012 |
| MX-PBO Concrete | |
| Compressive strength after 28 days (MPa) | ≥40 |
| Flexural tensile strength after 28 days (MPa) | ≥4 |
| Young’s modulus after 28 days (GPa) | ≥15 |
| Type of Specimen | Designation | Strain Gauges Arrangement | |
|---|---|---|---|
| Under the composite | On the composite | ||
| Axially compressed, unconfined | W0M0n | 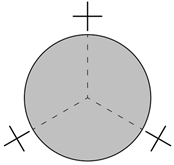 | N/A |
| Axially compressed, confined | W3M0n | 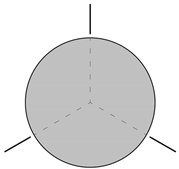 | 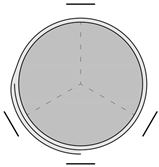 |
| Eccentrically compressed, unconfined | W0M1n 1/W0M2n 2 | 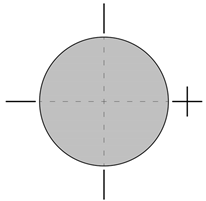 | N/A |
| Eccentrically compressed, confined | W3M1n 1/W3M2n 2 |  | 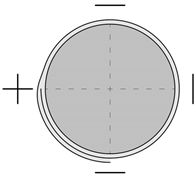 |
| Specimen | Ncc (kN) | Mcc (kNm) | fcc (MPa) | Ncc/Nc0m (-) | εcc (‰) | εcc/εc0m (-) | εccu (‰) | εfl (‰) | C (-) |
|---|---|---|---|---|---|---|---|---|---|
| W0M01 | 685.26 | 0 | 38.78 | N/A | 2.943 | N/A | 3.026 | N/A | N/A |
| W0M02 | 688.46 | 0 | 38.96 | N/A | 2.830 | N/A | 2.903 | N/A | N/A |
| W0M03 | 699.12 | 0 | 39.56 | N/A | 2.459 | N/A | 2.459 | N/A | N/A |
| W3M01_0 | 1042.52 | 0 | 58.99 | 1.51 | 3.789 | 1.38 | 4.039 | 3.465 | 0.94 |
| W3M02_0 | 1126.58 | 0 | 63.75 | 1.63 | 4.422 | 1.61 | 4.422 | - | 1.07 |
| W3M03_0 | 1051.39 | 0 | 59.50 | 1.52 | 4.579 | 1.67 | 5.489 | 4.858 | 1.21 |
| W3M01_80 | 1094.33 | 0 | 61.93 | 1.58 | 4.852 | 1.77 | 8.465 | 4.758 | 1.28 |
| W3M02_80 | 1034.88 | 0 | 58.56 | 1.50 | 3.919 | 1.43 | 6.928 | 4.376 | 1.03 |
| W3M03_80 | 1048.36 | 0 | 59.32 | 1.52 | 6.037 | 2.20 | 6.240 | - | 1.72 |
| W0M11 | 557.30 | 10.45 | N/A | N/A | - | N/A | - | N/A | N/A |
| W0M12 | 532.48 | 9.98 | N/A | N/A | 5.170 | N/A | 5.170 | N/A | N/A |
| W0M13 | 483.18 | 9.06 | N/A | N/A | 4.849 | N/A | 4.849 | N/A | N/A |
| W3M11_0 | 790.39 | 14.82 | N/A | 1.51 | 11.471 | 2.29 | 12.219 | 13.043 | 1.81 |
| W3M12_0 | 828.65 | 15.54 | N/A | 1.58 | 9.781 | 1.95 | 21.156 | 4.714 | 1.44 |
| W3M13_0 | 821.12 | 15.40 | N/A | 1.57 | 18.294 | 3.65 | 18.861 | 12.258 | 2.98 |
| W3M11_80 | 835.98 | 15.67 | N/A | 1.59 | 21.728 | 4.34 | 21.728 | - | 3.60 |
| W3M12_80 | 796.09 | 14.93 | N/A | 1.52 | 21.793 | 4.35 | 24.596 | - | 3.68 |
| W3M13_80 | 811.76 | 15.22 | N/A | 1.55 | 14.734 | 2.94 | 15.091 | - | 2.30 |
| W0M21 | 319.66 | 11.99 | N/A | N/A | 3.678 | N/A | 3.678 | N/A | N/A |
| W0M22 | 313.83 | 11.77 | N/A | N/A | 4.401 | N/A | 4.401 | N/A | N/A |
| W0M23 | 280.77 | 10.53 | N/A | N/A | 4.117 | N/A | 4.117 | N/A | N/A |
| W3M21_0 | 458.49 | 17.19 | N/A | 1.50 | 6.827 | 1.68 | 17.963 | 4.002 | 1.23 |
| W3M22_0 | 471.99 | 17.70 | N/A | 1.55 | 9.309 | 2.29 | 14.445 | 6.641 | 1.75 |
| W3M23_0 | 455.94 | 17.10 | N/A | 1.50 | 7.253 | 1.78 | 15.599 | 3.216 | 1.29 |
| W3M21_80 | 511.47 | 19.18 | N/A | 1.68 | 8.640 | 2.13 | 33.018 | 4.796 | 1.43 |
| W3M22_80 | 503.14 | 18.87 | N/A | 1.65 | 10.440 | 2.57 | 30.964 | 5.641 | 1.85 |
| W3M23_80 | 513.76 | 19.27 | N/A | 1.69 | 7.239 | 1.78 | 16.361 | 3.990 | 1.15 |
| Specimen | UT (J/m) | fcc (MPa) | Ncc (kN) | C (-) | εccu/εcc (-) |
|---|---|---|---|---|---|
| W0M01 | 1344.94 | 38.78 | 685.26 | N/A | 1.03 |
| W0M02 | 1291.00 | 38.96 | 688.46 | N/A | 1.03 |
| W0M03 | 1032.80 | 39.56 | 699.12 | N/A | 1.00 |
| Avg. | 1222.92 | 690.95 | 1.02 | ||
| W3M01_0 | 2619.62 | 58.99 | 1042.52 | 0.94 | 1.07 |
| W3M02_0 | 3468.34 | 63.75 | 1126.58 | 1.07 | 1.00 |
| W3M03_0 | 3439.68 | 59.50 | 1051.39 | 1.21 | 1.20 |
| Avg. | 1.07 | 1.09 | |||
| W3M01_80 | 3937.83 | 61.93 | 1094.33 | 1.28 | 1.74 |
| W3M02_80 | 2821.17 | 58.56 | 1034.88 | 1.03 | 1.77 |
| W3M03_80 | 4841.74 | 59.32 | 1048.36 | 1.72 | 1.03 |
| Avg. | 1.34 | 1.52 |
| Specimen | UT (J/m) | Ncc (kN) | C (-) | εccu/εcc (-) |
|---|---|---|---|---|
| W0M11 | - | 557.30 | N/A | - |
| W0M12 | 1892.41 | 532.48 | N/A | 1.00 |
| W0M13 | 1699.81 | 483.18 | N/A | 1.00 |
| Avg. | 1796.11 | 524.32 | 1.00 | |
| W3M11_0 | 7368.26 | 790.39 | 1.81 | 1.07 |
| W3M12_0 | 6466.39 | 828.65 | 1.44 | 2.16 |
| W3M13_0 | 13,108.11 | 821.12 | 2.98 | 1.03 |
| Avg. | 2.07 | 1.42 | ||
| W3M11_80 | 16,438.16 | 835.98 | 3.60 | 1.00 |
| W3M12_80 | 15,253.00 | 796.09 | 3.68 | 1.13 |
| W3M13_80 | 9921.10 | 811.76 | 2.30 | 1.02 |
| Avg. | 3.20 | 1.05 |
| Specimen | UT (J/m) | Ncc (kN) | C (-) | εccu/εcc (-) |
|---|---|---|---|---|
| W0M21 | 774.37 | 319.66 | N/A | 1.00 |
| W0M22 | 944.51 | 313.83 | N/A | 1.00 |
| W0M23 | 794.94 | 280.77 | N/A | 1.00 |
| Avg. | 837.94 | 304.76 | 1.00 | |
| W3M21_0 | 2336.39 | 458.49 | 1.23 | 2.63 |
| W3M22_0 | 3521.35 | 471.99 | 1.75 | 1.55 |
| W3M23_0 | 2420.72 | 455.94 | 1.29 | 2.15 |
| Avg. | 1.42 | 2.11 | ||
| W3M21_80 | 3364.59 | 511.47 | 1.43 | 3.82 |
| W3M22_80 | 4225.10 | 503.14 | 1.85 | 2.97 |
| W3M23_80 | 2733.42 | 513.76 | 1.15 | 2.26 |
| Avg. | 1.47 | 3.02 |
Disclaimer/Publisher’s Note: The statements, opinions and data contained in all publications are solely those of the individual author(s) and contributor(s) and not of MDPI and/or the editor(s). MDPI and/or the editor(s) disclaim responsibility for any injury to people or property resulting from any ideas, methods, instructions or products referred to in the content. |
© 2025 by the authors. Licensee MDPI, Basel, Switzerland. This article is an open access article distributed under the terms and conditions of the Creative Commons Attribution (CC BY) license (https://creativecommons.org/licenses/by/4.0/).
Share and Cite
Pazdan, M.; Trapko, T.; Musiał, M. Effect of Pre-Damage on the Behavior of Axially and Eccentrically Compressed Concrete Cylinders Confined with PBO-FRCM. Materials 2025, 18, 2881. https://doi.org/10.3390/ma18122881
Pazdan M, Trapko T, Musiał M. Effect of Pre-Damage on the Behavior of Axially and Eccentrically Compressed Concrete Cylinders Confined with PBO-FRCM. Materials. 2025; 18(12):2881. https://doi.org/10.3390/ma18122881
Chicago/Turabian StylePazdan, Maciej, Tomasz Trapko, and Michał Musiał. 2025. "Effect of Pre-Damage on the Behavior of Axially and Eccentrically Compressed Concrete Cylinders Confined with PBO-FRCM" Materials 18, no. 12: 2881. https://doi.org/10.3390/ma18122881
APA StylePazdan, M., Trapko, T., & Musiał, M. (2025). Effect of Pre-Damage on the Behavior of Axially and Eccentrically Compressed Concrete Cylinders Confined with PBO-FRCM. Materials, 18(12), 2881. https://doi.org/10.3390/ma18122881