Abstract
Aggregate–asphalt adhesion plays an important role in the water stability of asphalt concrete. In various test standards of different countries, it is evaluated via the subjective judgment of testers using the boiling water test. The subjective judgment in the test method is detrimental to the accuracy of the adhesion evaluation. However, there is no quantitative evaluation method for the aggregate–asphalt adhesion in existing studies. Moreover, the effects of aggregate shape on adhesion are also not discussed and stipulated. Hence, an innovative method based on the Chinese boiling water test and image processing technique is put forward to quantificationally evaluate the aggregate–asphalt adhesion. Moreover, the effects of aggregate shapes on adhesion are also investigated via the proposed method from a view of aspect ratio and homogeneity. Results show that the peeling of the asphalt membrane on the aggregate surface is more serious as the complexity of the aggregate shape increases after the boiling water tests, while the effect degree gradually decreases. The effect of aspect ratio on the peeling status of asphalt membrane is lower than that of aggregate homogeneity.
1. Introduction
Pavement diseases greatly influence the use quality, passenger comfort, and traffic safety of pavement structures. The inspection of raw materials before pavement construction can significantly control the occurrence of pavement diseases [1]. Potholes are one of the main diseases in asphalt pavement at present, resulting from a lack of water stability of asphalt concrete [2]. The water stability of asphalt concrete mainly depends on the adhesion between aggregates and asphalt binders [3]. In order to ensure the water stability of asphalt concrete, the adhesion between aggregates and asphalt binders is a required inspection in the standards of different countries. Table 1, Table 2 and Table 3 illustrate the adhesion evaluation method, namely the boiling water test, in the Chinese test standard [4] and the ASTM test standard [5], respectively.

Table 1.
Testing method of the adhesion in the Chinese test standard.
Table 2.
Evaluation method of the adhesion in the Chinese test standard.
Table 3.
Testing method of the adhesion in the ASTM test standard.
As shown in Table 1, Table 2 and Table 3, it can be found that there is only standard practice of the boiling water test in the ASTM test standard, while there is no evaluation method for the adhesion. In the Chinese test standard, although an evaluation method for the adhesion level is provided according to the peeling area of the asphalt membrane on the surface of the aggregates, there is no detailed calculation method for the peeling area. In other words, the adhesion can only be evaluated via the subjective judgment of testers and observers for the peeling area. Obviously, the uncertain impact of subjective factors on the adhesion evaluation is inescapable. In fact, the explanation items of the Chinese test standard point out the reason that there is no evaluation method in the ASTM test standard is due to the effect of subjective factors. It is detrimental to the accuracy of the adhesion evaluation, especially for the criticality of different adhesion levels.
In this case, some new methods are put forward to evaluate the adhesion between aggregates and asphalt binders. Hefer et al. and Bhasin et al. [6,7] put forward a new method, namely the Wihelmy hanging piece method, to determine the adhesion via advance angles and retreat angles of asphalt binder. Hamzah et al. [8] adopted the direct tension test to establish a new method to evaluate the adhesion grade. Shen et al. [9] evaluated the adhesion via tension test, net adsorption test, and scanning electron microscope. Liu et al. [10] proposed an improved evaluation method for adhesion via measuring the thickness of asphalt membrane based on the contact angle test, scanning electron microscopy, and energy spectrum analysis. Ingrassia et al. [11] investigated the adhesion properties between aggregate substrates and the binder composed of reclaimed wood bio-oils and bio-adhesives after different aging degrees based on the asphalt bond strength (BBS) tests. D’Angelo et al. [12] adopted the same method to analyze the adhesion characteristics between plastomeric binder blends and aggregates. Liu et al. [13] judged the adhesion level based on the PosiTestAT-A adhesion test. Ji et al. [14] and Anastasiya et al. [15,16] evaluated the effect of bio-oil on asphalt adhesion using the sessile drop method from a view of surface free energy of asphalt, bio-oil, and aggregates. In addition, Anastasiya et al. [17,18] also studied the adhesive properties of the bio-oil/asphalt blend via a probe tack test and lap shear test. Although these methods could provide quantitative evaluation methodologies for adhesion inspection, the adopted test methods were not common for engineering applications. It was not beneficial to the engineering application.
Subsequently, with the development of computer science [17,18,19,20], image-processing techniques were tried to investigate the adhesion between aggregates and asphalt binders. Park et al. [21] and Nazirizad et al. [22] analyzed the effect of anti-stripping additives on the water stability of asphalt concrete based on the standard measurement method (water boiling water test) and image processing technique. They considered that the image processing techniques could obtain better efficacy than unaided viewing when evaluating the adhesion. However, although these studies proved that the image processing techniques had the potential to improve the evaluation method for the adhesion, they mainly focused on investigating the efficiency of different anti-stripping additives and did not essentially optimize the current evaluation methods. The issues of the evaluation method for the adhesion in current standards have not been solved.
In addition, the characteristics of different aggregates have significant differences, even for the aggregates with the same specification. It inevitably affects the adhesion evaluation. However, only Shen et al. [9] and Ji et al. [23] investigated the effect of microscopic structures and water-absorption characteristics of aggregates on the adhesion, respectively. Unfortunately, the effects of aggregate shape on adhesion have not been discussed and stipulated in existing studies and standards.
Hence, the objective of this study contains the following two points:
- Establish an evaluation method for the adhesion to reduce the impact of subjective factors considering the usability and popularization;
- Investigate the effect of aggregate shape on the adhesion to further improve the proposed evaluation method.
Based on this, an innovative method based on the Chinese boiling water test and image processing technique is put forward to quantificationally evaluate the adhesion between aggregate and asphalt binder. Moreover, the effects of aggregate shapes on adhesion are also investigated via the proposed method from a view of aspect ratio and homogeneity.
2. Materials
In this study, the #70 base asphalt binder and basalt aggregates are adopted to implement the adhesion experiments. Their technical parameters are listed in Table 4 and Table 5, respectively.
Table 4.
Technical parameters of asphalt binder.
Table 5.
Technical parameters of aggregates.
3. Evaluation Method of the Adhesion Based on the Image Processing Technology
In this study, the evaluation method of the adhesion contains two parts: lab experiment and its result analysis. Considering the usability and popularization, the lab experiment is optimized and implemented based on the Chinese boiling water test. Moreover, according to the existing studies, an image processing technique is adopted to treat the experiment results to evaluate the adhesion.
3.1. Lab Experiments (The Chinese Water Boiling Test)
In the Chinese test standard, the boiling water test is adopted to judge the adhesion level between aggregates and asphalt binders via the peeling degree of asphalt membrane on the surface of one coarse aggregate in the boiling water, as shown in Figure 1.
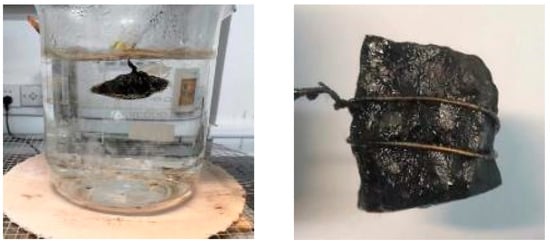
Figure 1.
A sketch of the Chinese boiling water test.
During the test, the factors affecting the test results are boiling time and boiling temperature. The boiling time has been set at 3 min in the Chinese test standard, while the boiling temperature is not specified. It only describes that the water should be under a micro-boiling state but without generating bubbles. However, the micro-boiling state is difficult to judge, which is detrimental to test standardization. Hence, the boiling water tests at different temperatures (85 °C, 90 °C, 92 °C, 94 °C, 96 °C, and 98 °C) are implemented in this study to determine the boiling temperature, as shown in Figure 2. The rate of heating used in this study is 10 °C/min.
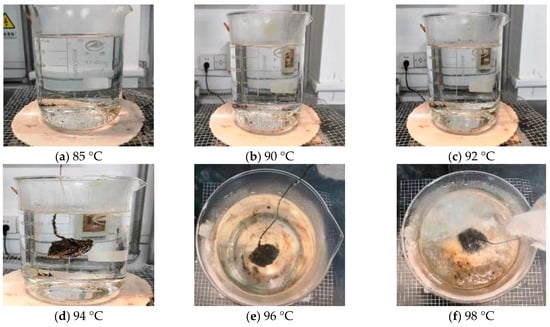
Figure 2.
Boiling state at different temperatures.
As shown in Figure 2, it can be found that there is no bubble and vapor at 85 °C. When the temperature reaches 90 °C and 92 °C, the vapor can be observed and gradually increases while there are still no bubbles. When the temperature reaches 94 °C, the bubbles begin to generate. Although dissociative asphalt membrane does not appear in the water, many bubbles have been generated on the surface of the aggregate. When the temperature exceeds 96 °C, lots of dissociative asphalt membranes can be observed, accompanied by a large number of bubbles and vapors, which is not permitted in the Chinese boiling water test. Hence, the recommended boiling temperature in this study is 92 ± 1 °C.
3.2. Adhesion Evaluation
In this study, the image processing technique based on the software “Image J 1.51j8” [24,25,26] is adopted to obtain the peeling area of the asphalt membrane on the surface of the aggregate. The process of the method is as follows.
- Put the aggregate after the boiling water test on a white slab, as shown in Figure 3. Considering the aggregate is underslung during the boiling water test, there is no peeling zone at the bottom surface of the aggregate owing to the fluidity of the asphalt membrane at high temperatures. Hence, the bottom surface should be in contact with the slab. It should be explained that the soft asphalt binder may not conform to the assumption that there is no peeling zone at the bottom of the aggregate owing to its high fluidity at high temperatures. Hence, one limitation of this study is that the proposed method may not be appropriate for the asphalt binder with a low softening point. However, in fact, soft asphalt is rarely adopted in pavement engineering in China because the softening point of the used asphalt must meet minimum standards.

Figure 3.
The aggregate after boiling water test on a white slab.
- Apply a stable light source to illuminate the aggregate. In order to reduce the shadow, it is better to apply the light source from three directions. If the condition is limited, the light source should be in a vertical direction.
- Obtain at least three images of the aggregate via camera equipment from different angles. The image should be larger than 96 dpi.
- Owing to the obtained images using traditional camera equipment, they are usually 24-bit depth and are difficult to be treated using the “Image J”. Hence, these images should be transformed to 8-bit grayscale depth via “Image J” command “Type/8-bit”, as shown in Figure 4. It should be explained that the aggregate is placed on a white paper with a rough texture. The rough texture on the paper can moderate the intensity of light reflection so as to reduce the glare as low as possible. In addition, the color of the area where asphalt peels from aggregate is different from that of the area where the glare occurs. The former is mostly gray and cyan, and the latter is white. They can be distinguished by adjusting the threshold of Image J.
- Eliminate the background of the 8-bit depth image via the “Image J” command “Process/Subtract Background/Rolling ball radius 20% pixels” (Figure 5). The threshold value is very important for the effect of eliminating background. Figure 6 plots the images after eliminating the background using different threshold values.

Figure 4.
The transformation of the image from 24-bit depth to 8-bit depth.

Figure 5.
The images after eliminating the background.

Figure 6.
The images after eliminating the background using different threshold values.
In Figure 6, the red zone represents the peeling zone of the asphalt membrane. It can be found that the area of the red zone decreases as the threshold value increases [27,28,29,30]. When the threshold value exceeds 30%, the identifiability of the red zone will be reduced largely. However, it does not mean that the smaller the threshold value is, the better. The sensibility of the red zone increases as the threshold value decreases. When the threshold value is lower than 15%, many useless messages are contained in the red zone. Hence, by comparing the area of the red zone and the real peeling area of the asphalt membrane, the optimal threshold value is selected as 20%.
- The aggregate outline can be automatically identified by the “Image J”, as shown in Figure 7.

Figure 7.
Aggregate outline in the image.
- Finally, the area of the red zone (peeling zone of the asphalt membrane) and the area of the aggregate can be obtained using the “Image J” command “Analyze/Measure” [31,32,33]. Moreover, the adhesion grade can be quantificationally evaluated according to the peeling area ratio of the aggregate and Table 2. The peeling area ratio RP can be calculated using Equation (1). It should be explained that the above process can be executed in batches.
The proposed method for the adhesion in this study can be illustrated in Figure 8.
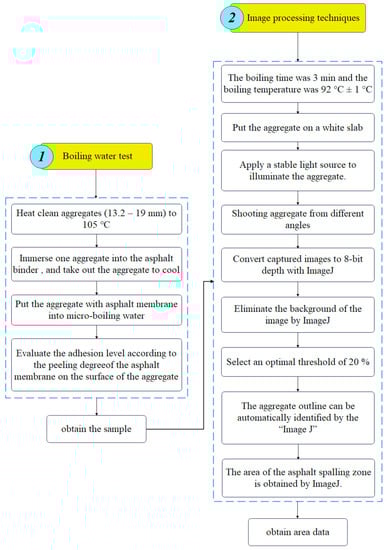
Figure 8.
Flow chart of the proposed evaluation method for the adhesion.
4. Effect of Aggregate Characteristics on Adhesion Evaluation
The aggregate shape affects the aggregate–asphalt adhesion; e.g., the asphalt membrane at the sharp zone of the aggregate will be easier to peel during the boiling water test. It also brings some difficulty for the subjective evaluation of the aggregate–asphalt adhesion in traditional methods. Hence, in order to reveal the influence of aggregate shape on the aggregate–asphalt adhesion and explain the feasibility of the proposed method, the aggregates are divided into two categories according to the different homogeneities and aspect ratios. The adhesions of the two types of aggregates are evaluated using the proposed method in this study. The homogeneity and aspect ratio can be characterized using Equations (2) and (3), respectively.
where, H is a self-defined index and is no more less than 1, which represents the homogeneity of the target aggregate. It derives from the Zhang’s study [34]. The lower the H is, the more quasi-spherical the aggregate is. At is the aspect ratio of the target aggregate and is also no more lessthan 1.0. The larger the At is, the more elongated and flaky the aggregate is. l1, l2, V, m, and ρ are the longest axis, shortest axis, volume, mass, and density of the target aggregate, respectively.
Some examples of the two types of aggregates are listed in Table 6 and Table 7. Type A (Table 6) represents the aggregates that have similar At and different H. It can be adopted to reveal the effect of aggregate homogeneity on the aggregate–asphalt adhesion in this study. Type B (Table 7) represents the aggregates that have similar H and different At. It can be adopted to reveal the effect of aggregate angularity on the aggregate–asphalt adhesion. Table 6 and Table 7 also present the appearances and general features of different aggregates.
Table 6.
Type A aggregates.
Table 7.
Type B aggregates.
4.1. Effect of Homogeneity
Table 8 lists the peeling area ratio and the adhesion grade of the type A aggregates (with different values of H) after boiling water tests. The peeling area ratio is obtained according to the proposed method (Section 3.2) in this study. The adhesion grade is obtained according to the traditional method (Table 2) of the Chinese experiment standard. In order to ensure the reliability of the adhesion grade, it is evaluated by a professional team (two professors and one senior experimentalist).
Table 8.
Experiment results of type A aggregates.
The effect of the values of H on the peeling area ratio is shown in Figure 9. The peeling area ratio is calculated as the average value, the same value as H.
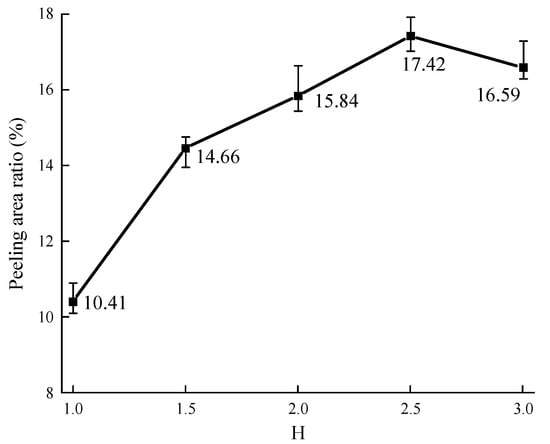
Figure 9.
Effect of the value of H on the peeling area ratio.
As shown in Figure 9, it can be found that the peeling area ratio generally increases as the value of H increases, especially when the value of H is lower than 1.5. Then, a ten-percentage point increase for the value of H makes the peeling area ratio 8.1% increase. When the value of H is larger than 1.5, a ten-percentage point increase for the value of H only makes the peeling area ratio 1.9% increase. It shows that the increase in aggregate angularity can intensify the peeling of the asphalt membrane while the effect degree decreases as the value of H increases. When the value of H is lower, the aggregate surface is close to smooth, and the asphalt membrane on the aggregate surface is smooth. After boiling, the peeling of the asphalt membrane is not obvious. When the value of H is higher, the edges and corners of the aggregate are more significant, and the asphalt membrane on the aggregate surface is relatively thicker. After boiling, the asphalt membrane easily flows downward and gathers at the pit of the aggregate. As a result, the edges and corners of the aggregate are exposed during the boiling water test. This will influence the evaluation of aggregate–asphalt adhesion grade. Hence, in order to ensure the stability of adhesion evaluation, it is better to select the aggregate with the obvious angularity during the boiling water tests.
In addition, the peeling area ratio slightly decreases when the value of H reaches 3.0. It may be due to the experiment errors resulting from a lack of the number of aggregate samples (the shape of aggregates is not common, and the aggregates are not easy to search when the value of H exceeds 3.0).
4.2. Effect of Aspect Ratio
Table 9 lists the peeling area ratio and the adhesion grade of the type B aggregates (with different values of At) after boiling water tests.
Table 9.
Experiment results of type B aggregates.
The effect of the values of At on the peeling area ratio is shown in Figure 10.
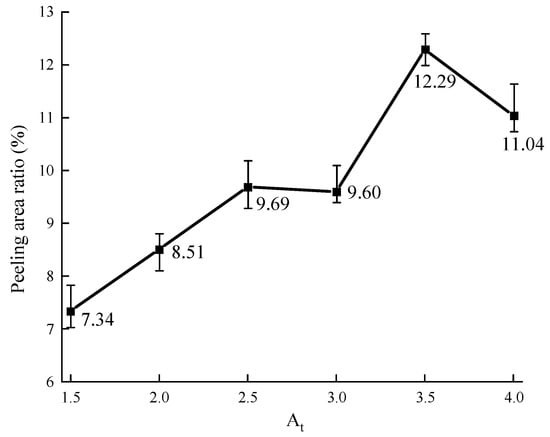
Figure 10.
Effect of the value of At on the peeling area ratio.
As shown in Figure 10, it can be found that the peeling area ratio generally increases as the value of At increases. The peeling of the asphalt membrane at both ends of the aggregate is more serious. However, the effect of the value of At on the peeling area ratio is lower than that of the value of H. A ten-percentage point increase for the value of At on average makes the peeling area ratio 3.4% increased, while on average, 4.5% increased for the value of H. It shows that the effect of aggregate flatness on the aggregate–asphalt adhesion is weaker than that of aggregate angularity. Similarly, with Figure 9, the peeling area ratio slightly decreases when the value of At reaches 4.0. It also may be due to the experiment errors resulting from a lack of the number of aggregate samples. The shape of aggregates is not common when the value of At exceeds 4.0.
In addition, as shown in Table 8 and Table 9 (No. A6, A18, A19, A37, A43, B1, B3, B5, B7, B10, B13, B15, and B18), some adhesion grades obtained by the professional team are different from the results of peeling area ratio obtained by the proposed method of this study. The proposed method is beneficial to evaluate the peeling status of asphalt membrane to accurately judge the adhesion grade.
5. Conclusions
In this study, an innovative method based on the Chinese boiling water test and image processing technique is put forward to quantificationally investigate the peeling status of the asphalt membrane. Moreover, two indexes are proposed to characterize the aggregate features (homogeneity and aspect ratio). The effects of aggregate features on the aggregate–asphalt adhesion are analyzed via the proposed method and conventional evaluation method. The proposed method is beneficial for evaluating the peeling status of asphalt membranes to accurately judge the adhesion grade. However, one disadvantage of the proposed method is the high requirement for light sources.
The peeling of the asphalt membrane on the aggregate surface is more serious as the complexity of the aggregate shape increases after the boiling water tests, while the effect degree gradually decreases. When the value of H is lower than 1.5, a ten-percentage point increase raises the peeling area ratio by 8.1%. When the value of H is larger than 1.5, it only raises the peeling area ratio by 1.9%. In order to ensure the stability of adhesion evaluation, it is better to select the aggregate with the obvious angularity during the boiling water tests. In addition, the effect of aspect ratio on the peeling status of asphalt membrane is lower than that of aggregate homogeneity. A ten-percentage point increase for the value of At makes the peeling area ratio 3.4% increased, while 4.5% increased for the value of H.
However, the adhesion can be influenced by the chemical interaction between aggregate and asphalt. The chemical interaction depends on asphalt type (e.g., base asphalt with different grades, modified asphalt, etc.) and aggregate lithology (e.g., limestone, basalt, granite, etc.). The effects of these factors on the adhesion will be systematically carried out in our future studies.
Author Contributions
Conceptualization, M.L. and J.R.; methodology, J.R.; validation, J.R.; formal analysis, J.R.; investigation, J.W., Z.G. and Z.Z.; resources, Z.Z.; data curation, M.L., J.W., Z.G. and J.C.; writing—original draft preparation, M.L., J.W., Z.G., J.C., Z.Z. and J.R.; writing—review and editing, J.R.; visualization, J.R.; supervision, J.R.; project administration, J.R.; funding acquisition, J.R. All authors have read and agreed to the published version of the manuscript.
Funding
This study is sponsored in part by the National Natural Science Foundation of China under grant 51808326, for which the authors are very grateful.
Institutional Review Board Statement
Not applicable.
Informed Consent Statement
Not applicable.
Data Availability Statement
The data presented in this study are available in the article.
Conflicts of Interest
The authors declare no conflict of interest.
References
- Ren, J.; Zhang, X.; Peng, C.; Wang, Y.; Wang, Y.; Zhao, H.; Xu, X.; Xia, L.; Wang, C.; Li, G.; et al. Short-term aging characteristics and mechanisms of SBS-modified bio-asphalt binder considering time-dependent effect. Constr. Build. Mater. 2022, 352, 129048. [Google Scholar] [CrossRef]
- Al-Kafaji, M.; Al-Busaltan, S.; Ewadh, H.A. Evaluating Water Damage in Acrylic Polymer-Modified Cold Bituminous Emulsion. J. Mater. Civil. Eng. 2021, 12, 04021337. [Google Scholar] [CrossRef]
- Wu, H.; Li, P.; Nian, T.; Zhang, G.; He, T.; Wei, X. Evaluation of asphalt and asphalt mixtures’ water stability method under multiple freeze-thaw cycles. Constr. Build. Mater. 2019, 228, 117089. [Google Scholar] [CrossRef]
- JTG E20-2011; Standard Test Methods of Bitumen and Bituminous Mixtures for Highway Engineering. Ministry of Transport of the People’s Republic of China: Beijing, China, 2011.
- D3625; Standard Practice for Effect of Water on Bituminous-Coated Aggregate Using Boiling Water. American Society for Testing and Materials: Conshohocken, PA, USA, 2005.
- Hefer, A.W.; Bhasin, A.; Little, D.N. Bitumen Surface Energy Characterization Using a Contact Angle Approach. J. Mater. Civ. Eng. 2006, 18, 759–767. [Google Scholar] [CrossRef]
- Bhasin, A. Development of Methods to Quantify Bitumen-Aggregate Adhesion and Loss of Adhesion due to Water. Ph.D. Thesis, Texas A&M University, College Station, TX, USA, 2006. [Google Scholar]
- Hamzah, M.O.; Kakar, M.R.; Quadri, S.A.; Valentin, J. Quantification of moisture sensitivity of warm mix asphalt using image analysis technique. J. Clean. Prod. 2014, 68, 200–208. [Google Scholar] [CrossRef]
- Shen, A.; Zhai, C.; Guo, Y.; Yang, X. Mechanism of adhesion property between steel slag aggregate and rubber asphalt. J. Adhes. Sci. Technol. 2018, 32, 2727–2740. [Google Scholar] [CrossRef]
- Liu, Z.; Huang, X.; Sha, A.; Wang, H.; Chen, J.; Li, C. Improvement of Asphalt-Aggregate Adhesion Using Plant Ash Byproduct. Materials 2019, 12, 605. [Google Scholar] [CrossRef]
- Ingrassia, L.P.; Cardone, F.; Canestrari, F.; Lu, X. Experimental investigation on the bond strength between sustainable road bio-binders and aggregate substrates. Mater. Struct. 2019, 52, 80. [Google Scholar] [CrossRef]
- D’angelo, S.; Ferrotti, G.; Cardone, F.; Canestrari, F. Asphalt Binder Modification with Plastomeric Compounds Containing Recycled Plastics and Graphene. Materials 2022, 15, 516. [Google Scholar] [CrossRef]
- Liu, W.; Li, H.; Zhu, H.; Xu, P. The Interfacial Adhesion Performance and Mechanism of a Modified Asphalt-Steel Slag Aggregate. Materials 2020, 13, 1180. [Google Scholar] [CrossRef]
- Ji, J.; Yao, H.; Liu, L.; Suo, Z.; Zhai, P.; Yang, X.; You, Z. Adhesion Evaluation of Asphalt-Aggregate Interface Using Surface Free Energy Method. Appl. Sci. 2017, 7, 156. [Google Scholar] [CrossRef]
- Yadykova, A.Y.; Ilyin, S.O. Rheological and adhesive properties of nanocomposite bitumen binders based on hydrophilic or hydrophobic silica and modified with bio-oil. Constr. Build. Mater. 2022, 342, 127946. [Google Scholar] [CrossRef]
- Yadykova, A.Y.; Ilyin, S.O. Bitumen improvement with bio-oil and natural or organomodified montmorillonite: Structure, rheology, and adhesion of composite asphalt binders. Constr. Build. Mater. 2022, 364, 129919. [Google Scholar] [CrossRef]
- Zhao, H. A reduced order model based on machine learning for numerical analysis: An application to geomechanics. Eng. Appl. Artif. Intell. 2021, 100, 104194. [Google Scholar] [CrossRef]
- Ren, J.; Zhao, H.; Zhang, L.; Zhao, Z.; Xu, Y.; Cheng, Y.; Wang, M.; Chen, J.; Wang, J. Design optimization of cement grouting material based on adaptive boosting algorithm and simplicial homology global optimization. J. Build. Eng. 2022, 49, 104049. [Google Scholar] [CrossRef]
- Ren, J.; Zhang, L.; Zhao, H.; Zhao, Z.; Wang, S. Determination of the fatigue equation for the cement-stabilized cold recycled mixtures with road construction waste materials based on data-driven. Int. J. Fatigue 2022, 158, 106765. [Google Scholar] [CrossRef]
- Zhao, Z.; Wang, S.; Ren, J.; Wang, Y.; Wang, C. Fatigue characteristics and prediction of cement-stabilized cold recycled mixture with road-milling materials considering recycled aggregate composition. Constr. Build. Mater. 2021, 301, 124122. [Google Scholar] [CrossRef]
- Park, D.-W.; Seo, W.-J.; Kim, J.; Vo, H.V. Evaluation of moisture susceptibility of asphalt mixture using liquid anti-stripping agents. Constr. Build. Mater. 2017, 144, 399–405. [Google Scholar] [CrossRef]
- Nazirizad, M.; Kavussi, A.; Abdi, A. Evaluation of the effects of anti-stripping agents on the performance of asphalt mixtures. Constr. Build. Mater. 2015, 84, 348–353. [Google Scholar] [CrossRef]
- Ji, J.; Dong, Y.; Zhang, R.; Suo, Z.; Guo, C.; Yang, X.; You, Z. Effect of Water Absorption and Loss Characteristics of Fine Aggregates on Aggregate-Asphalt Adhesion. KSCE J. Civ. Eng. 2021, 25, 2020–2035. [Google Scholar] [CrossRef]
- Van de Linde, S. Single-molecule localization microscopy analysis with ImageJ. J. Phys. D-Appl. Phys. 2019, 52, 203002. [Google Scholar] [CrossRef]
- Gao, L. QSIM: Quantitative structured illumination microscopy image processing in ImageJ. Biomed. Eng. Online 2015, 14, 4. [Google Scholar] [CrossRef] [PubMed]
- Tajima, R.; Kato, Y. Comparison of threshold algorithms for automatic image processing of rice roots using freeware ImageJ. Field Crop. Res. 2011, 121, 460–463. [Google Scholar] [CrossRef]
- Alam, J.; Shaheen, A.; Anwar, M.S. Accessing select properties of the electron with ImageJ: An open-source image-processing paradigm. Eur. J. Phys. 2014, 35, 15011. [Google Scholar] [CrossRef]
- Fontenete, S.; Carvalho, D.; Lourenço, A.; Guimarães, N.; Madureira, P.; Figueiredo, C.; Azevedo, N.F. FISHji: New ImageJ macros for the quantification of fluorescence in epifluorescence images. Biochem. Eng. J. 2016, 112, 61–69. [Google Scholar] [CrossRef]
- Schroeder, A.B.; Dobson, E.T.A.; Rueden, C.T.; Tomancak, P.; Jug, F.; Eliceiri, K.W. The ImageJ ecosystem: Open-source software for image visualization, processing, and analysis. Protein Sci. 2021, 30, 234–249. [Google Scholar] [CrossRef]
- Rueden, C.T.; Schindelin, J.; Hiner, M.C.; Dezonia, B.E.; Walter, A.E.; Arena, E.T.; Eliceiri, K.W. ImageJ2: ImageJ for the next generation of scientific image data. BMC Bioinform. 2017, 18, 529. [Google Scholar] [CrossRef]
- Aragón-Sánchez, J.; Quintana-Marrero, Y.; Aragón-Hernández, C.; Hernández-Herero, M.J. ImageJ: A Free, Easy, and Reliable Method to Measure Leg Ulcers Using Digital Pictures. Int. J. Low. Extremity Wounds 2017, 16, 269–273. [Google Scholar] [CrossRef]
- Lam, J.; Katti, P.; Biete, M.; Mungai, M.; AshShareef, S.; Neikirk, K.; Lopez, E.G.; Vue, Z.; Christensen, T.A.; Beasley, H.K.; et al. A Universal Approach to Analyzing Transmission Electron Microscopy with ImageJ. Cells 2021, 10, 2177. [Google Scholar] [CrossRef]
- Dos Santos, S.M.; Klinkhardt, U.; Schneppenheim, R.; Harder, S. Using imageJ for the quantitative analysis of flow-based adhesion assays in real-time under physiologic flow conditions. Platelets 2010, 21, 60–66. [Google Scholar] [CrossRef]
- Zhang, D.; Huang, X.; Zhao, Y. Numerical Study on the Effect of Coarse-Aggregate Morphology on Shear Performance. J. Test. Evaluation 2015, 43, 20130067. [Google Scholar] [CrossRef]


Disclaimer/Publisher’s Note: The statements, opinions and data contained in all publications are solely those of the individual author(s) and contributor(s) and not of MDPI and/or the editor(s). MDPI and/or the editor(s) disclaim responsibility for any injury to people or property resulting from any ideas, methods, instructions or products referred to in the content. |
© 2023 by the authors. Licensee MDPI, Basel, Switzerland. This article is an open access article distributed under the terms and conditions of the Creative Commons Attribution (CC BY) license (https://creativecommons.org/licenses/by/4.0/).