
In-Vitro Analysis of FeMn-Si Smart Biodegradable Alloy

 ,
, 
 ,
,  ,
, 

Abstract
:1. Introduction
2. Materials and Methods
3. Results
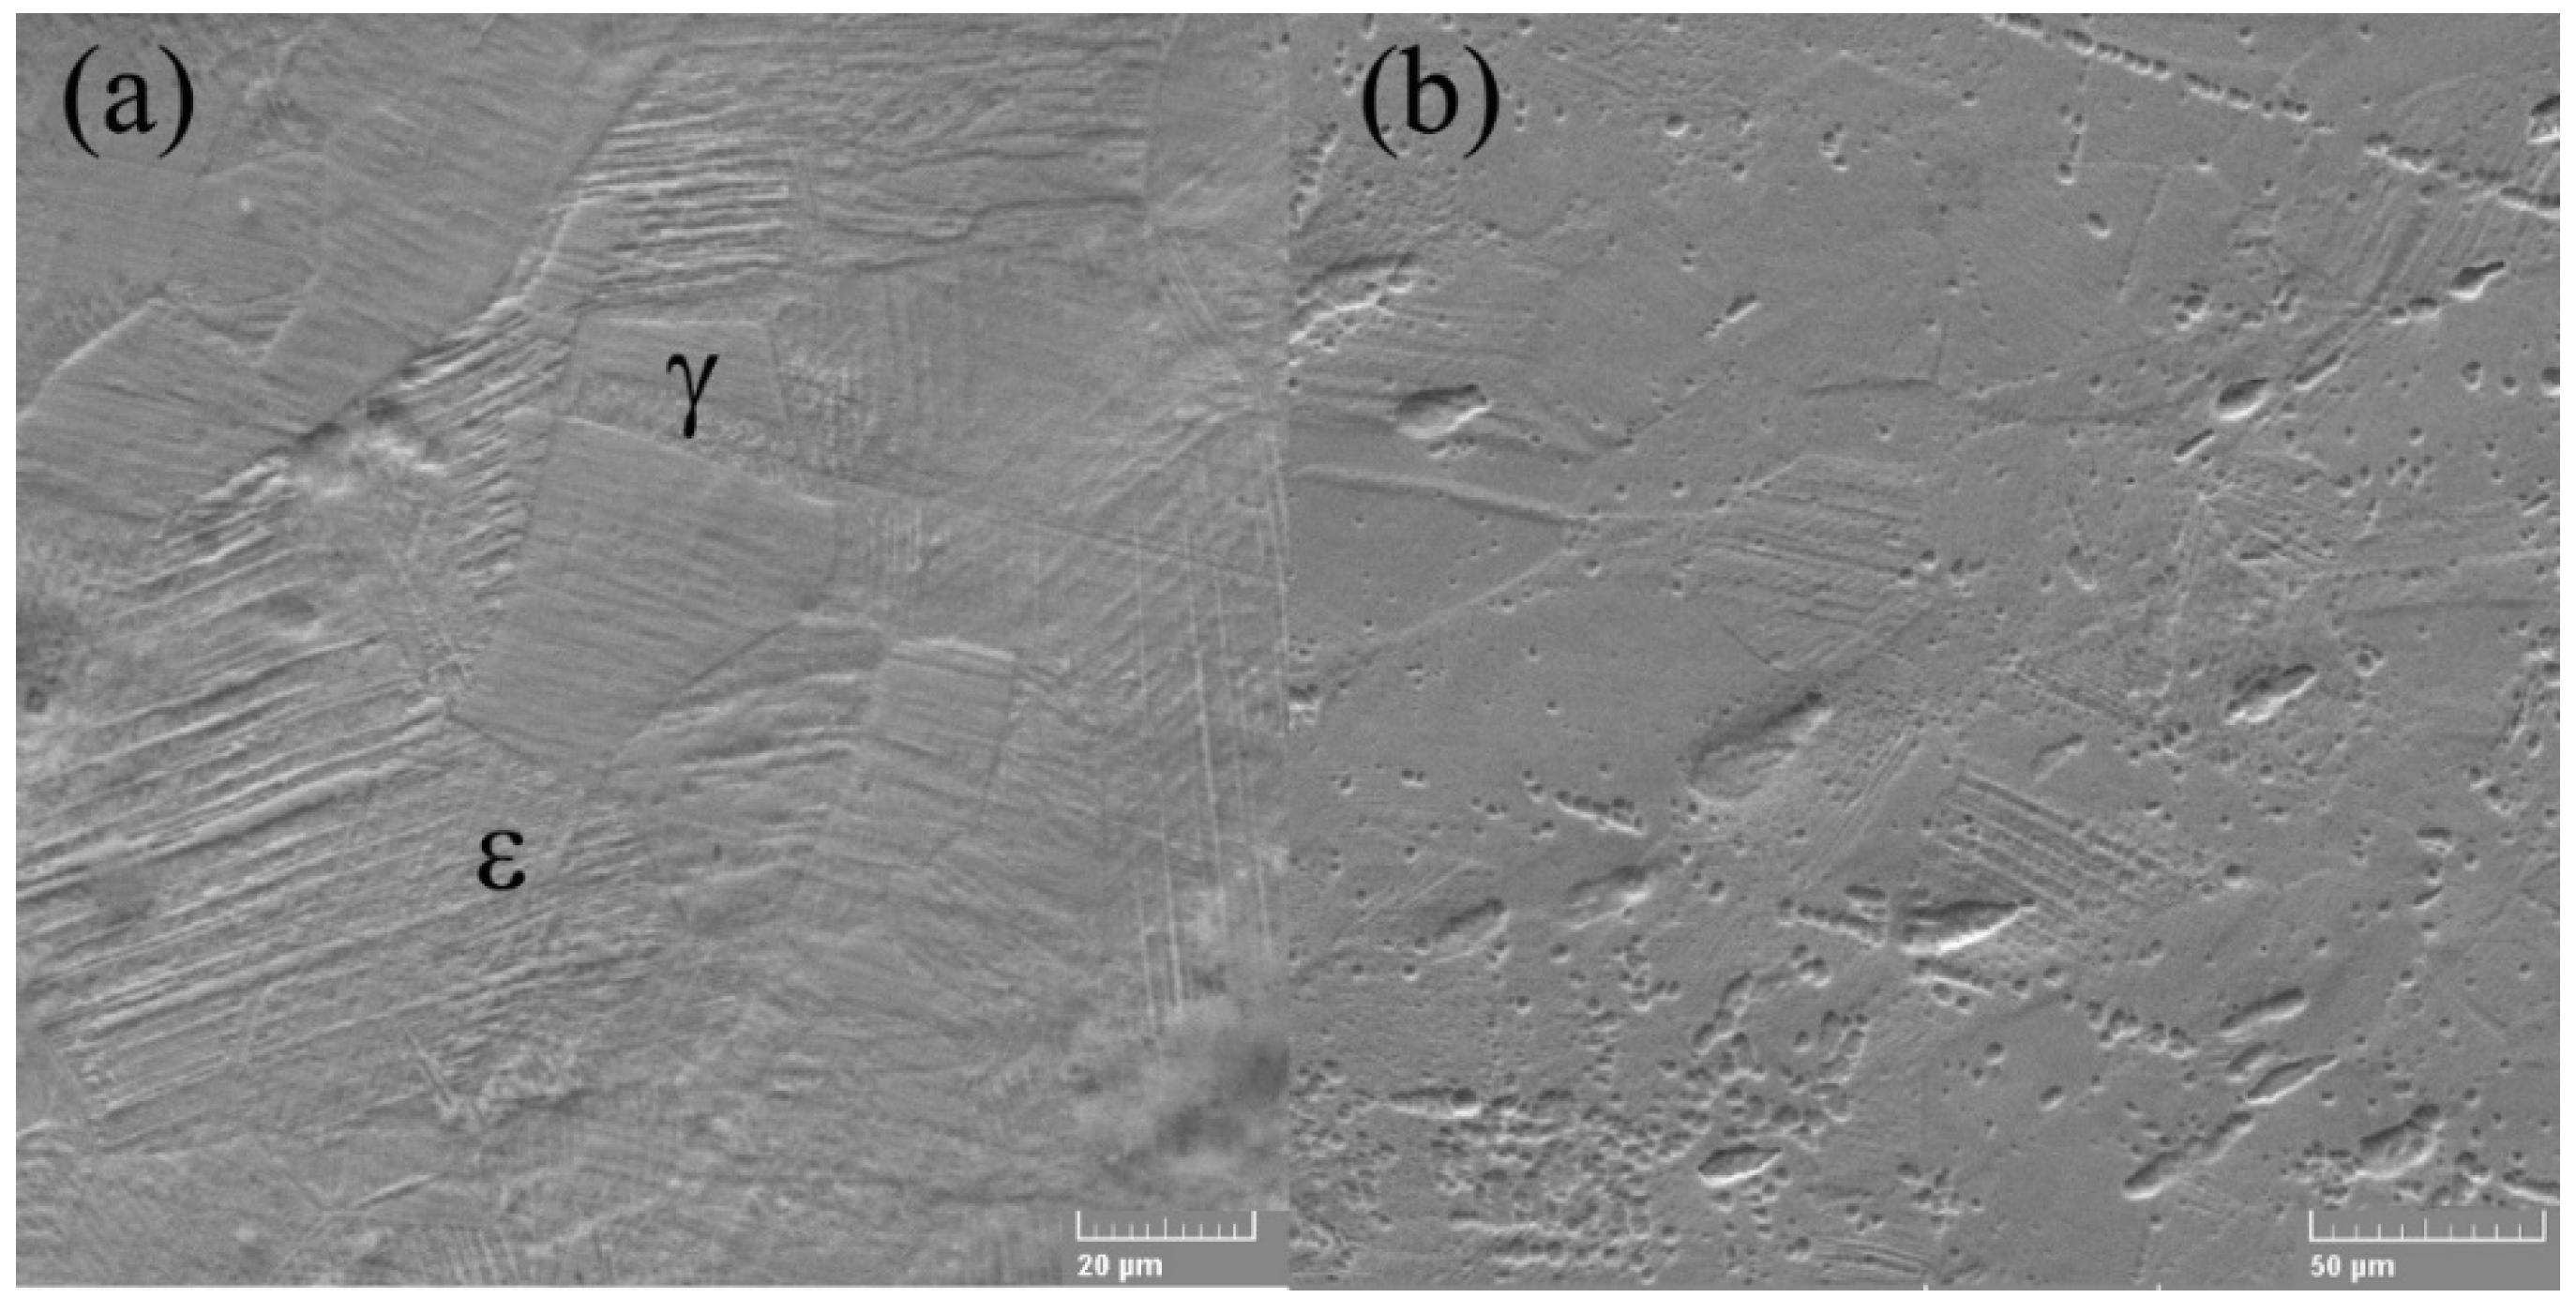
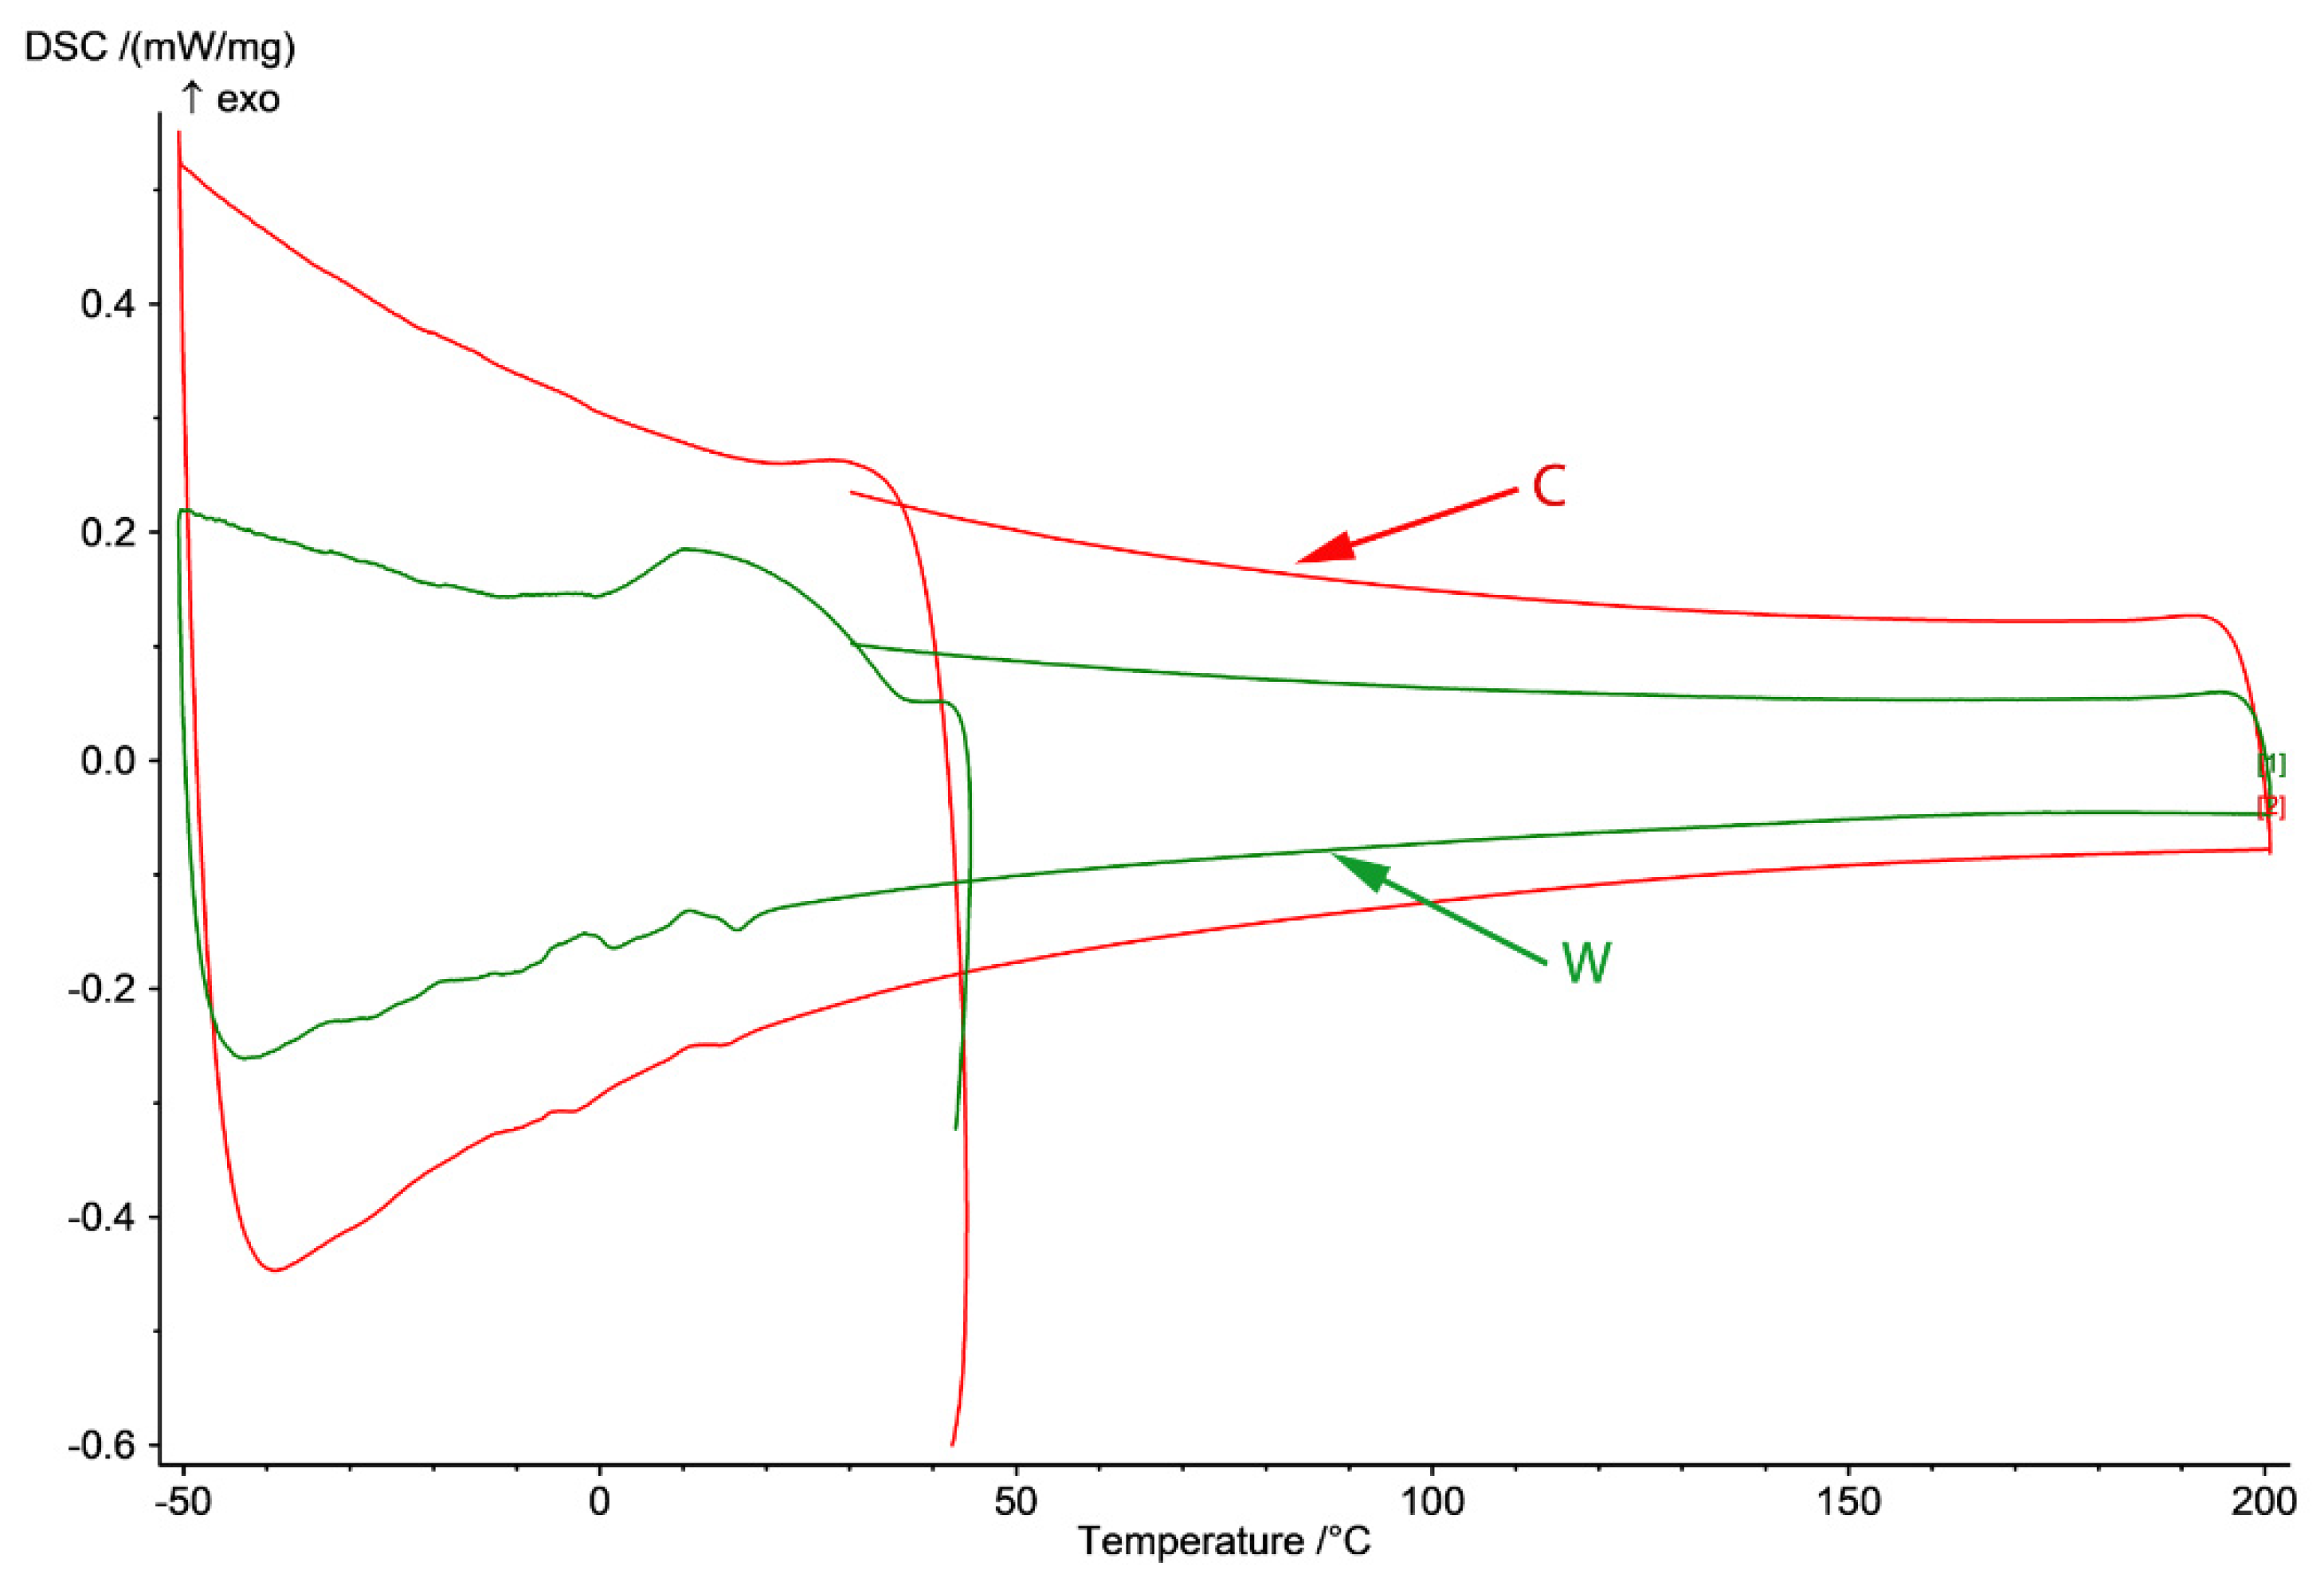
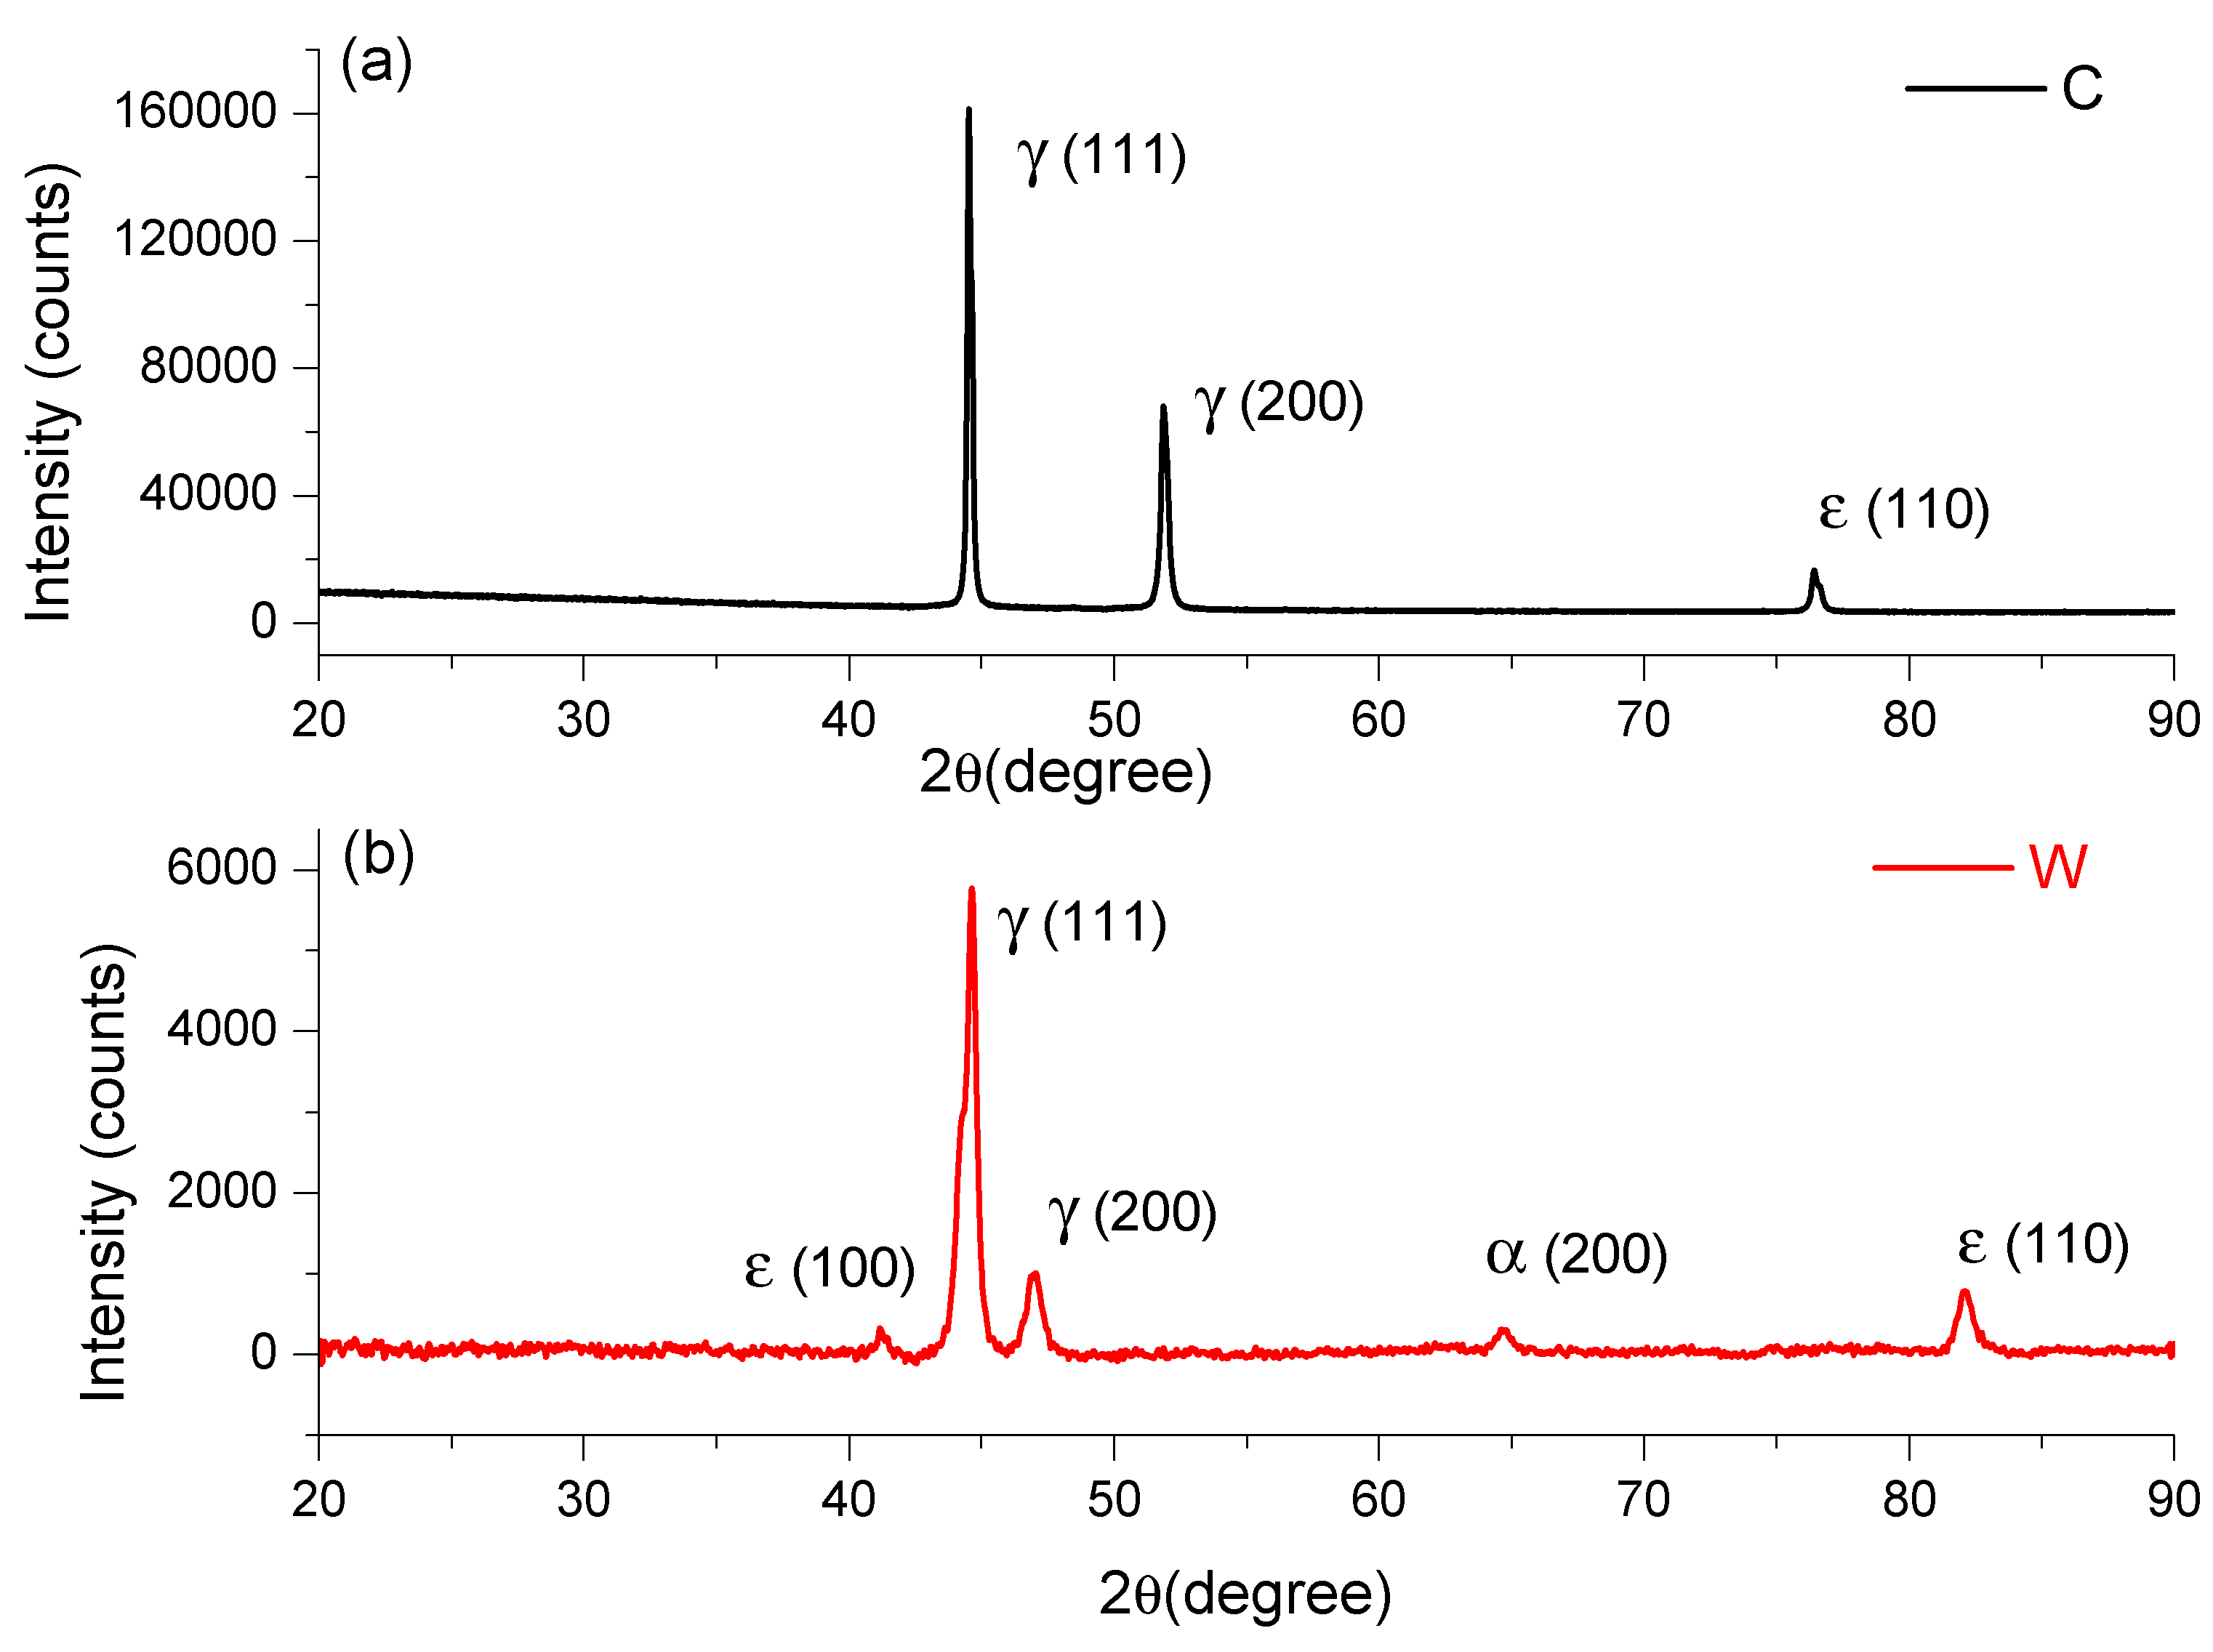
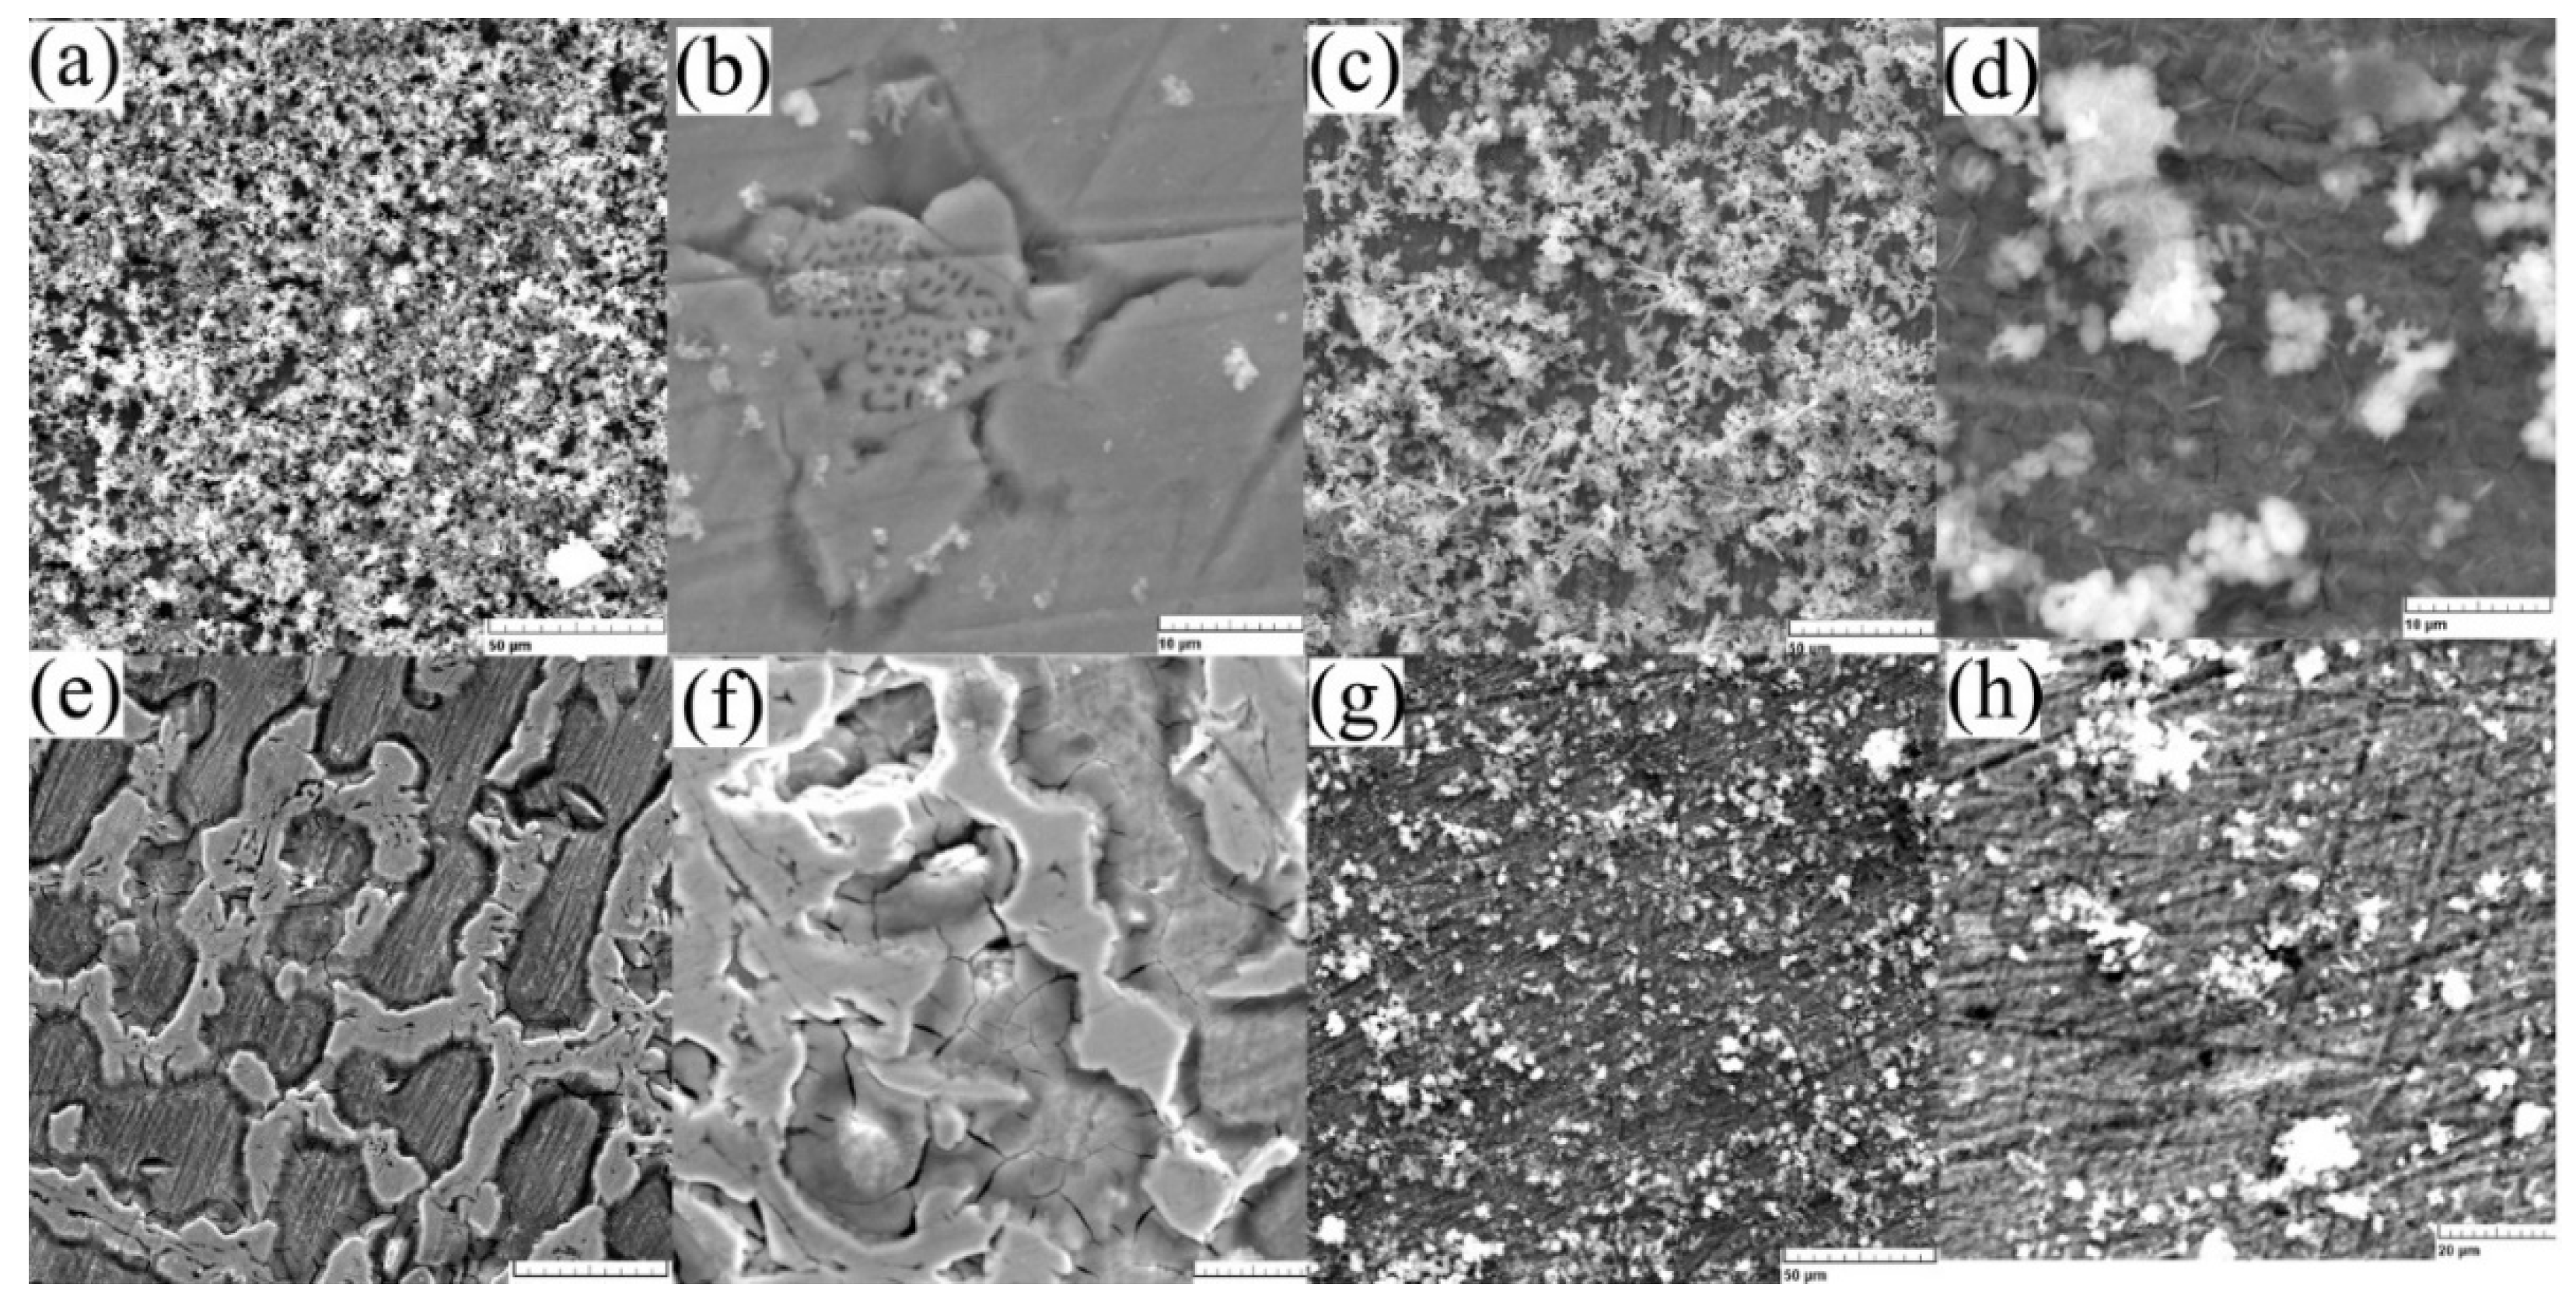
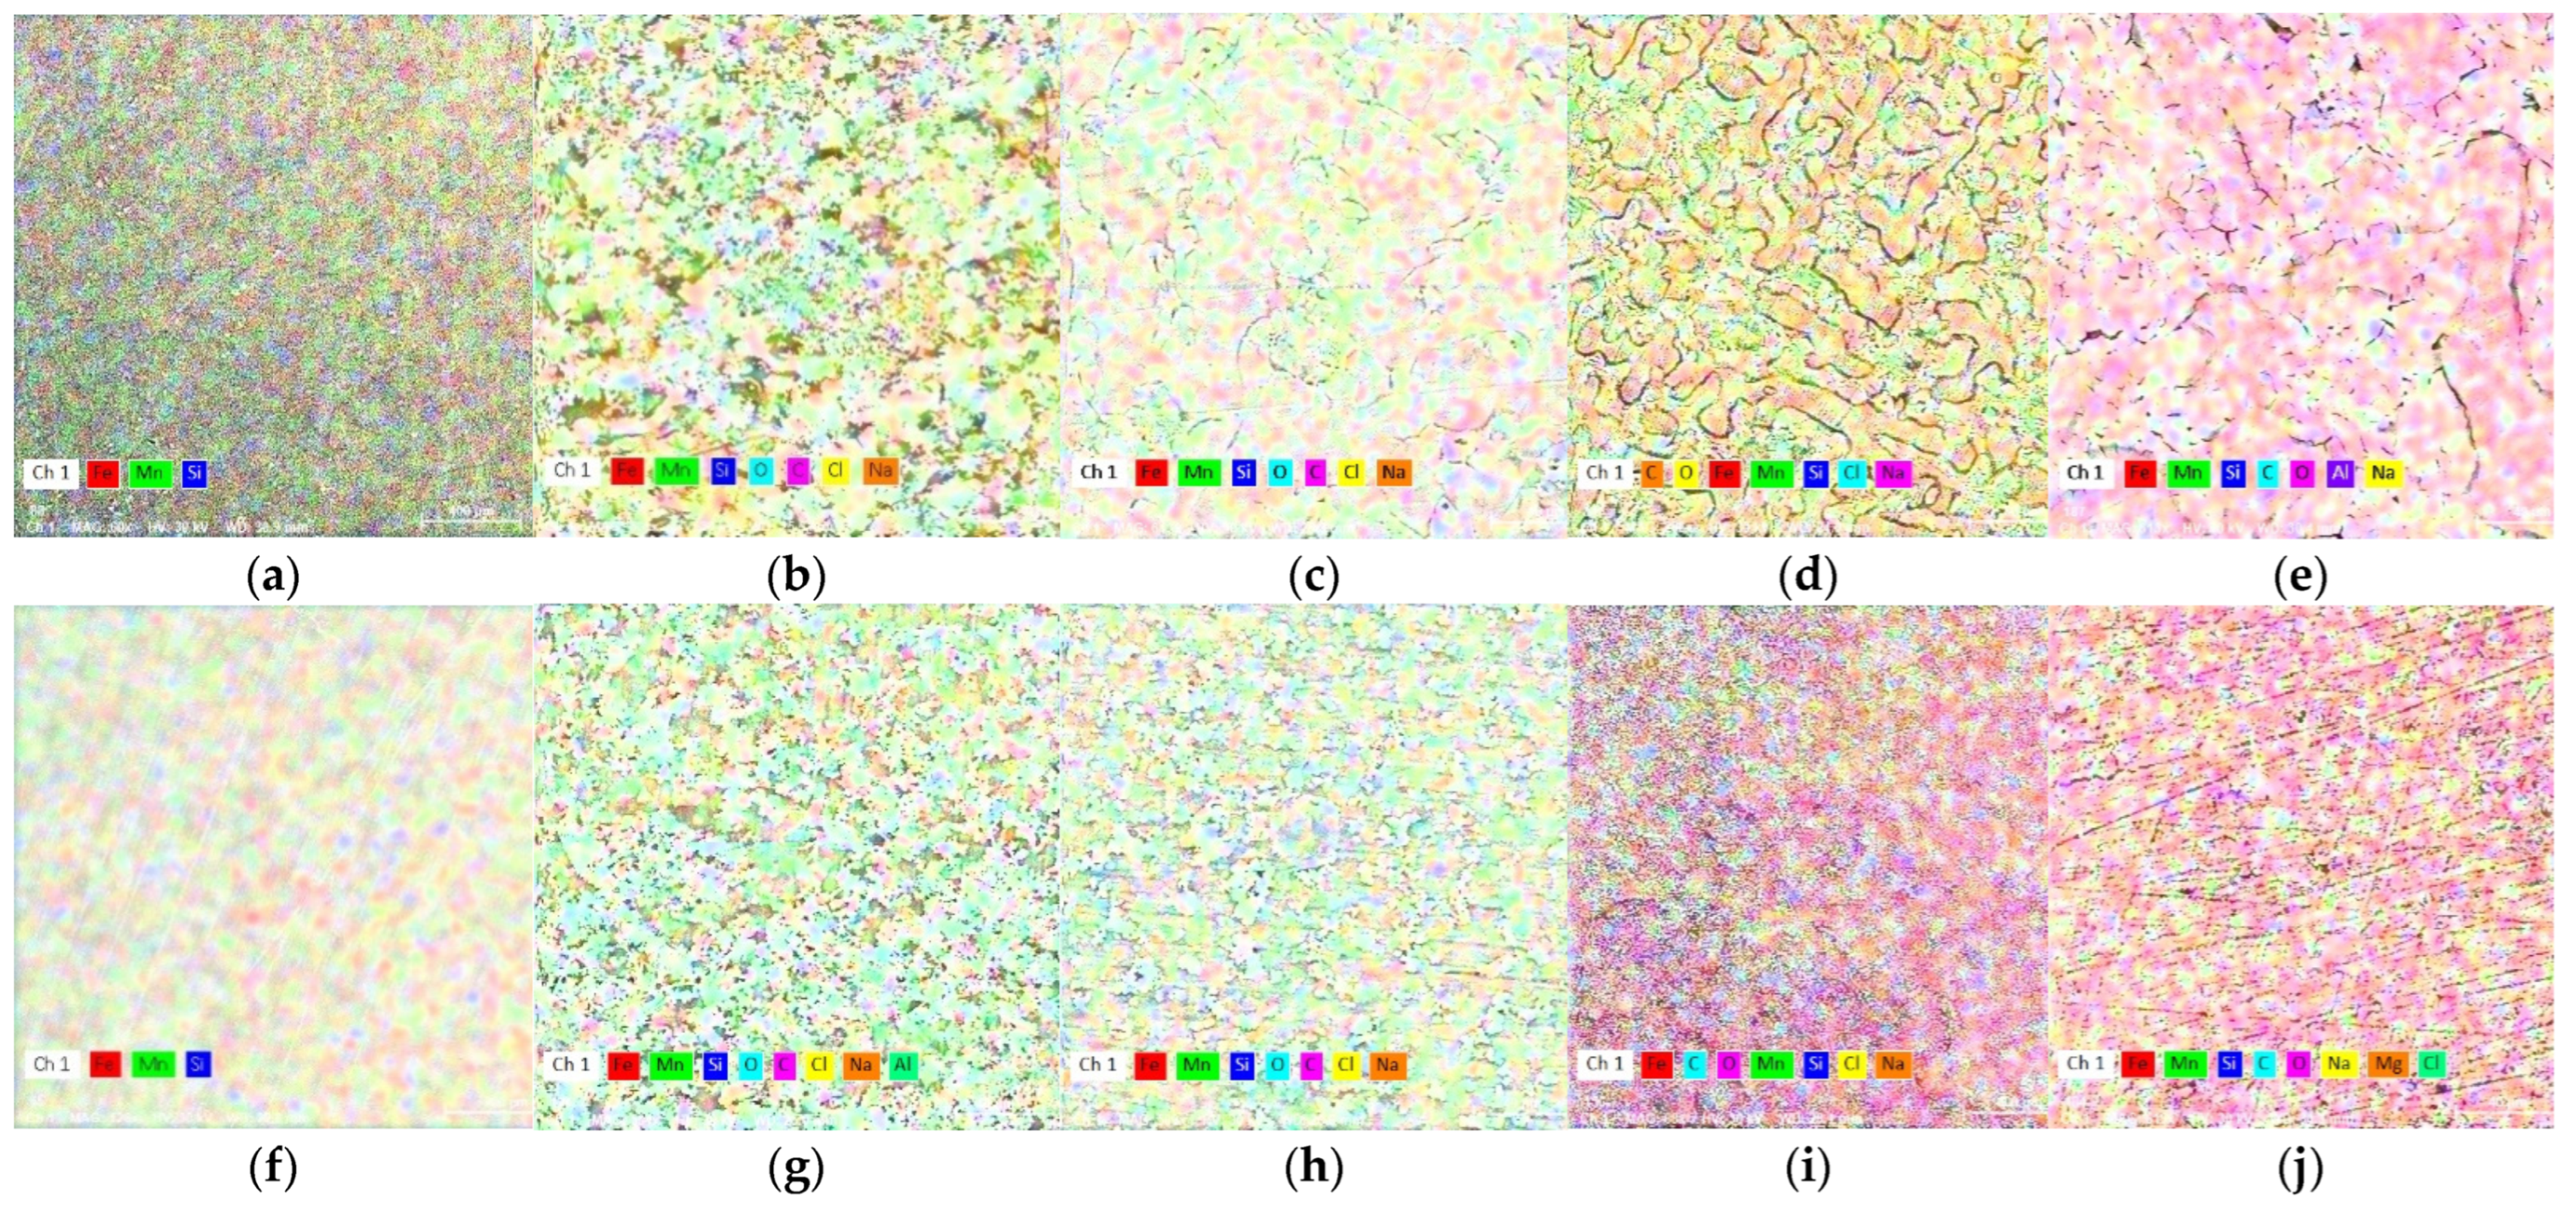
3.1. Experimental FeMnSi Materials Analysis
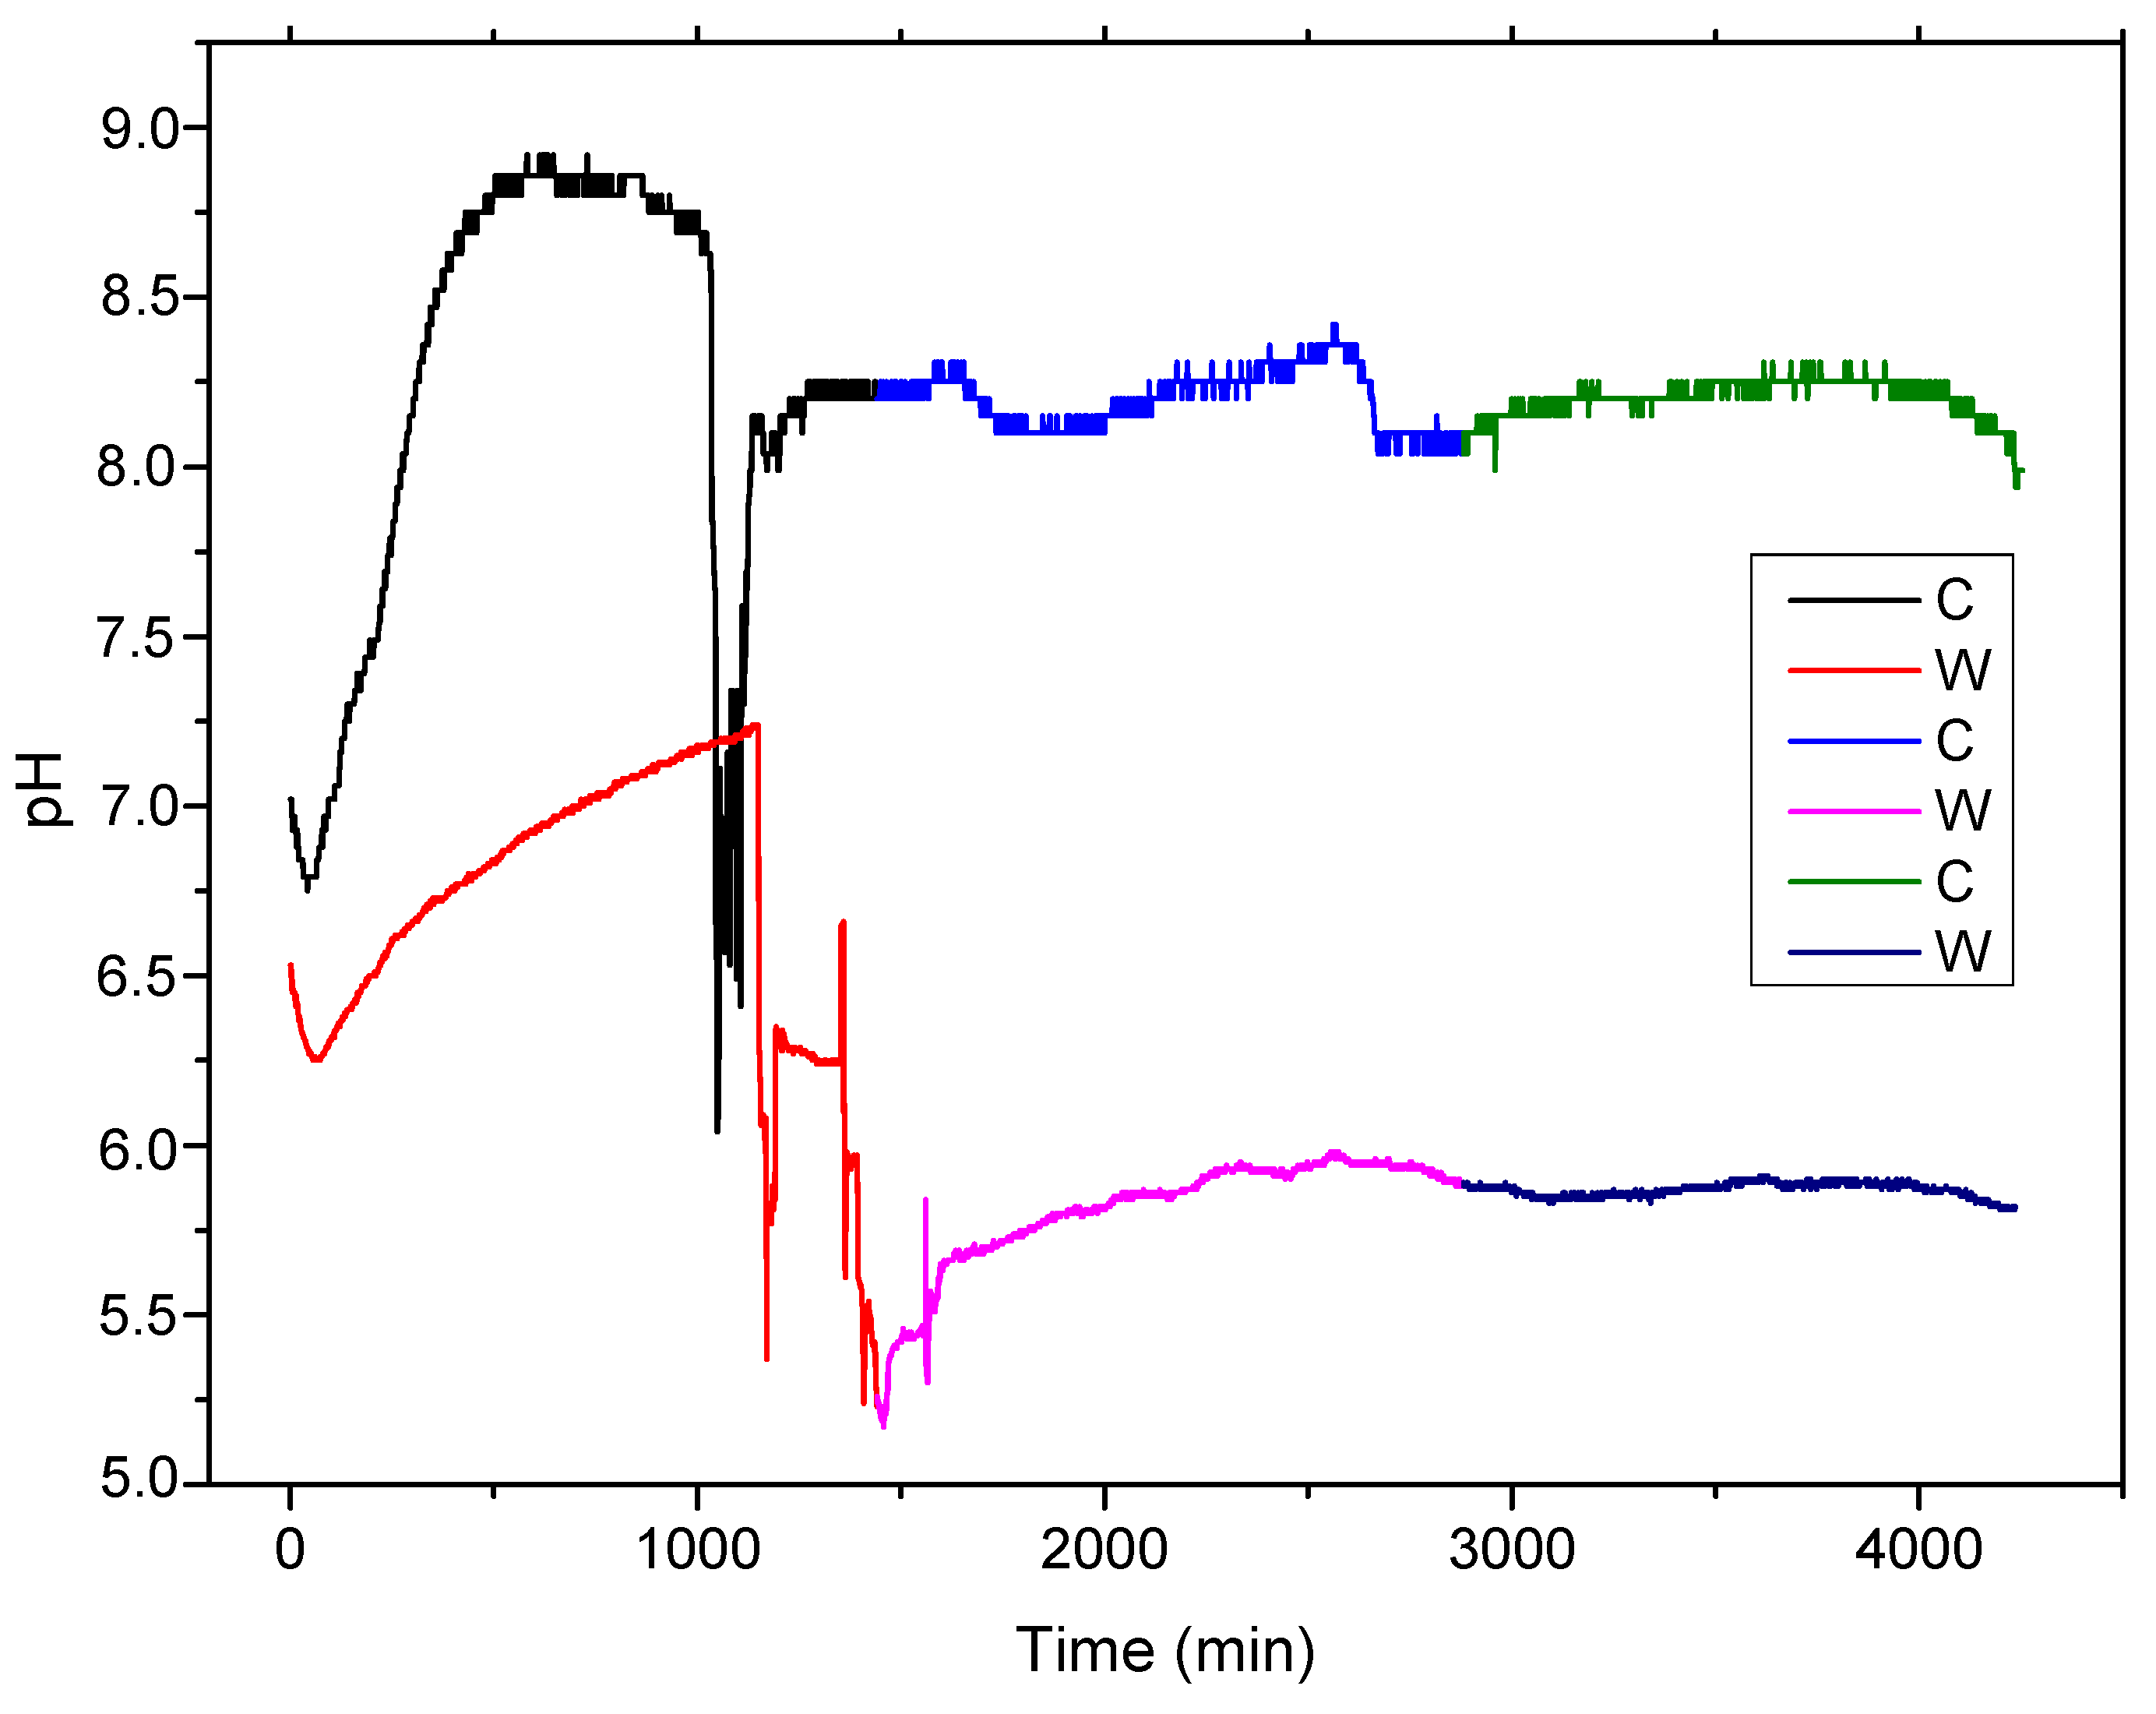
3.2. Electrolyte Solution pH Variation in Contact with Metallic Sample Analysis
3.3. Immersion Experiments Analyses
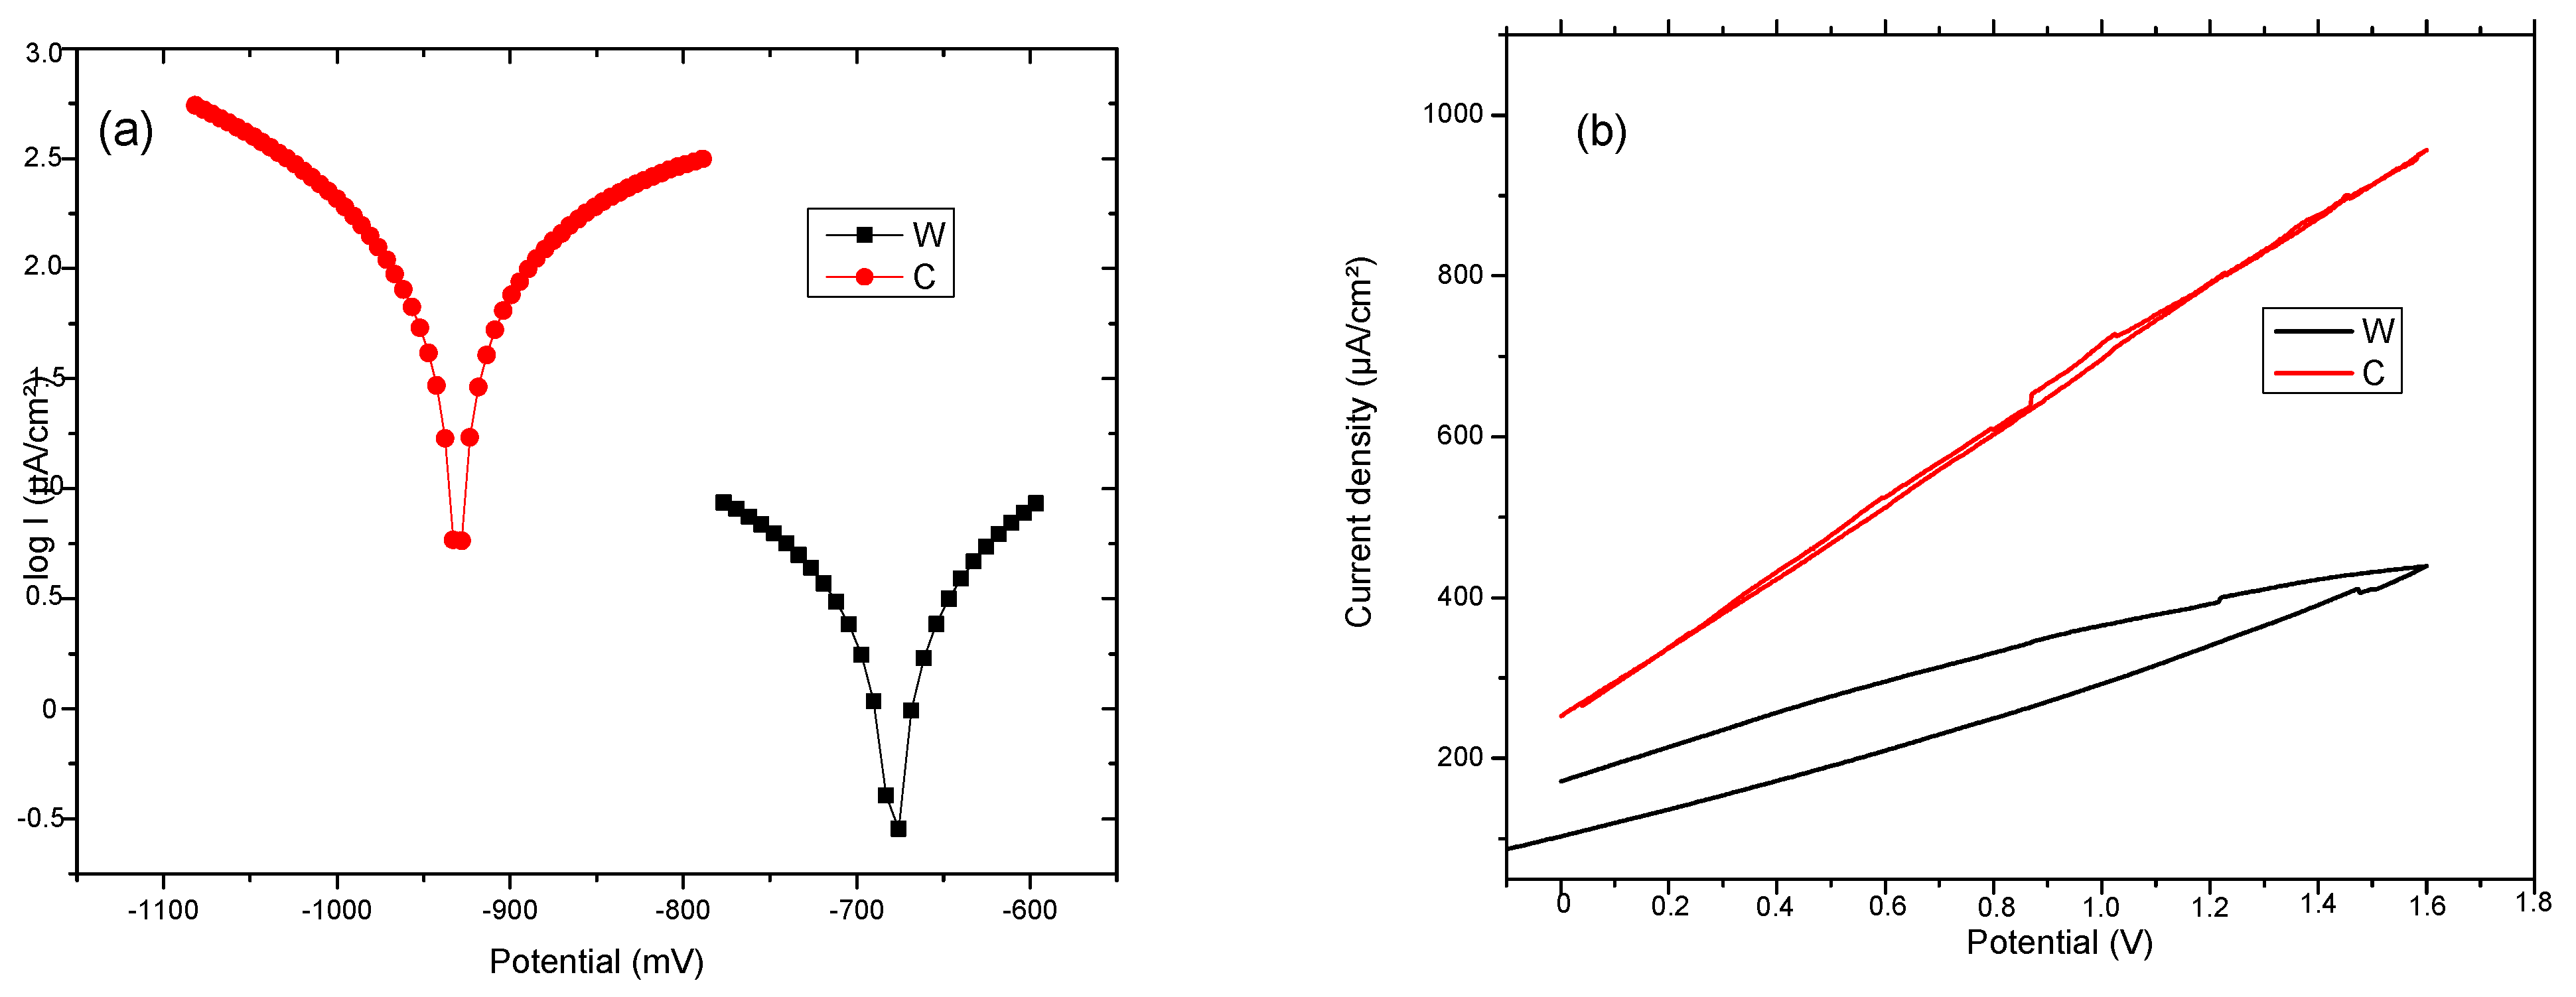
3.4. Electro-Chemical Corrosion Resistance
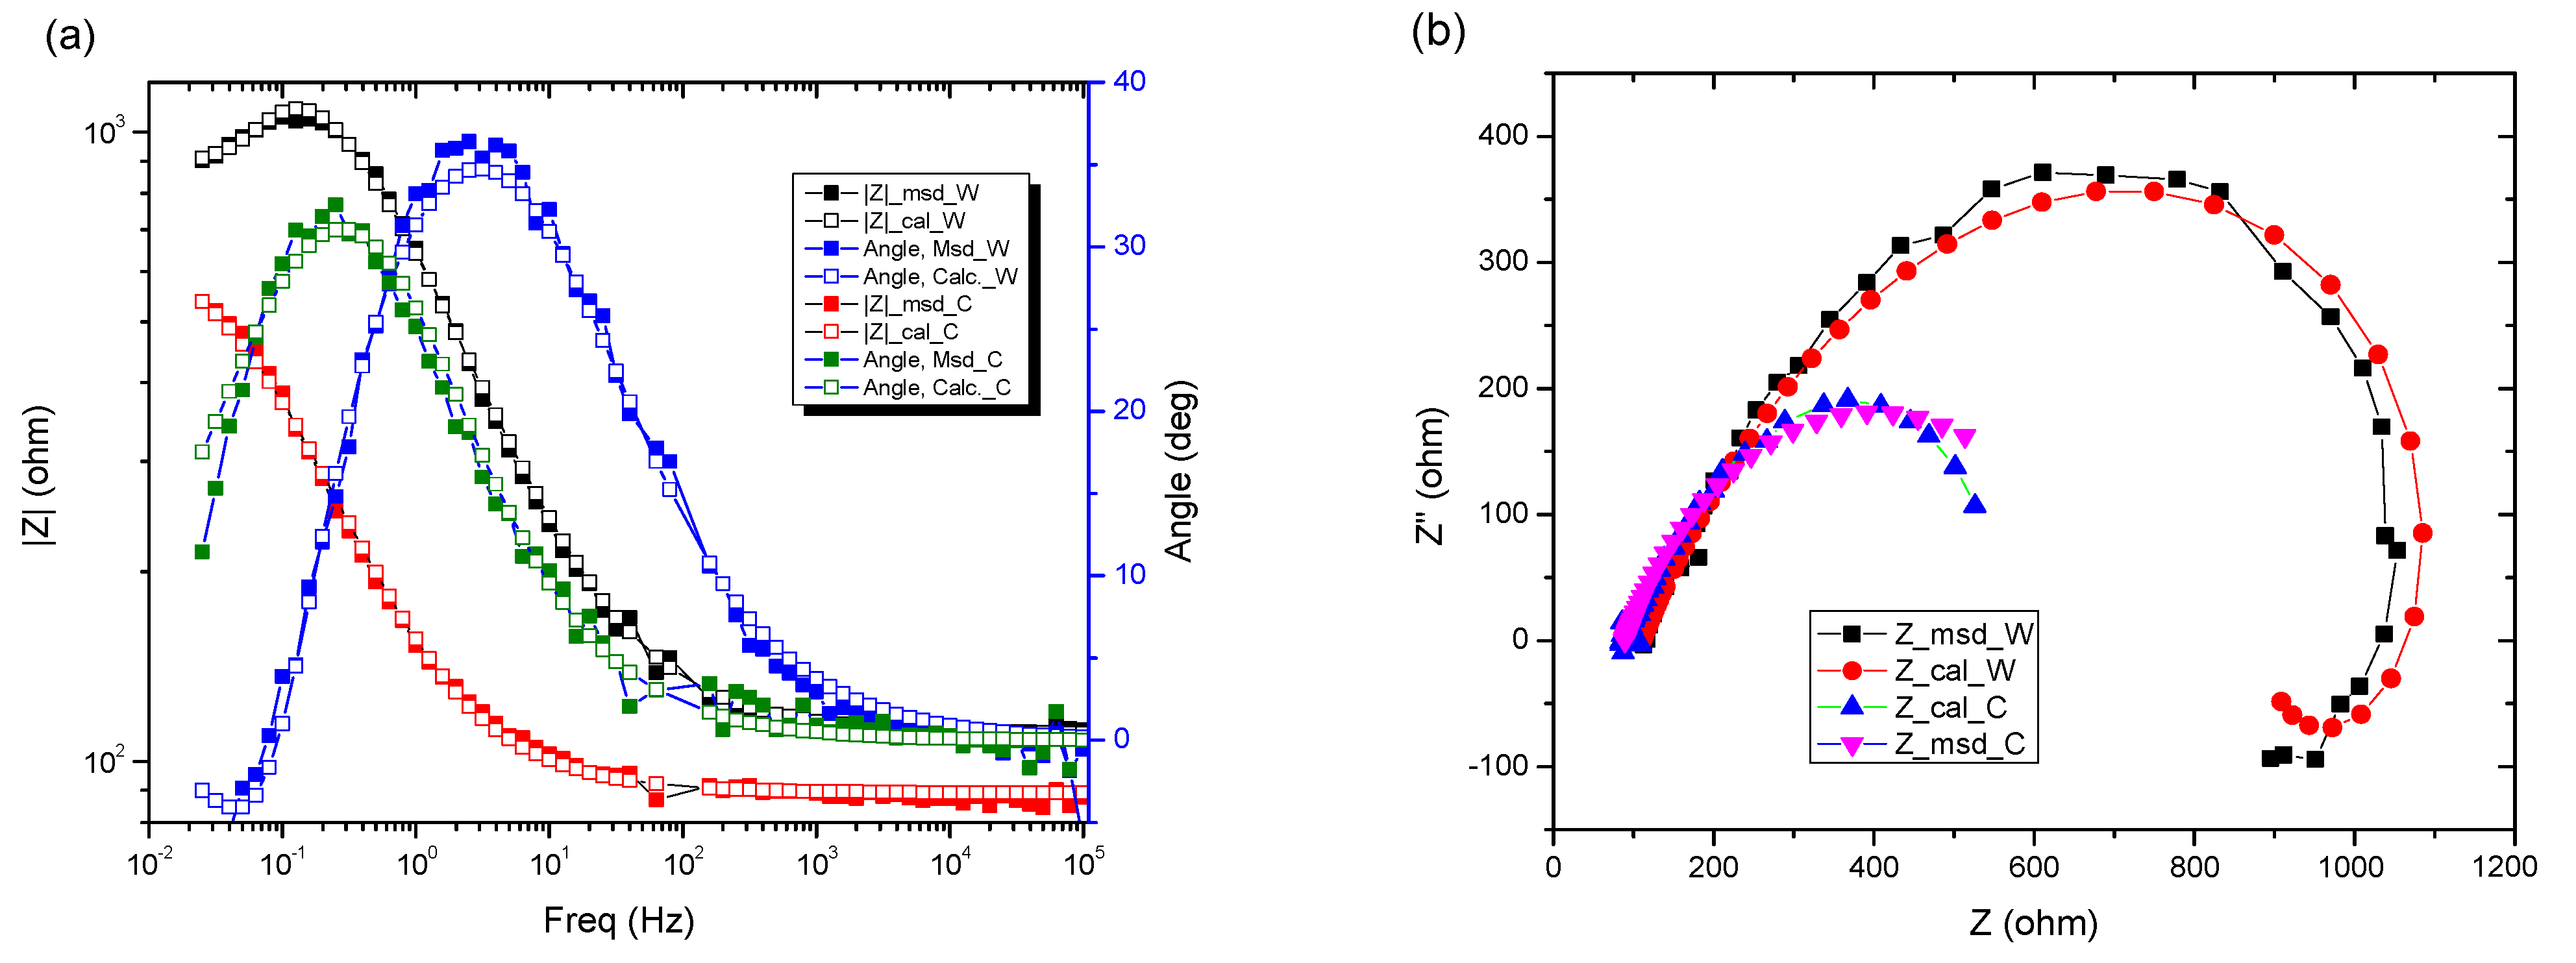
3.5. Electro-Impedance Spectroscopy (EIS) Experiments
4. Conclusions
- A smart Fe-based biodegradable alloy can be applied to the medical field with a proper thermo-mechanical treatment to modify the transformation temperatures;
- Reactions between the alloy and electrolyte modify the pH of the environment;
- The cast sample presents a higher corrosion rate than the wrought one based on the microstructure arrangement, microstructural defects, or grain dimension being suitable for certain medical applications;
- The corrosion current density jcorr value for W, which is directly proportional to the corrosion rate, is lower than the value compared for C. This can be attributed to the surface defects on the sample C;
- Based on the analysis of cyclic polarization diagrams, it can be observed that there is not any significant difference between the two samples. They present uniform (generalized) corrosion when polarized anodically;
- The data obtained from EIS experiments show that, for these systems, the behavior in solution can be described by using a circuit equivalent to a single time constant; a Randles-type circuit, which indicates that the corrosion occurs on the entire surface of the sample (generalized corrosion) by a single chemical reaction (most likely corrosion of iron with the formation of soluble and insoluble products).
Author Contributions
Funding
Institutional Review Board Statement
Informed Consent Statement
Data Availability Statement
Acknowledgments
Conflicts of Interest
References
- Hermawan, H.; Mantovani, D. Degradable metallic biomaterials: The concept, current developments and future directions. Minerva Biotecnol. 2009, 21, 207–216. [Google Scholar]
- Datta, M.K.; Chou, D.T.; Hong, D.; Saha, P.; Chung, S.J.; Lee, B.; Sirinterlikci, A.; Ramanathan, M.; Roy, A.; Kumta, P.N. Structure and Thermal Stability of Bio-Degradable Mg–Zn–Ca Based Amorphous Alloys Synthesized by Mechanical Alloying. Mater. Sci. Eng. B 2011, 176, 1637–1643. [Google Scholar] [CrossRef]
- Wegener, B.; Sievers, B.; Utzschneider, S.; Müller, P.; Jansson, V.; Rößler, S.; Nies, B.; Stephani, G.; Kieback, B.; Quadbeck, P. Microstructure, Cytotoxicity and Corrosion of Powdermetallurgical Iron Alloys for Biodegradable Bone Replacement Materials. Mater. Sci. Eng. B 2011, 176, 1789–1796. [Google Scholar] [CrossRef]
- Moravej, M.; Prima, F.; Fiset, M.; Mantovani, D. Electroformed iron as new biomaterial for degradable stents: Development process and structure-properties relationship. Acta Biomater. 2010, 6, 1726–1735. [Google Scholar] [CrossRef] [PubMed]
- Hermawan, H.; Dube, D.; Mantovani, D. Developments in Metallic Biodegradable Stents. Acta Biomater. 2010, 6, 1693–1697. [Google Scholar] [CrossRef]
- El-Omar, M.M.; Dangas, G.; Iakovou, I.; Mehran, R. Update on in-stent restenosis. Curr. Intervent. Cardiol. Rep. 2001, 3, 296–305. [Google Scholar]
- Schomig, A.; Kastrati, A.; Mudra, H.; Blasini, R.; Schuhlen, H.; Klauss, V.; Richardt, G.; Neumann, F.J. Four-year experience with Palmaz-Schatz stenting in coronary angioplasty complicated by dissection with threatened or present vessel closure. Circulation 1994, 90, 2716–2724. [Google Scholar] [CrossRef] [Green Version]
- Serruys, P.W.; Kutryk, M.J.; Ong, A.T. Coronary-artery stents. N. Engl. J. Med. 2006, 354, 483–495. [Google Scholar] [CrossRef] [Green Version]
- Hermawan, H.; Mantovani, D. New generation of medical implants: Metallic biodegradable coronary stent. In Proceedings of the International Conference on Instrumentation, Communications, Information Technology, and Biomedical Engineering (ICICI-BME), Bandung, Indonesia, 8–9 November 2011; pp. 399–402. [Google Scholar]
- Hänzi, A.C.; Metlar, A.; Schinhammer, M.; Aguib, H.; Lüth, T.C.; Löffler, J.F.; Uggowitzer, P.J. Biodegradable wound-closing devices for gastrointestinal interventions: Degradation performance of the magnesium tip. Mater. Sci. Eng. C 2011, 3, 1098–1103. [Google Scholar] [CrossRef]
- Chng, C.B.; Lau, D.P.; Choo, J.Q.; Chui, C.K. A bio-absorbable micro-clip for laryngeal microsurgery—Design and evaluation. Acta Biomater. 2012, 8, 2835–2844. [Google Scholar] [CrossRef] [PubMed]
- Mueller, P.P.; May, T.; Perz, A.; Hauser, H.; Peuster, M. Control of smooth muscle cell proliferation by ferrous iron. Biomaterials 2006, 27, 2193–2200. [Google Scholar] [CrossRef]
- Fontcave, M.; Pierre, J.L. Iron: Metabolism, toxicity and therapy. Biochimie 1993, 75, 767–773. [Google Scholar] [CrossRef]
- Zhu, S.; Huang, N.; Xu, L.; Zhang, Y.; Liu, H.; Sun, H.; Leng, Y. Biocompatibility of pure iron: In vitro assessment of degradation kinetics and cytotoxicity on endothelial cells. Mater. Sci. Eng. C 2009, 29, 1589–1592. [Google Scholar] [CrossRef]
- Peuster, M.; Wohlsein, P.; Brugmann, M.; Ehlerding, M.; Seidler, K.; Fink, C.; Brauer, H.; Fischer, A.; Hausdorf, G. A novel approach to temporary stenting: Degradable cardiovascular stents produced from corrodible metal-results 6–18 months after implantation into New Zealand white rabbits. Heart 2001, 86, 563–569. [Google Scholar] [CrossRef] [Green Version]
- Dargusch, M.S.; Dehghan-Manshadi, A.; Shahbazi, M.; Venezuela, J.; Tran, X.; Song, J.; Liu, N.; Xu, C.; Ye, Q.; Wen, C. Exploring the Role of Manganese on the Microstructure, Mechanical Properties, Biodegradability, and Biocompatibility of Porous Iron-Based Scaffolds. ACS Biomater. Sci. Eng. 2019, 5, 1686–1702. [Google Scholar] [CrossRef]
- Zhang, Y.S.; Zhu, X.M.; Zhong, S.H. Effect of alloying elements on the electrochemical polarization behavior and passive film of Fe–Mn base alloys in various aqueous solutions. Corros. Sci. 2004, 46, 853–876. [Google Scholar] [CrossRef]
- Heiden, M.; Walker, E.; Nauman, E.; Stanciu, L. Evolution of novel bioresorbable iron-manganese implant surfaces and their degradation behaviors in vitro. J. Biomed. Mater. Res. A 2015, 103, 185–193. [Google Scholar] [CrossRef] [PubMed]
- Hermawan, H.; Moravej, M.; Dube, D.; Mantovani, D. Degradation behaviour of metallic biomaterials for degradable stents. Adv. Mater. Res. 2007, 15, 113–118. [Google Scholar]
- Hermawan, H.; Purnama, A.; Dube, D.; Couet, J.; Mantovani, D. Fe–Mn alloys for metallic biodegradable stents: Degradation and cell viability studies. Acta Biomater. 2010, 6, 1852–1860. [Google Scholar] [CrossRef] [PubMed]
- Hermawan, H.; Dubé, D.; Mantovani, D. Degradable metallic biomaterials: Design and development of Fe-Mn alloys for stents. J. Biomed. Mater. Res. A 2010, 93, 1–11. [Google Scholar] [CrossRef]
- Hermawan, H.; Mantovani, D. Process of prototyping coronary stents from biodegradable Fe–Mn alloys. Acta Biomater. 2013, 9, 8585–8592. [Google Scholar] [CrossRef]
- Schinhammer, M.; Hänzi, A.C.; Löffler, J.F.; Uggowitzer, P.J. Design Strategy for Biodegradable Fe-Based Alloys for Medical Applications. Acta Biomater. 2010, 6, 1705–1713. [Google Scholar] [CrossRef]
- Liu, B.; Zheng, Y.F. Effects of Alloying Elements (Mn, Co., Al, W, Sn, B, C and S) on Biodegradability and In Vitro Biocompatibility of Pure Iron. Acta Biomater. 2011, 7, 1407–1420. [Google Scholar] [CrossRef]
- Hermawan, H. Biodegradable Metals—From Concept to Applications; Springer: Berlin, Germany, 2012. [Google Scholar]
- Wada, M.; Naoi, H.; Yasuda, H.; Maruyama, T. Shape recovery characteristics of biaxially prestrained Fe–Mn–Si-based shape memory alloy. Mater. Sci. Eng. A. 2008, 481, 178–182. [Google Scholar] [CrossRef] [Green Version]
- Wang, Y.; Venezuela, J.; Dargusch, M. Biodegradable shape memory alloys: Progress and prospects. Biomaterials 2021, 279, 121215. [Google Scholar] [CrossRef] [PubMed]
- Liu, B.; Zheng, Y.F.; Ruan, L. In vitro investigation of Fe30Mn6Si shape memory alloy as potential biodegradable metallic material. Mater. Lett. 2011, 65, 540–543. [Google Scholar] [CrossRef]
- Cimpoesu, N.; Săndulache, F.; Istrate, B.; Cimpoeșu, R.; Zegan, G. Electrochemical Behavior of Biodegradable FeMnSi–MgCa Alloy. Metals 2018, 8, 541. [Google Scholar] [CrossRef] [Green Version]
- Burduhos-Nergis, D.P.; Vasilescu, G.D.; Burduhos-Nergis, D.D.; Cimpoesu, R.; Bejinariu, C. Phosphate Coatings: EIS and SEM Applied to Evaluate the Corrosion Behavior of Steel in Fire Extinguishing Solution. Appl. Sci. 2021, 11, 7802. [Google Scholar] [CrossRef]
- Cimpoesu, N.; Mihalache, E.; Lohan, N.M.; Suru, M.G.; Comaneci, R.I.; Ozkal, B.; Bujoreanu, L.G.; Pricop, B. Structural-morphological fluctuations induced by thermomechanical treatment in a Fe—Mn—Si Shape memory alloy. Met. Sci. Heat Treat. 2018, 60, 471–477. [Google Scholar] [CrossRef]
- Rahman, R.A.; Juhre, D.; Halle, T.; Mehmood, S.; Asghar, W. Types, DSC Thermal Characterization of Fe-Mn-Si based Shape Memory Smart Materials and their Feasibility for Human Body in Terms of Austenitic Start Temperatures. J. Eng. Technol. 2019, 8, 185–206. [Google Scholar]
- Li, H.; Dunne, D.; Kennon, N. Factors influencing shape memory effect and phase transformation behaviour of Fe–Mn–Si based shape memory alloys. Mater. Sci. Eng. A 1999, 273, 517–523. [Google Scholar] [CrossRef]
- Donner, P.; Hornbogen, E.; Sade, M. Shape memory effects in melt-spun Fe-Mn-Si alloys. J. Mater. Sci. Lett. 1989, 8, 37–40. [Google Scholar] [CrossRef]
- Forsberg, A.; Ågren, J. Thermodynamic evaluation of the Fe-Mn-Si system and the γ/ε martensitic transformation. J. Phase Equilib. 1993, 14, 354–363. [Google Scholar] [CrossRef]
- Stanford, N.; Dunne, D.P. Martensite/particle interactions and the shape memory effect in an Fe–Mn–Si-based alloy. J. Mater. Sci. 2007, 42, 4334–4343. [Google Scholar] [CrossRef]
- Dogan, A.; Arslan, H. Effect of ball-milling conditions on microstructure during production of Fe–20Mn–6Si–9Cr shape memory alloy powders by mechanical alloying. J. Therm. Anal. Calorim. 2012, 109, 933–938. [Google Scholar] [CrossRef]
- Ariapour, A.; Perovic, D.D.; Yakubtsov, I. Shape-memory effect and strengthening mechanism in an Nb and N-doped Fe-Mn-Si-based alloy. Metall. Mater. Trans. A 2001, 32, 1621–1628. [Google Scholar] [CrossRef]
- Jiang, B.H.; Qi, X.A.; Zhou, W.M.; Xi, Z.L.; Hsu, T.Y. The effect of nitrogen on shape memory effect in Fe-Mn-Si alloys. Scr. Mater. 1996, 34, 1437–1441. [Google Scholar] [CrossRef]
- Eyercioglu, O.; Kanca, E.; Pala, M.; Ozbay, E. Prediction of martensite and austenite start temperatures of the Fe-based shape memory alloys by artificial neural networks. J. Mater. Proc. Technol. 2008, 200, 146–152. [Google Scholar] [CrossRef]
- Tomota, Y.; Nakagawara, W.; Tsuzaki, K.; Maki, T. Reversion of stress-induced ϵ martensite and two-way shape memory in Fe-24Mn and Fe-24Mn-6Si alloys. Scr. Metall. Mater. 1992, 26, 1571–1574. [Google Scholar] [CrossRef]
- Tsuzaki, K.; Murakami, Y.; Natsume, Y.; Maki, T. Role of pre-straining of austenite in the improvement of shape memory effect in an Fe-33Mn-6Si alloy. In Proceedings of the Symposium K: Environment Conscious Materials of the 3rd IUMRS International Conference on Advanced Materials, Ikebukuro, Tokyo, Japan, 31 August–4 September 1994; pp. 961–964. [Google Scholar]
- Gavriljuk, V.G.; Bliznuk, V.V.; Shanina, B.D.; Kolesnik, S.P. Effect of silicon on atomic distribution and shape memory in Fe–Mn base alloys. Mater. Sci. Eng. A 2005, 406, 1–10. [Google Scholar] [CrossRef]
- Kikuchi, T.; Kajiwara, S.; Tomota, Y. Microscopic Studies on Stress-induced Martensite Transformation and Its Reversion in an Fe–Mn–Si–Cr–Ni Shape Memory Alloy. Mater. Trans. JIM 1995, 36, 719–728. [Google Scholar] [CrossRef] [Green Version]
- Sawaguchi, T.; Maruyama, T.; Otsuka, H.; Kushibe, A.; Inoue, Y.; Tsuzaki, K. Design concept and applications of Fe-Mn-Si-based alloys-from shape-memory to seismic response control. Mater. Trans. 2016, 57, 283–293. [Google Scholar] [CrossRef] [Green Version]
- Remy, L.; Pineau, A. Twinning and strain-induced F.C.C. → H.C.P. transformation in the Fe Mn Cr C system. Mater. Sci. Eng. 1977, 28, 99–107. [Google Scholar] [CrossRef]
- Cimpoesu, N.; Trinca, L.C.; Bulai, G.; Stanciu, S.; Gurlui, S.; Mareci, D. Electrochemical Characterization of a New Biodegradable FeMnSi Alloy Coated with Hydroxyapatite-Zirconia by PLD Technique. J. Chem. N. Y. 2016, 2016, 9520972. [Google Scholar] [CrossRef] [Green Version]
- Mouzou, E.; Paternoster, C.; Tolouei, R.; Purnama, A.; Chevallier, P.; Dubé, D.; Prima, F.; Mantovani, D. In vitro degradation behavior of Fe–20Mn–1.2C alloy in three different pseudo-physiological solutions. Mater. Sci. Eng. C 2016, 61, 564–573. [Google Scholar] [CrossRef]
- Babacan, N.; Kochta, F.; Hoffmann, V.; Gemming, T.; Kühn, U.; Giebeler, L.; Gebert, A.; Hufenbach, J. Effect of silver additions on the microstructure, mechanical properties and corrosion behavior of biodegradable Fe-30Mn-6Si. Mat. Tod. Comm. 2021, 28, 102689. [Google Scholar] [CrossRef]
- Wolff, U.; Schneider, F.; Mummert, K.; Schultz, L. Stability and electrochemical properties of passive layers on Fe-Si alloys. Corrosion 2000, 56, 1195–1201. [Google Scholar] [CrossRef]
- Mansfield, F.; Bertocci, U. Electrochemical Corrosion Testing; ASTM STP 1981: Philadelphia, PA, USA, 1981; p. 727. [Google Scholar]
- Conway, B.E.; Bockris, J.O.M.; White, R.E. Modern Aspects of Electrochemistry; Kluwer Academic/Plenum Publishers: New York, NY, USA, 1999; Volume 32, p. 143. [Google Scholar]
- Baciu, E.R.; Cimpoesu, R.; Vitalariu, A.; Baciu, C.; Cimpoesu, N.; Sodor, A.; Zegan, G.; Murariu, A. Surface Analysis of 3D (SLM) Co-Cr-W Dental Metallic Materials. Appl. Sci. 2021, 11, 255. [Google Scholar] [CrossRef]


| Elements/State | Fe | Mn | Si | |||
|---|---|---|---|---|---|---|
| wt% | at% | wt% | at% | wt% | at% | |
| Cast | 82.29 | 79.11 | 13.88 | 13.56 | 3.83 | 7.32 |
| Wrought | 82.16 | 79.33 | 14.47 | 14.2 | 3.37 | 6.48 |
| EDS error % | 0.06 | 0.02 | 0.03 | |||
| Sample | 1 Day | 3 Days | 7 Days | |||
|---|---|---|---|---|---|---|
| Cast Sample (C) | Wrought Sample (W) | Cast Sample (C) | Wrought Sample (W) | Cast Sample (C) | Wrought Sample (W) | |
| Initial mass (mg) | 3182.7 | 563.1 | 2756.6 | 471.9 | 2989.7 | 513.8 |
| Mass after immersion (mg) | 3184.3 (+1.6) | 563.3 (+0.2) | 2756.3 (−0.3) | 465.7 (−6.2) | 2984.3 (−5.4) | 511.5 (−2.3) |
| Mass after ultrasonic cleaning (mg) | 3182.0 (−0.7) | 562.6(−0.5) | 2752.8 (−3.8) | 463.9 (−8.0) | 2983.9 (−5.8) | 510.5 (−3.3) |
| DR (mm/year) | 0.088 | 0.084 | 0.159 | 0.451 | 0.104 | 0.080 |
| El./Samples | Fe | Mn | Si | O | C | Cl | Na | |||||||||
|---|---|---|---|---|---|---|---|---|---|---|---|---|---|---|---|---|
| wt% | at% | wt% | at% | wt% | at% | wt% | at% | wt% | at% | wt% | at% | wt% | at% | |||
| 1 day (I) | C | I | 56.16 | 29.39 | 8.75 | 4.66 | 1.86 | 1.93 | 22.02 | 40.23 | 8.39 | 20.42 | 0.49 | 0.41 | 2.33 | 2.96 |
| I + UC | 67.55 | 42.43 | 12.3 | 7.85 | 2.78 | 3.47 | 5.89 | 12.9 | 11.37 | 33.2 | 0.05 | 0.04 | 0.07 | 0.1 | ||
| W | I | 48.77 | 22.01 | 5.74 | 2.63 | 1.23 | 1.1 | 33.53 | 52.83 | 9.82 | 20.62 | 0.51 | 0.37 | 0.4 | 0.44 | |
| I + UC | 53.11 | 25.8 | 8.38 | 4.14 | 1.77 | 1.71 | 25.06 | 42.49 | 11.32 | 25.57 | 0.32 | 0.25 | 0.05 | 0.06 | ||
| 7 days (I) | C | I | 57.92 | 29.92 | 10.29 | 5.4 | 2.32 | 2.39 | 13.54 | 24.41 | 15.65 | 37.6 | 0.15 | 0.12 | 0.13 | 0.17 |
| I + UC | 56.85 | 28.53 | 9.78 | 4.99 | 1.94 | 1.94 | 14.56 | 25.5 | 16.59 | 38.7 | - | - | 0.28 | 0.34 | ||
| W | I | 45.57 | 19.99 | 7.1 | 3.17 | 1.57 | 1.37 | 32.53 | 49.83 | 11.87 | 24.23 | 0.12 | 0.08 | 1.24 | 1.32 | |
| I + UC | 52.81 | 25.16 | 7.7 | 3.73 | 2.05 | 1.94 | 21.73 | 36.13 | 14.13 | 31.3 | 0.21 | 0.16 | 1.23 | 1.42 | ||
| EDS detector error % | 1.54 | 0.31 | 0.17 | 4.04 | 4.23 | 0.07 | 0.18 | |||||||||
| Sample | Ecorr mV | ba mV | bc mV | Rp ohm·cm² | Jcorr mA/cm² | Vcorr mm/Year |
|---|---|---|---|---|---|---|
| C | −930.7 | 324.8 | −224.3 | 388.57 | 2.17 | 132.9 |
| W | −678.9 | 95.2 | −156.7 | 1000.42 | 0.11 | 24.47 |
| R(QR) | 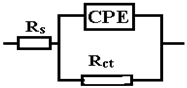 | ||||||
|---|---|---|---|---|---|---|---|
| Rs (ohm·cm2) | 103. Q (S·sn/cm2) | n | Rct (ohm·cm2) | 103.χ2 | |||
| 29.8 | 9.424 | 0.684 | 199.8 | 1.33 | |||
| ε (%): 0.6998 | 2.135 | 1.705 | 3.828 | ||||
| R(QR)(QR) |  | ||||||
| Rs (ohm·cm2) | Q1 (S·sn/cm2) | n1 | R1 (Ω·cm2) | Q2 (S·sn/cm2) | n2 | R2 (Ω·cm2) | 103.χ2 |
| 29.26 | 0.01193 | 0.610 | 73.63 | 0.02281 | 0.9851 | 91.51 | 0.440 |
| ε: 0.6998 | 13.06 | 3.691 | 129.8 | 100.2 | 17.1 | 90.7 | |
| R(CR)(QR) | 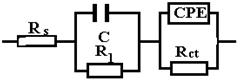 | ||||||
| Rs (ohm·cm2) | C (F/cm2) | R1 (Ω·cm2) | Q (S·sn/cm2) | n | Rct (Ω·cm2) | 103.χ2 | |
| 29.27 | 0.02468 | 85.33 | 0.01175 | 0.612 | 80.47 | 0.438 | |
| ε: 0.6437 | 13.51 | 13.55 | 6.191 | 3.33 | 21.8 | ||
| (R(QR(LR)) | 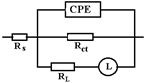 | |||||
|---|---|---|---|---|---|---|
| Rs (ohm·cm2) | Q (S·sn/cm2) | n | Rct (ohm·cm2) | L (Henry·cm2) | RL (ohm·cm2) | 103.χ2 |
| 36.29 | 0.001161 | 0.665 | 424.1 | 1881 | 655.8 | 1.30 |
| ε%: 1.737 | 4.379 | 1.829 | 4.237 | 12.94 | 7.04 | |
Publisher’s Note: MDPI stays neutral with regard to jurisdictional claims in published maps and institutional affiliations. |
© 2022 by the authors. Licensee MDPI, Basel, Switzerland. This article is an open access article distributed under the terms and conditions of the Creative Commons Attribution (CC BY) license (https://creativecommons.org/licenses/by/4.0/).
Share and Cite
Roman, A.M.; Geantă, V.; Cimpoeșu, R.; Munteanu, C.; Lohan, N.M.; Zegan, G.; Cernei, E.R.; Ioniță, I.; Cimpoeșu, N.; Ioanid, N. In-Vitro Analysis of FeMn-Si Smart Biodegradable Alloy. Materials 2022, 15, 568. https://doi.org/10.3390/ma15020568
Roman AM, Geantă V, Cimpoeșu R, Munteanu C, Lohan NM, Zegan G, Cernei ER, Ioniță I, Cimpoeșu N, Ioanid N. In-Vitro Analysis of FeMn-Si Smart Biodegradable Alloy. Materials. 2022; 15(2):568. https://doi.org/10.3390/ma15020568
Chicago/Turabian StyleRoman, Ana Maria, Victor Geantă, Ramona Cimpoeșu, Corneliu Munteanu, Nicoleta Monica Lohan, Georgeta Zegan, Eduard Radu Cernei, Iulian Ioniță, Nicanor Cimpoeșu, and Nicoleta Ioanid. 2022. "In-Vitro Analysis of FeMn-Si Smart Biodegradable Alloy" Materials 15, no. 2: 568. https://doi.org/10.3390/ma15020568
APA StyleRoman, A. M., Geantă, V., Cimpoeșu, R., Munteanu, C., Lohan, N. M., Zegan, G., Cernei, E. R., Ioniță, I., Cimpoeșu, N., & Ioanid, N. (2022). In-Vitro Analysis of FeMn-Si Smart Biodegradable Alloy. Materials, 15(2), 568. https://doi.org/10.3390/ma15020568