
Flexural Tensile Strength of Concrete with Synthetic Fibers


Abstract
:1. Introduction
2. Materials and Methods
2.1. Materials
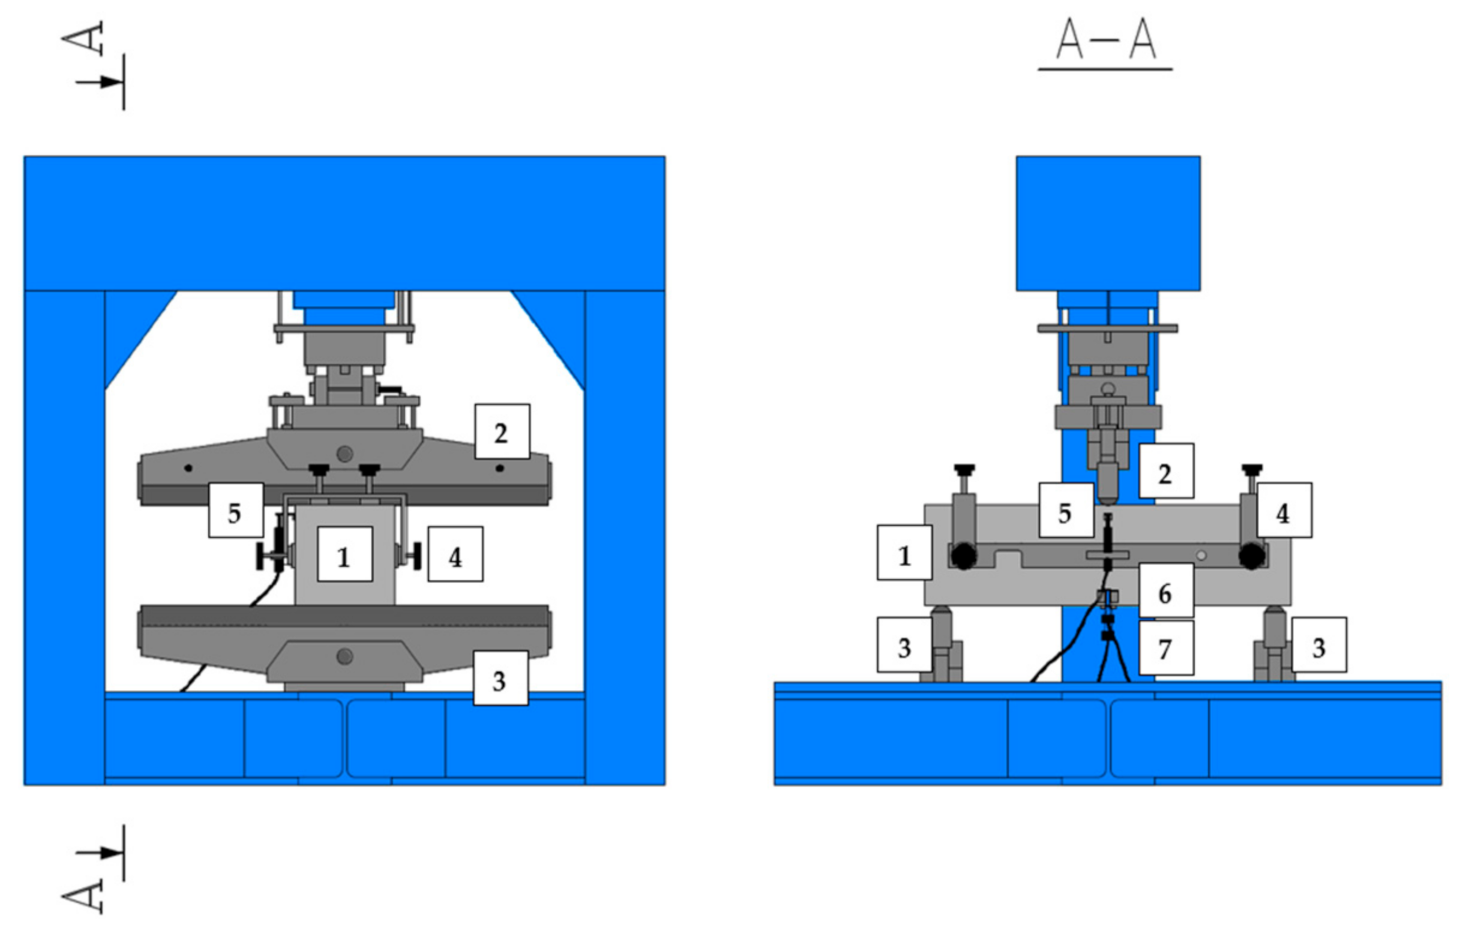
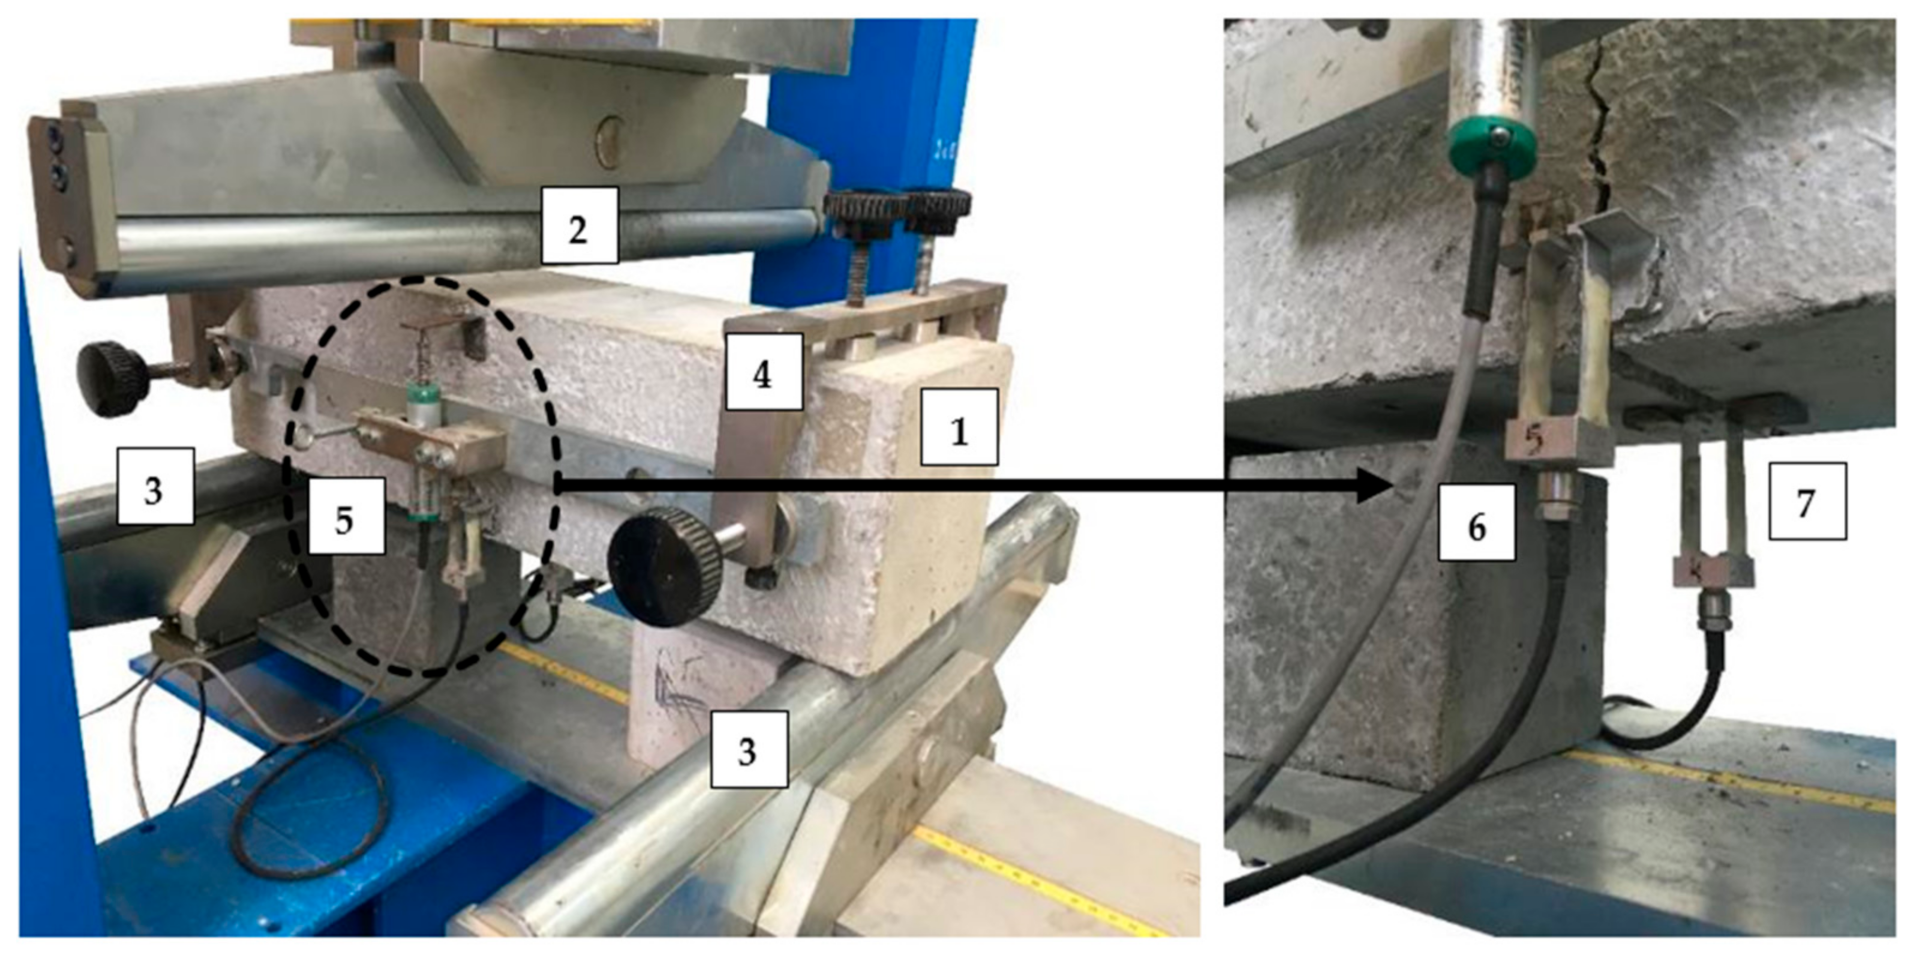
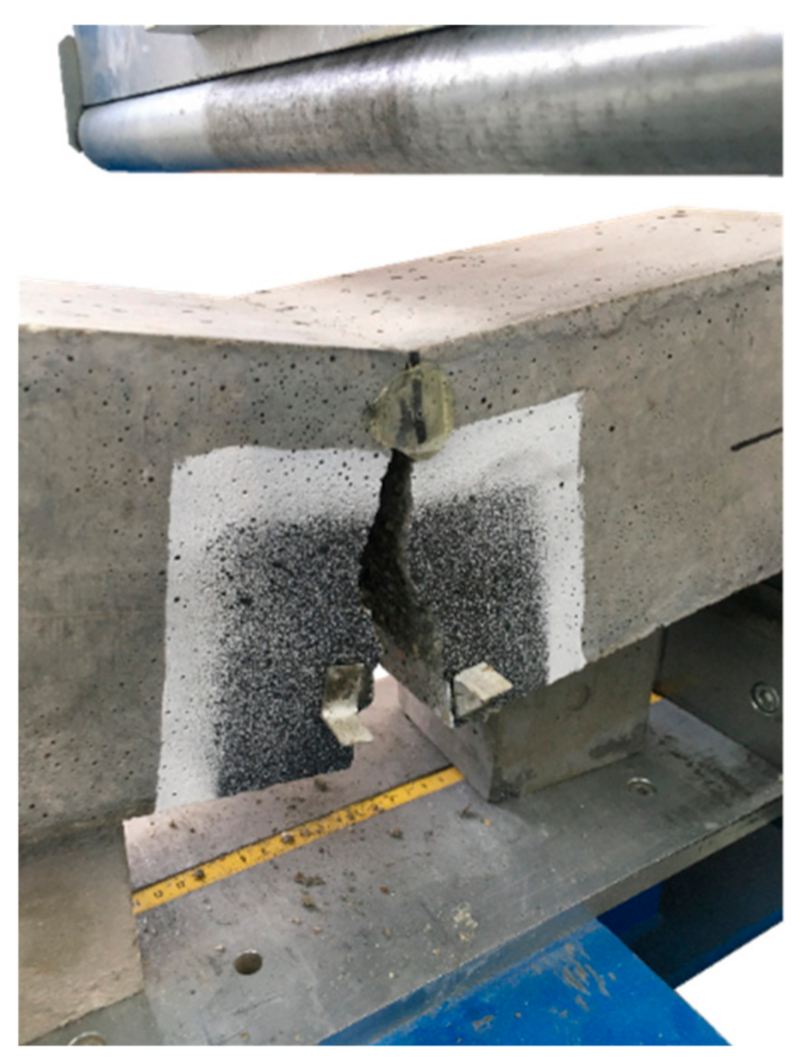
2.2. Methods
- limit of proportionality [N/mm2];
- —residual flexural tensile strength corresponding to CMOD = CMODj or δ = δj (j = 1, 2, 3, 4) [N/mm2];
- —load corresponding to the limit of proportionality [N];
- —load corresponding to CMOD = CMODj or δ = δj (j = 1, 2, 3, 4) [N];
- —span length [mm]—500 mm;
- —width of the specimen [mm]—150 mm;
- —distance between the tip of the notch and the top of the specimen [mm]—150 mm–25 mm = 125 mm.
3. Results and Discussion
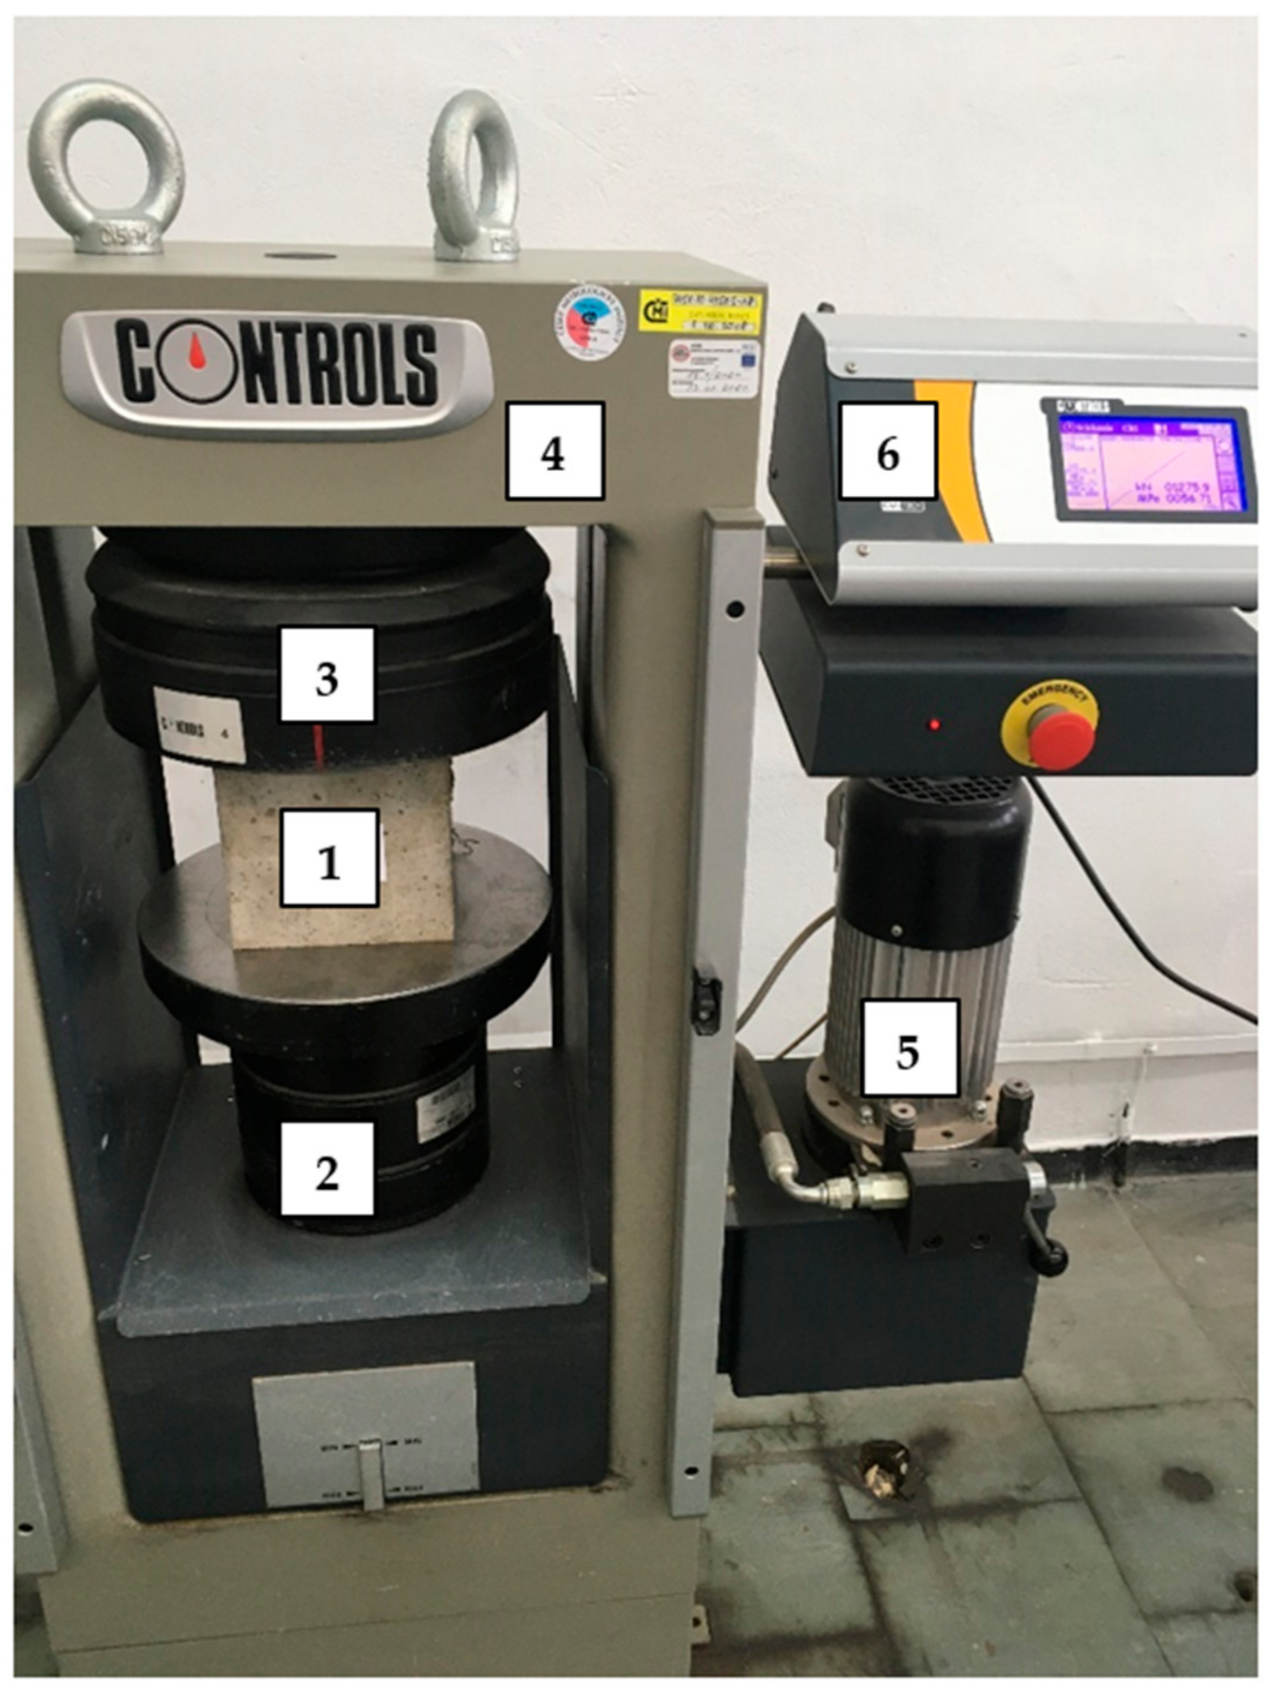
3.1. Compressive Strength
- n—number of samples (n = 6 or 5) [-];
- sfc—standard deviation of compressive strength [MPa];
- tn-1,α—with a confidence level of α = 0.05, for six samples (n − 1 = 5) − t5;0.05 = 1.67, for five samples (n − 1 = 4) − t4;0.05 = 1.46 [-].
3.2. Flexural Tensile Strength
3.2.1. Empirical Equations for Flexural Tensile Strength
3.2.2. Fiber-Reinforced Concrete Classification
- —characteristic limit of proportionality [N/mm2],
- —mean limit of proportionality [N/mm2],
- fR,jk—characteristic residual flexural tensile strength corresponding to CMOD = CMODj or δ = δj (j = 1,2,3,4) [N/mm2],
- fR,jm—mean residual flexural tensile strength corresponding to CMOD = CMODj or δ = δj (j = 1,2,3,4) [N/mm2],
- —standard deviation of from [N/mm2] calculated from Equation (11);
- sR,j—standard deviation of fR,j from fR,jm [N/mm2] calculated from Equation (12)where:
3.3. Fracture Energy and Toughness
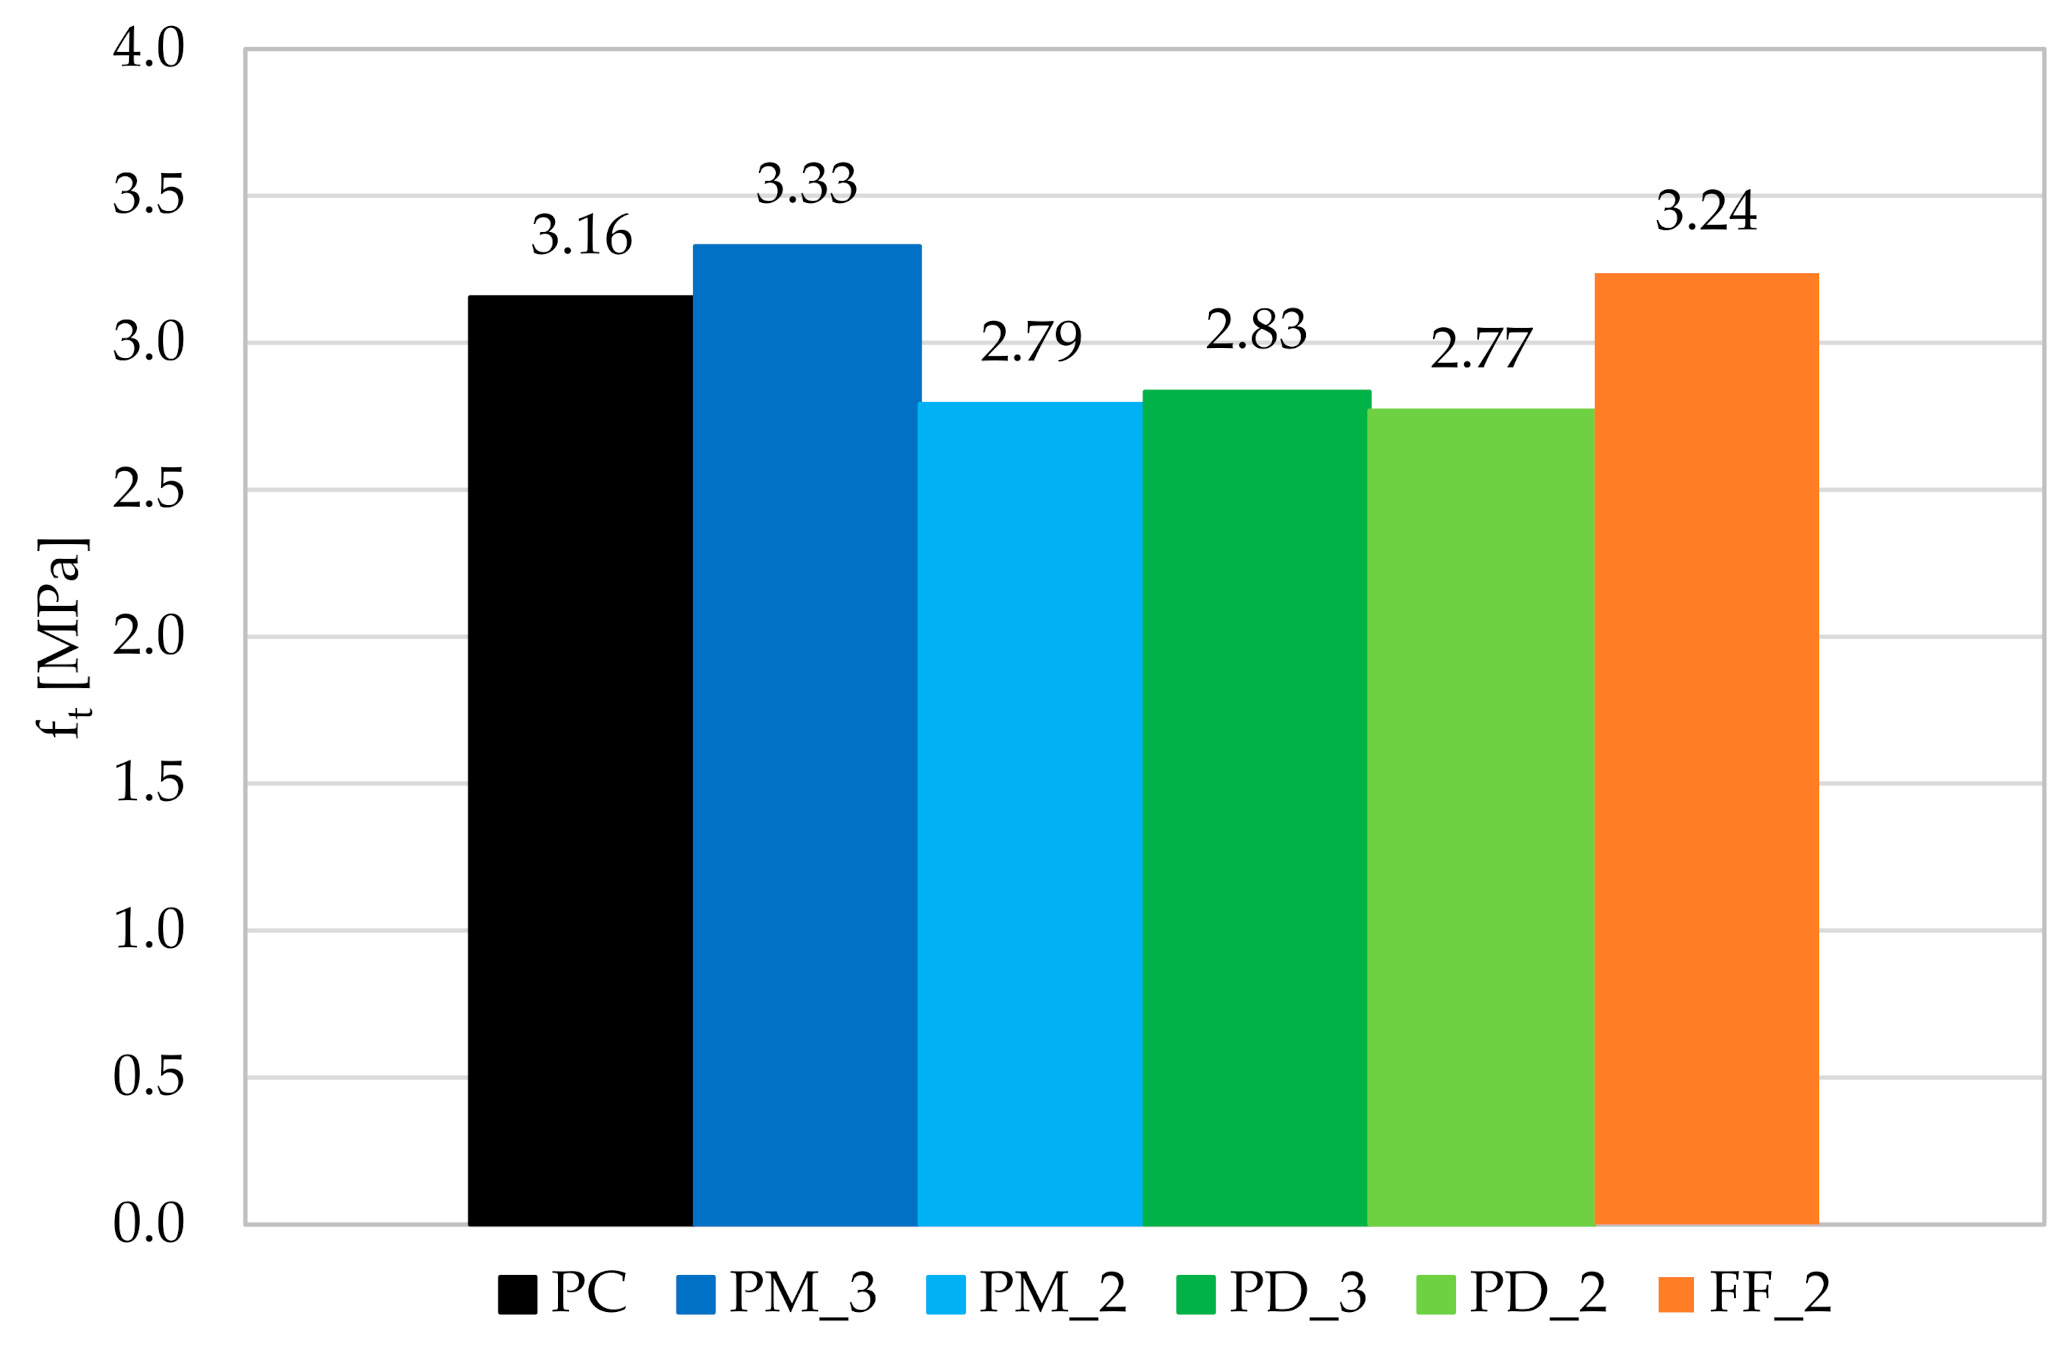
3.4. Tensile Strength
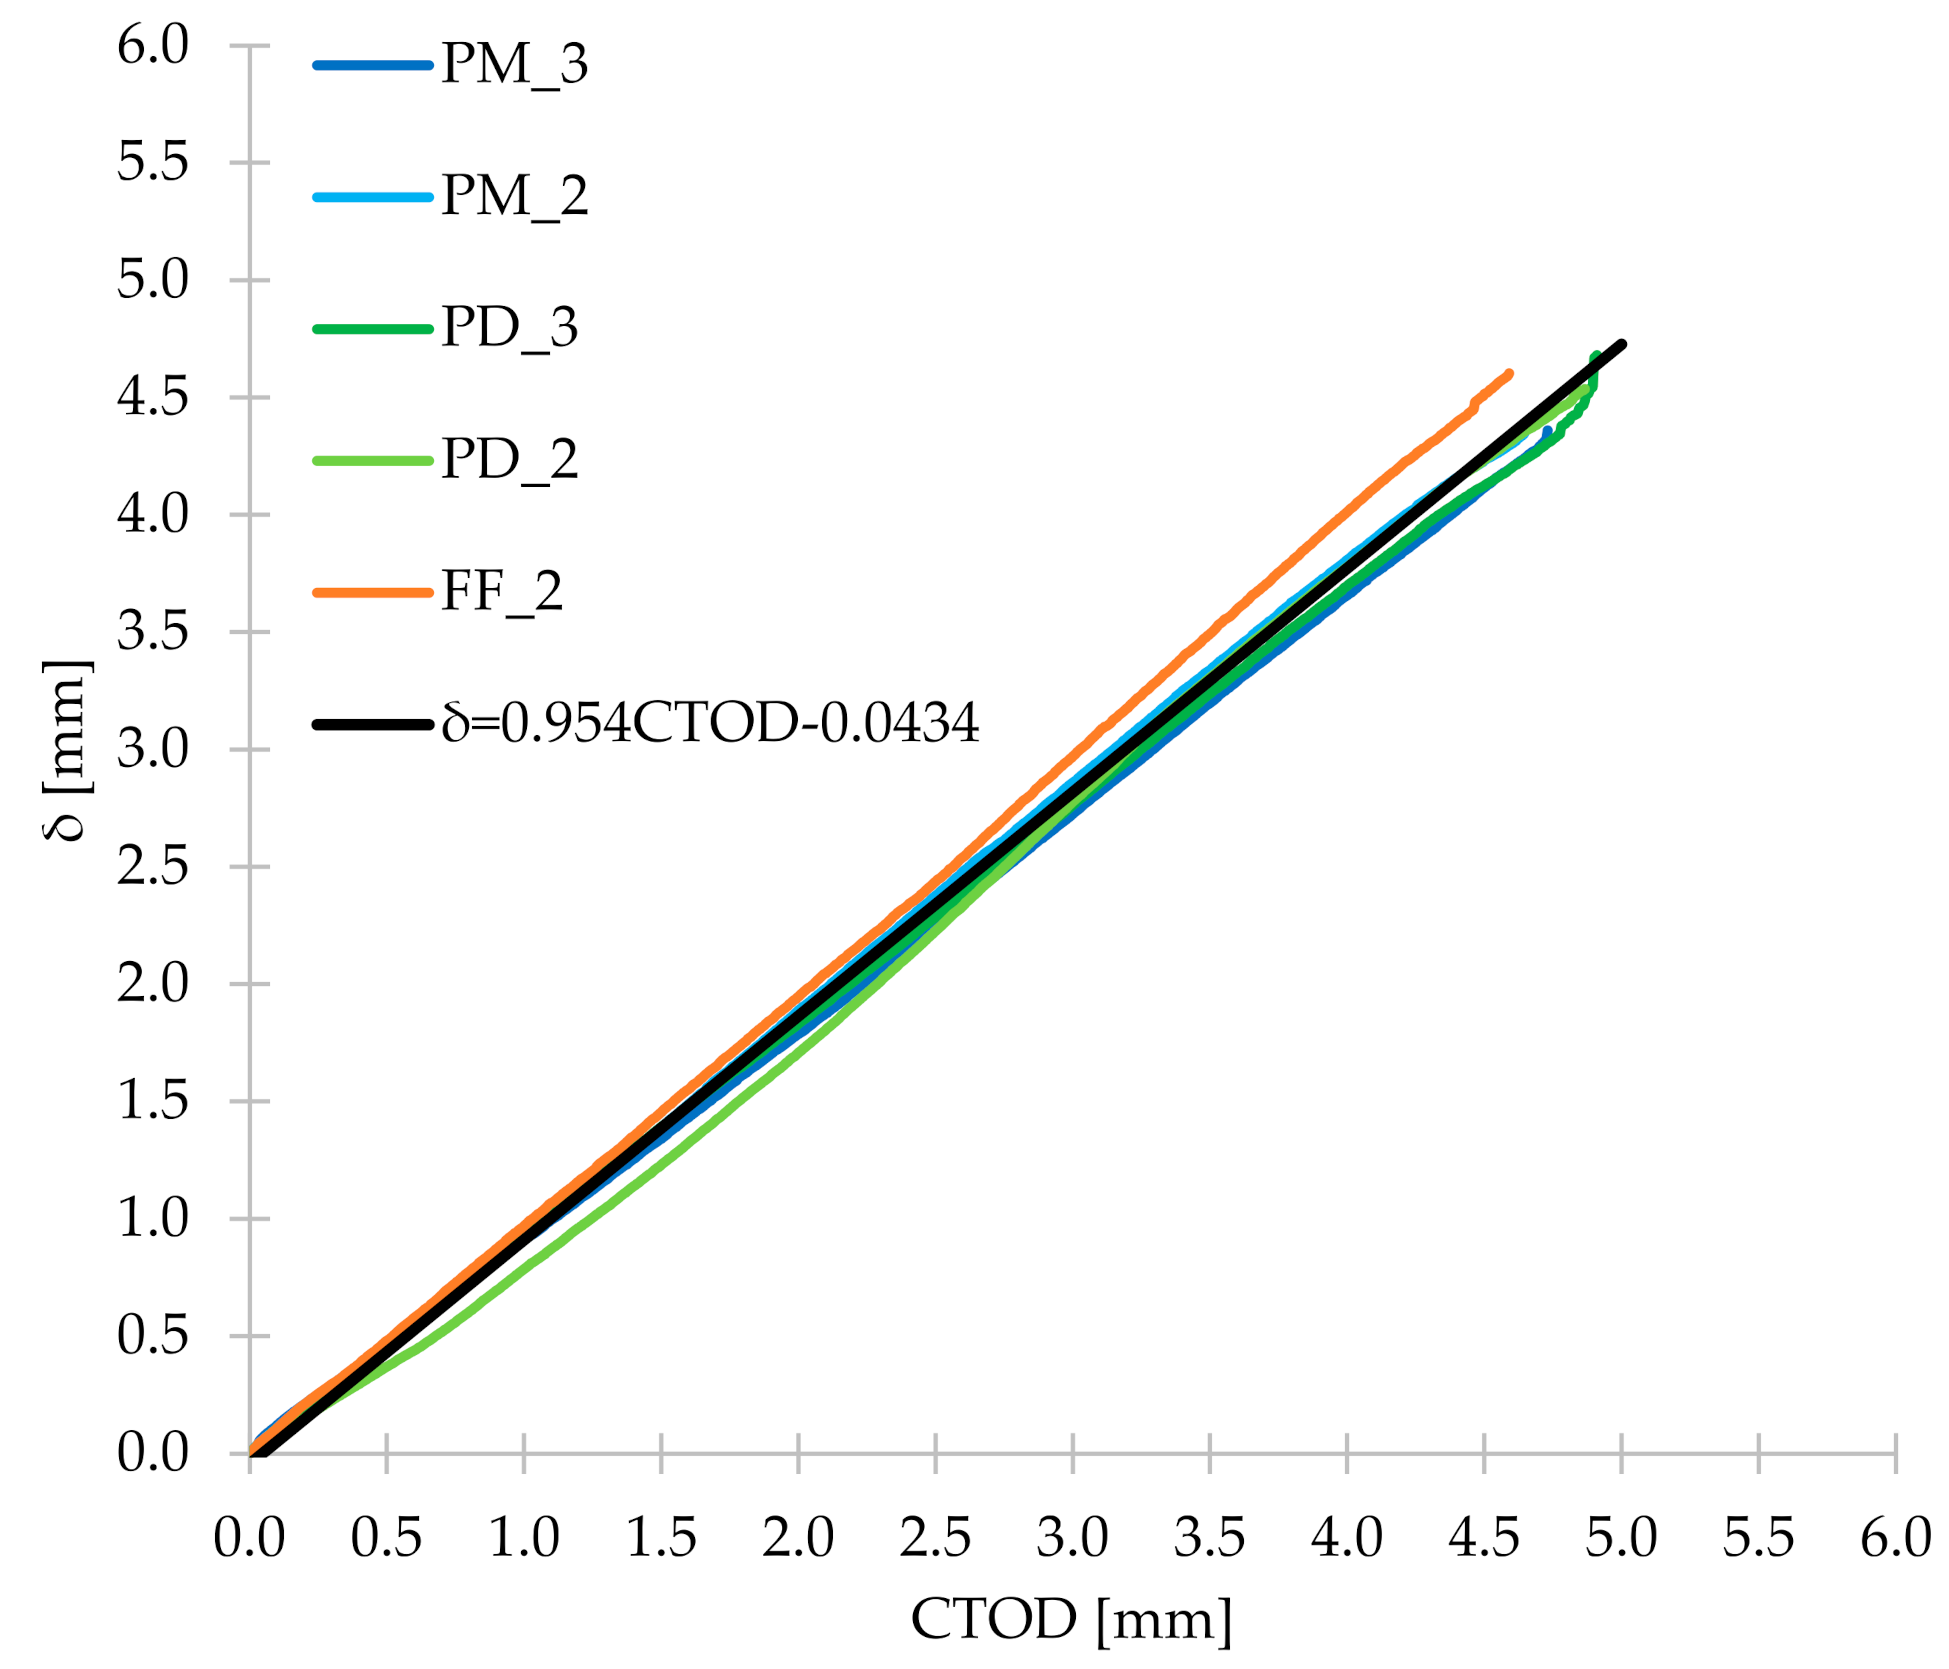
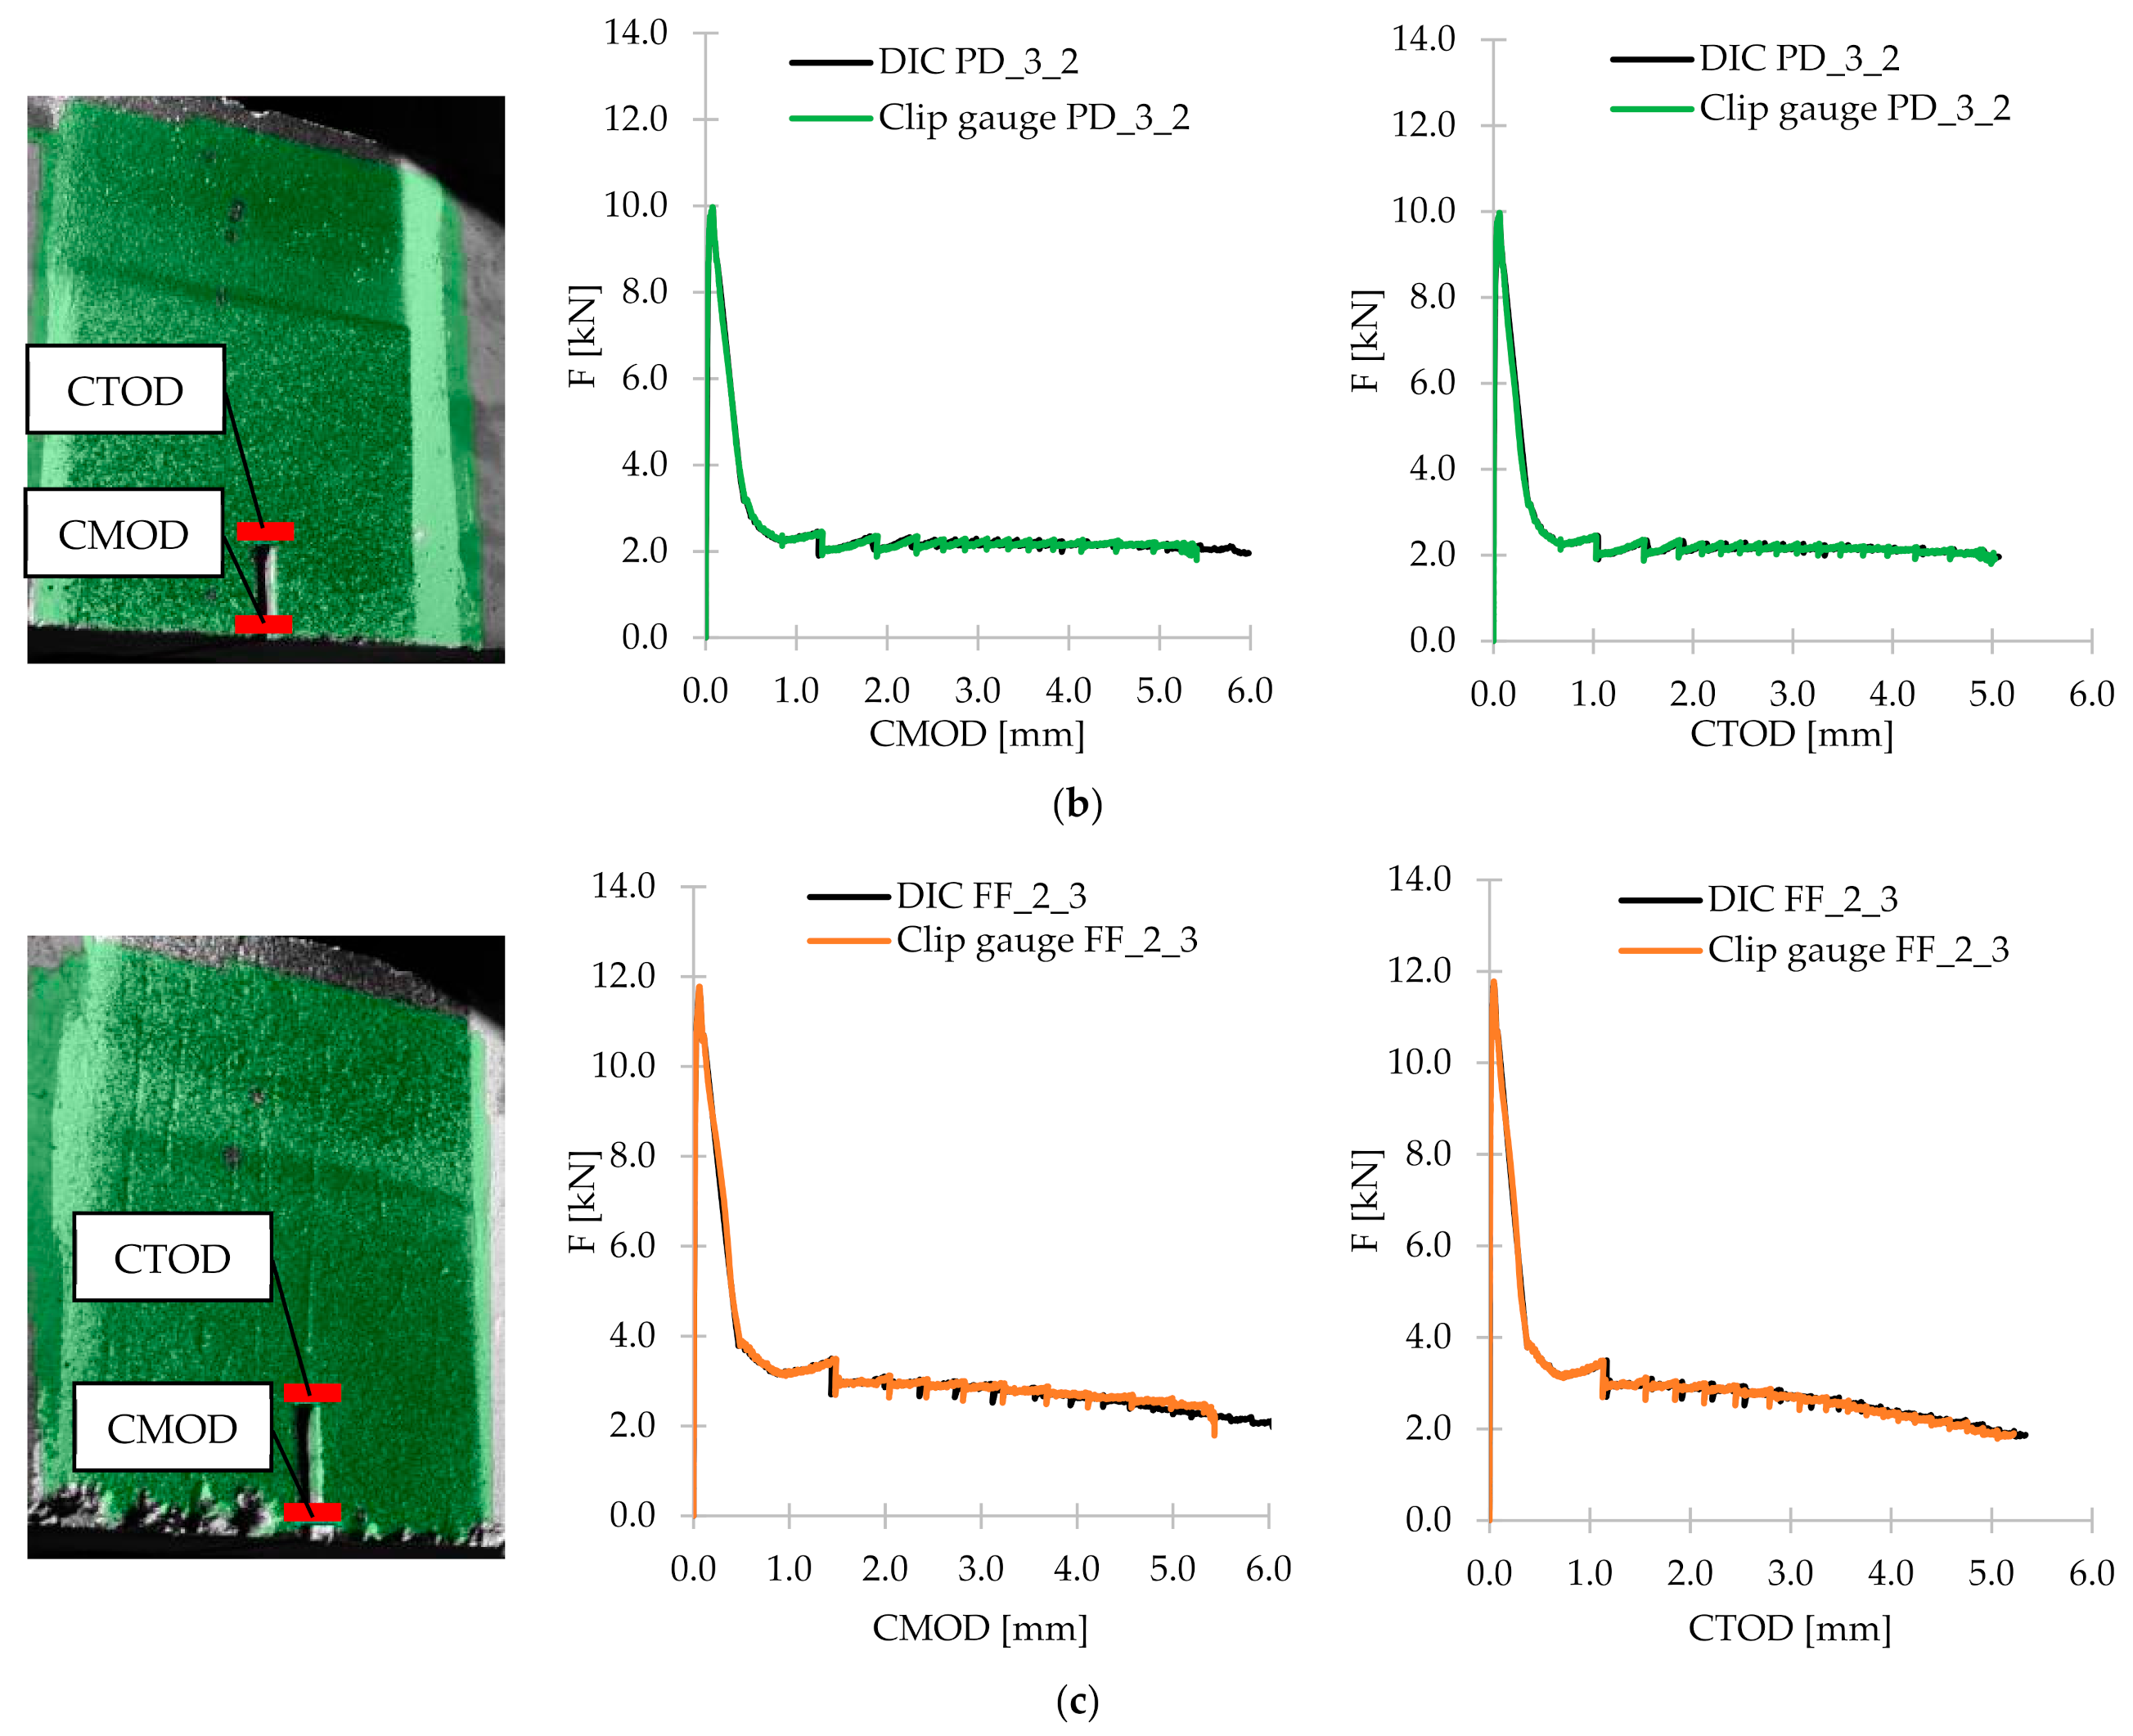
3.5. CMOD-δ, CMOD-CTOD and CTOD-δ
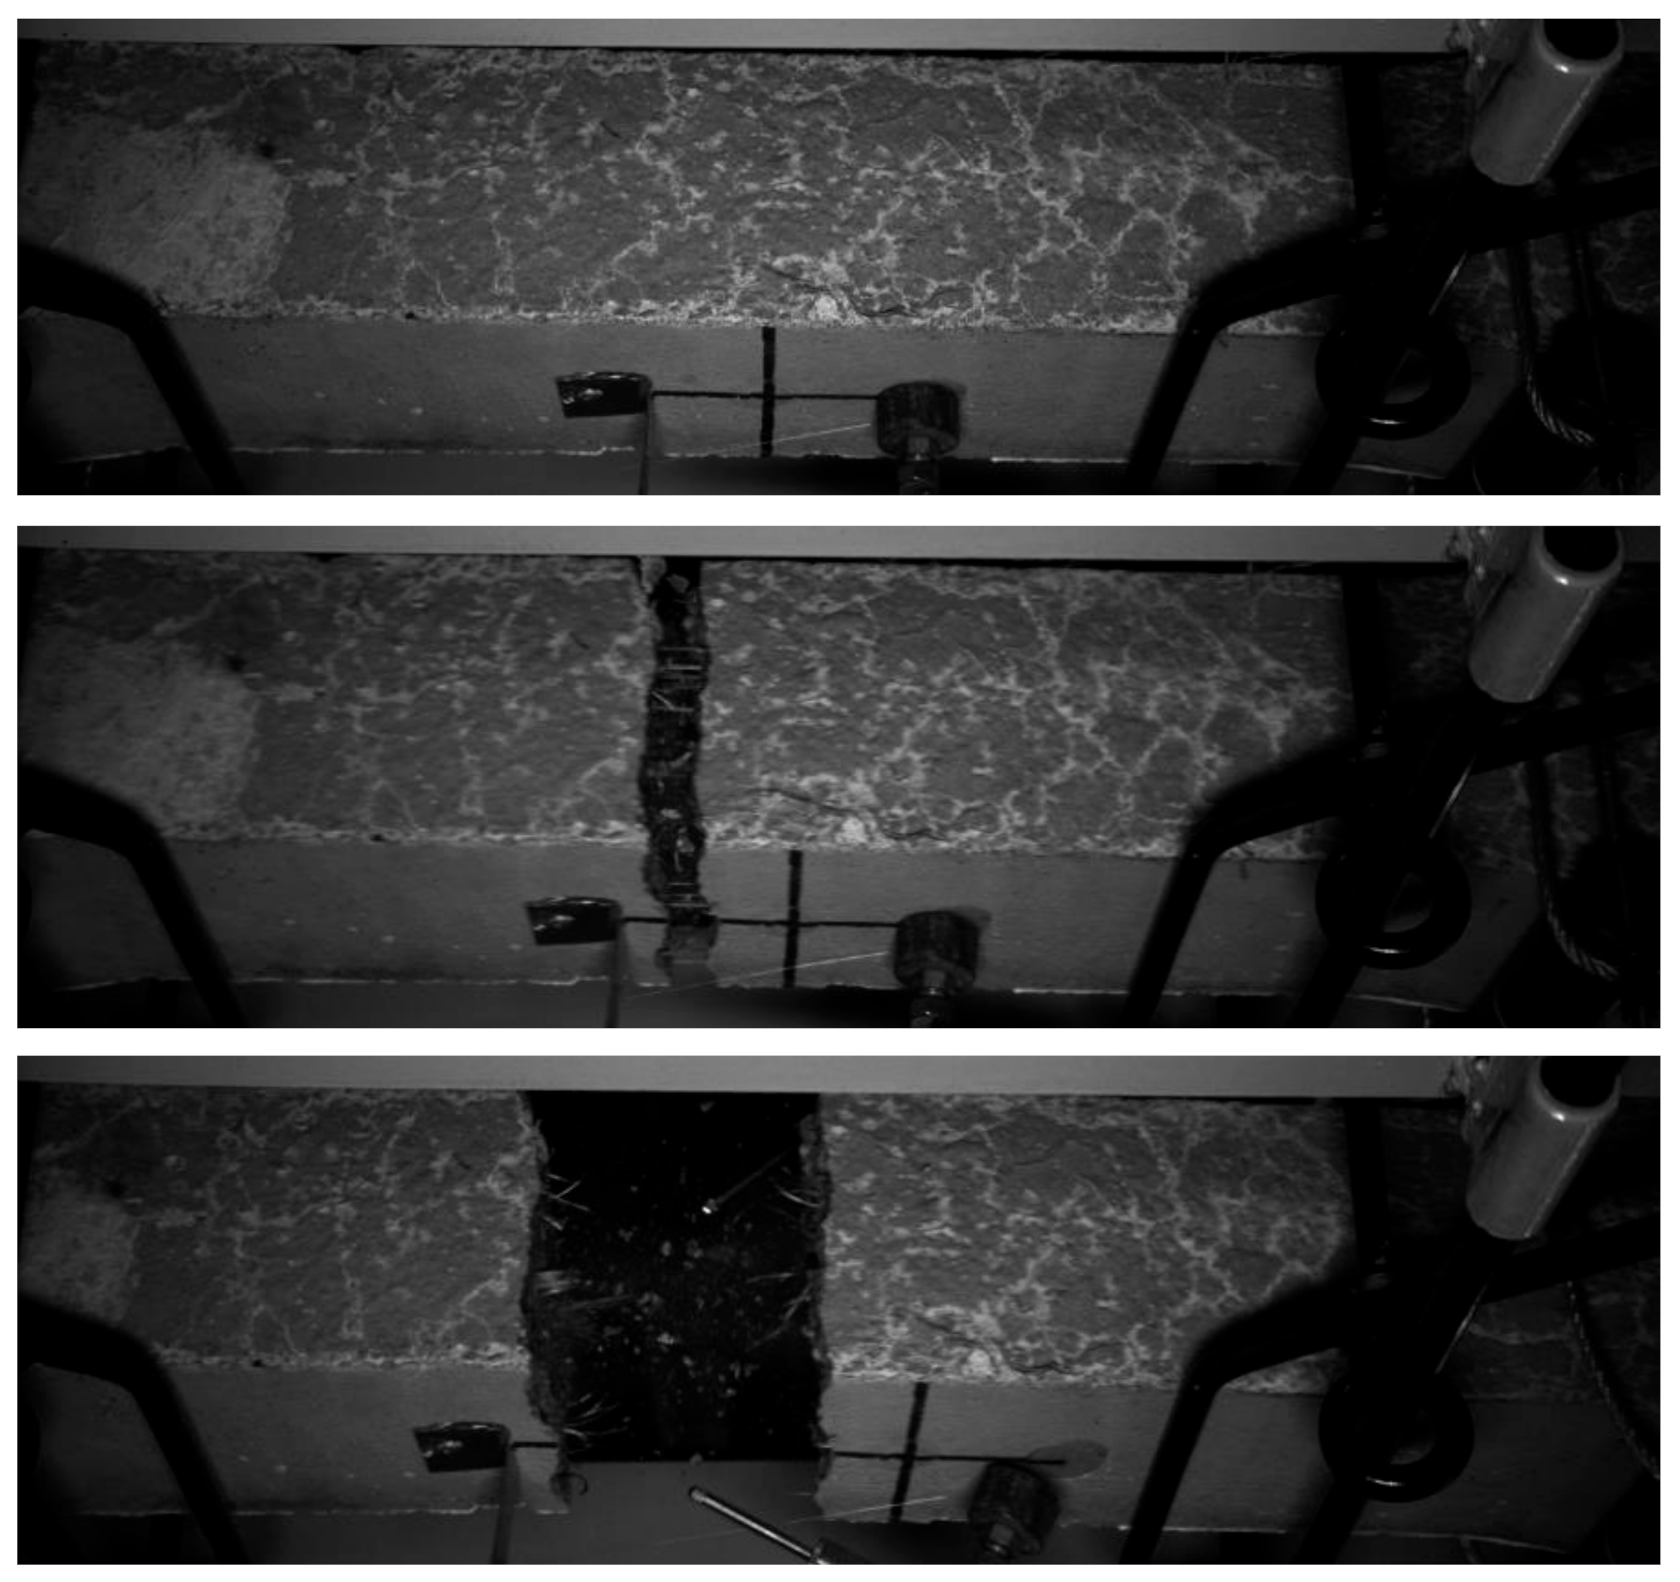
3.6. Digital Image Correlation
4. Conclusions
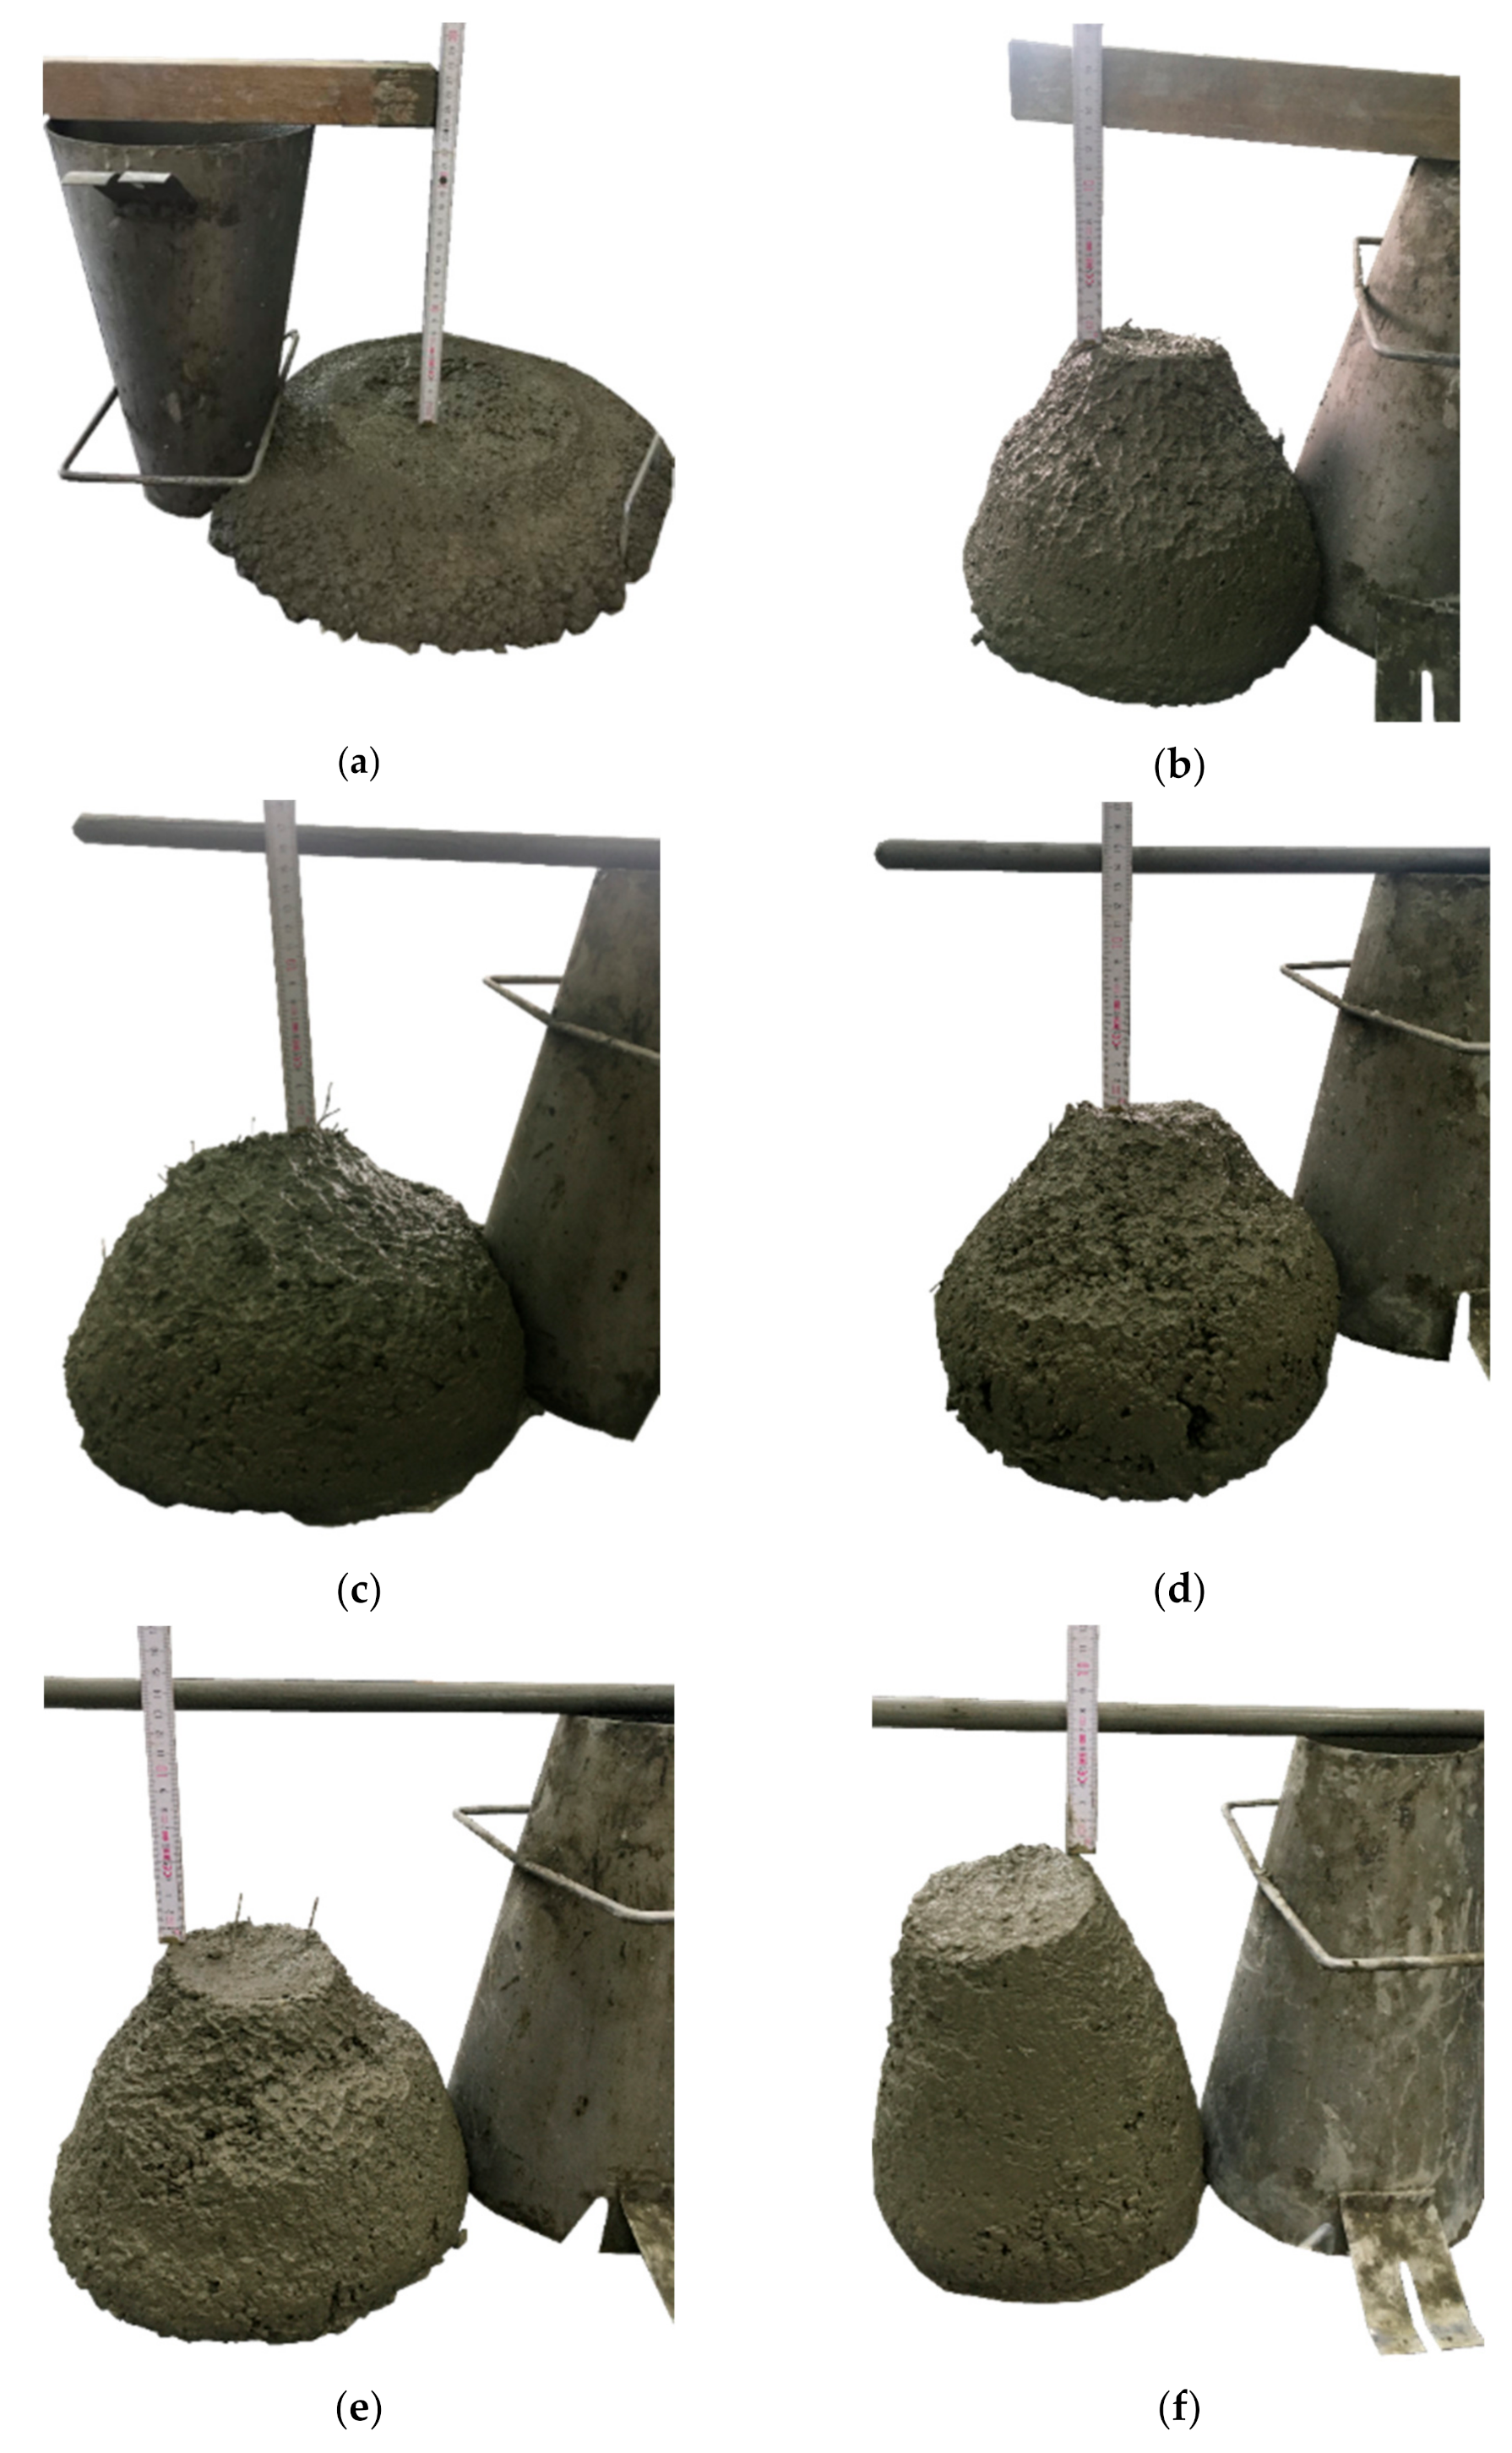
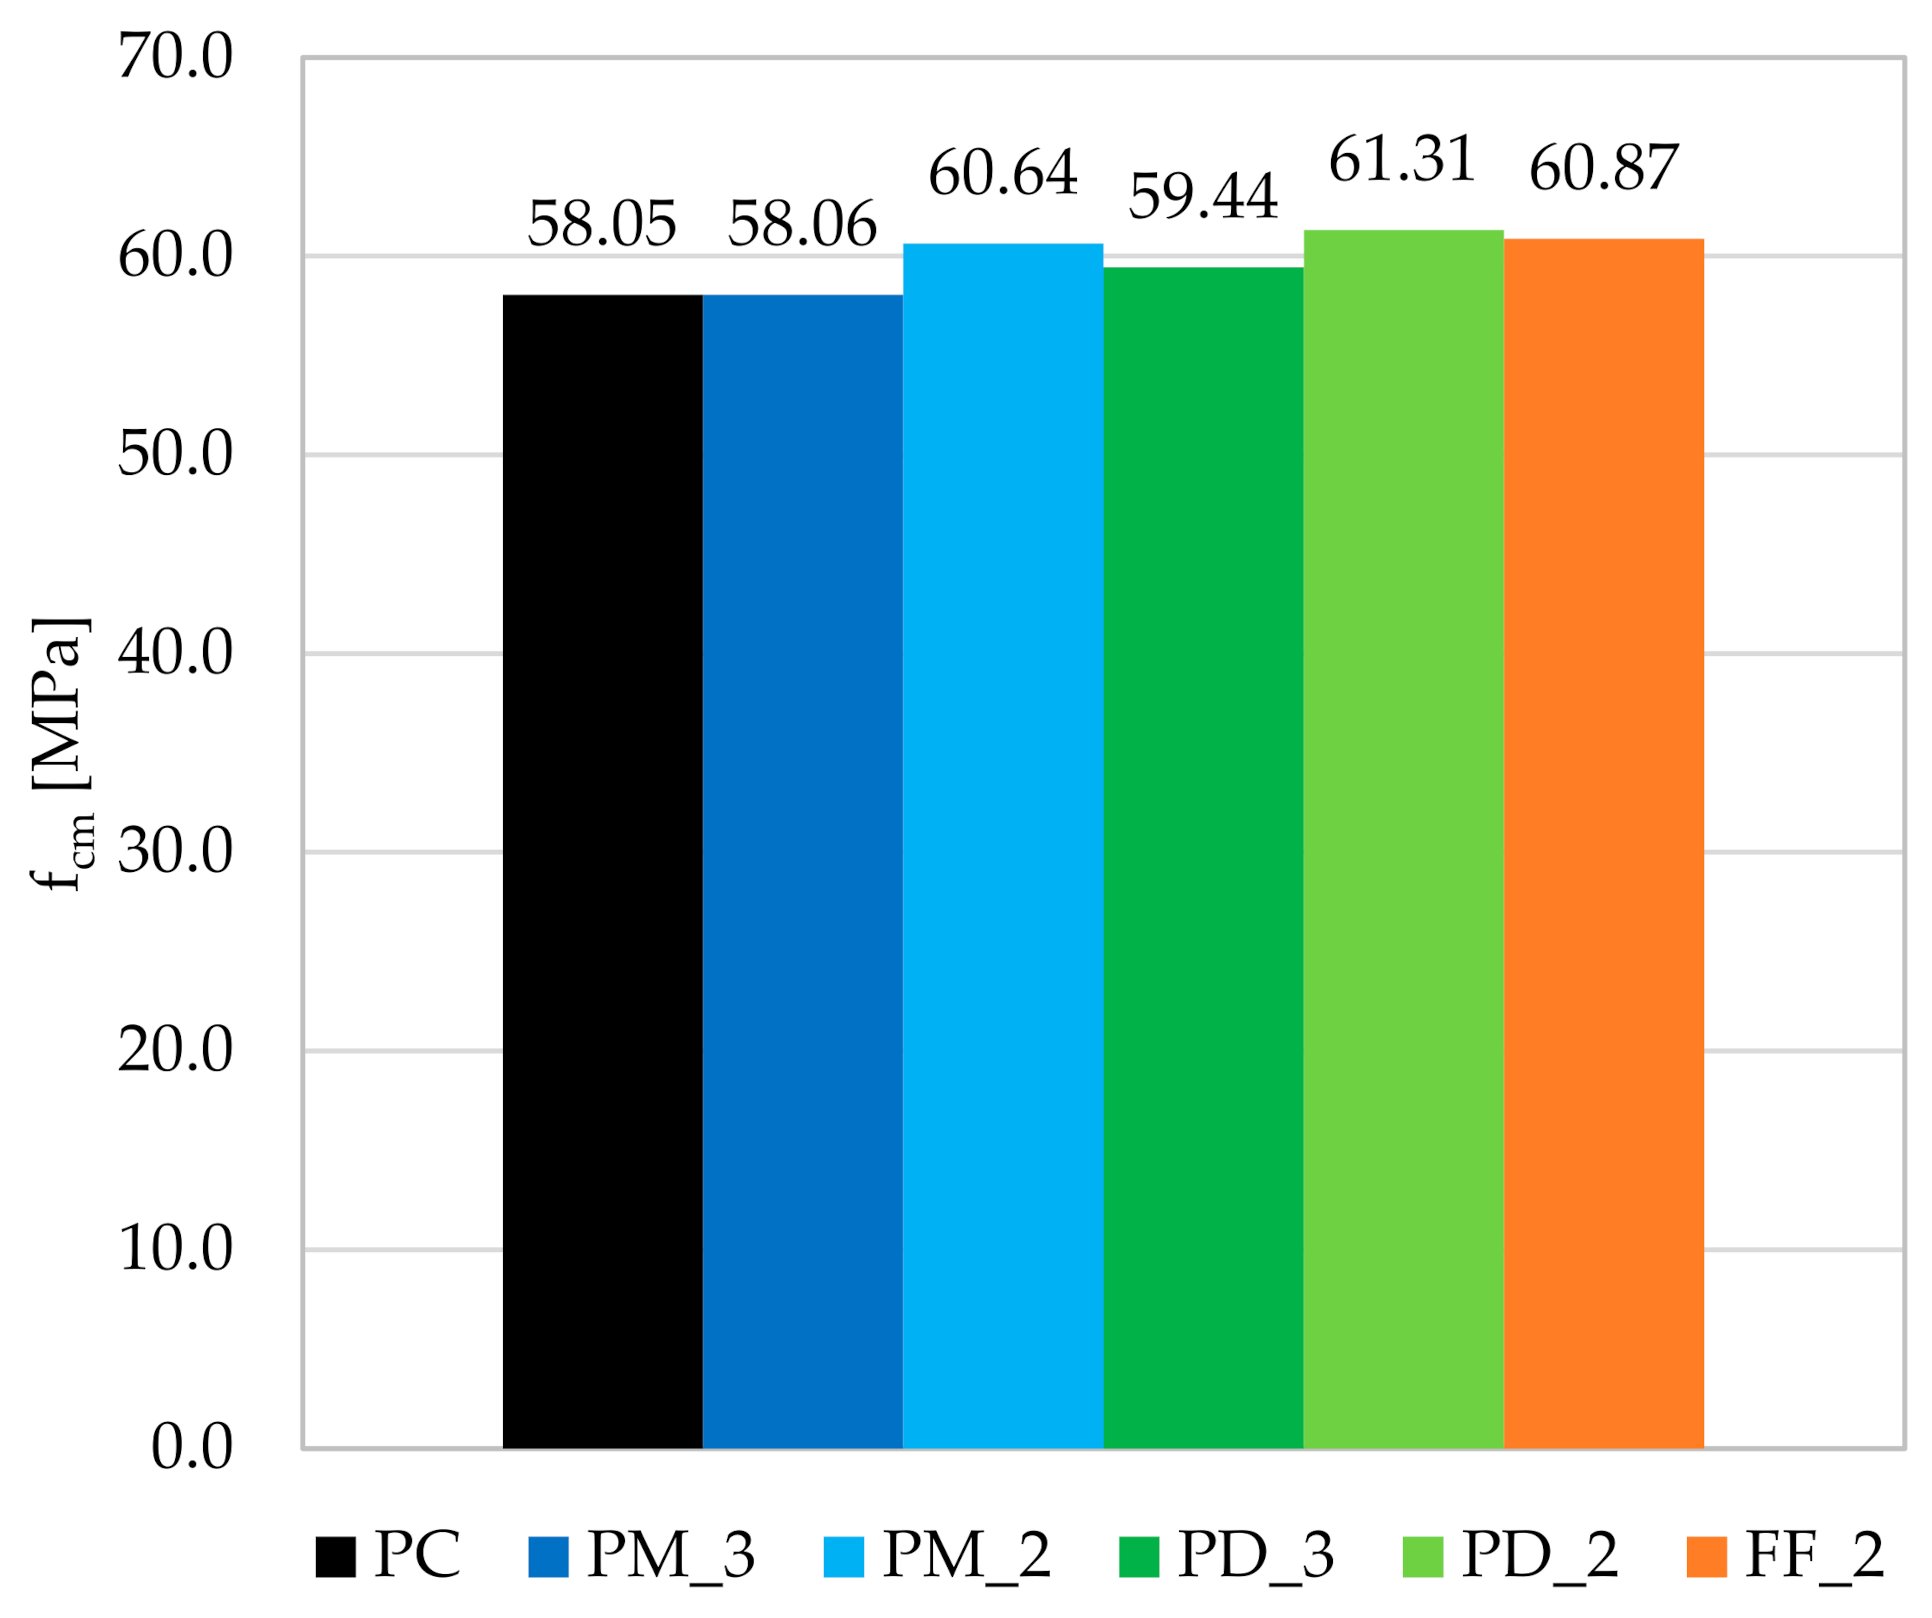
- As a result of adding synthetic fibers to concrete, the workability of the mixes deteriorated significantly. The consistency class decreased by three for FF_2, two for PM_3, PD_3 and PD_2, and one for PM_2, compared to plain concrete. Nevertheless, the type and fiber content did not significantly affect the compressive strength, which ranged from 58.06 to 61.31 MPa, depending on the mixture, while for concrete without fibers it was equal to 58.05 MPa.
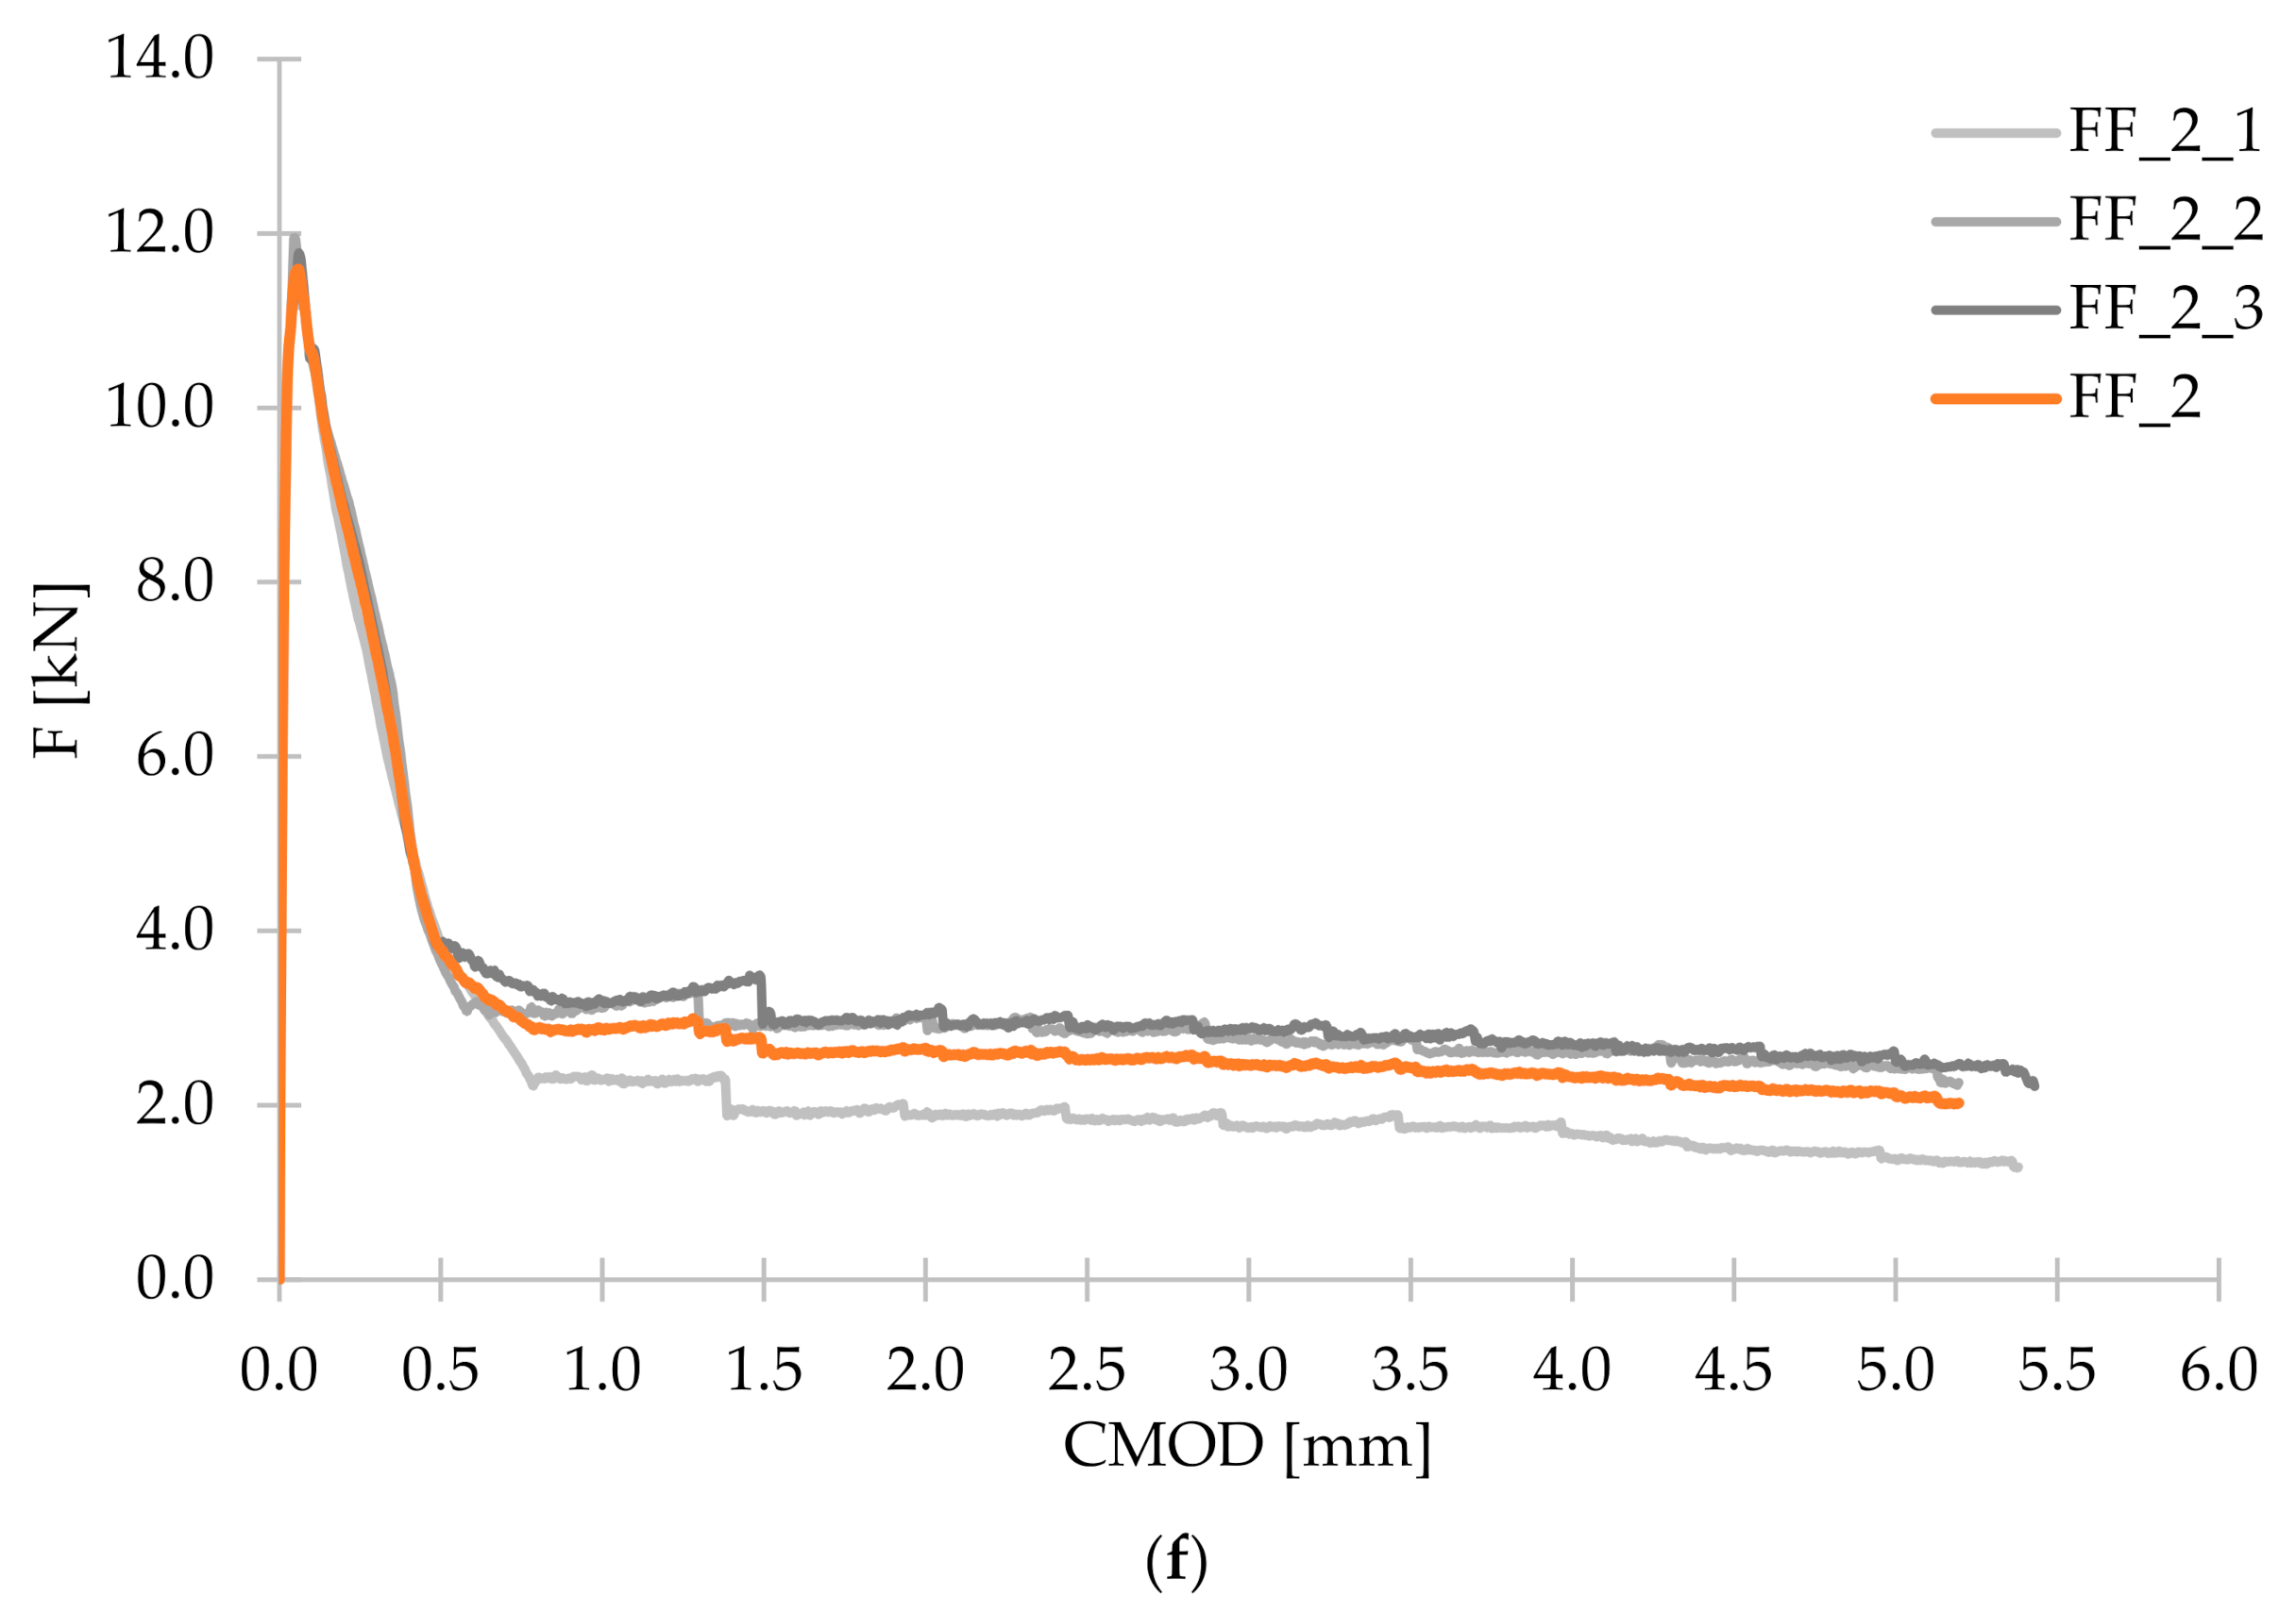
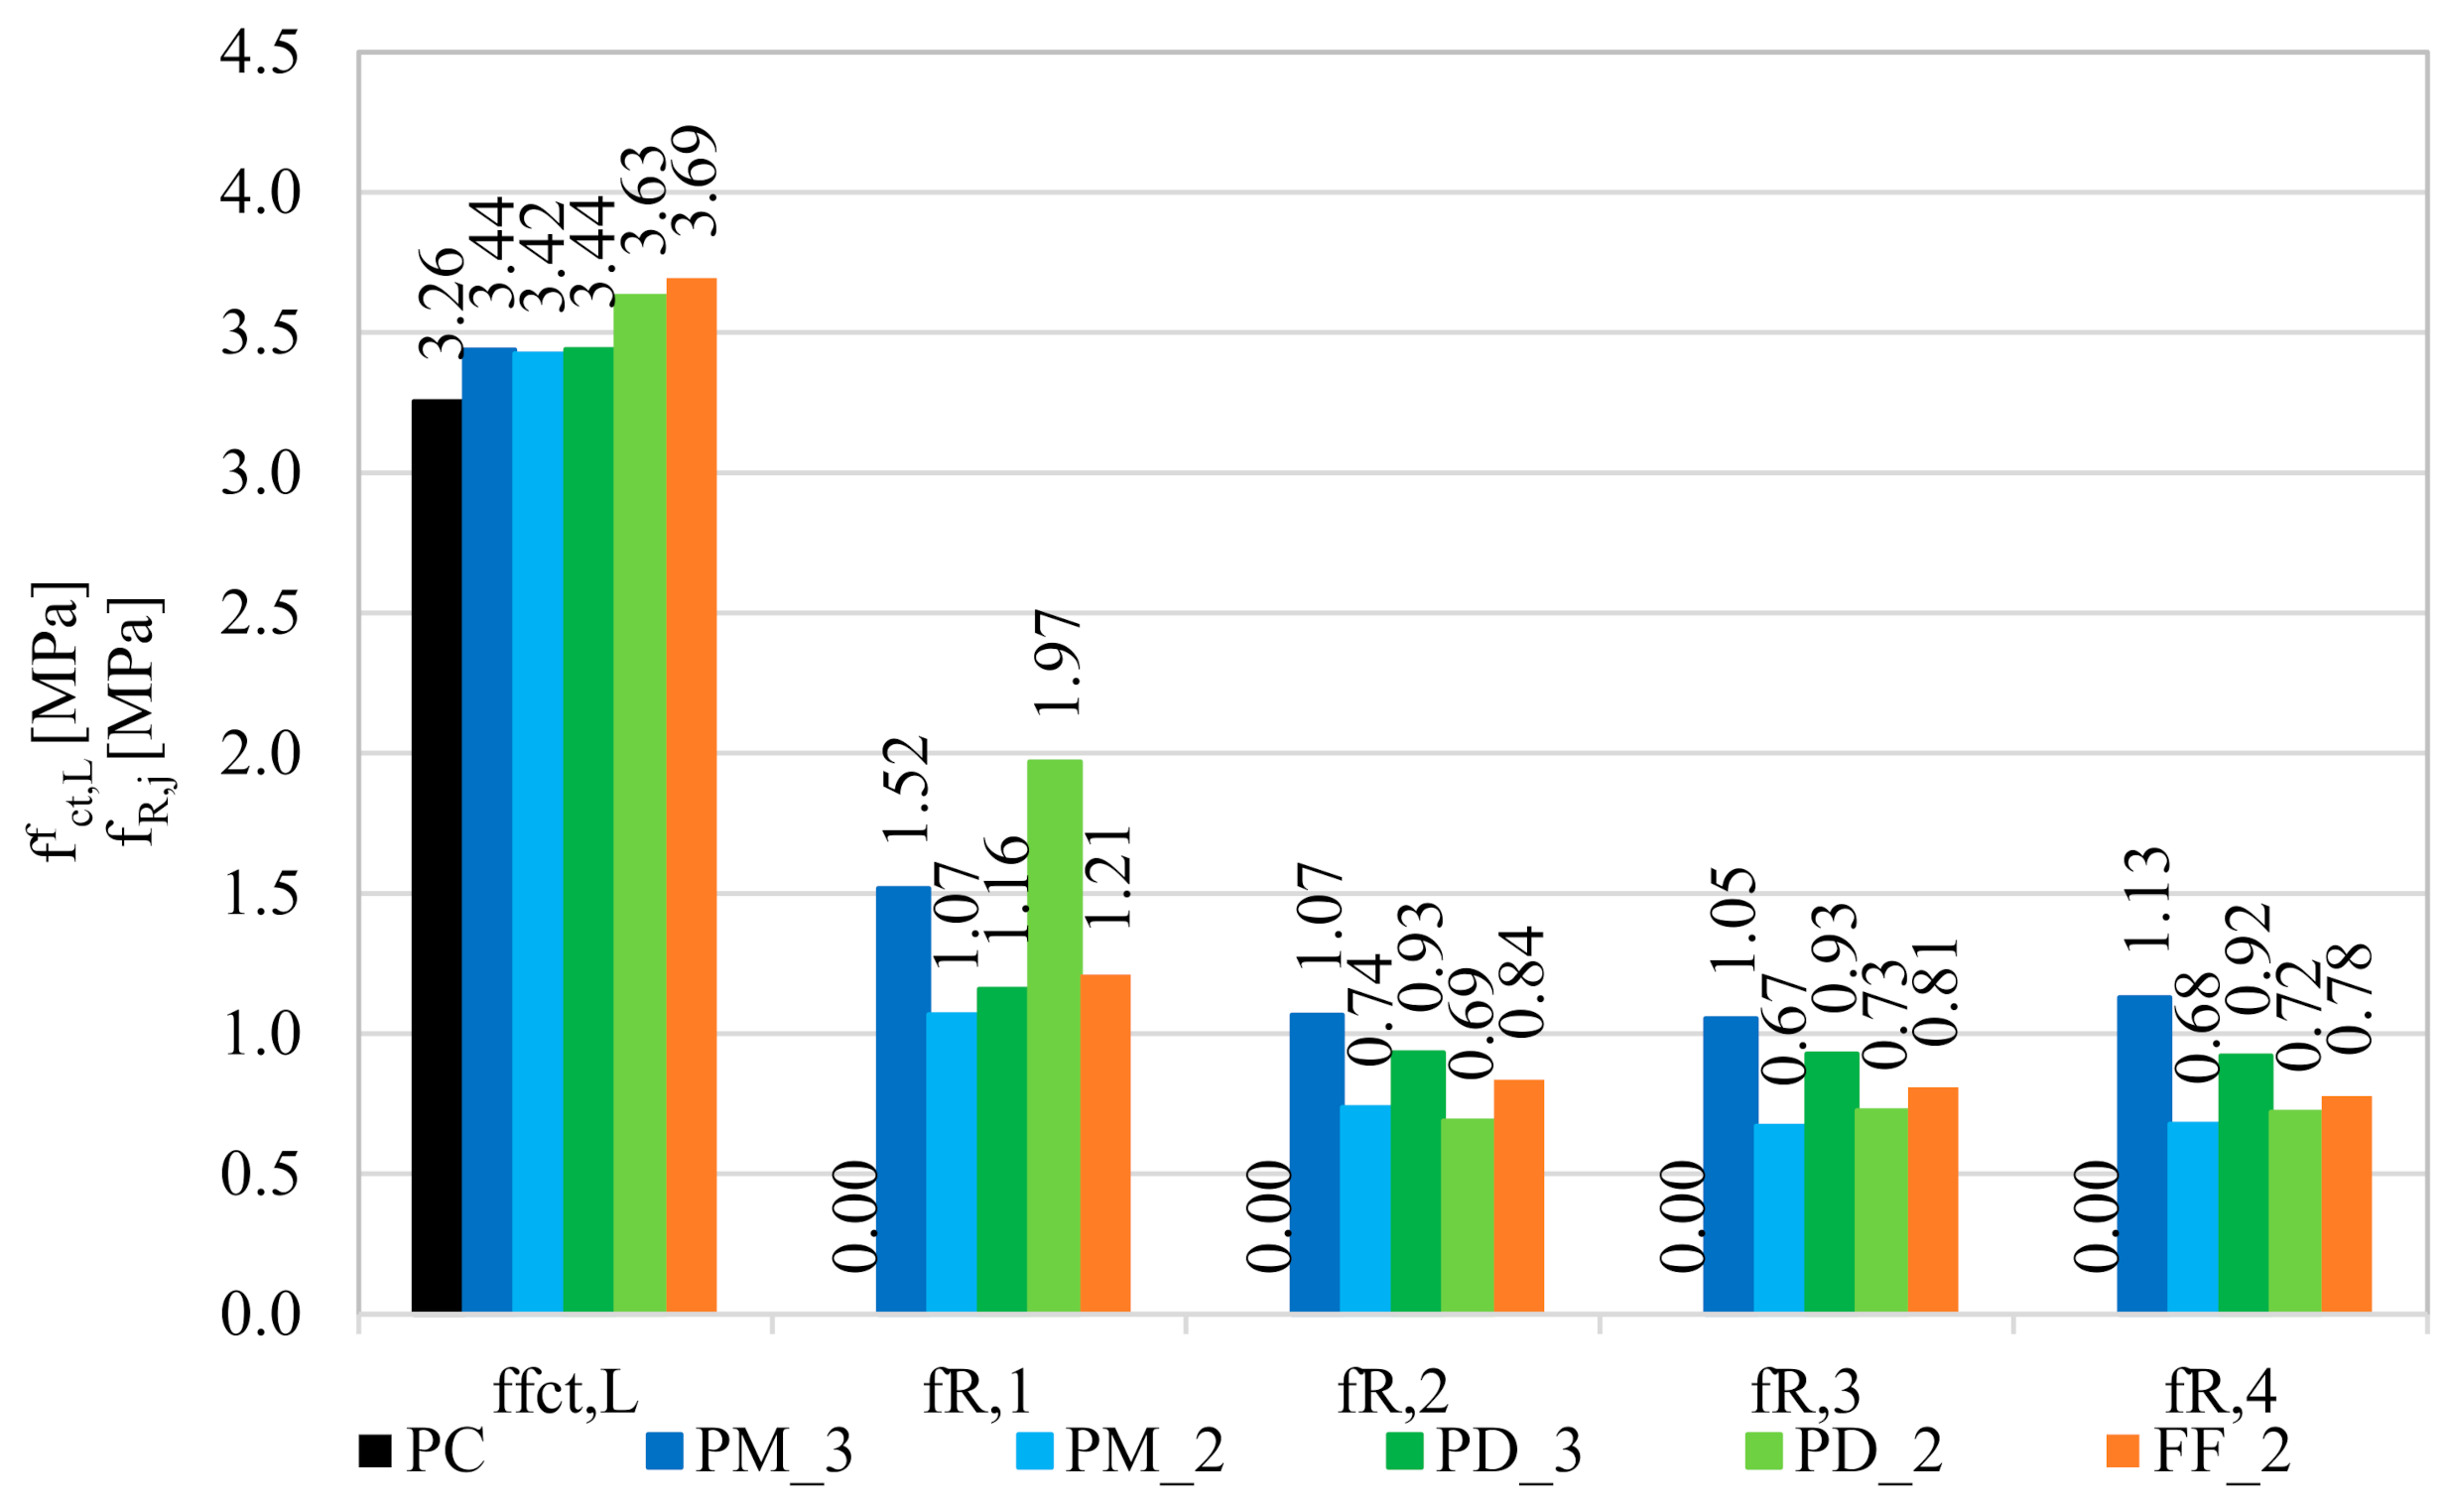
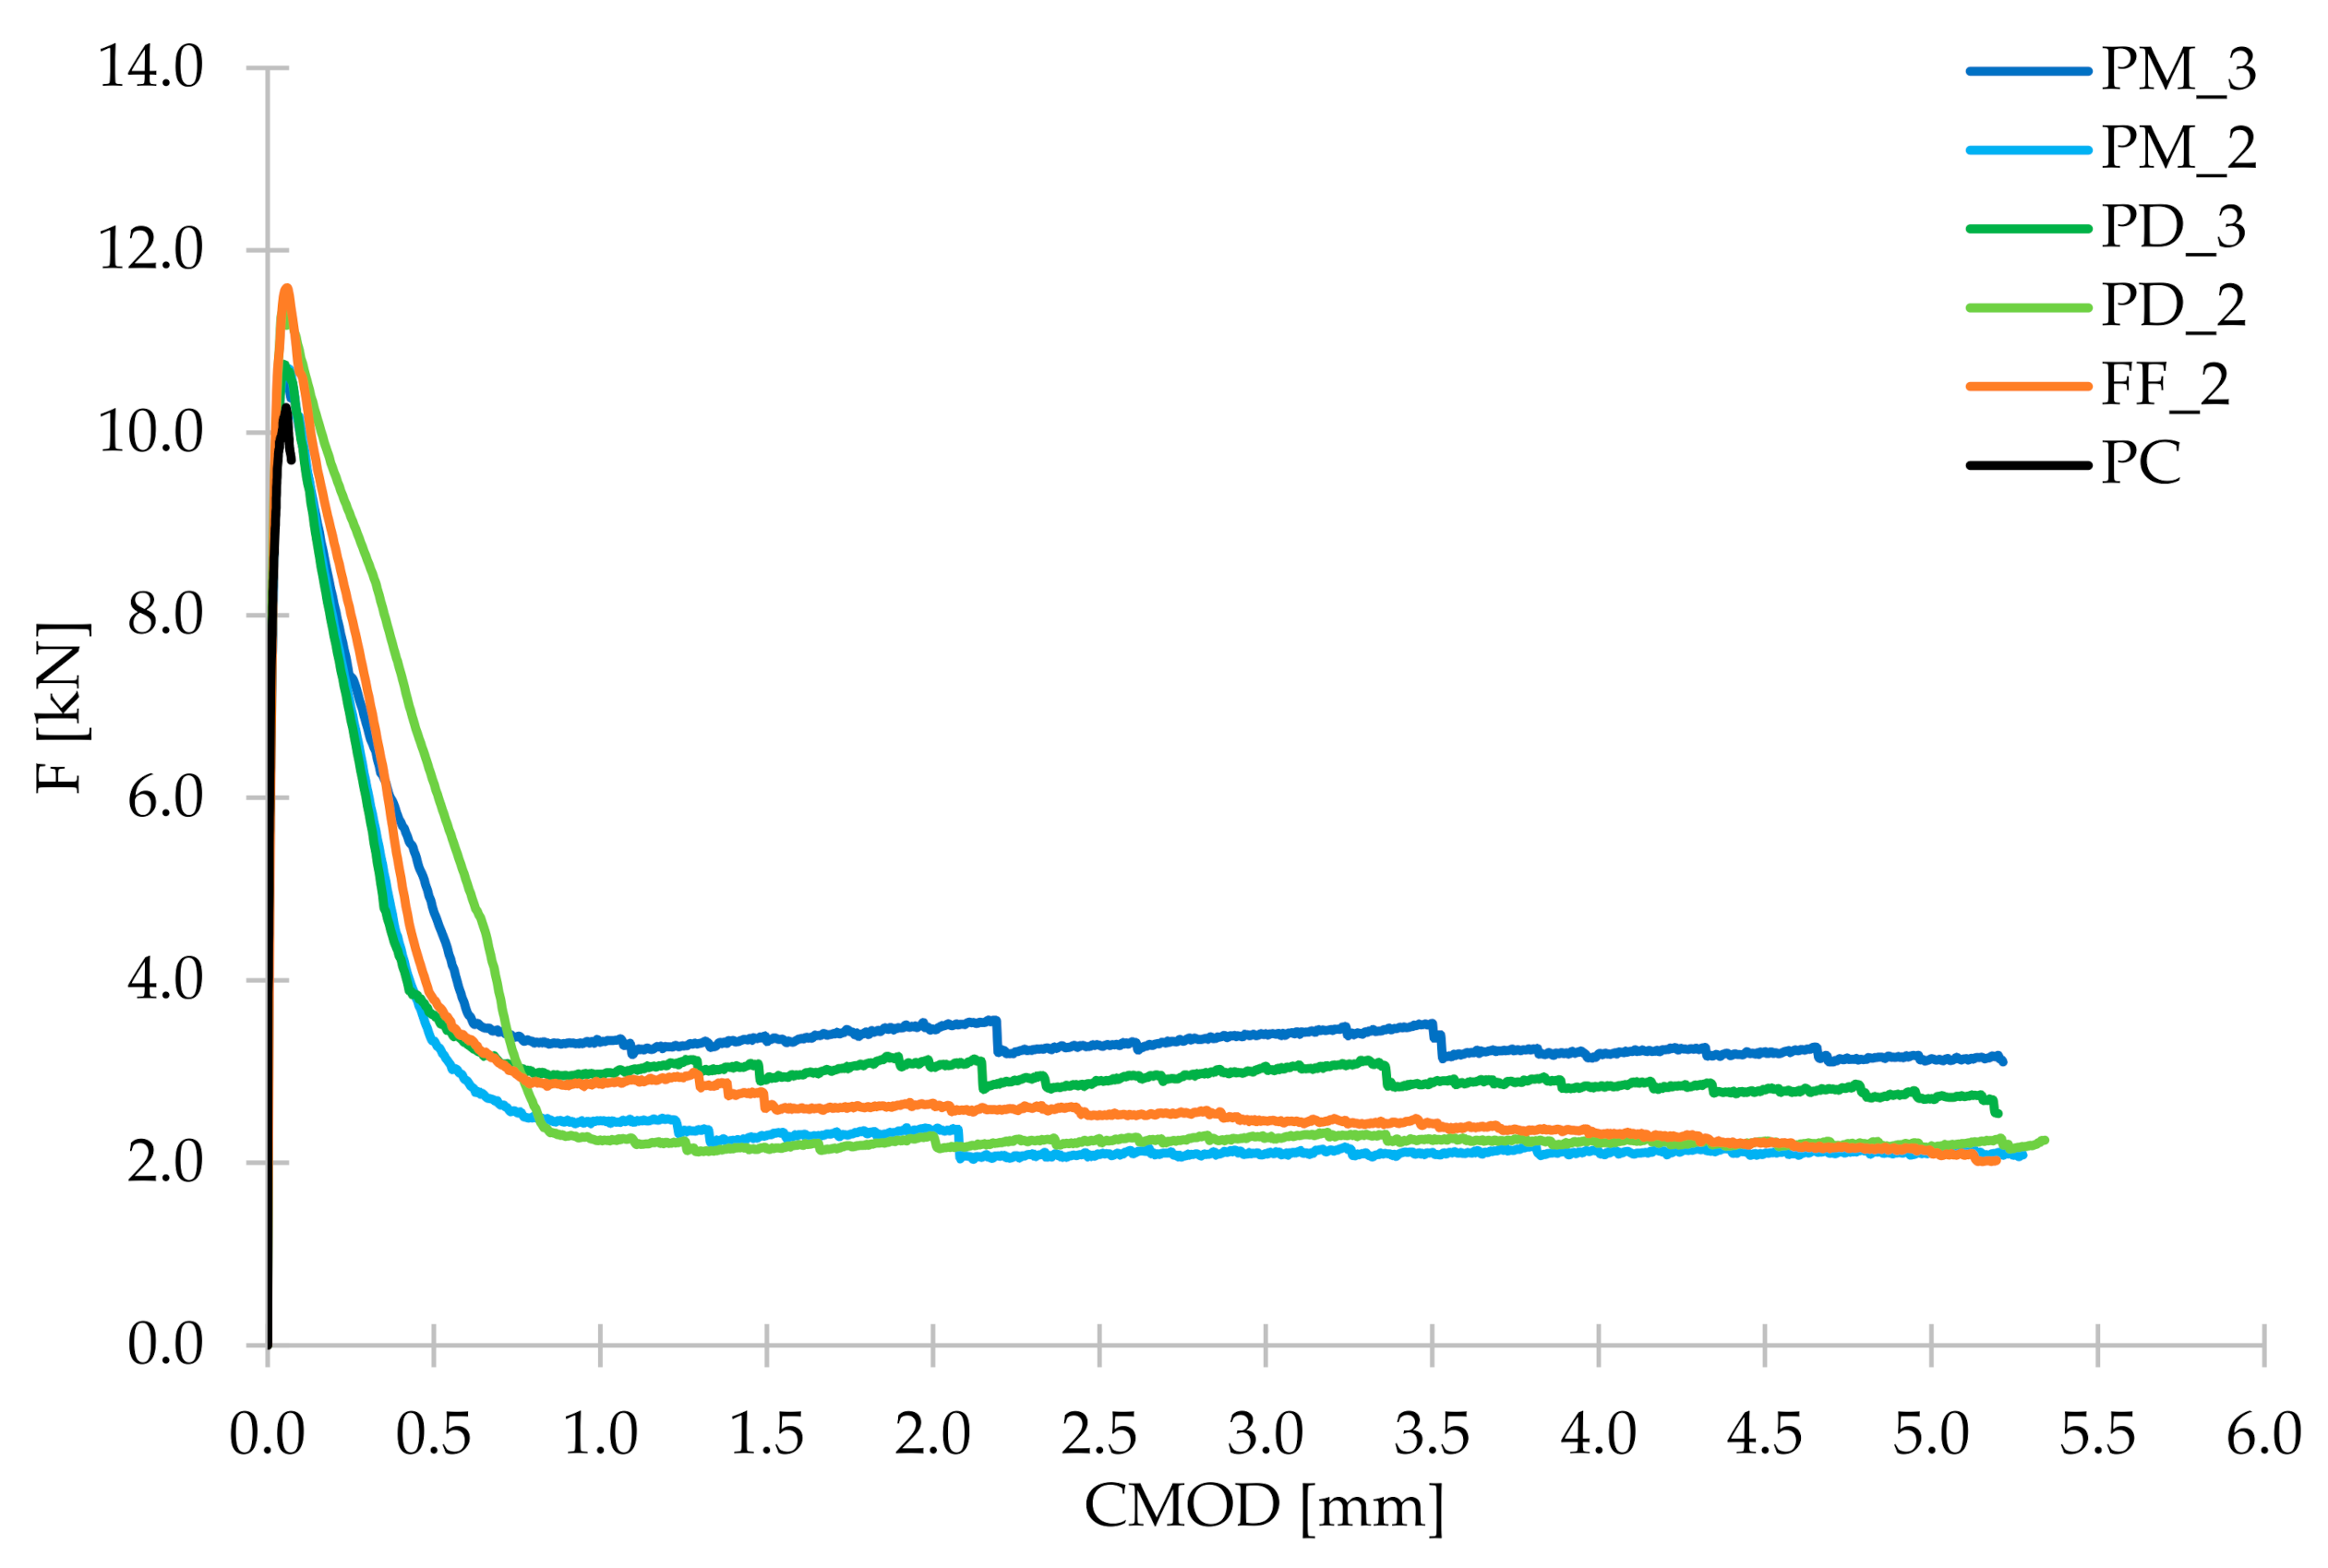
- The fibers contributed to an increase in the flexural tensile strength of approximately 5.5% for PM_3, PM_2, and PD_3; 11.5% for PD_2 and 13.5% for FF_2. The mixtures with slightly shorter fibers (lf = 48 mm) performed better, and in particular the one where a smaller amount of fibers (2 kg/m3) has been used. However, the best results were obtained with a hybrid blend with Vf = 2 kg/m3. This may be due to the fact that the combination of two types of fibers more effectively bridged the microcracks, and the lower fiber content allowed fibers for their more even distribution in the concrete.
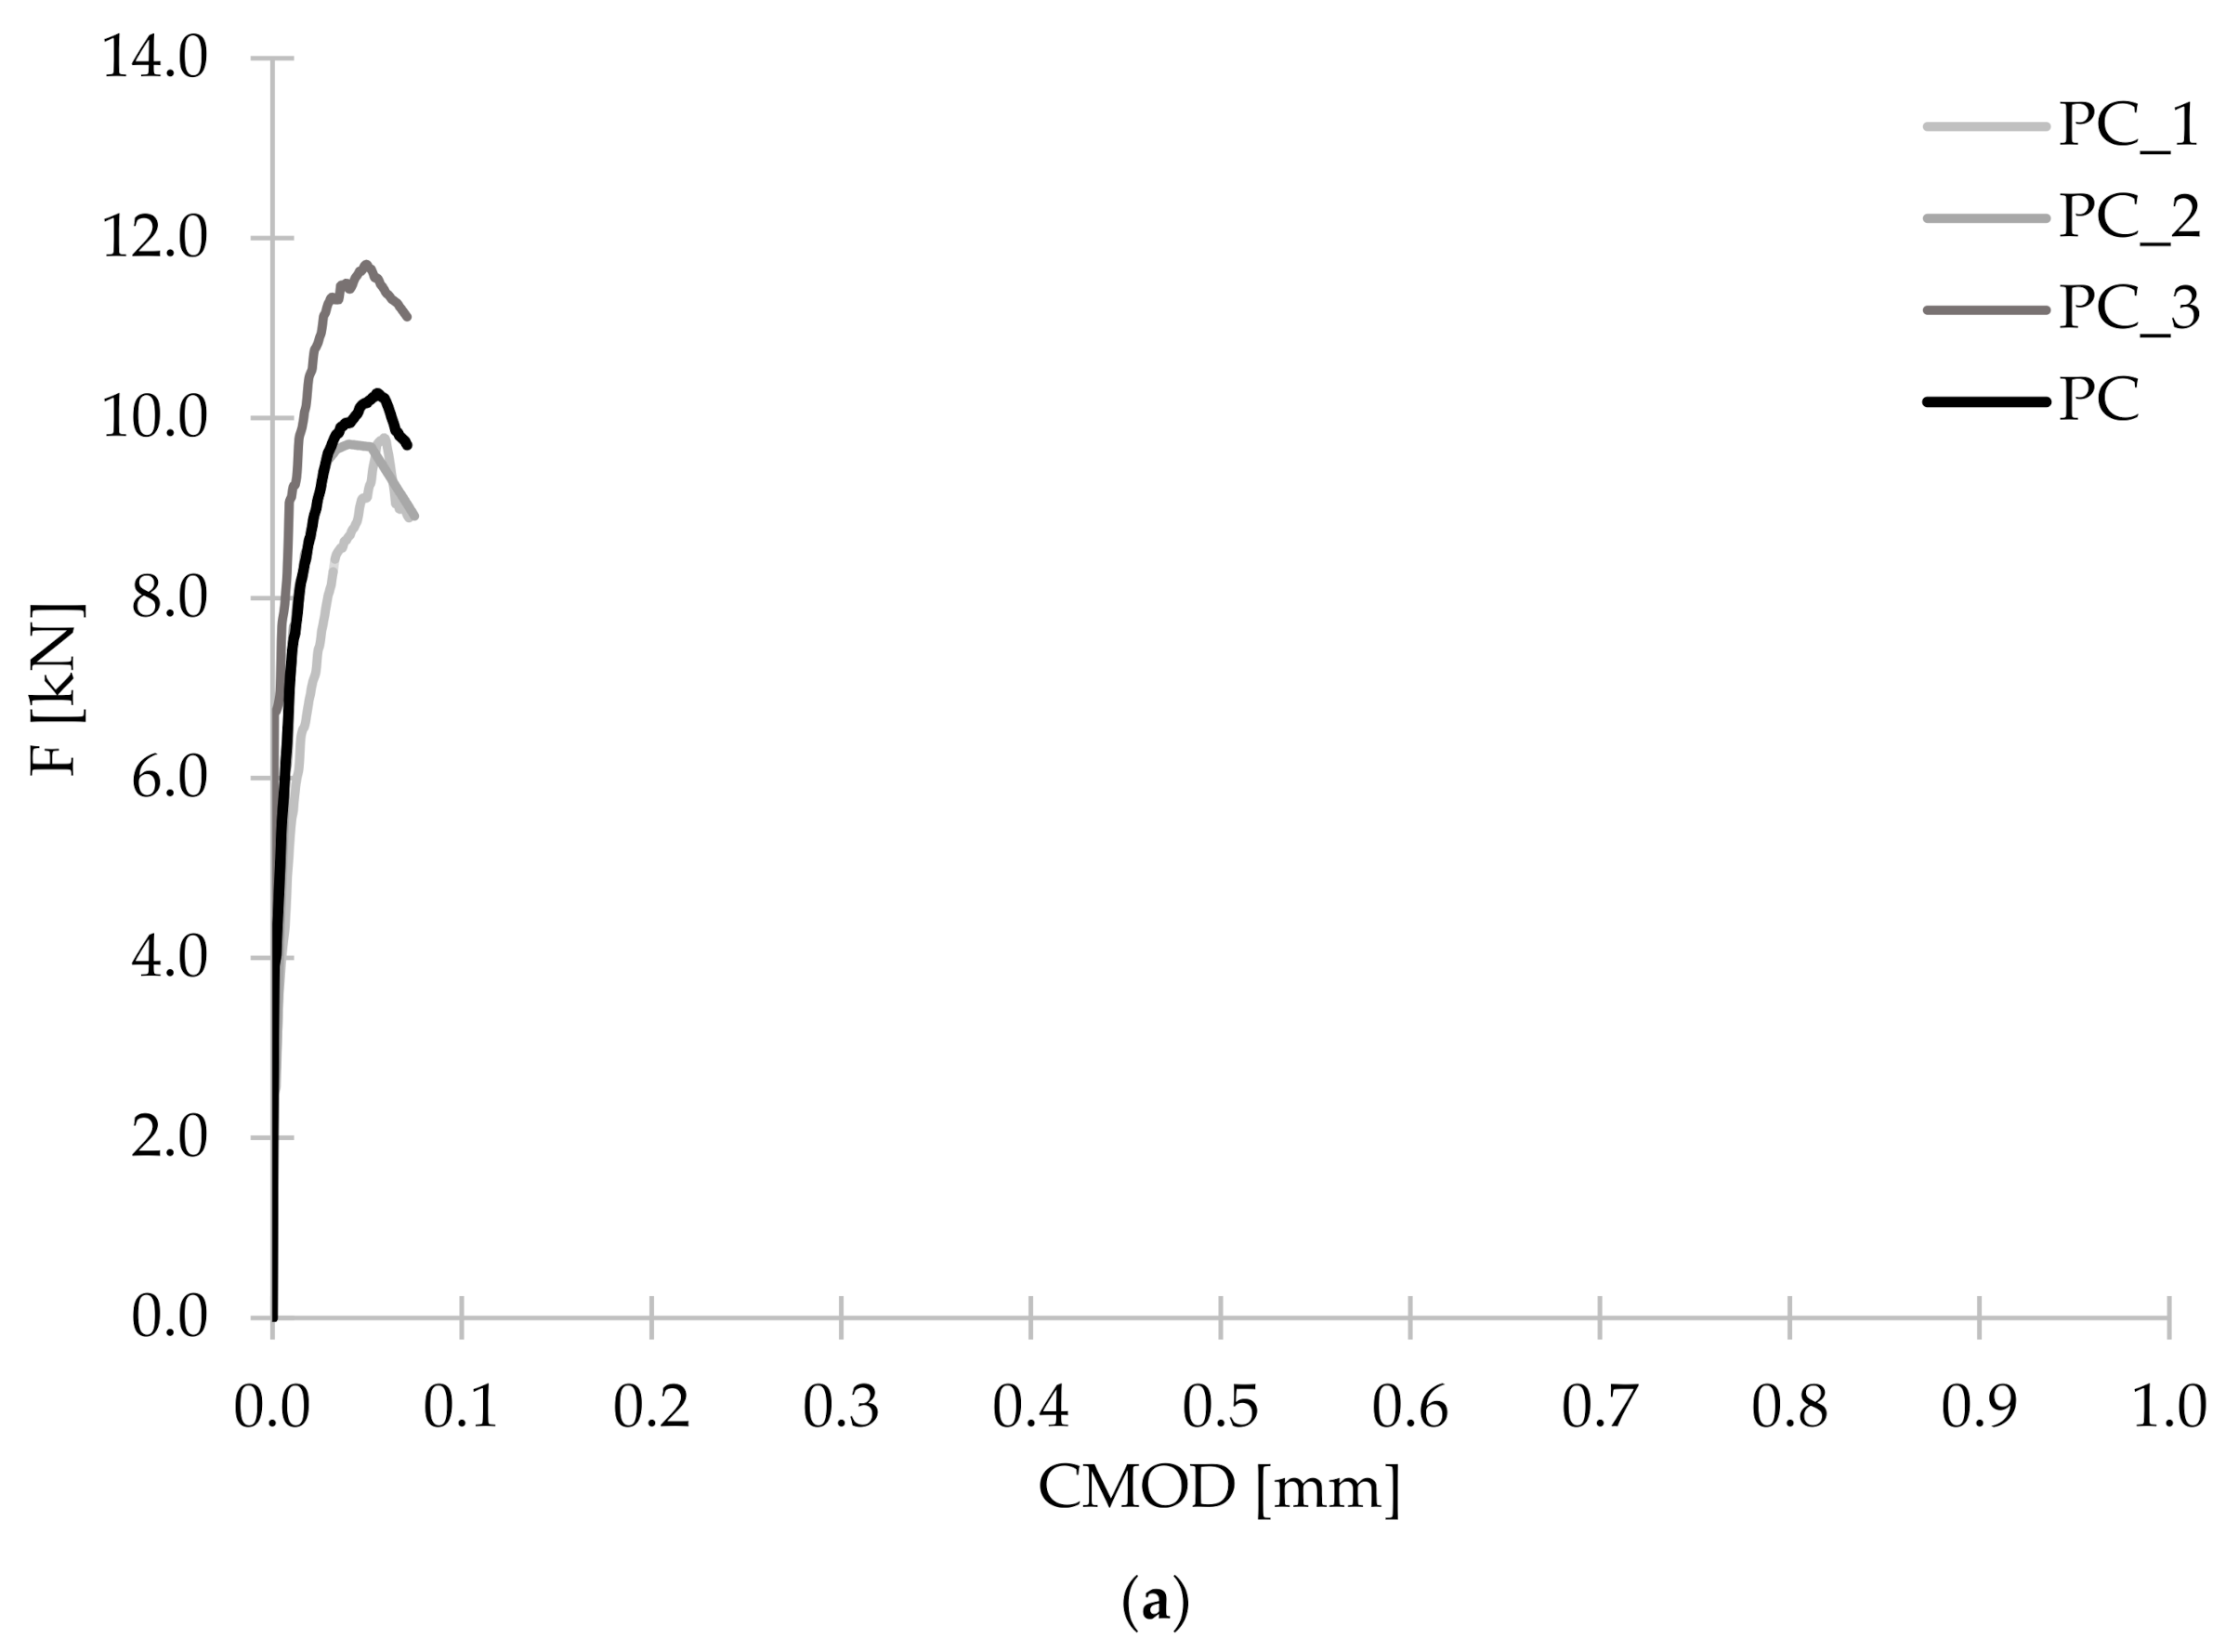
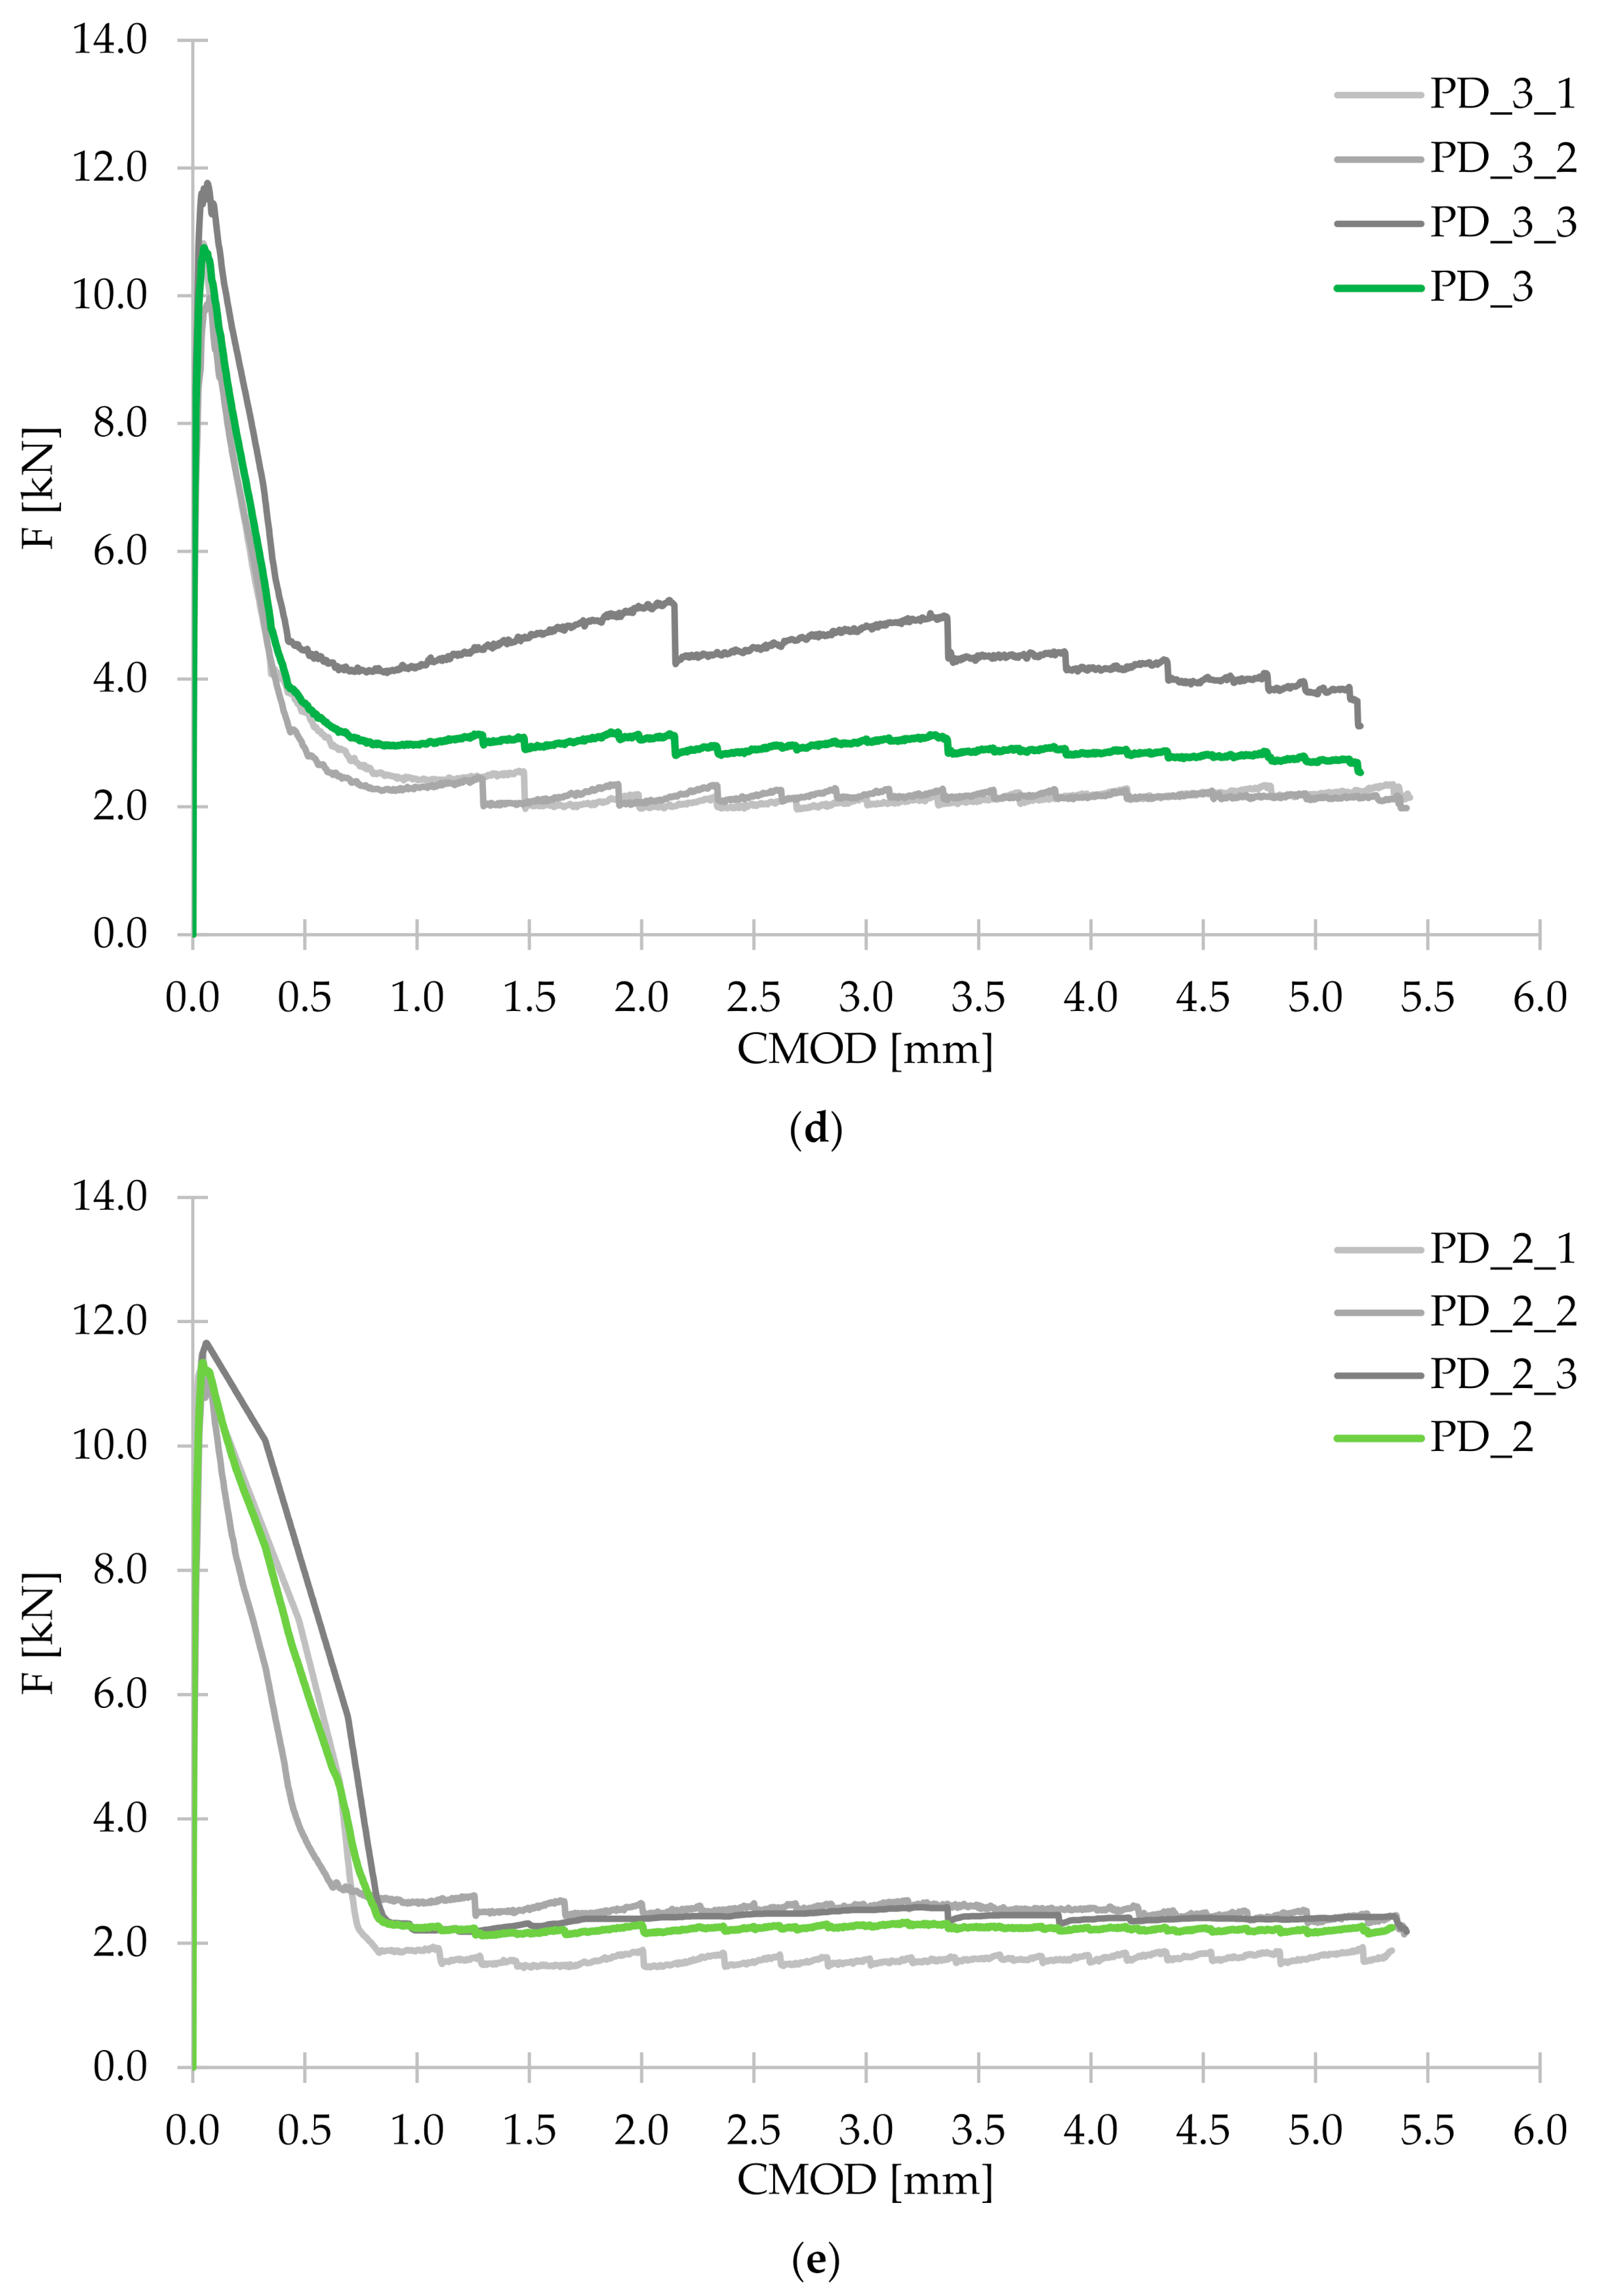
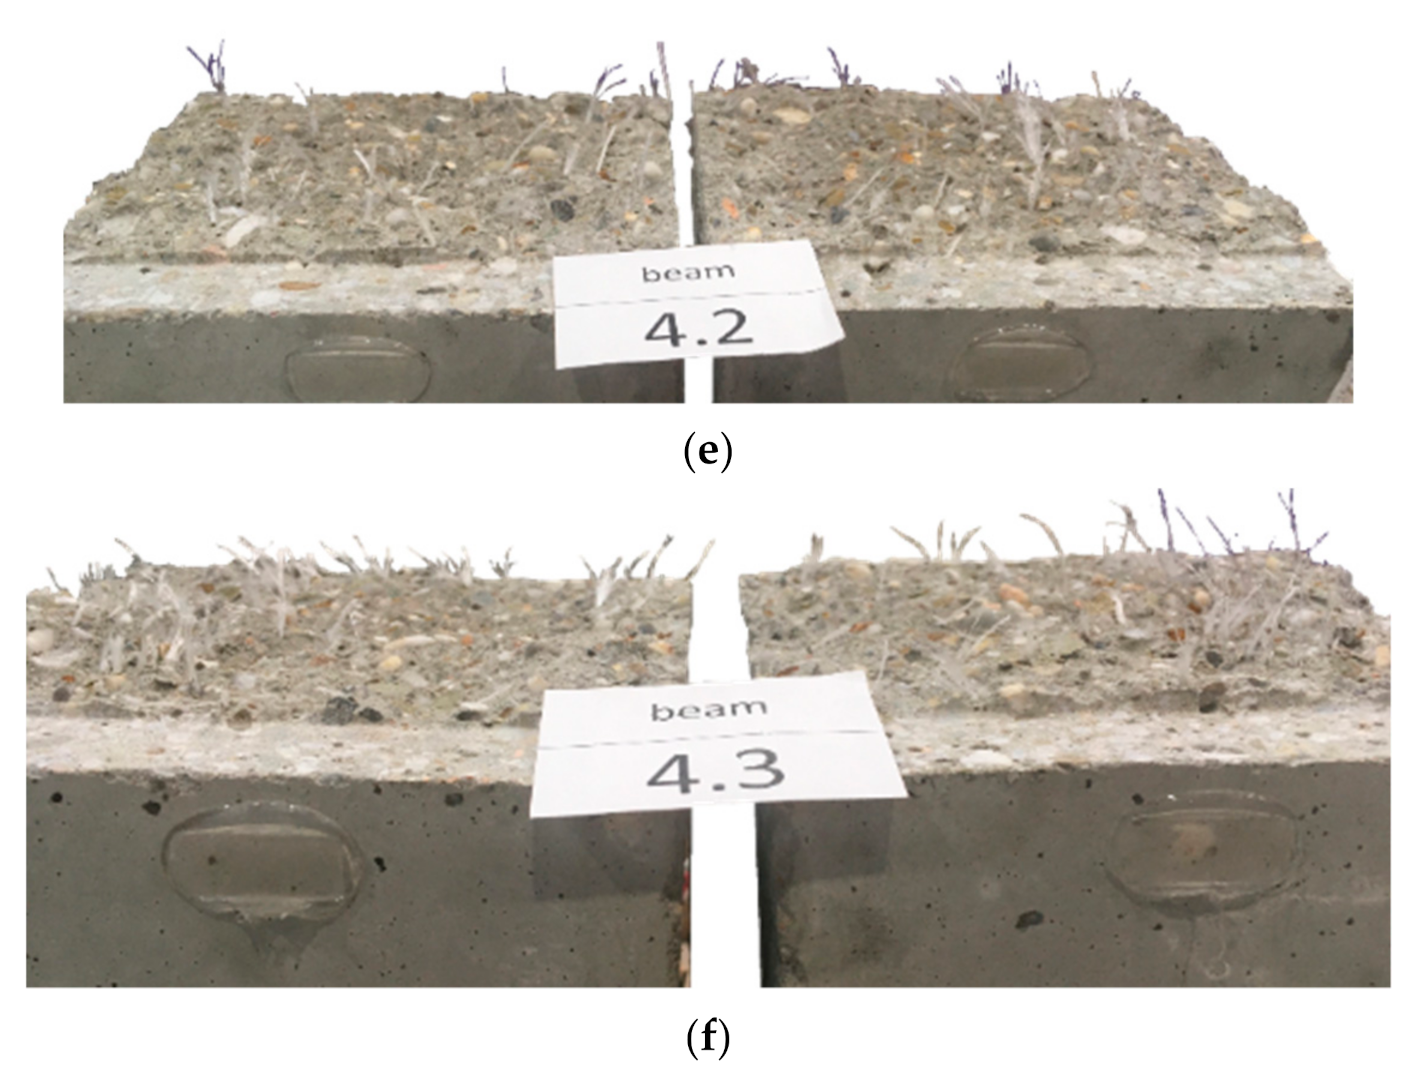
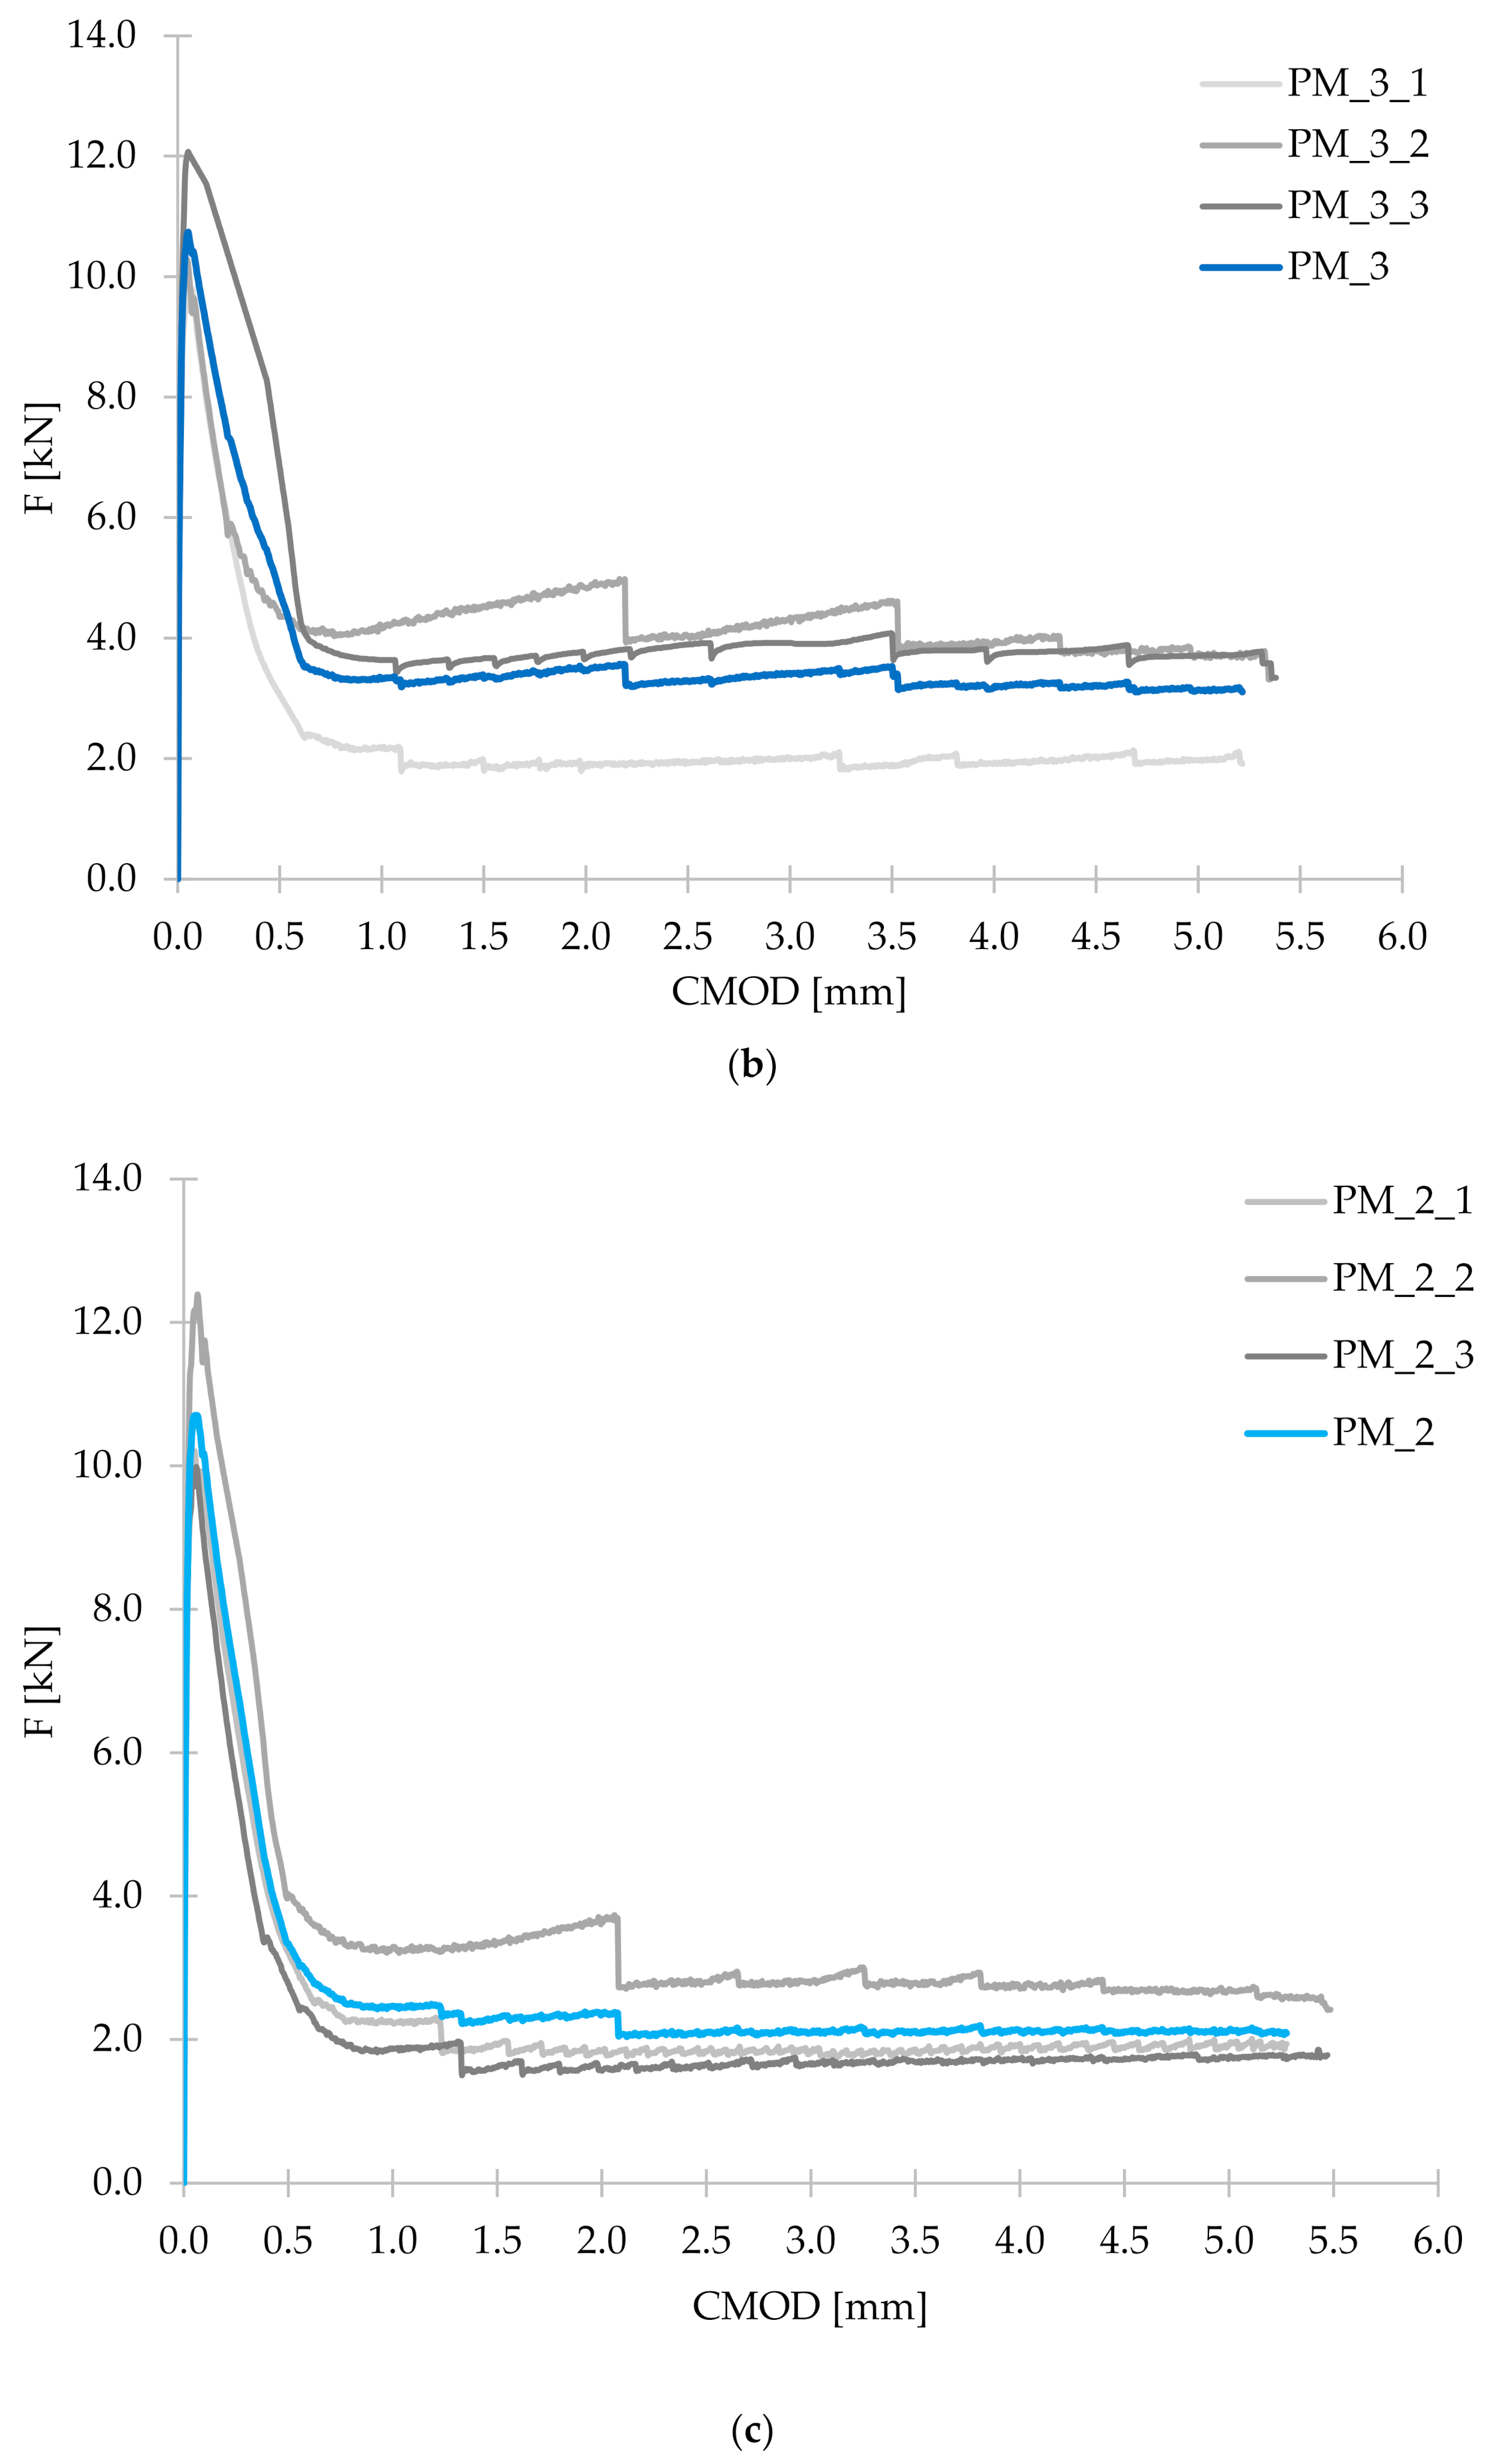
- The damage of beams without fibers was brittle and sudden, unlike for the fiber-reinforced concrete samples, which were still able to transfer a significant load with increasing crack mouth opening displacement, and possessed some ductility. The residual flexural tensile strengths of concrete with synthetic fibers usually reached higher values, when the fiber content was higher. Additionally, the mixture with the incorporation of the larger amount of fibers which were longer (lf = 54 mm) performed best. It was because longer fibers more efficiently bridged the macrocracks. It is also worth noting that among the mixtures with 2 kg/m3, the highest values for almost all residual strengths were achieved for the hybrid blend, which may indicate the positive effect of combining two different types of fibers.
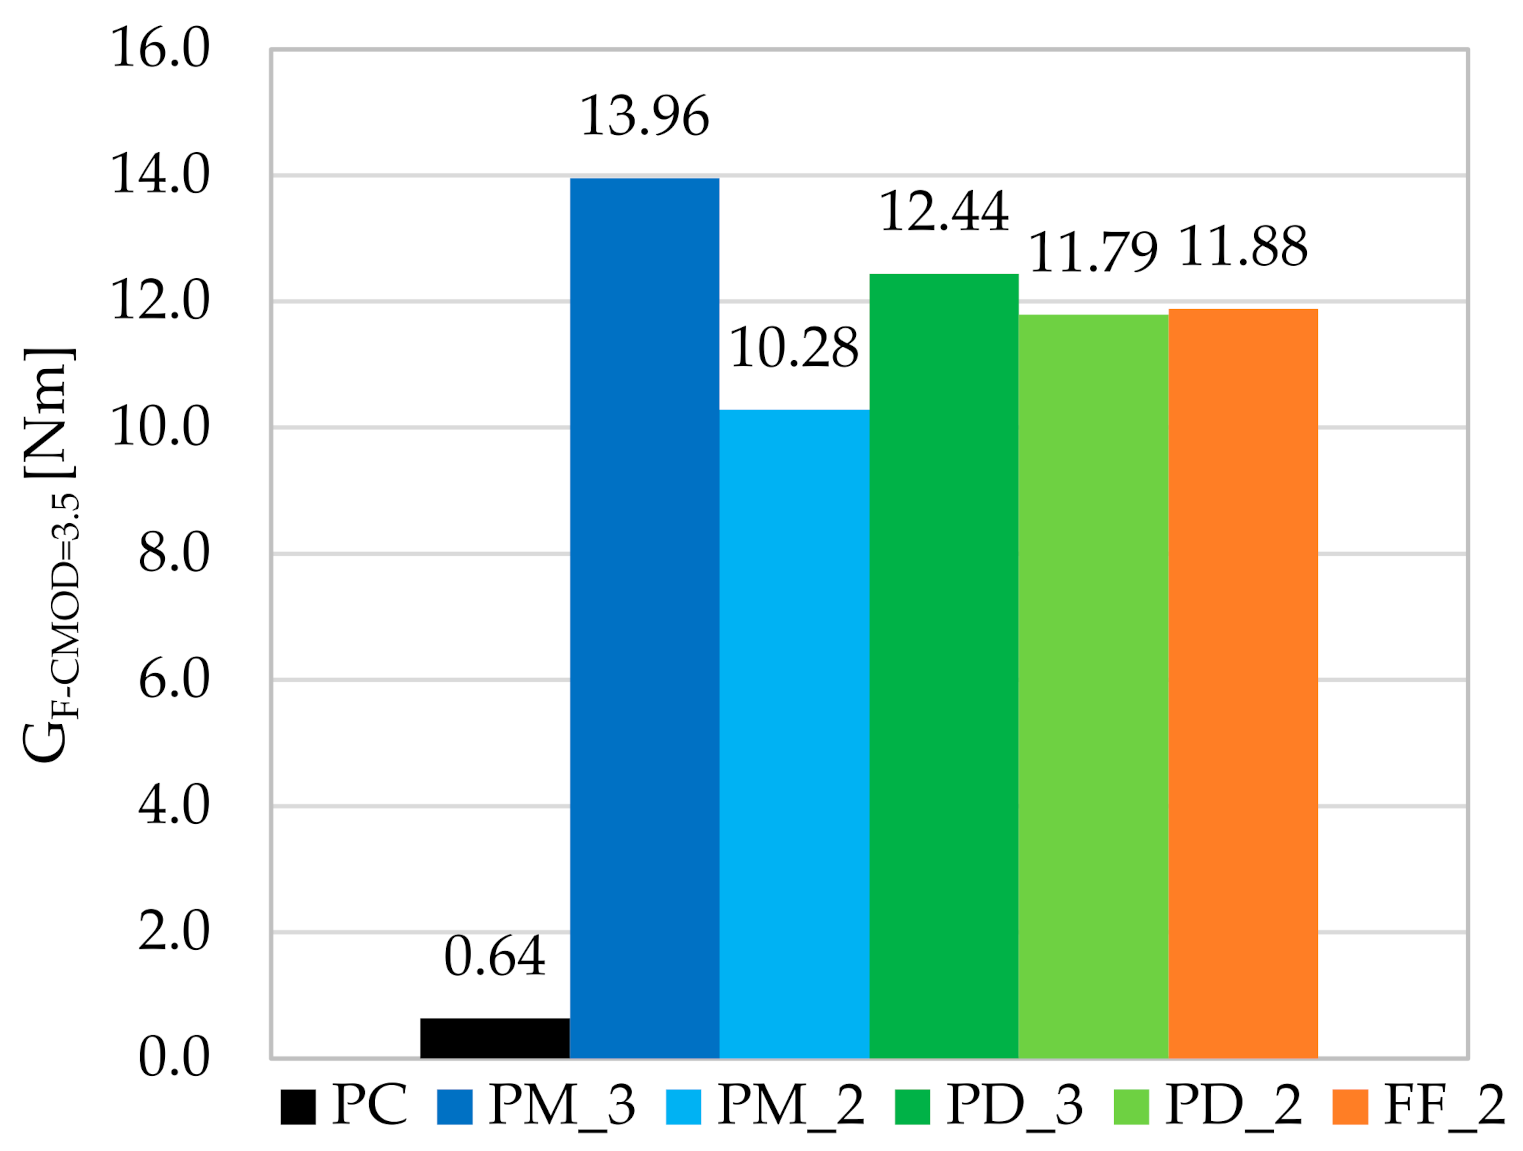
- As a result of the addition of fibers to concrete, the fracture energy, calculated up to the crack mouth opening displacement of 3.5 mm, increased from about 16 to 22 times depending on the type of the mixture.
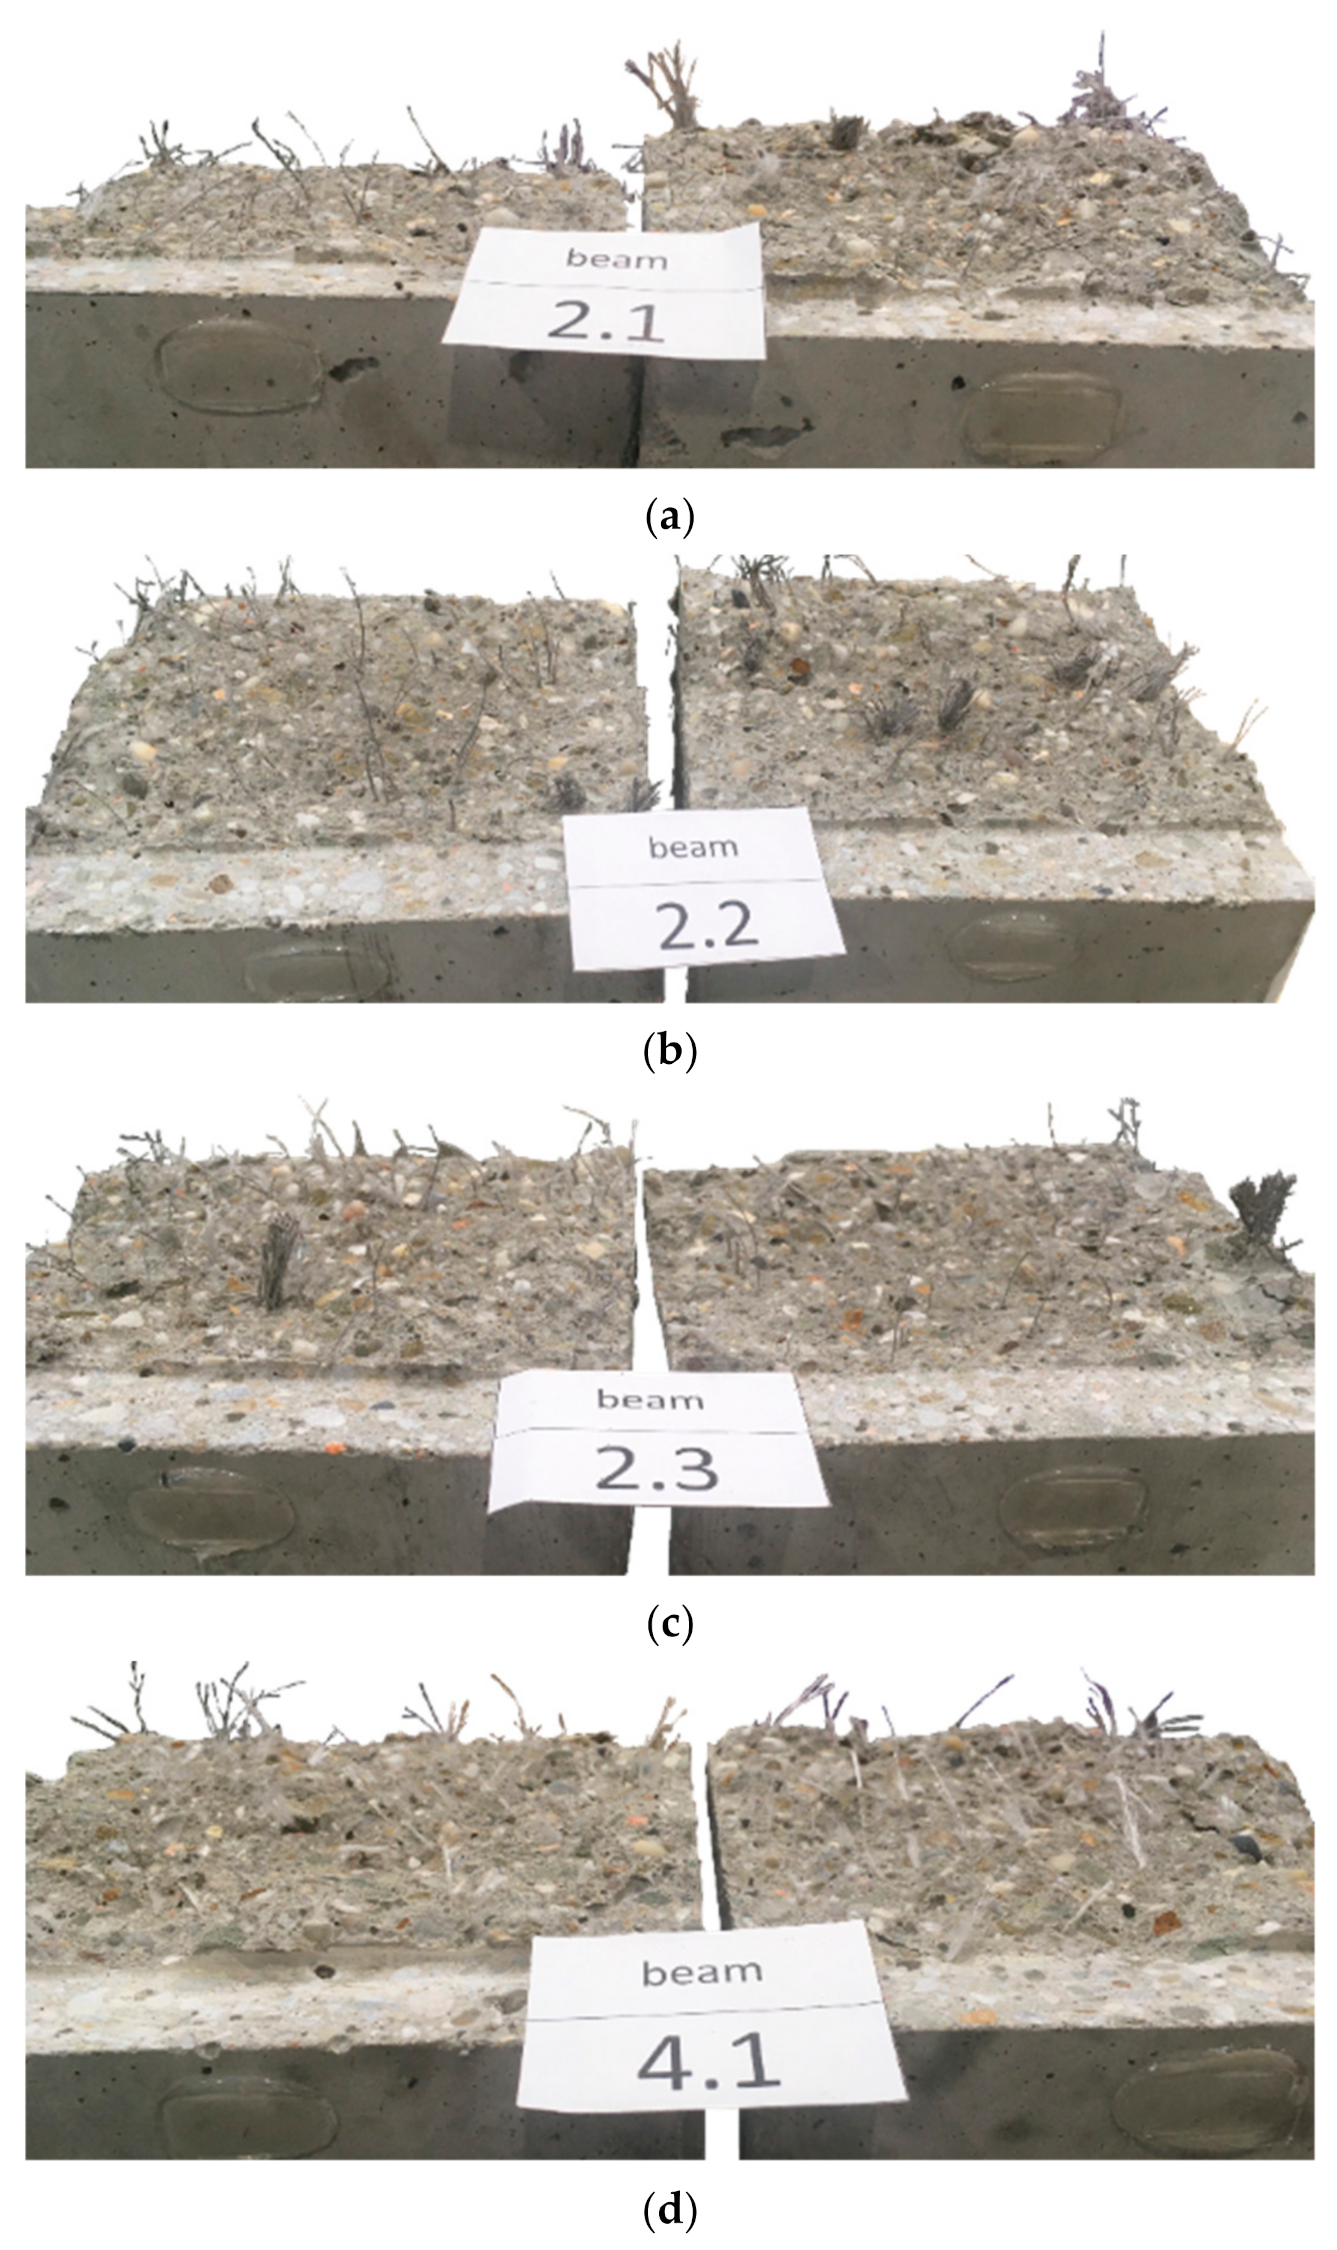
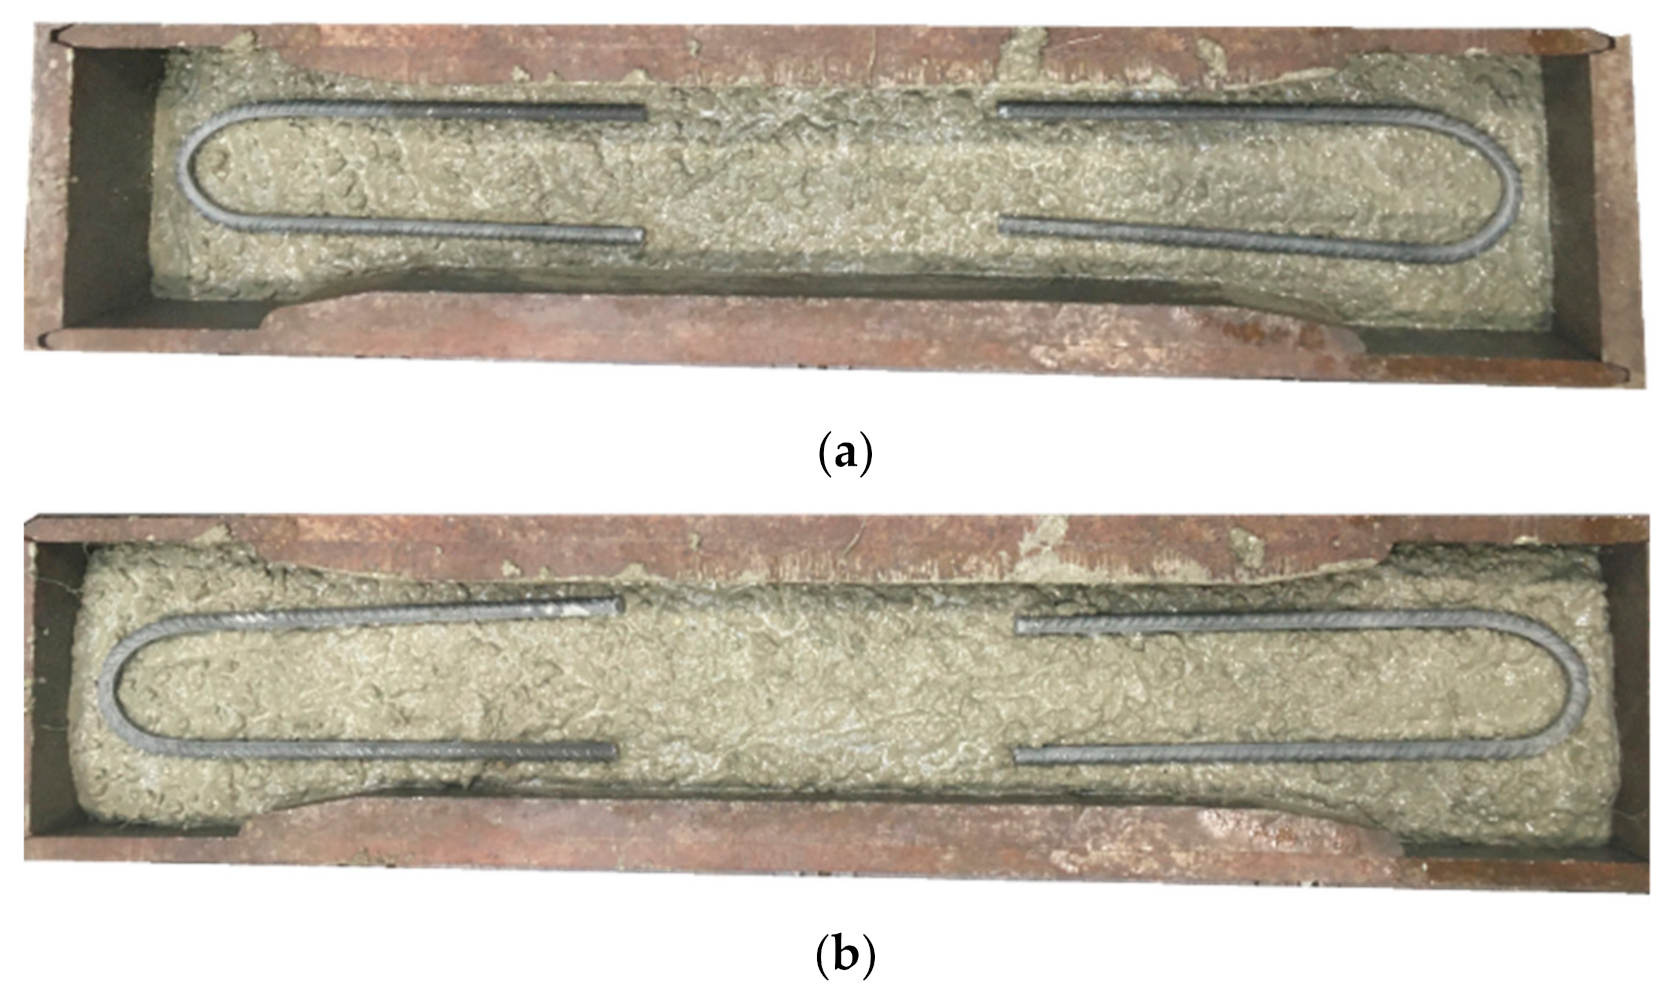
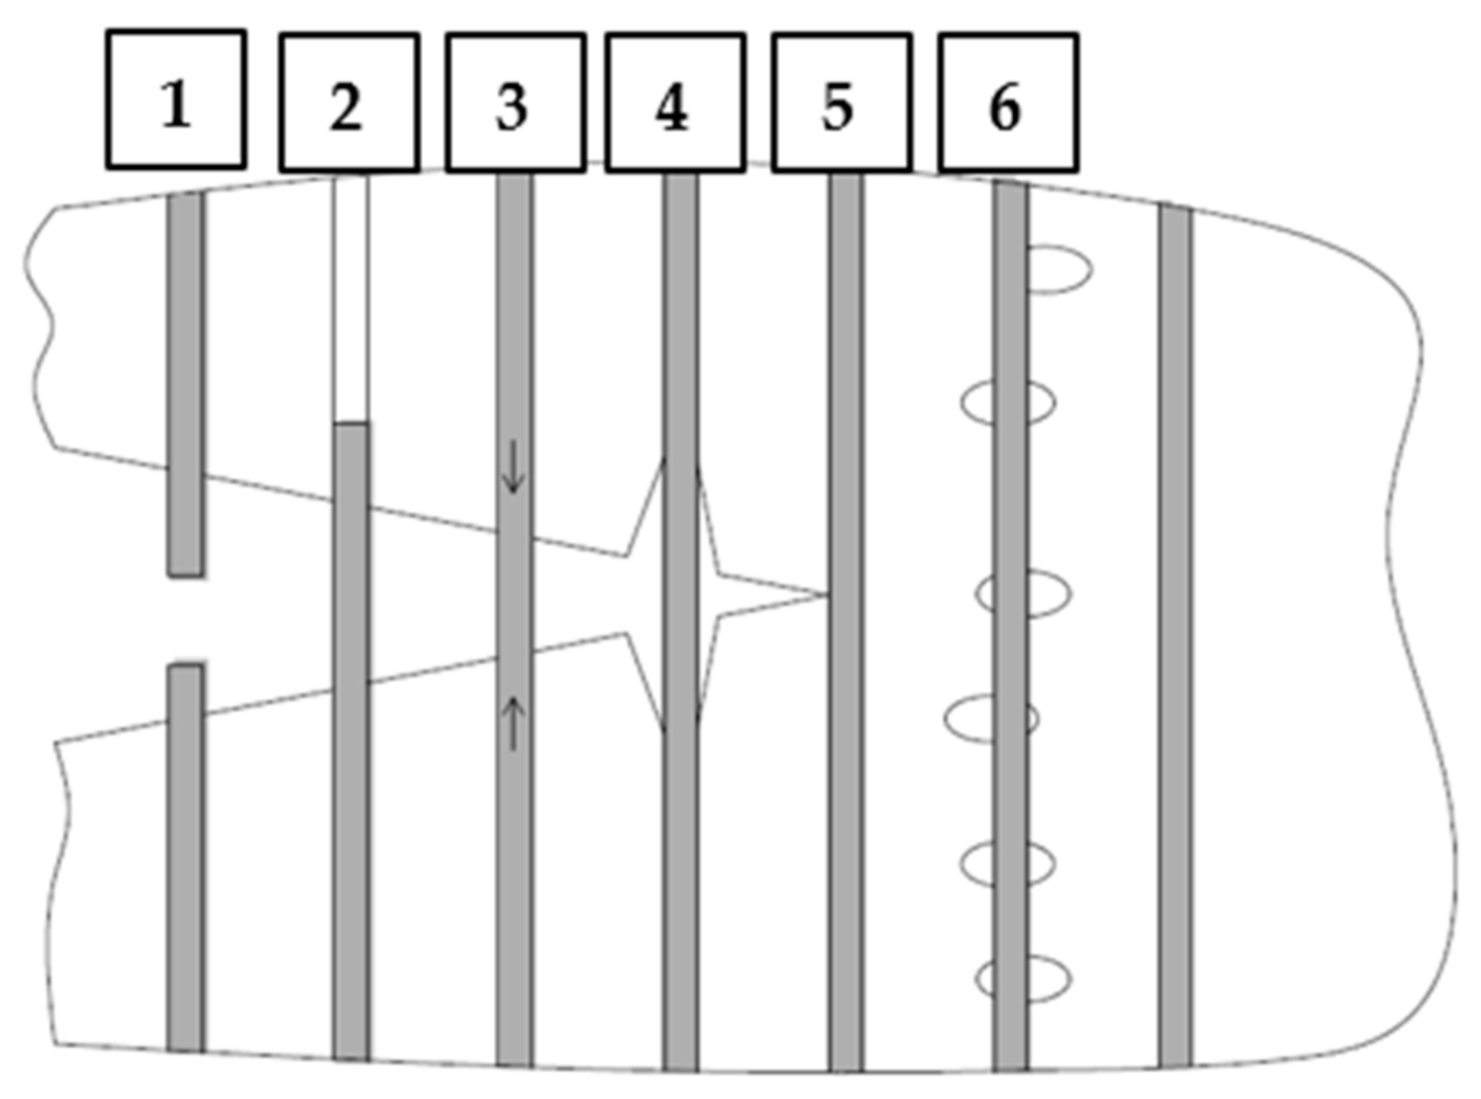
- Significant dispersion of the force-crack mouth opening displacement curves was the result of a small fracture area (high statistical variability of the number of fibers crossing this surface) resulting from the used test method-according to EN 14651. Additionally, in the case of some mixtures, it was noticeable that some of the twisted fibers did not disintegrate, which resulted in the uneven distribution of fibers. The reason for large deviations in the results of individual samples may be connected with a different number of fibers in the cross-section of the crack.
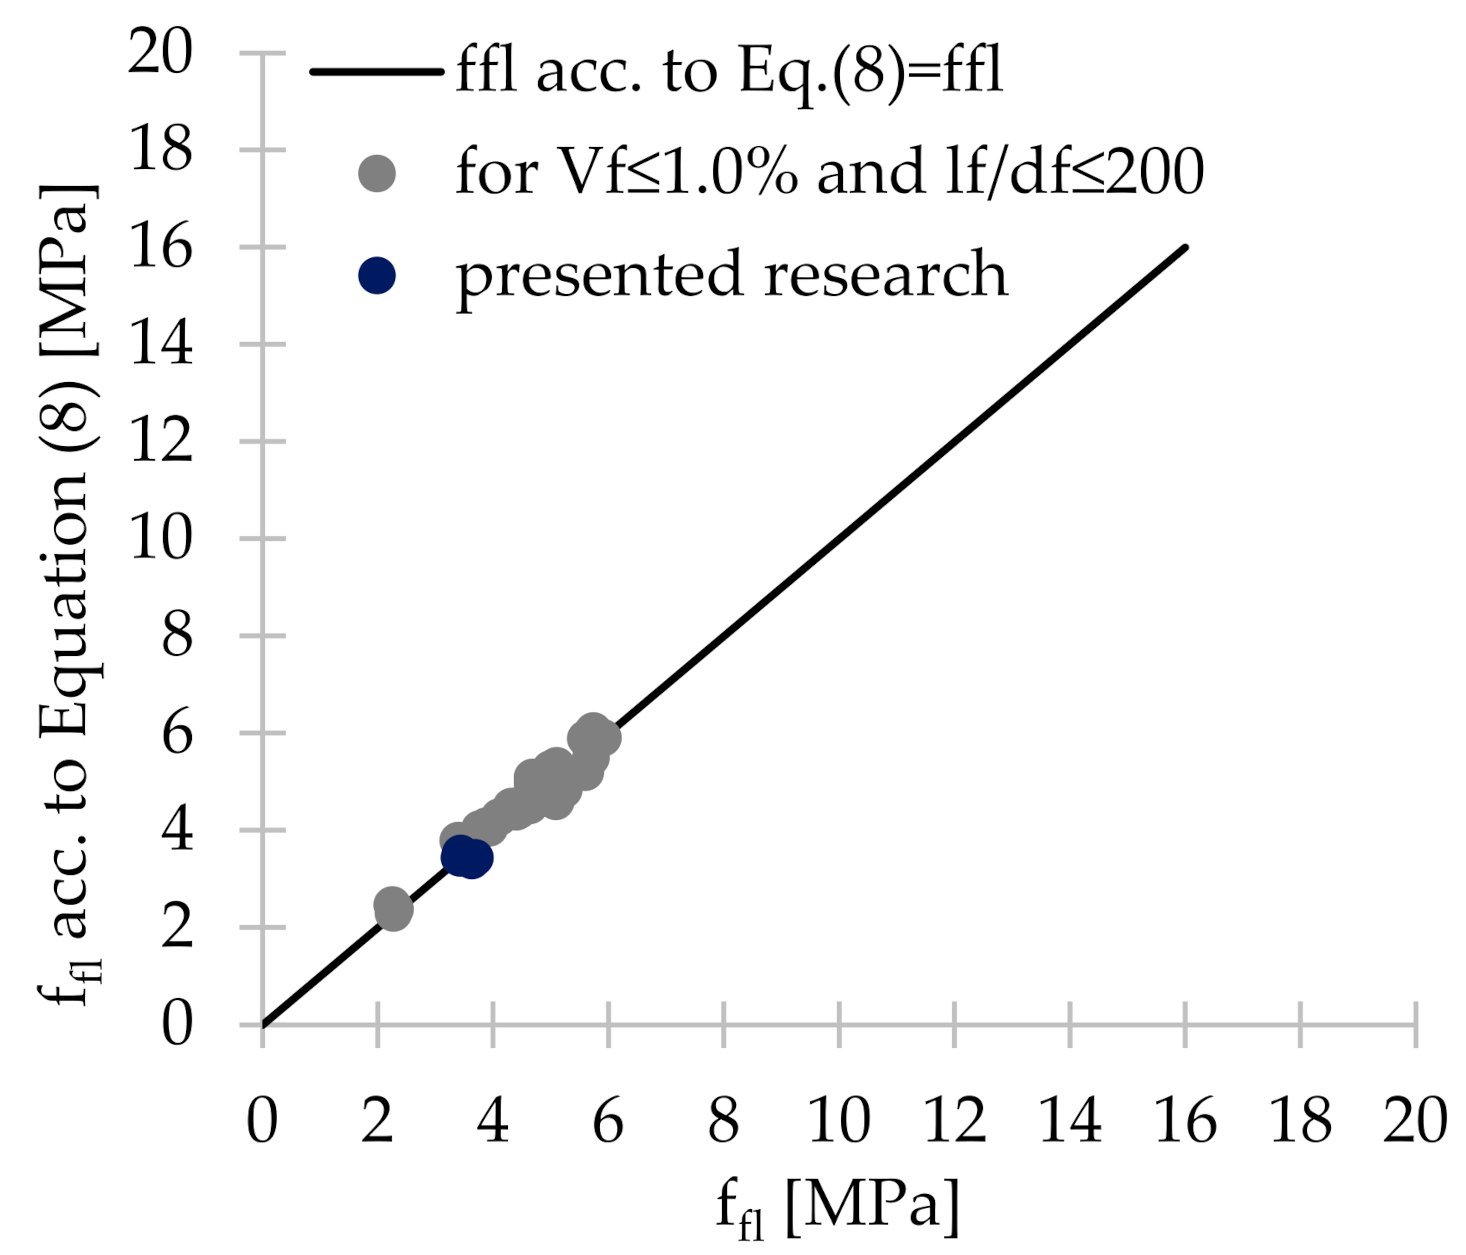
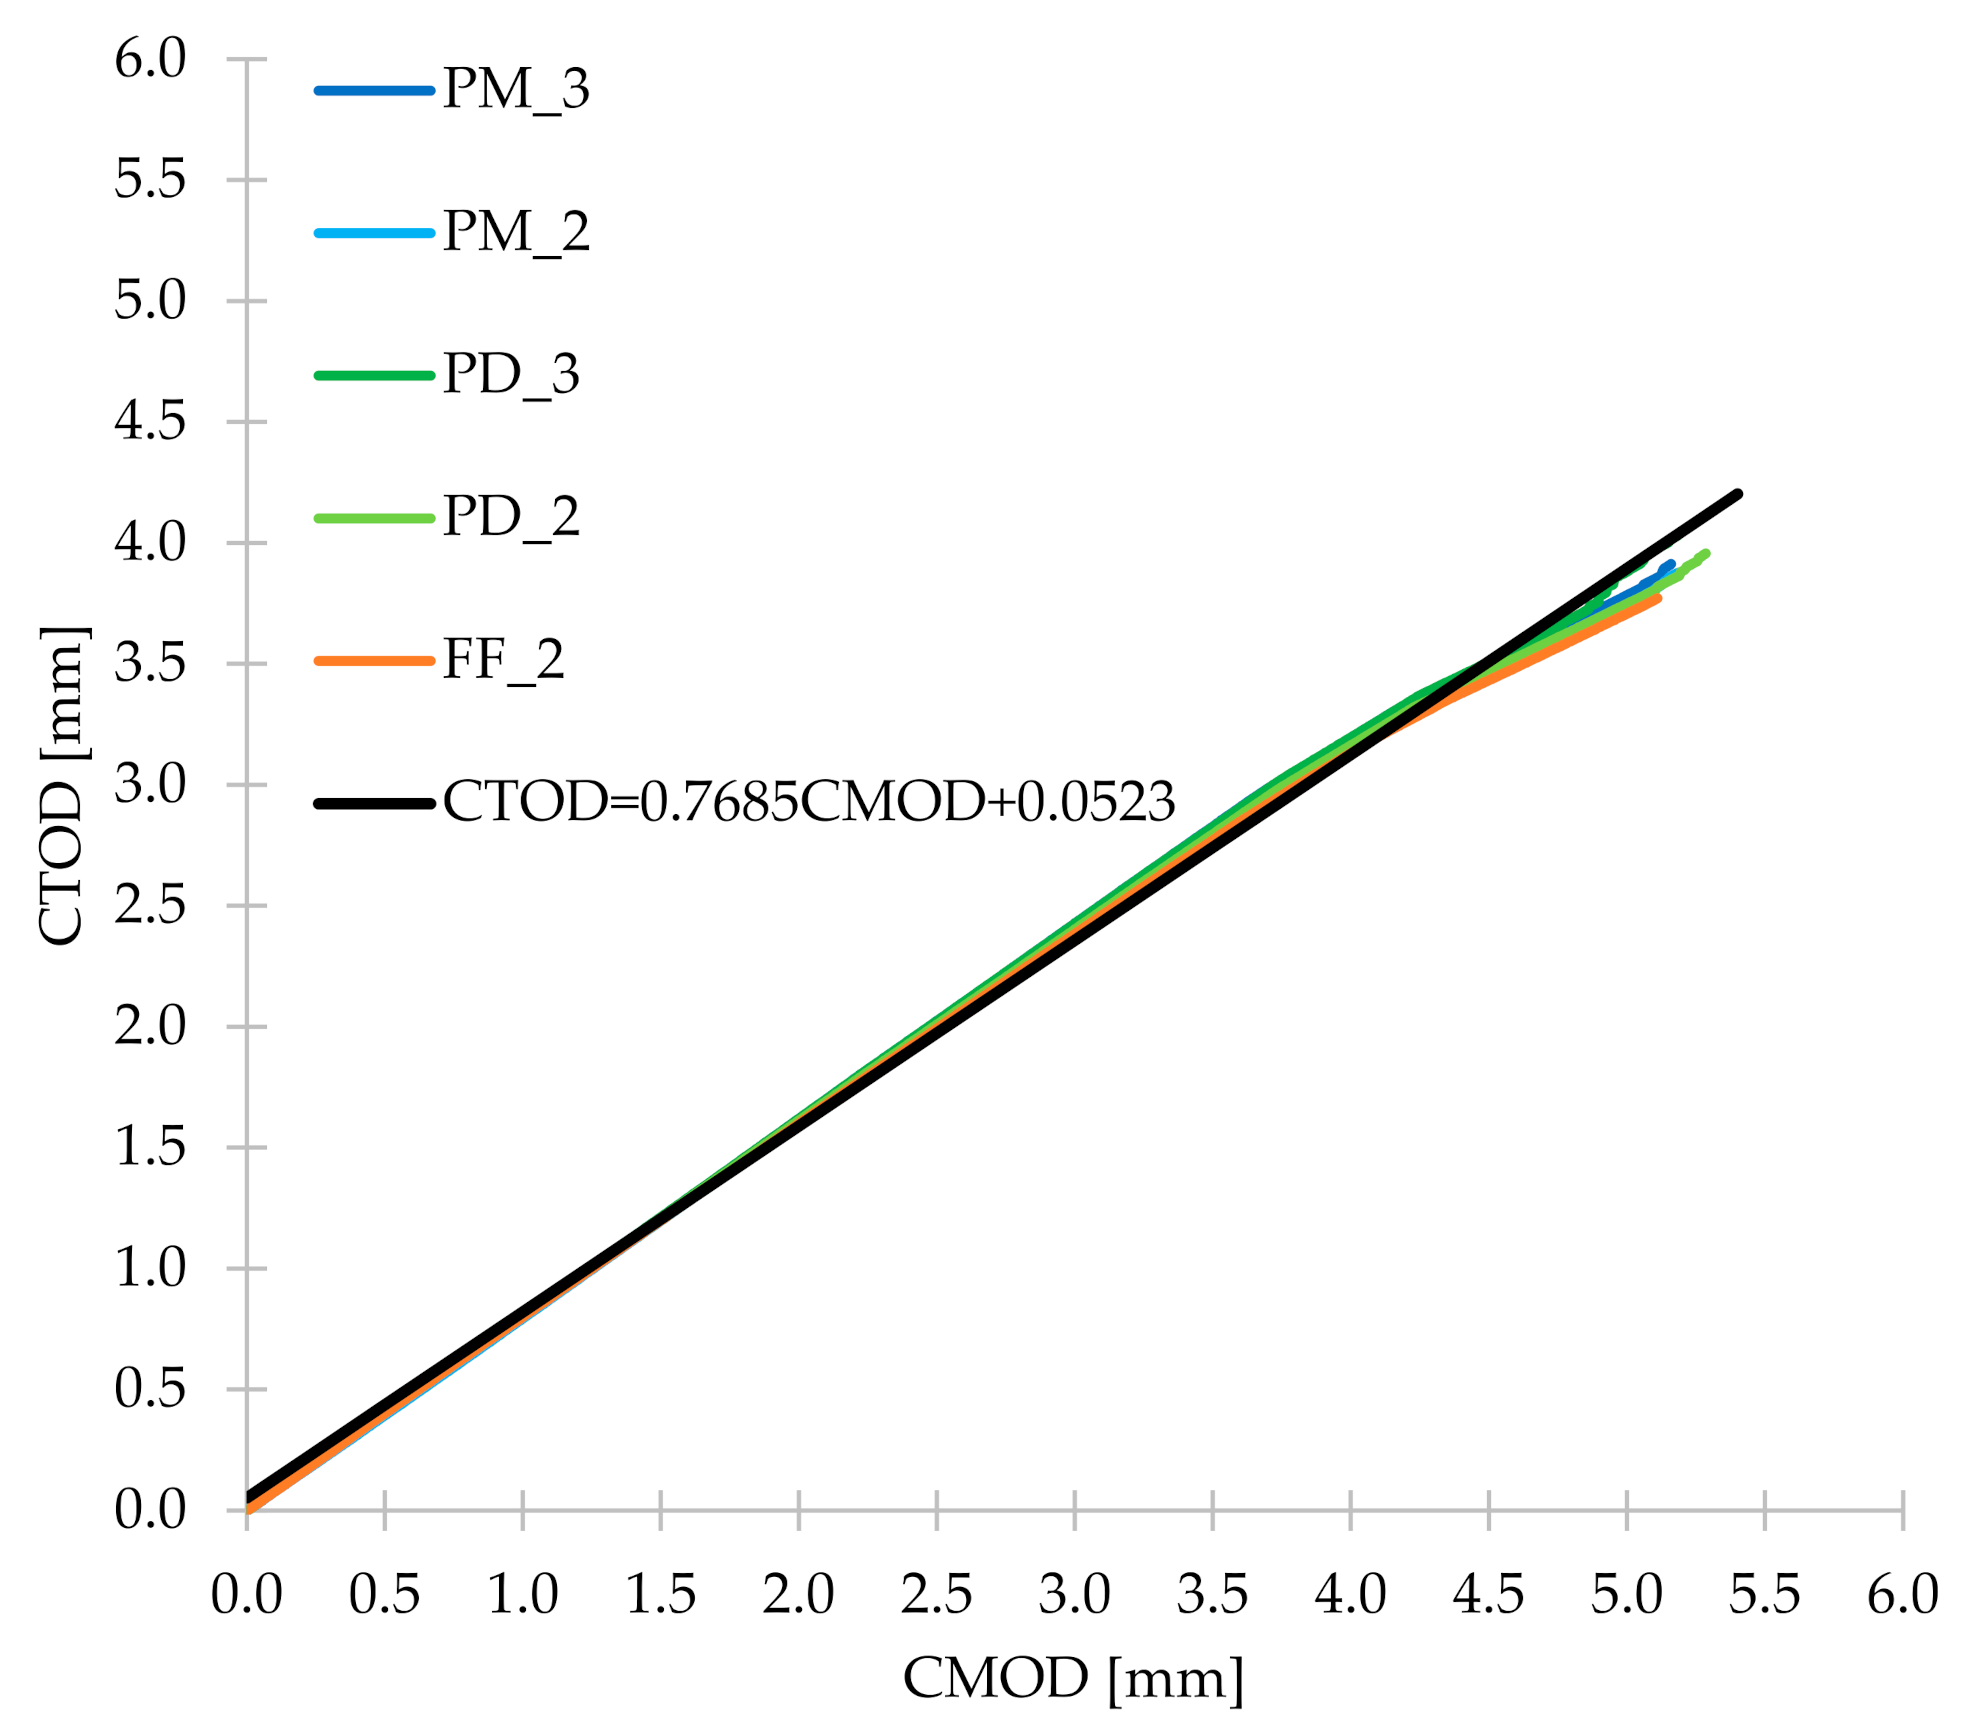
- The formula proposed by the authors for calculating the flexural tensile strength for concrete with polymer fibers with a nominal fiber content of ≤ 1.0% and slenderness up to 200 correlates very well with the results of the presented studies, as well as with those contained in various literature positions. Regarding the formula proposed in the EN 14651 standard to determine the relationship between the deflection and the crack mouth opening displacement, it was concluded that it differs from the relationship recorded during the presented tests of beams with synthetic fibers. As a result, a new formula was proposed by the authors, together with equations describing crack mouth opening displacement–crack tip opening displacement and crack tip opening displacement–deflection dependencies.
- According to Model Code 2010, the use of 2 and 3 kg/m3 of tested fibers in the concrete mix would not partially or fully replace traditional reinforcement in a form of steel bars. Furthermore, it was not possible to obtain σ-w curves from uniaxial tensile tests, and received results for maximum tensile strength did not show the clear influence of fibers’ incorporation on concrete.
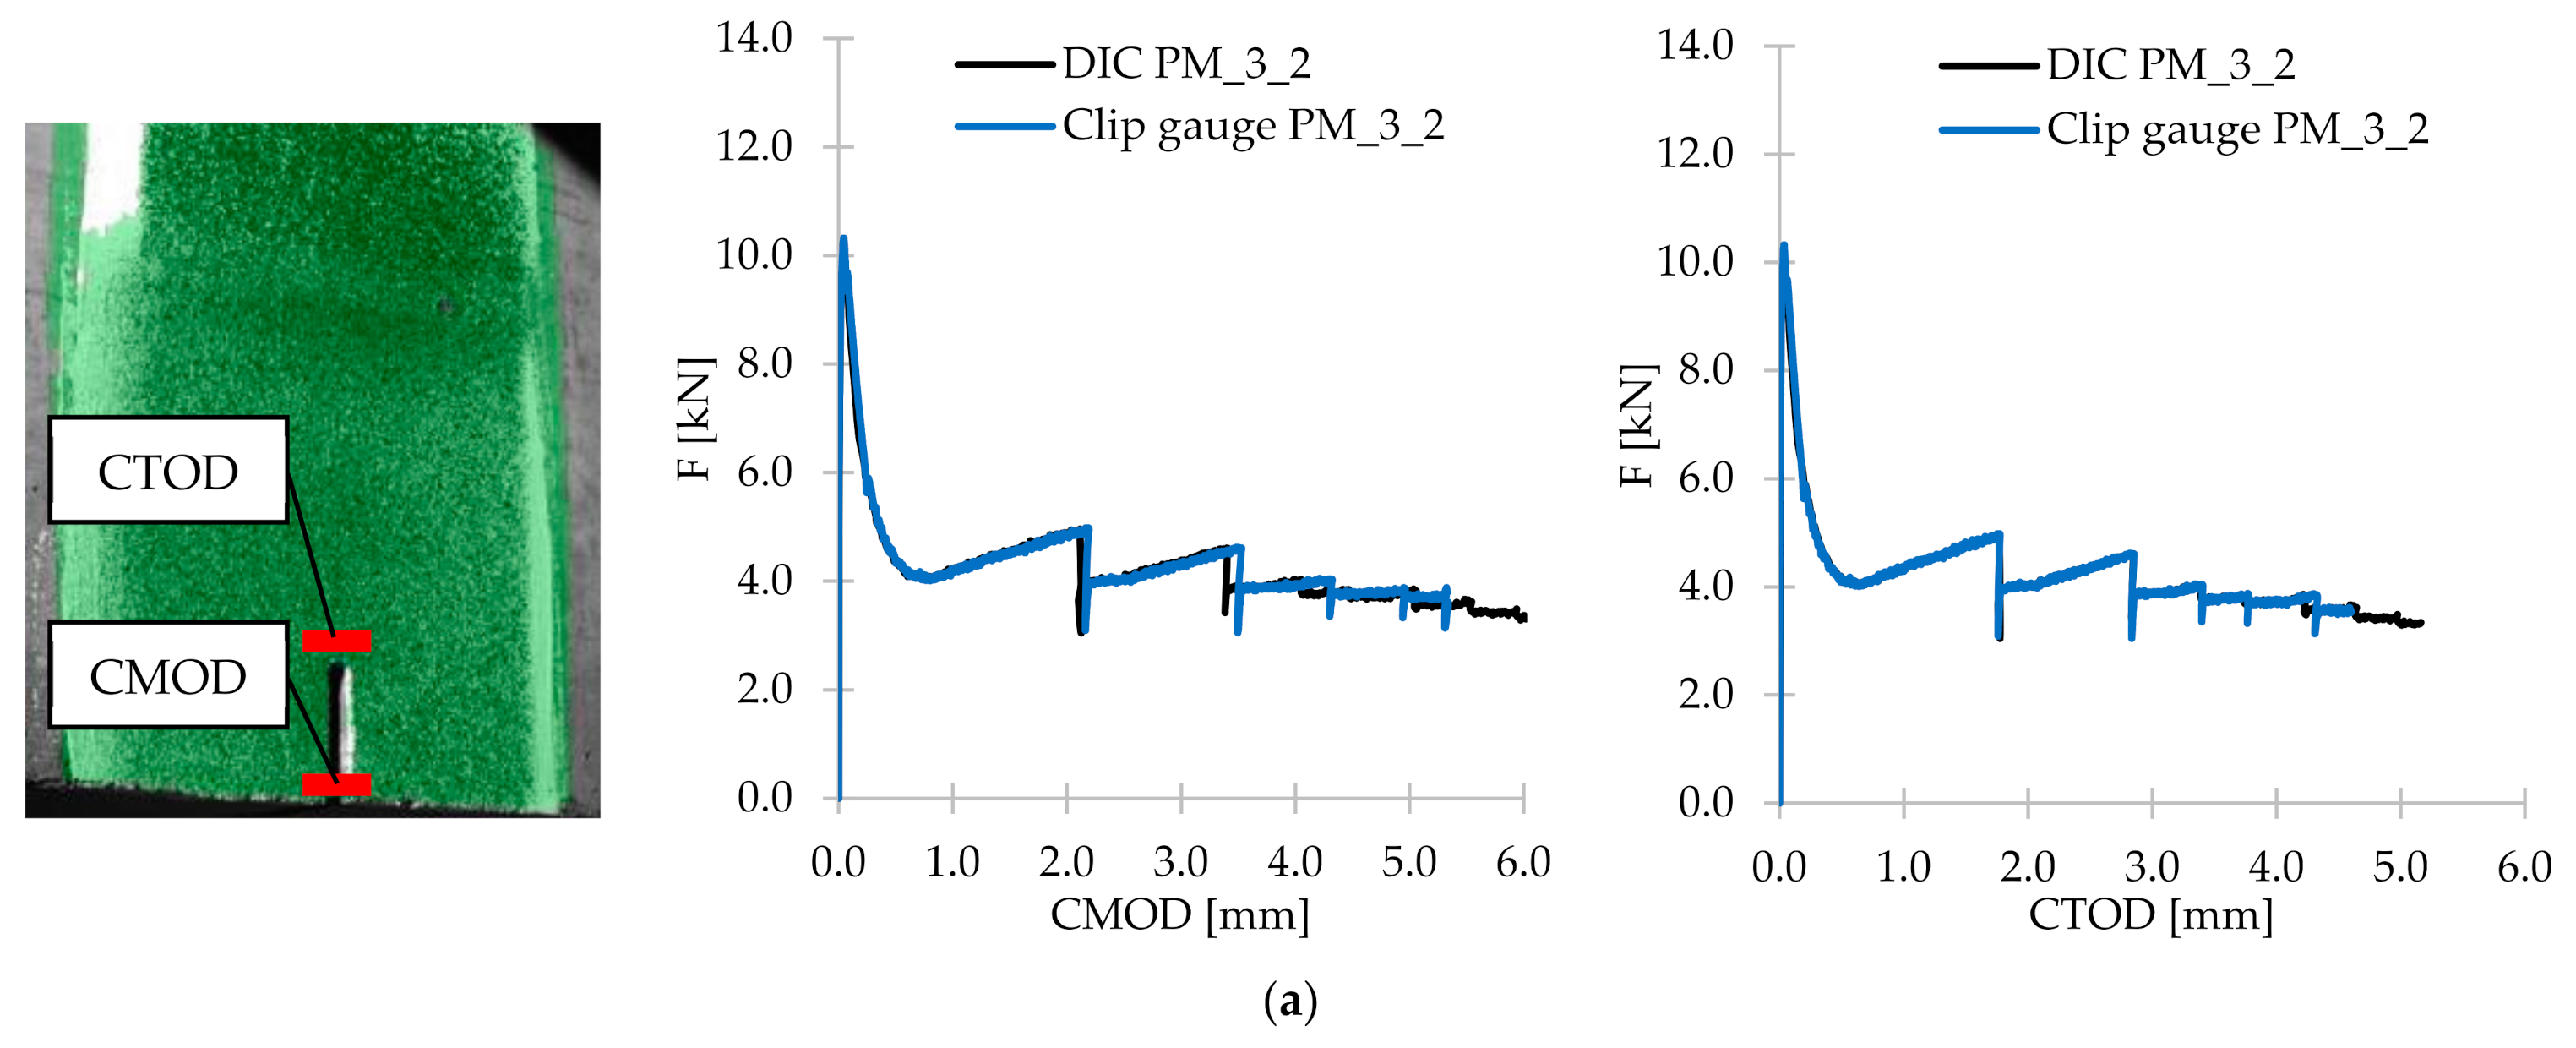
- The DIC technique can be successfully used to determine the crack mouth and crack tip opening displacements with very high accuracy.
Author Contributions
Funding
Institutional Review Board Statement
Informed Consent Statement
Data Availability Statement
Acknowledgments
Conflicts of Interest
References
- Cajka, R.; Marcalikova, Z.; Kozielova, M.; Mateckova, P.; Sucharda, O. Experiments on Fiber Concrete Foundation Slabs in Interaction with the Subsoil. Sustainability 2020, 12, 3939. [Google Scholar] [CrossRef]
- Sadowska-Buraczewska, B.; Szafraniec, M.; Barnat-Hunek, D.; Łagód, G. Flexural Behavior of Composite Concrete Slabs Made with Steel and Polypropylene Fibers Reinforced Concrete in the Compression Zone. Materials 2020, 13, 3616. [Google Scholar] [CrossRef]
- Ferrara, L.; Meda, A. Relationships between fibre distribution, workability and the mechanical properties of SFRC applied to precast roof elements. Mater. Struct. 2006, 39, 411–420. [Google Scholar] [CrossRef]
- Markovic, I. High-Performance Hybrid-Fibre Concrete; DUP Science DUP: Delft, The Netherlands, 2006; ISBN 9040726213. [Google Scholar]
- Walraven, J.C. High performance fiber reinforced concrete: Progress in knowledge and design codes. Mater. Struct. 2009, 42, 1247–1260. [Google Scholar] [CrossRef] [Green Version]
- Liao, L.; De La Fuente, A.; Cavalaro, S.H.P.; Aguado, A. Design procedure and experimental study on fibre reinforced concrete segmental rings for vertical shafts. Mater. Des. 2016, 92, 590–601. [Google Scholar] [CrossRef]
- Ferdous, W.; Aravinthan, T.; Manalo, A.; Van Erp, G. Composite railway sleepers—New developments and opportunities. In Proceedings of the 11th International Heavy Haul Association Conference: Operational Excellence (IHHA 2015), Perth, Australia, 21–24 June 2015. [Google Scholar]
- Ferdous, W.; Manalo, A.; Van Erp, G.; Aravinthan, T.; Kaewunruen, S.; Remennikov, A. Composite railway sleepers—Recent developments, challenges and future prospects. Compos. Struct. 2015, 134, 158–168. [Google Scholar] [CrossRef]
- Aslani, F.; Nejadi, S. Self-compacting concrete incorporating steel and polypropylene fibers: Compressive and tensile strengths, moduli of elasticity and rupture, compressive stress–strain curve, and energy dissipated under compression. Compos. Part B Eng. 2013, 53, 121–133. [Google Scholar] [CrossRef]
- Smarzewski, P. Effect of Curing Period on Properties of Steel and Polypropylene Fibre Reinforced Ultra-High Performance Concrete. IOP Conf. Ser. Mater. Sci. Eng. 2017, 245, 032059. [Google Scholar] [CrossRef]
- Feng, J.; Sun, W.; Zhai, H.; Wang, L.; Dong, H.; Wu, Q. Experimental Study on Hybrid Effect Evaluation of Fiber Reinforced Concrete Subjected to Drop Weight Impacts. Materials 2018, 11, 2563. [Google Scholar] [CrossRef] [Green Version]
- Mohajerani, A.; Hui, S.-Q.; Mirzababaei, M.; Arulrajah, A.; Horpibulsuk, S.; Kadir, A.A.; Rahman, T.; Maghool, F. Amazing Types, Properties, and Applications of Fibres in Construction Materials. Materials 2019, 12, 2513. [Google Scholar] [CrossRef] [PubMed] [Green Version]
- Glinicki, M.A. Testing of macro-fibres reinforced concrete for industrial floors. Cem. Wapno Beton 2008, 13, 184–195. [Google Scholar]
- Blazy, J.; Blazy, R. Polypropylene fiber reinforced concrete and its application in creating architectural forms of public spaces. Case Stud. Constr. Mater. 2021, 14, e00549. [Google Scholar] [CrossRef]
- Mohammadhosseini, H.; Alrshoudi, F.; Tahir, M.M.; Alyousef, R.; Alghamdi, H.; Alharbi, Y.R.; Alsaif, A. Durability and thermal properties of prepacked aggregate concrete reinforced with waste polypropylene fibers. J. Build. Eng. 2020, 32, 101723. [Google Scholar] [CrossRef]
- Richardson, A. Polypropylene fibres in concrete with regard to durability. Struct. Surv. 2003, 21, 87–94. [Google Scholar] [CrossRef]
- Rashid, M.U. Experimental investigation on durability characteristics of steel and polypropylene fiber reinforced concrete exposed to natural weathering action. Constr. Build. Mater. 2020, 250, 118910. [Google Scholar] [CrossRef]
- Manalo, A.; Maranan, G.; Benmokrane, B.; Cousin, P.; Alajarmeh, O.; Ferdous, W.; Liang, R.; Hota, G. Comparative durability of GFRP composite reinforcing bars in concrete and in simulated concrete environments. Cem. Concr. Compos. 2020, 109, 103564. [Google Scholar] [CrossRef]
- Bošnjak, J.; Sharma, A.; Grauf, K. Mechanical Properties of Concrete with Steel and Polypropylene Fibres at Elevated Temperatures. Fibers 2019, 7, 9. [Google Scholar] [CrossRef] [Green Version]
- EN 14889-2:2007. Fibres for Concrete—Part 2: Polymer Fibres—Definitions, Specifications and Conformity; European Committee for Standardization: Brussels, Belgium, 2007. [Google Scholar]
- Ma, K.; Qi, T.; Liu, H.; Wang, H. Shear Behavior of Hybrid Fiber Reinforced Concrete Deep Beams. Materials 2018, 11, 2023. [Google Scholar] [CrossRef] [Green Version]
- He, J.; Chen, W.; Zhang, B.; Yu, J.; Liu, H. The Mechanical Properties and Damage Evolution of UHPC Reinforced with Glass Fibers and High-Performance Polypropylene Fibers. Materials 2021, 14, 2455. [Google Scholar] [CrossRef] [PubMed]
- Guerini, V.; Conforti, A.; Plizzari, G.; Kawashima, S. Influence of Steel and Macro-Synthetic Fibers on Concrete Properties. Fibers 2018, 6, 47. [Google Scholar] [CrossRef] [Green Version]
- Lofgren, I.; Stang, H.; Olesen, J.F. The WST method, a fracture mechanics test method for FRC. Mater. Struct. 2007, 41, 197–211. [Google Scholar] [CrossRef]
- Skoček, J.; Stang, H. Inverse analysis of the wedge-splitting test. Eng. Fract. Mech. 2008, 75, 3173–3188. [Google Scholar] [CrossRef]
- International Federation for Structural Concrete Model Code 2010, Final draft. Struct. Concr. 2013, 14, 10–18.
- Louch, K.; Day, R.; Hulett, T.; Woods, N.; Eddy, D.; Simpson, D. Technical Report Concrete Industrial Ground Floors. A Guide to Design and Construction, 4th ed.; The Concrete Society: Camberley, UK, 2016; Volume 29, ISBN 9781904482772. [Google Scholar]
- EN 14651+A1:2007. Test Method for Metallic Fibre Concrete-Measuring the Flexural Tensile Strength (Limit of Proportionality (LOP), Residual); European Committee for Standardization: Brussels, Belgium, 2007. [Google Scholar]
- Babski, V.; Hüsken, G.; Pirskawetz, S.; Ehlers, N.; Kühne, H.-C.; Brouwers, H.J.H. Characterisation of Ultra-High Performance Fibre Reinforced Concrete (UHPFC) under Tensile Loading by Acoustic Emission and Optical Deformation Analysis. In Proceedings of the Hipermat 2016—4th International Symposium on Ultra-High Performance Concrete and High Performance Construction Materials, Kassel, Germany, 9–11 March 2016; pp. 1–9. [Google Scholar]
- Skarżyński, L.; Suchorzewski, J. Mechanical and fracture properties of concrete reinforced with recycled and industrial steel fibers using Digital Image Correlation technique and X-ray micro computed tomography. Constr. Build. Mater. 2018, 183, 283–299. [Google Scholar] [CrossRef]
- Wu, Z.; Rong, H.; Zheng, J.; Xu, F.; Dong, W. An experimental investigation on the FPZ properties in concrete using digital image correlation technique. Eng. Fract. Mech. 2011, 78, 2978–2990. [Google Scholar] [CrossRef]
- Alam, S.Y.; Saliba, J.; Loukili, A. Fracture examination in concrete through combined digital image correlation and acoustic emission techniques. Constr. Build. Mater. 2014, 69, 232–242. [Google Scholar] [CrossRef] [Green Version]
- Manning, M.P.; Weldon, B.D.; McGinnis, M.J.; Jauregui, D.V.; Newtson, C.M. Locally developed Ultra-High Performance Concrete: Behaviour Analysis of prestressed Channel Girders. In Proceedings of the Hipermat 2016—4th International Symposium on Ultra-High Performance Concrete and High Performance Construction Materials, Kassel, Germany, 8–11 March 2016; pp. 1–9. [Google Scholar]
- Randl, N.; Mészöly, T.; Harsányi, P. Load Bearing Behaviour of slender UHPC Beam Members in Shear. In Proceedings of the Hipermat 2016—4th International Symposium on Ultra-High Performance Concrete and High Performance Construction Materials, Kassel, Germany, 8–11 March 2016; pp. 1–8. [Google Scholar]
- Shih, M.-H.; Sung, W.-P. Application of digital image correlation method for analysing crack variation of reinforced concrete beams. Sadhana 2013, 38, 723–741. [Google Scholar] [CrossRef] [Green Version]
- Tsangouri, E.; Aggelis, D.G.; Van Tittelboom, K.; De Belie, N.; Van Hemelrijck, D. Detecting the Activation of a Self-Healing Mechanism in Concrete by Acoustic Emission and Digital Image Correlation. Sci. World J. 2013, 2013, 1–10. [Google Scholar] [CrossRef]
- Aggelis, D.; Verbruggen, S.; Tsangouri, E.; Tysmans, T.; Van Hemelrijck, D. Characterization of mechanical performance of concrete beams with external reinforcement by acoustic emission and digital image correlation. Constr. Build. Mater. 2013, 47, 1037–1045. [Google Scholar] [CrossRef]
- Srikar, G.; Anand, G.; Prakash, S.S. A Study on Residual Compression Behavior of Structural Fiber Reinforced Concrete Exposed to Moderate Temperature Using Digital Image Correlation. Int. J. Concr. Struct. Mater. 2016, 10, 75–85. [Google Scholar] [CrossRef] [Green Version]
- Bertelsen, I.; Ottosen, L.M.; Fischer, G. Quantitative analysis of the influence of synthetic fibres on plastic shrinkage cracking using digital image correlation. Constr. Build. Mater. 2018, 199, 124–137. [Google Scholar] [CrossRef]
- Rucka, M.; Wojtczak, E.; Knak, M.; Kurpińska, M. Characterization of fracture process in polyolefin fibre-reinforced concrete using ultrasonic waves and digital image correlation. Constr. Build. Mater. 2021, 280, 122522. [Google Scholar] [CrossRef]
- Bhosale, A.B.; Prakash, S.S. Crack Propagation Analysis of Synthetic vs. Steel vs. Hybrid Fibre-Reinforced Concrete Beams Using Digital Image Correlation Technique. Int. J. Concr. Struct. Mater. 2020, 14, 1–19. [Google Scholar] [CrossRef]
- Legeron, F.; Paultre, P. Prediction of modulus of rupture of concrete. ACI Mater. J. 2000, 97, 193–200. [Google Scholar]
- Glinicki, M.A. Concrete with structural reinforcement. In Proceedings of the XXV Polish Workshop of Structural Designer Work, Szczyrk, Poland, 10–13 March 2010; pp. 279–308. (In Polish). [Google Scholar]
- Glinicki, M.A. Assessment and design of fibre reinforced concrete based on residual strength. Roads Bridges 2002, 5–36. (In Polish) [Google Scholar]
- Swamy, R.; Mangat, P. Influence of fiber geometry on the properties of steel fiber reinforced concrete. Cem. Concr. Res. 1974, 4, 451–465. [Google Scholar] [CrossRef]
- Carlesso, D.M.; Cavalaro, S.; de la Fuente, A. Flexural fatigue of pre-cracked plastic fibre reinforced concrete: Experimental study and numerical modeling. Cem. Concr. Compos. 2021, 115, 103850. [Google Scholar] [CrossRef]
- Camille, C.; Hewage, D.K.; Mirza, O.; Mashiri, F.; Kirkland, B.; Clarke, T. Performance behaviour of macro-synthetic fibre reinforced concrete subjected to static and dynamic loadings for sleeper applications. Constr. Build. Mater. 2021, 270, 121469. [Google Scholar] [CrossRef]
- Soltanzadeh, F.; Cunha, V.; Barros, J. Assessment of different methods for characterization and simulation of post-cracking behavior of self-compacting steel fiber reinforced concrete. Constr. Build. Mater. 2019, 227, 116704. [Google Scholar] [CrossRef]
- ASTM C1018-94. Standard Test Method for Flexural Toughness and First-Crack Strength of Fiber-Reinforced Concrete (Using Beam with Third-Point Loading); ASTM International: West Conshohocken, PA, USA, 1994. [Google Scholar]
- Chajec, A.; Sadowski, L. The Effect of Steel and Polypropylene Fibers on the Properties of Horizontally Formed Concrete. Materials 2020, 13, 5827. [Google Scholar] [CrossRef] [PubMed]
- Hussain, I.; Ali, B.; Akhtar, T.; Jameel, M.S.; Raza, S.S. Comparison of mechanical properties of concrete and design thickness of pavement with different types of fiber-reinforcements (steel, glass, and polypropylene). Case Stud. Constr. Mater. 2020, 13, e00429. [Google Scholar] [CrossRef]
- Ahmed, T.W.; Ali, A.A.M.; Zidan, R.S. Properties of high strength polypropylene fiber concrete containing recycled aggregate. Constr. Build. Mater. 2020, 241, 118010. [Google Scholar] [CrossRef]
- Hongbo, Z.; Haiyun, Z.; Hongxiang, G. Characteristics of ductility enhancement of concrete by a macro polypropylene fiber. Results Mater. 2020, 100087. [Google Scholar] [CrossRef]
- Liang, N.; Dai, J.; Liu, X. Study on Tensile Damage Constitutive Model for Multiscale Polypropylene Fiber Concrete. Adv. Mater. Sci. Eng. 2016, 2016, 1–6. [Google Scholar] [CrossRef] [Green Version]
- Banthia, N.; Moncef, A.; Chokri, K.; Sheng, J. Uniaxial tensile response of microfibre reinforced cement composites. Mater. Struct. 1995, 28, 507–517. [Google Scholar] [CrossRef]
- Abrishambaf, A.; Pimentel, M.; Nunes, S. Influence of fibre orientation on the tensile behaviour of ultra-high performance fibre reinforced cementitious composites. Cem. Concr. Res. 2017, 97, 28–40. [Google Scholar] [CrossRef]
- EN 197-1:2012. Cement—Part 1: Composition, Specifications and Conformity Criteria for Common Cements; European Committee for Standardization: Brussels, Belgium, 2012. [Google Scholar]
- EN 12350-2:2019-07. Testing Fresh Concrete—Part 2: Slump Test; European Committee for Standardization: Brussels, Belgium, 2019. [Google Scholar]
- EN 12350-8:2012. Testing Fresh Concrete—Part 8: Self-Compacting Concete—Slump-Flow Test; European Committee for Standardization: Brussels, Belgium, 2012. [Google Scholar]
- EN 206:2013+A1:2016. Concrete. Specification, Performance, Production and Conformity; European Committee for Standardization: Brussels, Belgium, 2016. [Google Scholar]
- El-Newihy, A.; Azarsa, P.; Gupta, R.; Biparva, A. Effect of Polypropylene Fibers on Self-Healing and Dynamic Modulus of Elasticity Recovery of Fiber Reinforced Concrete. Fibers 2018, 6, 9. [Google Scholar] [CrossRef] [Green Version]
- EN 12390-2:2019. Testing Hardened Concrete—Part 2: Making and Curing Specimens for Strength Tests; European Committee for Standardization: Brussels, Belgium, 2019. [Google Scholar]
- Fantilli, A.P.; Kwon, S.; Mihashi, H.; Nishiwaki, T. Synergy assessment in hybrid Ultra-High Performance Fiber-Reinforced Concrete (UHP-FRC). Cem. Concr. Compos. 2018, 86, 19–29. [Google Scholar] [CrossRef]
- Park, G.-K.; Park, G.-J.; Park, J.-J.; Lee, N.; Kim, S.-W. Residual Tensile Properties and Explosive Spalling of High-Performance Fiber-Reinforced Cementitious Composites Exposed to Thermal Damage. Materials 2021, 14, 1608. [Google Scholar] [CrossRef] [PubMed]
- Behfarnia, K.; Behravan, A. Application of high performance polypropylene fibers in concrete lining of water tunnels. Mater. Des. 2014, 55, 274–279. [Google Scholar] [CrossRef]
- Yin, S.; Tuladhar, R.; Shi, F.; Combe, M.; Collister, T.; Sivakugan, N. Use of macro plastic fibres in concrete: A review. Constr. Build. Mater. 2015, 93, 180–188. [Google Scholar] [CrossRef]
- Li, D.; Liu, S. Macro polypropylene fiber influences on crack geometry and water permeability of concrete. Constr. Build. Mater. 2019, 231, 117128. [Google Scholar] [CrossRef]
- Hsie, M.; Tu, C.; Song, P. Mechanical properties of polypropylene hybrid fiber-reinforced concrete. Mater. Sci. Eng. A 2008, 494, 153–157. [Google Scholar] [CrossRef]
- Ortiz, M.A.; Jj, S.; De Luna, A.M.; Ángel, J.; Lozano, O.; Jaime, L.P.; Martínez, J.P.; José, J.; Bernal, S.; Flores, J.A. Experimental mechanical characterization of steel and polypropylene fiber reinforced concrete. Rev. Técnica Fac. Ing. Univ. Zulia 2014, 37, 106–115. [Google Scholar] [CrossRef]
- Ibrahim, M.H.W.; Mangi, S.A.; Burhanudin, M.K.; Ridzuan, M.B.; Jamaluddin, N.; Shahidan, S.; Wong, Y.; Faisal, S.; Fadzil, M.A.; Ramadhansyah, P.J.; et al. Compressive and flexural strength of concrete containing palm oil biomass clinker and polypropylene fibres. IOP Conf. Ser. Mater. Sci. Eng. 2017, 271, 12011. [Google Scholar] [CrossRef] [Green Version]
- Li, J.; Niu, J.; Wan, C.; Liu, X.; Jin, Z. Comparison of flexural property between high performance polypropylene fiber reinforced lightweight aggregate concrete and steel fiber reinforced lightweight aggregate concrete. Constr. Build. Mater. 2017, 157, 729–736. [Google Scholar] [CrossRef]
- Altalabani, D.; Bzeni, D.K.; Linsel, S. Mechanical properties and load deflection relationship of polypropylene fiber reinforced self-compacting lightweight concrete. Constr. Build. Mater. 2020, 252, 119084. [Google Scholar] [CrossRef]
- Roesler, J.R.; Lange, D.A.; Altoubat, S.A.; Rieder, K.-A.; Ulreich, G.R. Fracture of Plain and Fiber-Reinforced Concrete Slabs under Monotonic Loading. J. Mater. Civ. Eng. 2004, 16, 452–460. [Google Scholar] [CrossRef]
- Shi, F.; Pham, T.M.; Hao, H.; Hao, Y. Post-cracking behaviour of basalt and macro polypropylene hybrid fibre reinforced concrete with different compressive strengths. Constr. Build. Mater. 2020, 262, 120108. [Google Scholar] [CrossRef]
- Alberti, M.G.; Enfedaque, A.; Gálvez, J.C. Polyolefin Fibres for the Reinforcement of Concrete; IntechOpen: London, UK, 2017. [Google Scholar]
- Buratti, N.; Mazzotti, C.; Savoia, M. Post-cracking behaviour of steel and macro-synthetic fibre-reinforced concretes. Constr. Build. Mater. 2011, 25, 2713–2722. [Google Scholar] [CrossRef]
- Soutsos, M.; Le, T.; Lampropoulos, A. Flexural performance of fibre reinforced concrete made with steel and synthetic fibres. Constr. Build. Mater. 2012, 36, 704–710. [Google Scholar] [CrossRef]
- Singh, N.K.; Rai, B. A Review of Fiber Synergy in Hybrid Fiber Reinforced Concrete. J. Appl. Eng. Sci. 2018, 8, 41–50. [Google Scholar] [CrossRef] [Green Version]
- Ismail, S.; Ramli, M. Effects of Adding Fibre on Strength and Permeability of Recycled Aggregate Concrete Containing Treated Coarse RCA. International J. Civ. Environ. Eng. 2014, 8, 918–924. [Google Scholar]
- Sivakumar, A.; Santhanam, M. Mechanical properties of high strength concrete reinforced with metallic and non-metallic fibres. Cem. Concr. Compos. 2007, 29, 603–608. [Google Scholar] [CrossRef]
- Altoubat, S.A.; Roesler, J.R.; Lange, D.A.; Rieder, K.-A. Simplified method for concrete pavement design with discrete structural fibers. Constr. Build. Mater. 2008, 22, 384–393. [Google Scholar] [CrossRef]
- Leong, G.W.; Mo, K.H.; Loh, Z.P.; Ibrahim, Z. Mechanical properties and drying shrinkage of lightweight cementitious composite incorporating perlite microspheres and polypropylene fibers. Constr. Build. Mater. 2020, 246, 118410. [Google Scholar] [CrossRef]
- Guo, H.; Jiang, L.; Tao, J.; Chen, Y.; Zheng, Z.; Jia, B. Influence of a hybrid combination of steel and polypropylene fibers on concrete toughness. Constr. Build. Mater. 2021, 275, 122132. [Google Scholar] [CrossRef]


| Ref. | Workability | Compressive Strength | Flexural Tensile Strength acc. to EN 14651 [28] | Fracture Energy | Uniaxial Tensile Strength | Model Code Classification [26] | DIC System |
|---|---|---|---|---|---|---|---|
| [13] | x | x | x 1 | ||||
| [22] | x | x 1 | x | ||||
| [23] | x | x | x 1 | x | |||
| [38] | x | x | |||||
| [40] | x | x | x | x | |||
| [41] | x | x | x | x | |||
| [46] | x | x | x | x | |||
| [47] | x | x | x | x | |||
| [48] 2 | x | x | x | x | |||
| [50] | x | x | x 3 | ||||
| [51] | x | x 1 | |||||
| [52] | x | x 1 | |||||
| [53] | x | x | x 1 | x | |||
| [54] | x | ||||||
| [55] | x | x | |||||
| [56] 2 | x | ||||||
| This study | x | x | x | x | x | x | x |
| PM | PD | FF | |
|---|---|---|---|
| lf | 54 mm | 48 mm | 52 mm/52 mm |
| df | 0.45 mm | 0.60 mm | 0.45 mm/- |
| lf/df | 120 | 80 | 115/- |
| ft | 550–650 MPa | 550–600 MPa | 620–758 MPa |
| Material | copolymer | copolymer | 95% copolymer/5% polypropylene |
| Form | twisted, monofilament | monofilament | twisted, monofilament/fibrillated |
 |  | 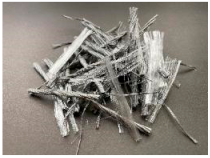 |
| Composition | PC | PM_3 | PM_2 | PD_3 | PD_2 | FF_2 |
|---|---|---|---|---|---|---|
| CEM 42.5R | 400 | |||||
| Pebble aggregate 2–8 mm | 1052 | |||||
| Sand 0–2 mm | 673 | |||||
| Water | 200 | |||||
| Superplasticizer | 1.43 | |||||
| w/c | 0.50 | |||||
| Fibers | 0.0 | 3.0 | 2.0 | 3.0 | 2.0 | 2.0 |
| Vf | 0.00% | 0.33% | 0.22% | 0.33% | 0.22% | 0.22% |
| Procedure | Mixing Time |
|---|---|
| 50% of pebble aggregate + 50% of sand | 1 min |
| 50% of CEM I 42.5R | 1 min |
| 100% of water + 100% of superplasticizer | 2 min |
| 50% of pebble aggregate + 50% of sand + 50% of CEM 42.5R | 1 min |
| 100% of fibers | 2 min 1 + * + 1 min + * + 1 min |
| - | PC | PM_3 | PM_2 | PD_3 | PD_2 | FF_2 |
|---|---|---|---|---|---|---|
| h [mm] | 230 | 130 | 160 | 140 | 140 | 65 |
| Consistency class | S5 | S3 | S4 | S3 | S3 | S2 |
| Type of the Test | PC | PM_3 | PM_2 | PD_3 | PD_2 | FF_2 |
|---|---|---|---|---|---|---|
| Compressive strength test | 6 | 6 | 6 | 6 | 6 | 6 |
| Flexural tensile test | 3 | 3 | 3 | 3 | 3 | 3 |
| Uniaxial tensile test | 1 | 1 | 1 | 1 | 1 | 1 |
| No. | Property | PC | PM_3 | PM_2 | ||||||
|---|---|---|---|---|---|---|---|---|---|---|
| 1 | fc [MPa] | 57.49 | fcm [MPa] | 58.05 | 56.61 | fcm [MPa] | 58.06 | 61.50 | fcm [MPa] | 60.64 |
| 2 | 58.40 | sfc [MPa] | 1.33 | 58.65 | sfc [MPa] | 1.10 | 64.57 | sfc [MPa] | 2.20 | |
| 3 | 59.89 | Vfc [%] | 2.29 | 57.23 | Vfc [%] | 1.89 | 58.91 | Vfc [%] | 3.64 | |
| 4 | 58.21 | fc;0.05 [MPa] | 57.26 | 59.27 | fc;0.05 [MPa] | 57.34 | 60.03 | fc;0.05 [MPa] | 59.14 | |
| 5 | 58.52 | 58.48 | ||||||||
| 6 | 56.26 | 60.34 | ||||||||
| No. | Property | PD_3 | PD_2 | FF_2 | ||||||
| 1 | fc [MPa] | 56.71 | fcm [MPa] | 59.44 | 59.79 | fcm [MPa] | 61.31 | 60.73 | fcm [MPa] | 60.87 |
| 2 | 59.59 | sfc [MPa] | 2.77 | 64.10 | sfc [MPa] | 1.81 | 60.71 | sfc [MPa] | 0.72 | |
| 3 | 60.45 | Vfc [%] | 4.66 | 62.02 | Vfc [%] | 2.95% | 61.93 | Vfc [%] | 1.19 | |
| 4 | 61.80 | fc;0.05 [MPa] | 57.55 | 60.84 | fc;0.05 [MPa] | 60.23 | 61.43 | fc;0.05 [MPa] | 60.38 | |
| 5 | 55.57 | 60.59 | ||||||||
| 6 | 62.50 | 59.81 | 59.84 | |||||||
| Ref. | PC | PM_3 | PM_2 | PD_3 | PD_2 | FF_2 |
|---|---|---|---|---|---|---|
| FL [kN] | 10.17 | 10.74 | 10.70 | 10.75 | 11.34 | 11.55 |
| F1 [kN] | - | 4.74 | 3.34 | 3.62 | 6.15 | 3.78 |
| F2 [kN] | - | 3.33 | 2.30 | 2.91 | 2.15 | 2.61 |
| F3 [kN] | - | 3.29 | 2.09 | 2.90 | 2.27 | 2.53 |
| F4 [kN] | - | 3.53 | 2.12 | 2.88 | 2.25 | 2.43 |
| Mixture | ffl acc. to Equation (5) [MPa] | ffl acc. to Equation (6) [MPa] | ffl acc. to Equation (7) [MPa] | |
|---|---|---|---|---|
| PM_3 | 7.43 (2.16) | 3.92 (1.14) | 4.50 (1.31) | 3.44 |
| PM_2 | 7.59 (2.22) | 2.86 (0.83) | 4.05 (1.18) | 3.42 |
| PD_3 | 7.45 (2.17) | 2.86 (0.83) | 4.05 (1.18) | 3.44 |
| PD_2 | 7.68 (2.12) | 2.15 (0.59) | 3.75 (1.03) | 3.63 |
| FF_2 | 7.70 (2.08) | 2.78 (0.75) | 4.02 (1.09) | 3.69 |
| Ref. | Vf [%] | lf [mm] | df [mm] | lf/df | ffl [MPa] | ffl acc. to Equation (8) [MPa] | ffl acc. to Equation (8)/ffl |
|---|---|---|---|---|---|---|---|
| Presented research | 0.00 | - | - | - | 3.26 | 3.26 | 1.000 |
| 0.33 | 54 | 0.45 | 120 | 3.44 | 3.52 | 1.024 | |
| 0.22 | 54 | 0.45 | 120 | 3.42 | 3.43 | 1.002 | |
| 0.33 | 48 | 0.60 | 80 | 3.44 | 3.43 | 0.997 | |
| 0.22 | 48 | 0.60 | 80 | 3.63 | 3.37 | 0.929 | |
| 0.22 | 52 | 0.45 | 115 | 3.69 | 3.43 | 0.927 | |
| [69] | 0.00 | - | - | - | 4.36 | 4.36 | 1.000 |
| 0.30 | 50 | 0.660 | 76 | 4.64 | 4.51 | 0.971 | |
| 0.33 | 50 | 0.660 | 76 | 4.54 | 4.52 | 0.997 | |
| [10] | 0.00 | - | - | - | 7.70 | 7.70 | 1.000 |
| 0.50 | 12 | 0.025 | 480 | 8.00 | 9.34 | 1.168 | |
| 1.00 | 12 | 0.025 | 480 | 7.00 | 10.98 | 1.569 | |
| 1.50 | 12 | 0.025 | 480 | 6.50 | 12.62 | 1.942 | |
| 2.00 | 12 | 0.025 | 480 | 5.60 | 14.27 | 2.548 | |
| [13] | 0.00 | - | - | - | 3.95 | 3.95 | 1.000 |
| 0.22 | 50 | 1.000 | 50 | 3.77 | 4.02 | 1.066 | |
| 0.33 | 50 | 1.000 | 50 | 3.94 | 4.05 | 1.029 | |
| 0.43 | 50 | 1.000 | 50 | 3.88 | 4.08 | 1.052 | |
| [77] | 0.00 | - | - | - | 4.20 | 4.20 | 1.000 |
| 0.51 | 40 | 0.706 * | 57 | 4.40 | 4.38 | 0.996 | |
| 0.59 | 40 | 0.706 * | 57 | 4.45 | 4.41 | 0.991 | |
| [78] | 0.00 | - | - | - | 5.54 | 5.54 | 1.000 |
| 0.50 | 15 | 0.100 | 150 | 5.74 | 6.04 | 1.052 | |
| [79] | 0.00 | - | - | - | 4.78 | 4.78 | 1.000 |
| 0.30 | 15 | 0.100 | 150 | 4.69 | 5.08 | 1.084 | |
| [80] | 0.00 | - | - | - | 5.21 | 5.21 | 1.000 |
| 0.50 | 20 | 0.100 | 200 | 5.61 | 5.88 | 1.049 | |
| [68] | 0.00 | - | - | - | 4.58 | 4.58 | 1.000 |
| 0.33 | 60 | 1.000 | 60 | 4.87 | 4.71 | 0.967 | |
| 0.67 | 60 | 1.000 | 60 | 5.23 | 4.83 | 0.925 | |
| [70] | 0.00 | - | - | - | 2.20 | 2.20 | 1.000 |
| 0.20 | 55 | 0.850 | 65 | 2.27 | 2.29 | 1.009 | |
| 0.40 | 55 | 0.850 | 65 | 2.30 | 2.37 | 1.033 | |
| 0.60 | 55 | 0.850 | 65 | 2.25 | 2.46 | 1.092 | |
| [74] | 0.00 | - | - | - | 3.09 | 3.09 | 1.000 |
| 0.70 | 60 | 0.580 | 103 | 3.44 | 3.58 | 1.039 | |
| 1.00 | 60 | 0.580 | 103 | 3.40 | 3.78 | 1.113 | |
| 0.00 | - | - | - | 3.79 | 3.79 | 1.000 | |
| 0.70 | 60 | 0.580 | 103 | 4.11 | 4.27 | 1.039 | |
| 1.00 | 60 | 0.580 | 103 | 4.32 | 4.48 | 1.036 | |
| [81] | 0.00 | - | - | - | 4.73 | 4.73 | 1.000 |
| 0.32 | 40 | 0.354 * | 113 | 4.69 | 4.97 | 1.059 | |
| 0.48 | 40 | 0.354 * | 113 | 4.82 | 5.09 | 1.055 | |
| [65] | 0.00 | - | - | - | 4.33 | 4.33 | 1.000 |
| 0.80 | 48 | 0.917 | 52 | 5.09 | 4.59 | 0.902 | |
| 0.60 | 48 | 0.917 | 52 | 4.49 | 4.52 | 1.008 | |
| 0.40 | 48 | 0.917 | 52 | 4.36 | 4.46 | 1.022 | |
| [82] | 0.00 | - | - | - | 2.62 | 2.62 | 1.000 |
| 0.15 | 12 | 0.020 | 600 | 2.64 | 3.25 | 1.230 | |
| 0.30 | 12 | 0.020 | 600 | 2.84 | 3.87 | 1.363 | |
| 0.50 | 12 | 0.020 | 600 | 3.32 | 4.71 | 1.418 | |
| [47] | 0.00 | - | - | - | 5.00 | 5.00 | 1.000 |
| 0.40 | 48 | 0.900 | 53 | 5.00 | 5.13 | 1.026 | |
| 0.60 | 48 | 0.900 | 53 | 5.60 | 5.19 | 0.928 | |
| 0.80 | 48 | 0.900 | 53 | 5.00 | 5.26 | 1.052 | |
| 1.00 | 48 | 0.900 | 53 | 5.10 | 5.32 | 1.044 | |
| 1.50 | 48 | 0.900 | 53 | 5.70 | 5.49 | 0.962 | |
| [83] | 0.00 | - | - | - | 5.60 | 5.60 | 1.000 |
| 0.22 | 19 | 0.095 | 200 | 5.91 | 5.90 | 0.998 |
| Parameter 1: | Parameter 2: | Total or Partial Replacement of Traditional Reinforcement Is Possible When: | |
|---|---|---|---|
| Two consecutive numbers in series 1.0; 1.5; 2.0; 2.5; 3.0; 4.0; 5.0; 6.0; 7.0; 8.0; … [MPa] define the strength range fR,1k. | a | for 0.5 ≤ fR,3k/fR,1k < 0.7 | fR,1k/ > 0.4 and |
| b | for 0.7 ≤ fR,3k/fR,1k < 0.9 | fR,3k/fR,1k > 0.5 | |
| c | for 0.9 ≤ fR,3k/fR,1k < 1.1 | ||
| d | for 1.1 ≤ fR,3k/fR,1k < 1.3 | ||
| e | for 1.3 ≤ fR,3k/fR,1k | ||
| PM_3 | |||||||||
|---|---|---|---|---|---|---|---|---|---|
| [MPa] | 3.44 | [MPa] | 0.37 | k | 1.89 | [MPa] | 2.74 | fR,3k/fR,1k | 0.95 |
| fR,1m [MPa] | 1.52 | sR,1 [MPa] | 0.61 | 1.89 | fR,1k [MPa] | 0.36 | fR,1k/ | 0.13 | |
| fR,3m [MPa] | 1.05 | sR,3 [MPa] | 0.38 | 1.89 | fR,3k [MPa] | 0.34 | |||
| PM_2 | |||||||||
| [MPa] | 3.42 | [MPa] | 0.42 | k | 1.89 | [MPa] | 2.64 | fR,3k/fR,1k | 0.43 |
| fR,1m [MPa] | 1.07 | sR,1 [MPa] | 0.20 | 1.89 | fR,1k [MPa] | 0.68 | fR,1k/ | 0.26 | |
| fR,3m [MPa] | 0.67 | sR,3 [MPa] | 0.20 | 1.89 | fR,3k [MPa] | 0.30 | |||
| PD_3 | |||||||||
| [MPa] | 3.44 | [MPa] | 0.31 | k | 1.89 | [MPa] | 2.86 | fR,3k/fR,1k | 0.13 |
| fR,1m [MPa] | 1.16 | sR,1 [MPa] | 0.25 | 1.89 | fR,1k [MPa] | 0.69 | fR,1k/ | 0.24 | |
| fR,3m [MPa] | 0.93 | sR,3 [MPa] | 0.44 | 1.89 | fR,3k [MPa] | 0.09 | |||
| PD_2 | |||||||||
| [MPa] | 3.63 | [MPa] | 0.10 | k | 1.89 | [MPa] | 3.43 | fR,3k/fR,1k | 0.66 |
| fR,1m [MPa] | 1.97 | sR,1 [MPa] | 0.71 | 1.89 | fR,1k [MPa] | 0.63 | fR,1k/ | 0.18 | |
| fR,3m [MPa] | 0.73 | sR,3 [MPa] | 0.16 | 1.89 | fR,3k [MPa] | 0.42 | |||
| FF_2 | |||||||||
| [MPa] | 3.69 | [MPa] | 0.11 | k | 1.89 | [MPa] | 3.48 | fR,3k/fR,1k | 0.39 |
| fR,1m [MPa] | 1.21 | sR,1 [MPa] | 0.04 | 1.89 | fR,1k [MPa] | 1.14 | fR,1k/ | 0.33 | |
| fR,3m [MPa] | 0.81 | sR,3 [MPa] | 0.19 | 1.89 | fR,3k [MPa] | 0.45 | |||
| Parameter | PC | PM_3 | PM_2 | PD_3 | PD_2 | FF_2 |
|---|---|---|---|---|---|---|
| sGF-CMOD=3.5 [Nm] | 0.18 | 4.27 | 2.89 | 4.54 | 1.38 | 1.73 |
| VGF-CMOD=3.5 [%] | 27.56% | 30.58% | 28.10% | 36.50% | 11.75% | 14.56% |
| Ti [-] | 1.0 | 21.97 | 16.19 | 19.59 | 18.56 | 18.71 |
| CMOD [mm] | 0.05→ | 0.5→fR,1 | 1.5→fR,2 | 2.5→fR,3 | 3.5→fR,4 | Contour Legend |
|---|---|---|---|---|---|---|
| PM_3_1 | 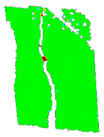 | 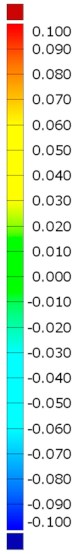 | ||||
| PM_3_2 |  |  |  | |||
| PM_3_3 | 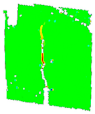 |  |  |  | ||
| PM_2_1 |  | 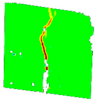 |  | 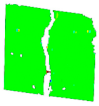 |  | |
| PM_2_2 |  |  |  | |||
| PM_2_3 |  |  |  |  |  | |
| PD_3_1 |  |  |  |  |  | |
| PD_3_2 |  | 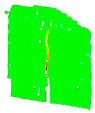 |  |  |  | |
| PD_3_3 |  |  |  |  |  | |
| PD_2_1 |  |  |  |  |  | |
| PD_2_2 |  | 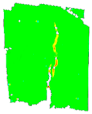 |  | 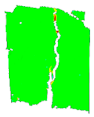 |  | |
| PD_2_3 |  |  |  |  | ||
| FF_2_1 |  |  |  |  |  | |
| FF_2_2 |  |  | 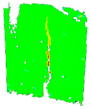 |  |  | |
| FF_2_3 |  |  | 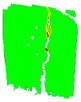 |  | 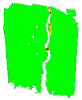 |
Publisher’s Note: MDPI stays neutral with regard to jurisdictional claims in published maps and institutional affiliations. |
© 2021 by the authors. Licensee MDPI, Basel, Switzerland. This article is an open access article distributed under the terms and conditions of the Creative Commons Attribution (CC BY) license (https://creativecommons.org/licenses/by/4.0/).
Share and Cite
Blazy, J.; Drobiec, Ł.; Wolka, P. Flexural Tensile Strength of Concrete with Synthetic Fibers. Materials 2021, 14, 4428. https://doi.org/10.3390/ma14164428
Blazy J, Drobiec Ł, Wolka P. Flexural Tensile Strength of Concrete with Synthetic Fibers. Materials. 2021; 14(16):4428. https://doi.org/10.3390/ma14164428
Chicago/Turabian StyleBlazy, Julia, Łukasz Drobiec, and Paweł Wolka. 2021. "Flexural Tensile Strength of Concrete with Synthetic Fibers" Materials 14, no. 16: 4428. https://doi.org/10.3390/ma14164428
APA StyleBlazy, J., Drobiec, Ł., & Wolka, P. (2021). Flexural Tensile Strength of Concrete with Synthetic Fibers. Materials, 14(16), 4428. https://doi.org/10.3390/ma14164428