Article

Study on the Injection Modes and Displacement Characteristics of Chemical Compound Flooding in Heavy Oil Reservoirs After Multiple Cycles of Huff-and-Puff

1
SINOPEC Petroleum Exploration and Production Research Institute, Beijing 100083, China
2
Petroleum Engineering Institute, Changzhou University, Changzhou 213164, China
*
Author to whom correspondence should be addressed.
Energies 2026, 19(7), 1728; https://doi.org/10.3390/en19071728
Submission received: 8 February 2026 / Revised: 18 March 2026 / Accepted: 19 March 2026 / Published: 1 April 2026
(This article belongs to the Special Issue Petroleum and Natural Gas Engineering: 2nd Edition)

Abstract

The chemical agent injection modes and displacement characteristics of chemical compound flooding, consisting of a plugging agent, an oil displacement agent, and a viscosity reducer, were investigated by laboratory experiments for target heavy oil reservoirs after multiple cycles of huff-and-puff. The performances of the oil displacement agent, viscosity reducer and plugging agent were evaluated, and the formulation and concentration were optimized. The oil displacement effects and displacement characteristics of different injection modes were studied by sand-filled two-pipe models. The experiment results showed that alternating injections of the oil displacement agent and viscosity reducer yielded better results than their mixed injection, and small segments alternating injections achieved the highest recovery. The larger the dosage of the oil displacement agent, the larger the maximum liquid production ratio between the high- and low-permeability layers, but with the smaller the liquid production reverse duration. The larger the dosage of the viscosity reducer, the greater the water cut decrease but the smaller the maximum liquid production ratio. For chemical compound flooding in the Zhong’er block in the Gudao oilfield, the recommended injection mode was 0.1 PV plugging agent + 2000 mg/L of oil displacement agent + 0.5% viscosity reducer, with small segments of the oil displacement agent being followed by a viscosity reducer at an injection slug ratio of 6:4. However, the injection mode depends on the prices of oil and the chemical agent. When prices fluctuate, the chemical agent concentration should be adjusted accordingly.

1. Introduction

Heavy oil reservoirs in eastern China are in a development stage characterized by high costs and low benefits after multiple cycles of huff-and-puff [1,2]. Periodic production and the oil–gas ratio gradually decrease with an increase in huff-and-puff cycles. The cost of steam injection accounts for a high proportion of the total and leads to a decline in oil displacement efficiency. Steam tends to be channeled along high-permeability pathways, leading to an uneven swept volume and leaving a significant amount of remaining oil in low-permeability zones. Steam stimulation technology is difficult to sustain. Steam flooding proved to have poor economic benefits (oil–gas ratio < 0.2). Drilling new wells to target the oil remaining between wells was not economically viable [3,4,5,6,7]. Therefore, it is necessary to change the development method to significantly enhance oil recovery.
Chemical viscosity-reducing compound flooding, consisting of a plugging agent, an oil displacement agent, and a viscosity reducer, is emerging as a potential alternative to enhance oil recovery in heavy oil reservoirs; this strategy utilizes chemical agents to reduce crude oil viscosity and enhance fluidity, supplemented with a plugging agent to improve sweep efficiency and increase well production. The literature reviews indicate three major development trends in this field.
The design of chemical agents has evolved from single-function to synergistic approaches integrating “oil-phase viscosity reduction + water-phase viscosity enhancement + interfacial regulation”. For example, the amphiphilic polymer-based viscosity reducer achieved the dual effects of an oil-phase viscosity reduction and a water-phase viscosity enhancement, while surfactant–polymer and macromolecular surfactant composite systems realized the synergy of “emulsified viscosity reduction + mobility control” [8,9].
Control methods are shifting from empirical formulations to precision design at the molecular level. The design of hydrogen-bond-modulated flowable weak gel and the development of responsive polymers demonstrated that material properties could be precisely controlled at the level of intermolecular interactions, enabling chemical agents to maintain adaptability under extreme reservoir conditions [10,11,12].
Technological methods are progressing from single chemical flooding to multi-process integration. This integration encompasses not only the compounding of chemical agents but also the synergy between chemical flooding and thermal recovery, fracturing and other processes, for example, the combination of viscosity reducers with surfactant-polymer flooding, micro-emulsion flooding with fracturing-assisted production, and thermo-chemical composite development [13,14].
For heavy oil reservoirs with an in situ crude oil viscosity below 150 mPa·s, polymer flooding and surfactant–polymer flooding technologies are widely adopted in eastern China, such as in the Liaohe, Gudao, and Shengtuo oilfields [15,16]. For in situ crude oil viscosity ranging from 150 to 1000 mPa·s, chemical viscosity-reducing compound flooding has been explored domestically. This is a low-cost and low-emission technology that can further enhance oil recovery [17,18]. However, the adaptability of chemical agents and the rationality of injection strategies are critical factors influencing the development effects. Therefore, based on the geological and fluid conditions of Zhong’er block in the Gudao oilfield, this study conducted a screening and performance evaluation of chemical agents. Two-pipe sand-filled model experiments were used to optimize the injection modes and slug design, aiming to provide an efficient chemical compound flooding technology solution for field applications.

2. Experiment Materials and Methods

2.1. Introduction to the Zhong’er Block in the Gudao Oil Oilfield

The Zhong’er block in the Gudao oil oilfield is a heavy oil reservoir in eastern China. The main oil-bearing layer is the upper member of the Guantao Formation of Tertiary Miocene, with a burial depth of 1300 m, an average oil layer thickness of 10.8 m, an initial oil saturation of 0.7, a permeability of 2280 × 10−3 μm2, and a porosity of 32.0%. The original formation temperature is 65 °C, with a geothermal gradient of 3.85 °C/100 m. The original formation pressure is 12.3 MPa, corresponding to a pressure coefficient 1.0. The current formation temperature is 77 °C, and the current formation pressure is 7.1 MPa. The viscosity of the crude oil in the formation ranges from 300 to 500 mPa·s. The formation water is of the NaHCO3 type, with a salinity of 6550 mg/L.
This area entered production in 1995. After multiple cycles of huff-and-puff, steam channeling was developed, and the thermal connectivity rate reached 31.0%. By the end of 2024, the single-well oil production was 1.2 t/d, the water cut was 95.3% and the reserve recovery degree was 30.4%. Therefore, it is essential to explore further enhanced oil recovery methods for heavy oil reservoirs after multiple cycles of huff-and-puff.

2.2. Experiment Reagents and Instruments

The oil used in the experiment was Zhong’er block dehydrated crude oil, with a saturated hydrocarbon content of 34.9%, aromatic hydrocarbon content of 36.8%, gum content of 25.7%, asphaltene content of 2.6%, S content of 3.2%, O content of 1.1%, and viscosity of 450 mPa·s at 65 °C.
Experiment water was simulated formation water of the Zhong’er block, with a salinity of 6550 mg/L.
The oil displacement agent was partially hydrolyzed polyacrylamide (PAM, Zhengjia company in Nanyang, China), with a relative molecular weight of approximately 20 million, solid content of 91.0%, hydrolysis degree of 17.8% and filter factor of 1.2.
The viscosity reducer was a self-developed viscosity reducer, synthesized primarily by acrylamide (AM), N-vinyl caprolactam (NVCL) and quaternary ammonium salt cationic monomer (DMB).
The plugging agent was a self-developed eco-friendly gel composed of polymer and a crosslinking agent. Polyethyleneimine with 50% solid content (Xindongneng company in Jinan, China) was added to 3000 mg/L PAM (Zhengjia company) solution at 1200 RPM, with a PAM-to-polyethyleneimine concentration ratio of 1:1, and stirred at this rate for about 1 h to obtain the plugging agent.
The experiment temperatures were 65 °C and 77 °C.
The main instruments used in the experiment were a steam generator, thermostat, constant speed and constant pressure pump, pressure sensor, pressure acquisition system, produced liquid-collection device, intermediate vessel, rotation viscometer, interfacial tension meter, stability analyzer, overhead stirrer, and constant-temperature oven.

2.3. Experiment Methods

Viscosity Test: The polymer concentration of 10,000 mg/L was prepared by the simulation brine from the Zhong’er block. Then, the polymer, or the polymer and viscosity reducer, or the plugging agent were slowly added to the simulated brine and left to mature at room temperature for 24 h before dilution to different concentrations of 1000–4000 mg/L. Three parallel samples were prepared at different concentrations and the viscosity were separately measured using a Brookfield viscometer (Model DV-III, Brookfield, Middleboro, MA, USA) with a No. 0 rotor at a speed of 6 RPM at temperatures of 65 °C and 77 °C. The results were reported as the arithmetic mean. If the deviation of any individual determination from the mean exceeded 10%, the sample was prepared again and re-measured.
Thermal Stability Test: The viscosity of the polymer solution was measured at a concentration of 2000 mg/L. The solution was then aliquoted into ampoules, evacuated, and aged in a constant-temperature oven at 77 °C for periods ranging from 10 to 90 days. At each time point, ampoules were removed and the solution viscosity was measured. The viscosity retention percentage of the polymer solution was subsequently calculated. The viscosity was tested three times. If any individual measurement deviated from the average by more than 10%, the sample was re-prepared and re-measured.
Interfacial Tension Test: The spinning drop method was used to measure the oil–water interfacial tension between crude oil from the Zhong’er block and various solutions, including different concentrations of viscosity reducer or mixtures of viscosity reducer and oil displacement agent. The tests were conducted at 77 °C using simulated formation water from the Zhong’er block. The filtered solution was slowly injected into a 2 mm sample tube, ensuring no residual bubbles remained. Approximately 0.5 μL of the oil-phase was aspirated using a micro-pipette and injected into the middle of the tube. Then, the sealed tube was horizontally mounted on the rotating shaft of the spinning drop interfacial tension apparatus. The droplet morphology was observed through a coaxial optical system and camera at a rotational speed of 5000 RPM. Once the centrifugal force and interfacial tension reached equilibrium, the accompanying software captured clear droplet images, measured parameters such as diameter and length, and calculated the interfacial tension value. Each test was repeated three times, and the results were reported as the arithmetic mean. If the deviation of any individual measurement from the mean exceeded 20%, the sample was re-prepared and re-measured.
Oil Displacement Experiment: The sand-filled two-pipe model consisted of pipes with a diameter of 2.5 cm and a length of 60 cm. The permeability was approximately 1000 × 10−3 µm2 in the low-permeability pipe and approximately 3000 × 10−3 µm2 in the high-permeability pipe. The model was first saturated with simulation brine, followed by simulated oil. Steam was injected into the left end of the model using the steam generator system at a rate of 2 mL/min. After a soaking period of 5 min, a huff-and-puff process was initiated from the left end. The same procedure was then performed on the right end of the model. This huff-and-puff process was repeated until the water cut reached 95% and the pressure drop was stable. Subsequently, chemical compound flooding in different injection modes were carried out, followed by water flooding until the water cut reached 100% or no more oil was produced. The pressure, oil production and water production were recorded periodically. The recovery was calculated based on the fluid production and water cut for each stage.
Remaining Oil Distribution Test: The distribution characteristics of the remaining oil in the two-pipe models were studied through physical drilling and chromogenic trace analysis. After each oil displacement experiment, the two-pipe model was sequentially sampled using a hand drill to obtain mixed samples containing oil, water, and sand. The drilled samples were placed on oil test paper and incubated at a constant temperature of 77 °C, which reduced the crude oil viscosity and facilitated the migration of oil from the sand sample to the oil test paper under capillary force and gravity. The width of the oil stain was measured and recorded. By arranging the oil stain widths of all drilled samples according to the drilling sequence (from the inlet to the outlet), a profile of the remaining oil distribution was obtained.

3. Experiment Results and Discussion

3.1. Performance Evaluation of Chemical Agents

Based on the geological and fluid conditions of the Zhong’er block in the Gudao oil oilfield, the performance of and interaction among chemical agents, including a plugging agent, oil displacement agent, and viscosity reducer, were investigated in laboratory experiments.

3.1.1. Performance Evaluation of Oil Displacement Agent

The viscosities of the polymer solutions were separately tested with a No. 0 rotor at a speed of 6 RPM and temperatures of 65 °C and 77 °C.
The experiment results showed that the viscosity of the polymer solution increased significantly with increasing concentration, exceeding 50 mPa·s at 65 °C when the concentration of the polymer was 2000 mg/L, as shown in Table 1. Therefore it was suggested that the polymer concentration was no less than 2000 mg/L.
The thermal stability test at 77 °C showed that the viscosity retention percentage of the polymer solution gradually decreased over time, as shown in Table 2. However, the viscosity retention percentage was 84.9% even after 90 days. Therefore, the polymer showed good thermal stability.

3.1.2. Performance Evaluation of Viscosity Reducer

According to the crude oil properties of the Zhong’er block, the self-developed viscosity reducer was synthesized primarily by acrylamide (AM), N-vinyl caprolactam (NVCL) and quaternary ammonium salt cationic monomer (DMB), which could form a relatively uniform and stable oil-in-water (O/W) emulsion and could reduce the oil–water interfacial tension to ultra-low levels (<10−3 mN/m). The viscosity reduction percentage was more than 95% at the viscosity reducer mass concentration of 0.2~0.6%, as shown in Table 3, showing that the viscosity reducer possessed strong emulsification and viscosity reduction capabilities and could effectively improve the fluidity of high-viscosity oil.

3.1.3. Performance Evaluation of Plugging Agent

Under the temperature and simulated brine conditions of the Zhong’er block, the polymer and polyethyleneimine concentration were optimized based on the relationship between system viscosity and time. The polymer concentrations were 2000, 2500, 3000, 3500 and 4000 mg/L, with a PAM-to-polyethyleneimine concentration ratio of 2:1 and 1:1.
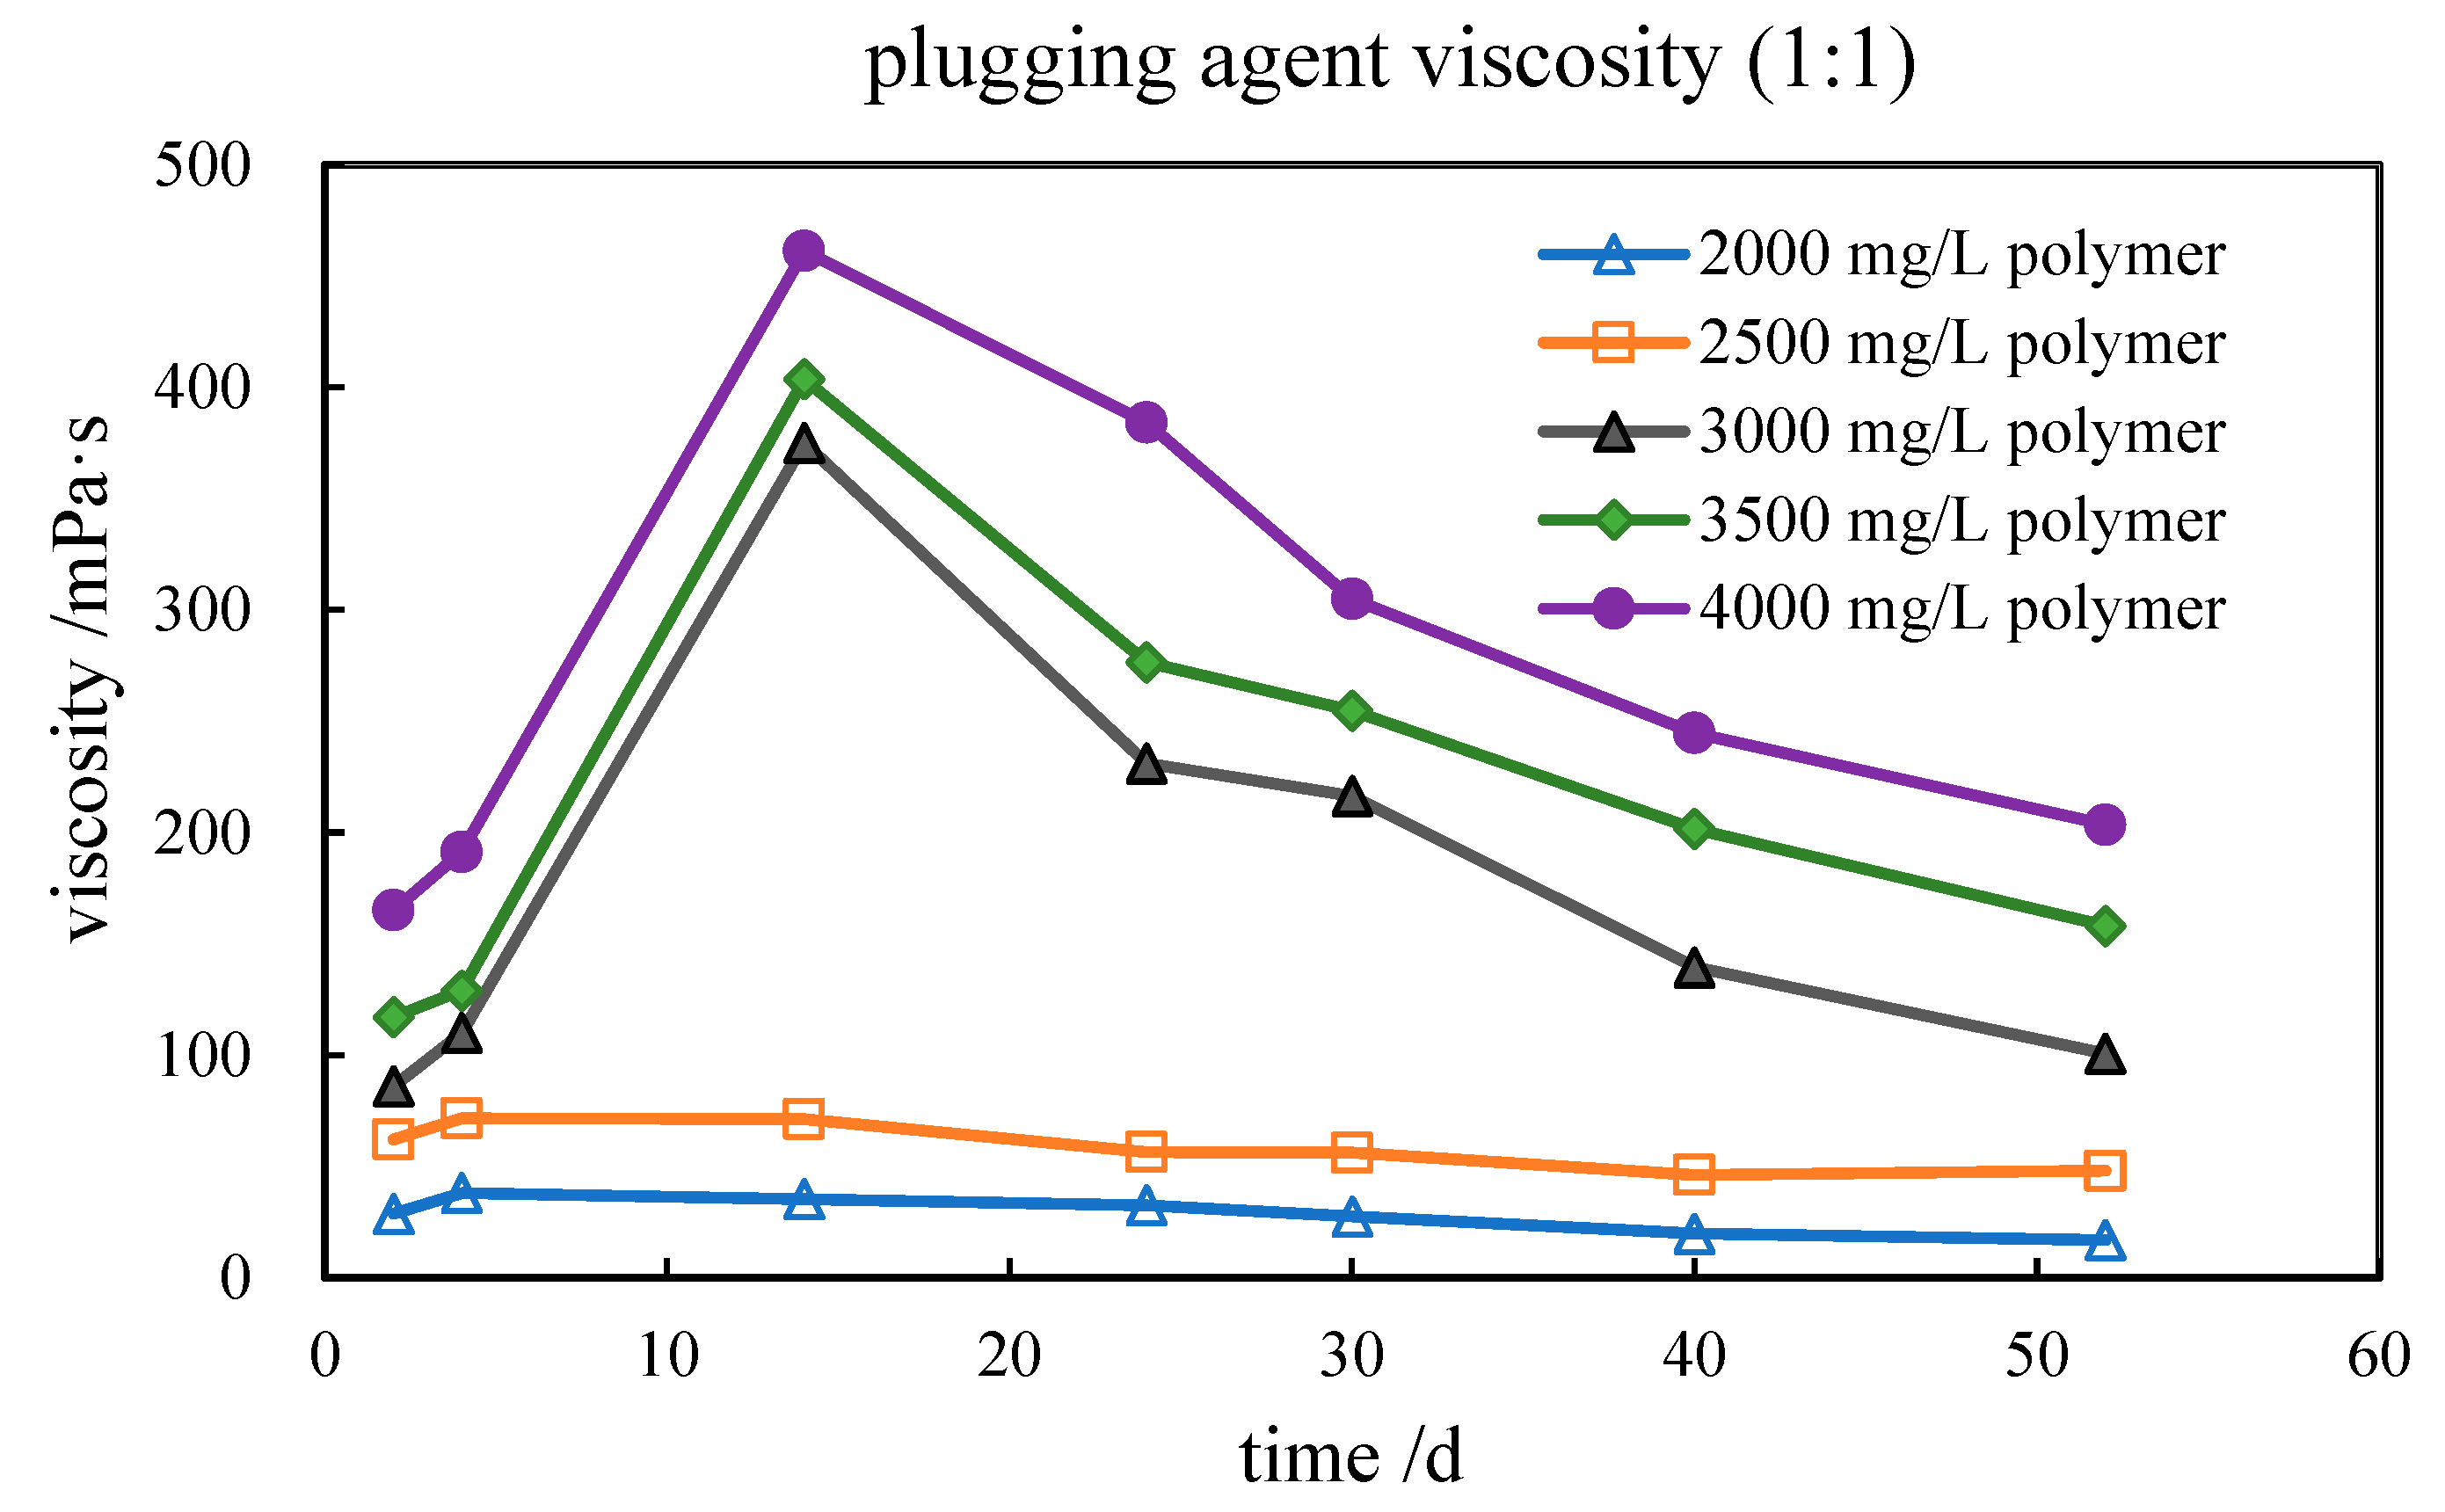
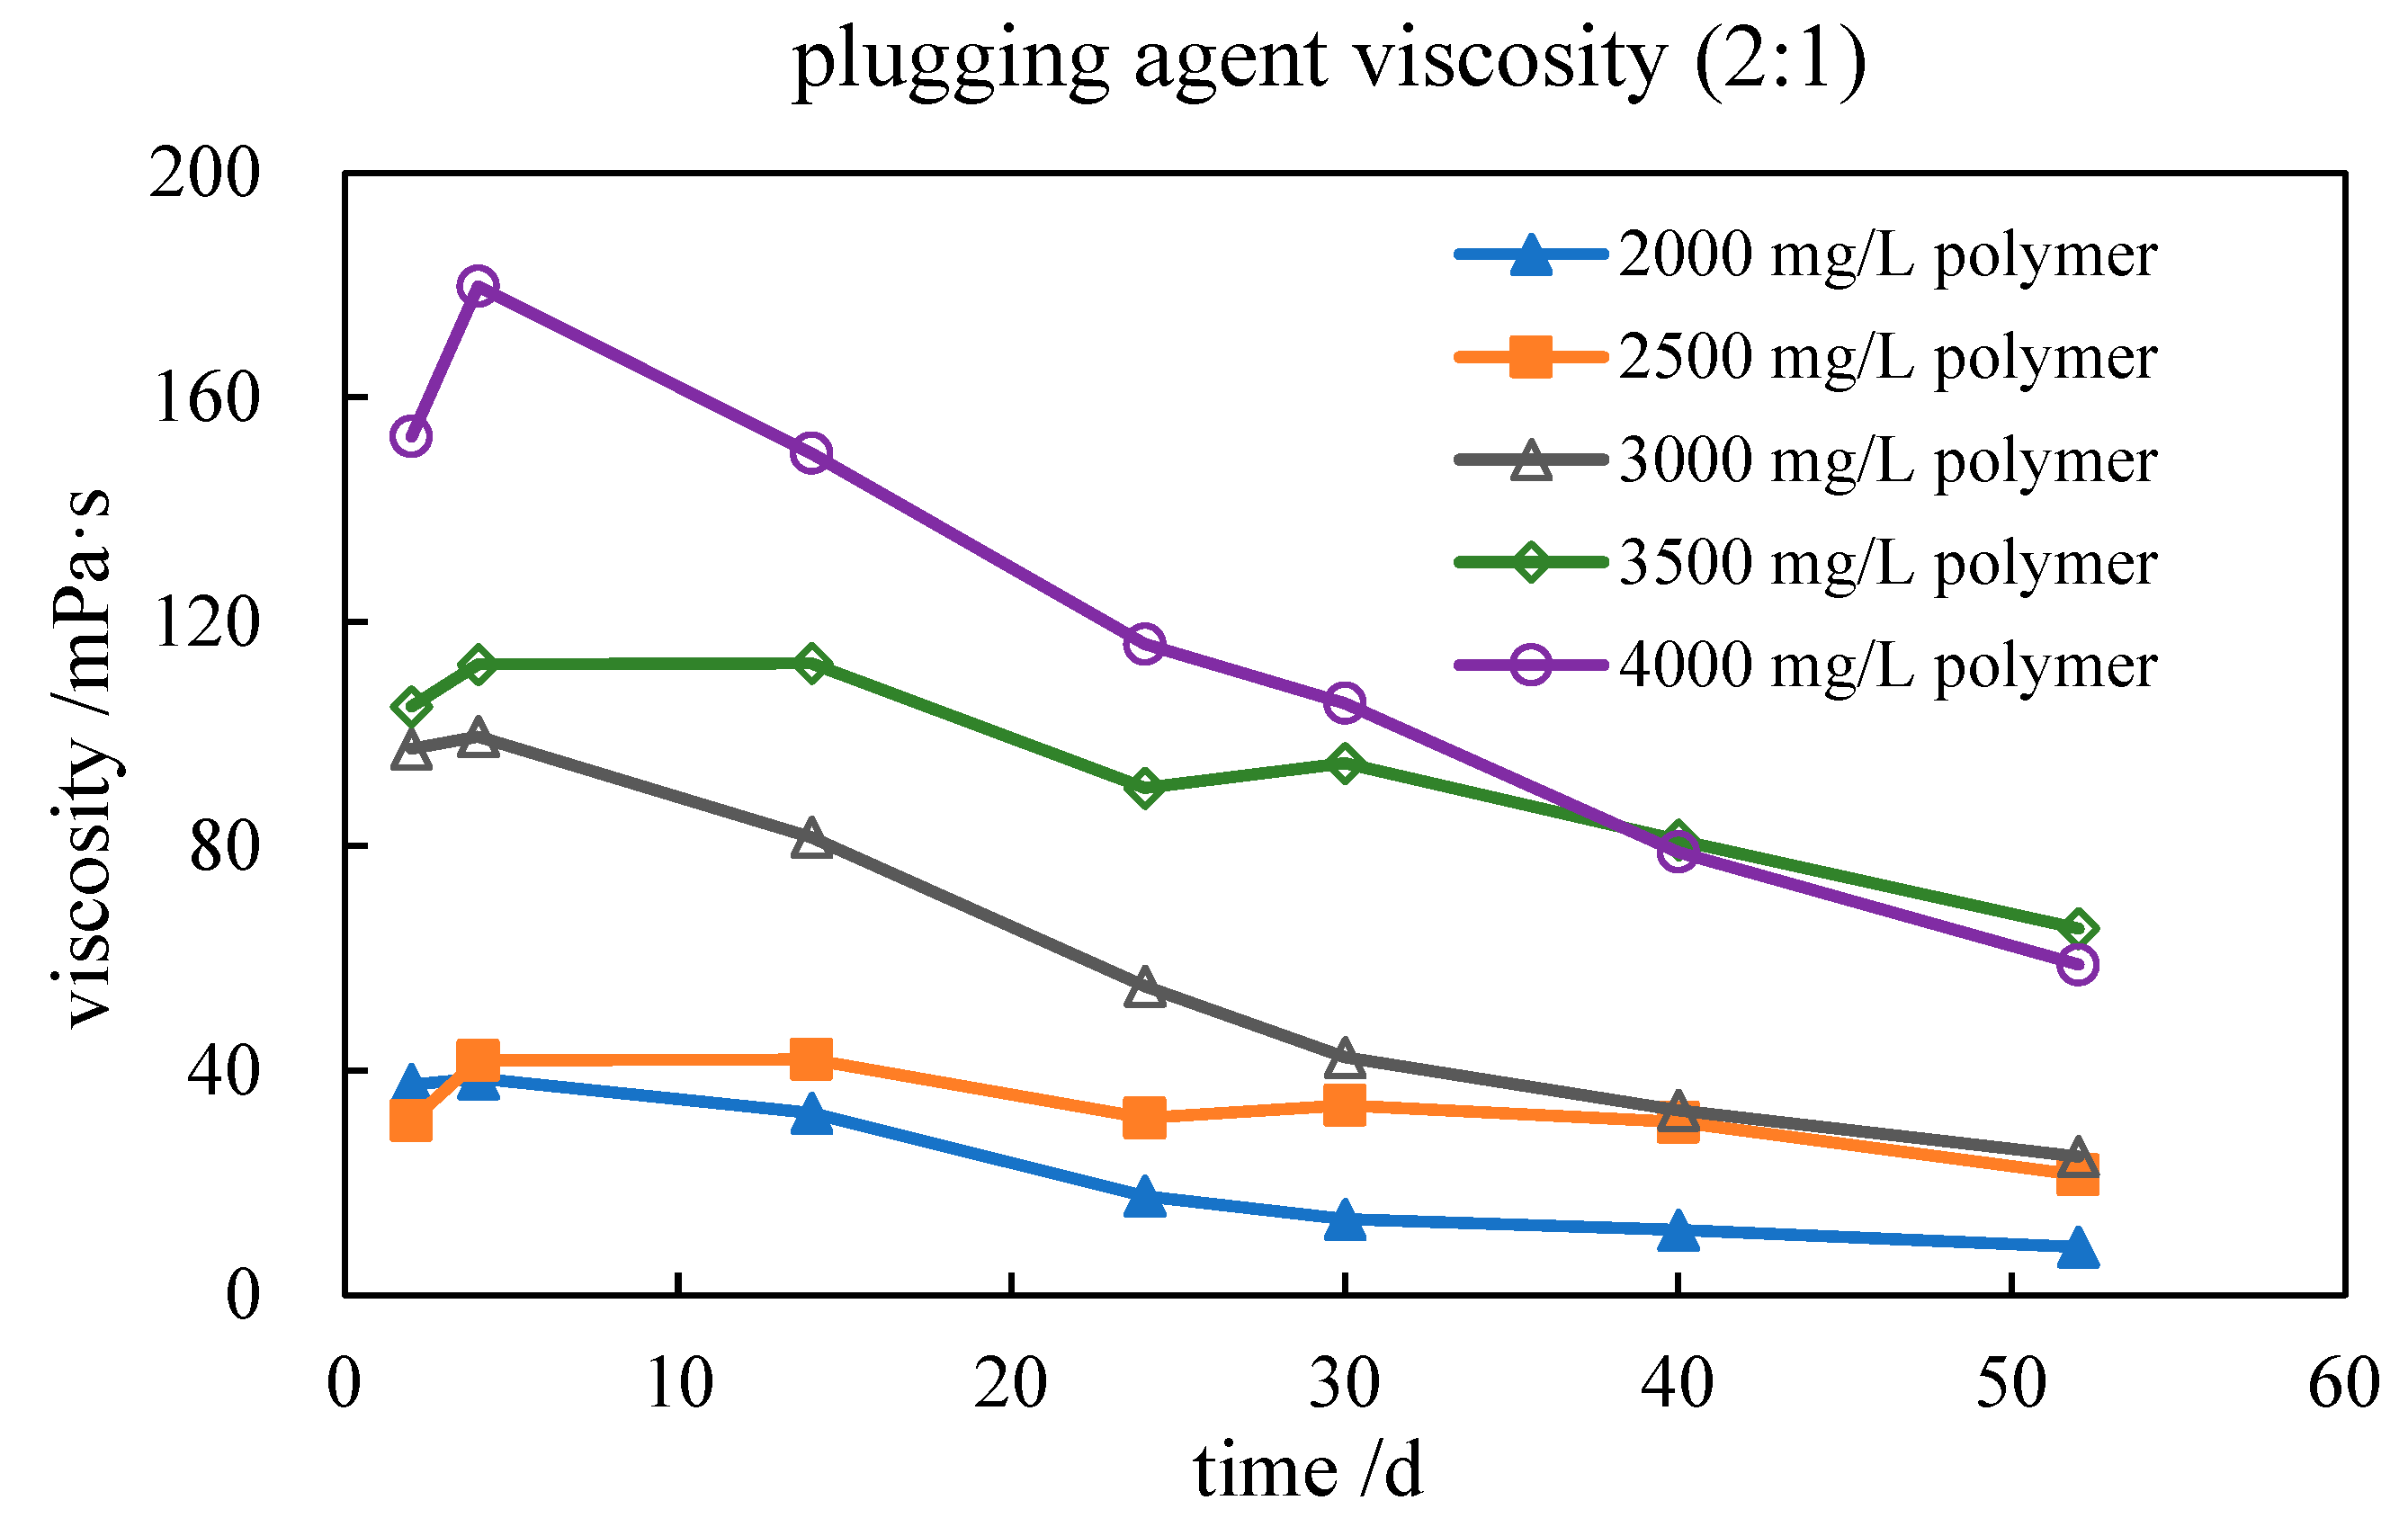
The experimental results indicated that a higher polymer concentration led to greater viscosity of the plugging agent, as shown in Figure 1 and Figure 2. When the polymer concentration exceeded 3000 mg/L, the viscosity increased significantly, reaching 100 to 400 mPa·s at a PAM-to-polyethyleneimine concentration ratio of 1:1, which was considerably higher than that at the ratio of 2:1. In addition, the viscosity decreased more rapidly at the 2:1 ratio compared to the 1:1 ratio.
According to the experimental results, the formulation of the plugging agent was determined to be a polymer concentration of 3000 mg/L and PAM-to-polyethyleneimine concentration ratio of 1:1.

3.1.4. Interaction Between Oil Displacement Agent and Viscosity Reducer

The impact of the viscosity reducer on the properties of polymer was investigated. Viscosity reducers at mass concentrations of 0.1%, 0.3%, 0.5%, 0.7%, and 1.0% were added to polymer solutions with concentrations of 1500 mg/L and 2500 mg/L. The viscosity of each system was measured and compared with that of the polymer solution alone.
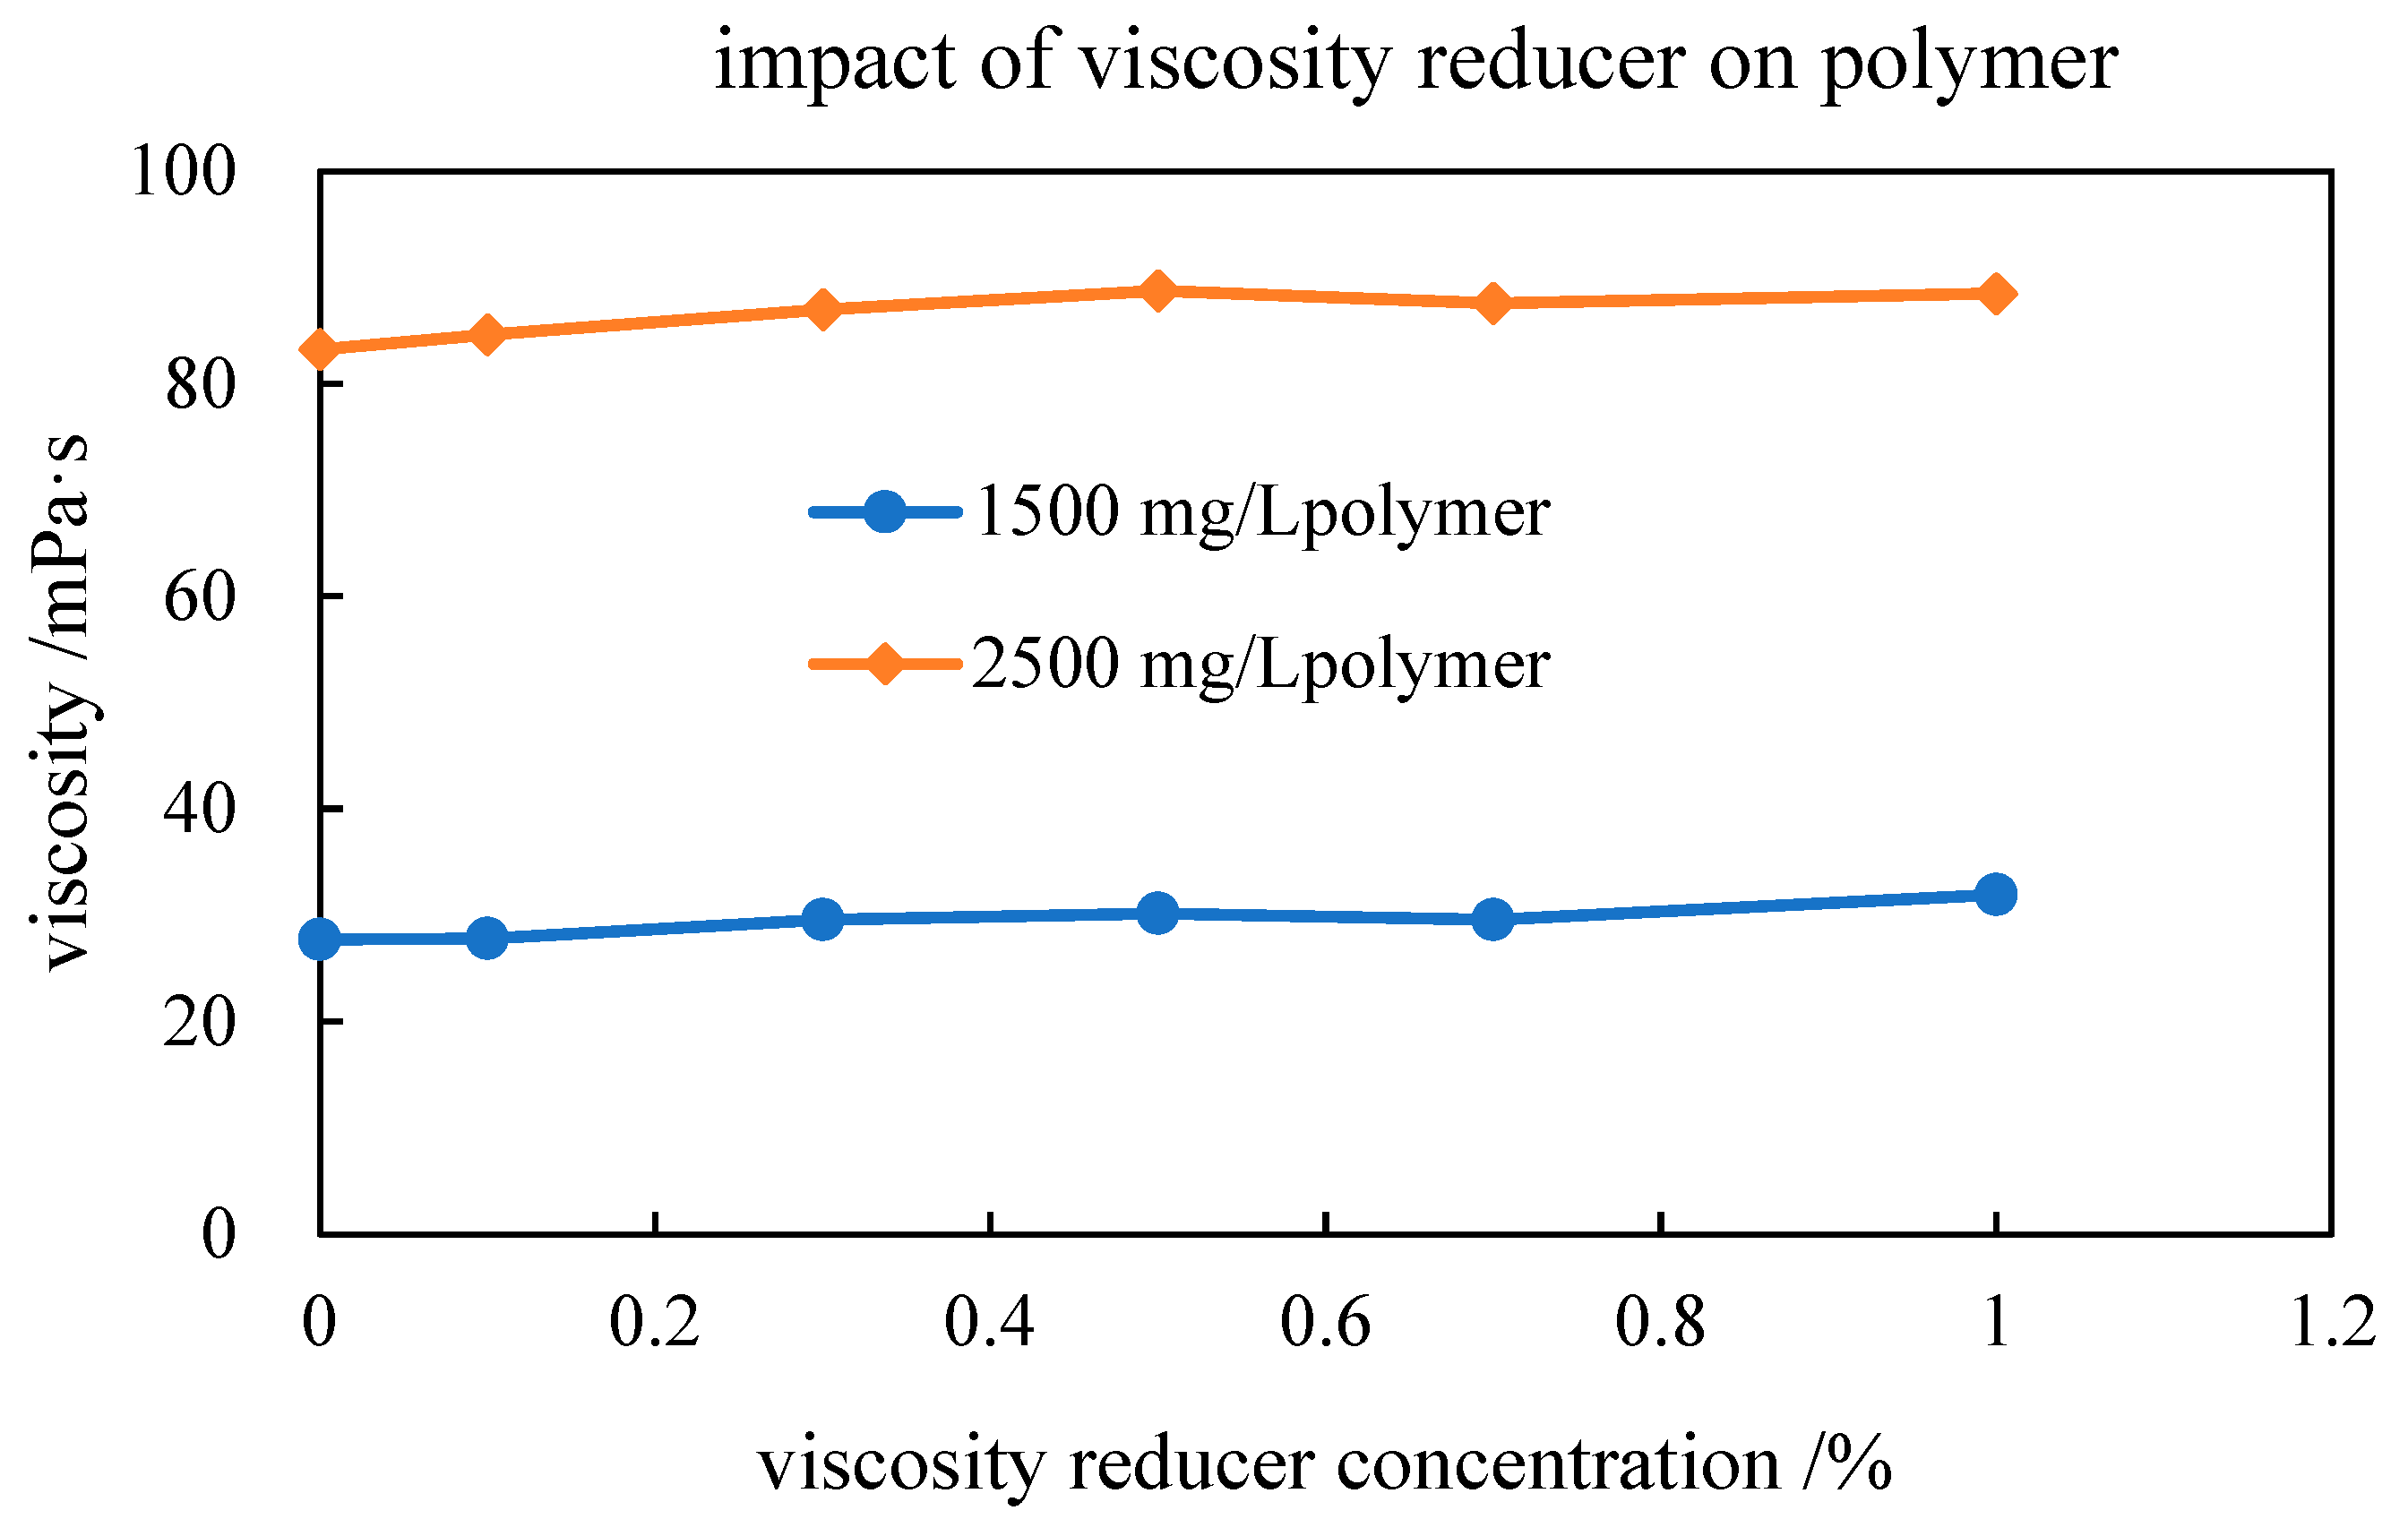
The experimental results showed that the viscosity of polymer solutions at concentrations of 1500 mg/L and 2500 mg/L was 27.72 mPa·s and 83.25 mPa·s respectively. After adding a viscosity reducer at different concentrations, the system viscosity increased slightly, as shown in Figure 3. A higher viscosity reducer concentration led to higher system viscosity, but the overall increase was relatively small. The viscosity of the system with 1.0% viscosity reducer increased to 31.95 mPa·s and 88.47 mPa·s. Therefore, the viscosity reducer had a minor effect on the viscosity of the polymer.
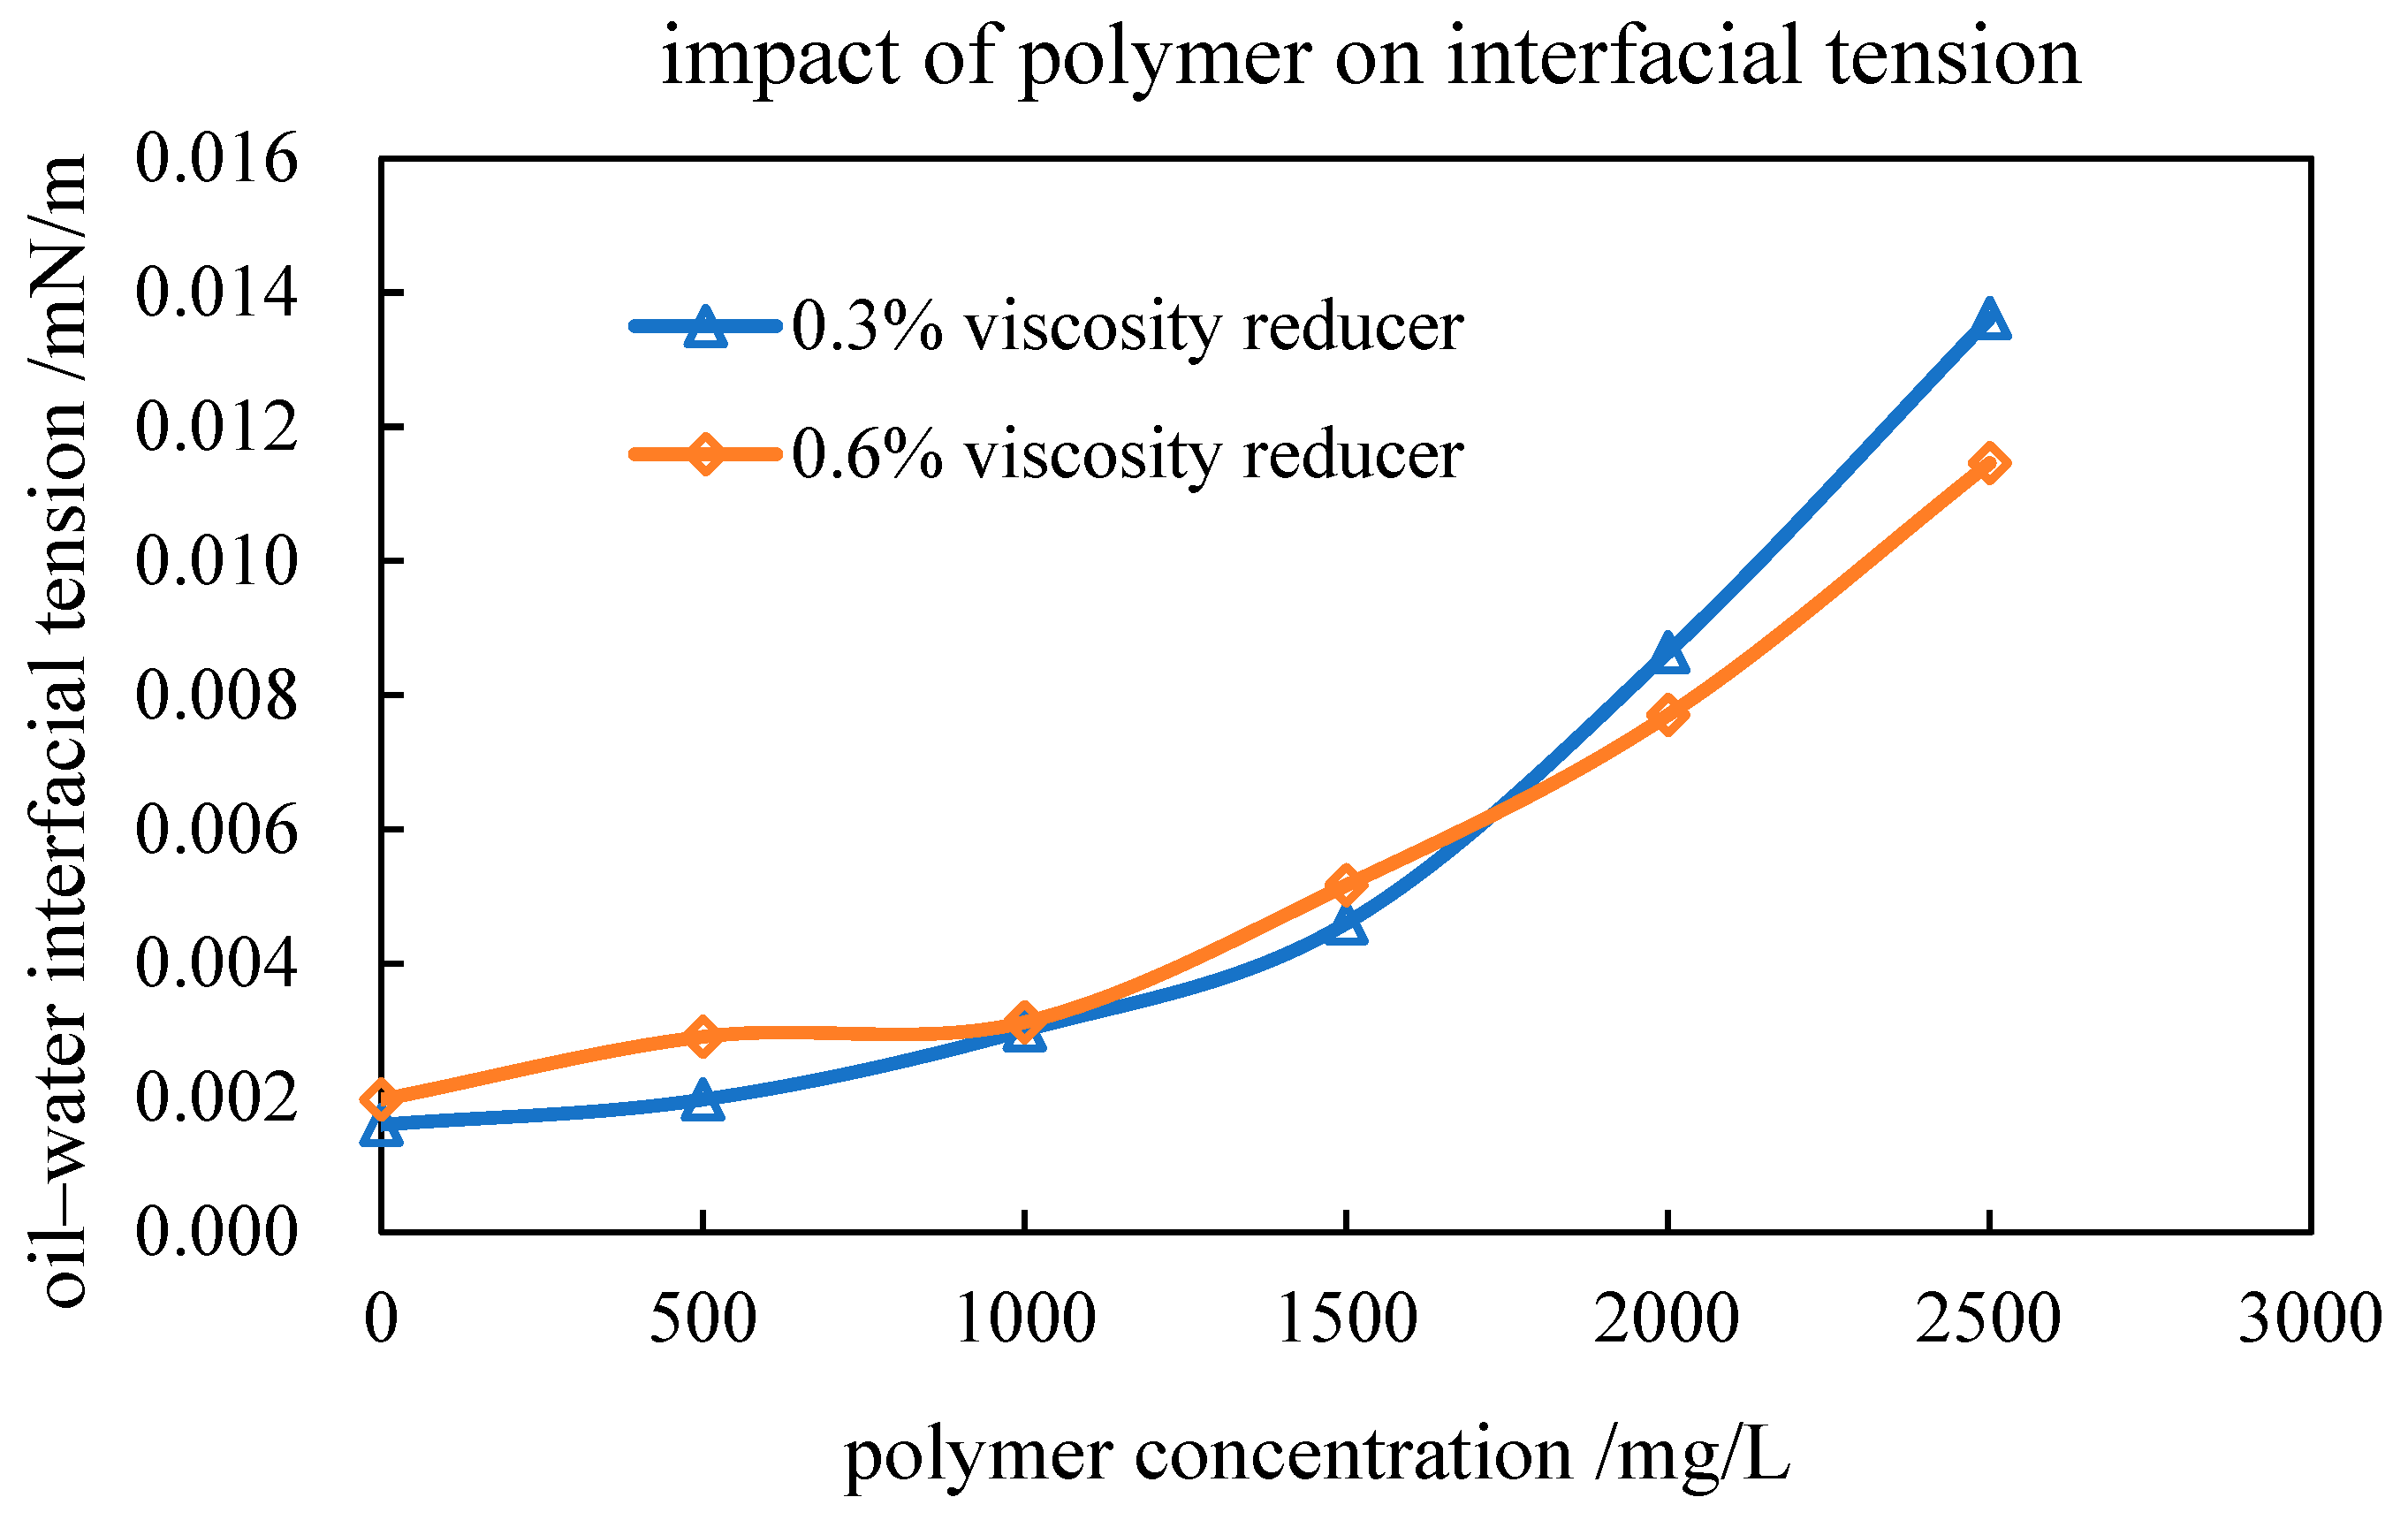
The impact of the polymer on the performance of the viscosity reducer was also investigated, as shown in Figure 4. The viscosity reducer inherently exhibited a strong ability to reduce oil–water interfacial tension, achieving ultra-low values at concentrations ranging from 0.2% to 0.6%. At viscosity reducer concentrations of 0.3% and 0.6%, the addition of polymer below 1000 mg/L had little effect on the performance of the viscosity reducer, with the interfacial tension showing minimal change. When the polymer concentrations was between 1000 and 2000 mg/L, the interfacial tension increased significantly but still remained at an ultra-low levels (10−3 mN/m). However, when the polymer concentration reached 2500 mg/L, the interfacial tension increased to the order of 10−2 mN/m. Analysis suggested that the higher the polymer concentration, the greater the viscosity of the system, and the higher bulk viscosity affected the performance of the viscosity reducer in reducing oil–water interfacial tension. Therefore, in the formulation design of chemical compound flooding, it is necessary to balance the relationship between increasing the viscosity of the polymer and the reduction in the interfacial tension of the viscosity reducer to avoid inhibiting the effectiveness of the viscosity reducer due to a high concentration of polymer.
Under the experimental conditions of a viscosity reducer concentration of 0.5%, oil–water ratio of 7:3, and temperature of 77 °C, the influence of polymer concentration on viscosity reducer performance was studied. The results showed that the system viscosity increased as the polymer concentration increased. Within a polymer concentration of 500–2500 mg/L, the viscosity reduction percentage was above 95%, as shown in Table 4. Therefore, the polymer had a negligible effect on the viscosity reduction capability of the viscosity reducer.

3.2. Injection Modes and Displacement Characteristics

According to the geological and fluid conditions of the Zhong’er block, the different injection modes and displacement characteristics of chemical compound flooding were investigated by two-pipe models.

3.2.1. Injection Schemes Design

Several injection schemes were designed, as shown in Table 5.
Scheme 1: Mixed Injection—Injecting 0.1 PV of plugging agent, followed by 0.4 PV of mixture solution of 2000 mg/L oil displacement agent and 0.5% viscosity reducer, then water flooding until the water cut reached 100% or no more oil was produced.
Scheme 2: Slug Injection—First, injecting 0.1 PV of plugging agent, then injecting 0.2 PV of 2000 mg/L oil displacement agent solution, followed by 0.2 PV of a 0.5% viscosity reducer solution, and then water flooding until the water cut reached 100% or no more oil was produced.
Scheme 3: Slug Injection—First, injecting 0.1 PV of plugging agent, then injecting 0.2 PV of 0.5% viscosity reducer solution, followed by 0.2 PV of 2000 mg/L oil displacement agent solution, and then water flooding until the water cut reached 100% or no more oil was produced.
Scheme 4: Reducing the dosage of the plugging agent to 0.05 PV, then injecting 0.2 PV of 2000 mg/L oil displacement agent solution, followed by 0.2 PV of a 0.5% viscosity reducer solution, and then water flooding until the water cut reached 100% or no more oil was produced.
Schemes 5–11: Alternating injections of small segments—first, injecting 0.1 PV of plugging agent, then alternately injecting 0.01–0.04 PV of oil displacement agent solution and 0.04–0.01 PV of viscosity reducer solution. The concentration of the oil displacement agent was 1500–2500 mg/L, and the concentration of the viscosity reducer was 0.25–0.75%. This process was alternated eight times, then water flooding was performed until the water cut reached 100% or no more oil was produced.
The main parameters of the two-pipe models for the 11 schemes are listed in Table 6 with a relative mean deviation within 3%.

3.2.2. Optimization of Injection Modes

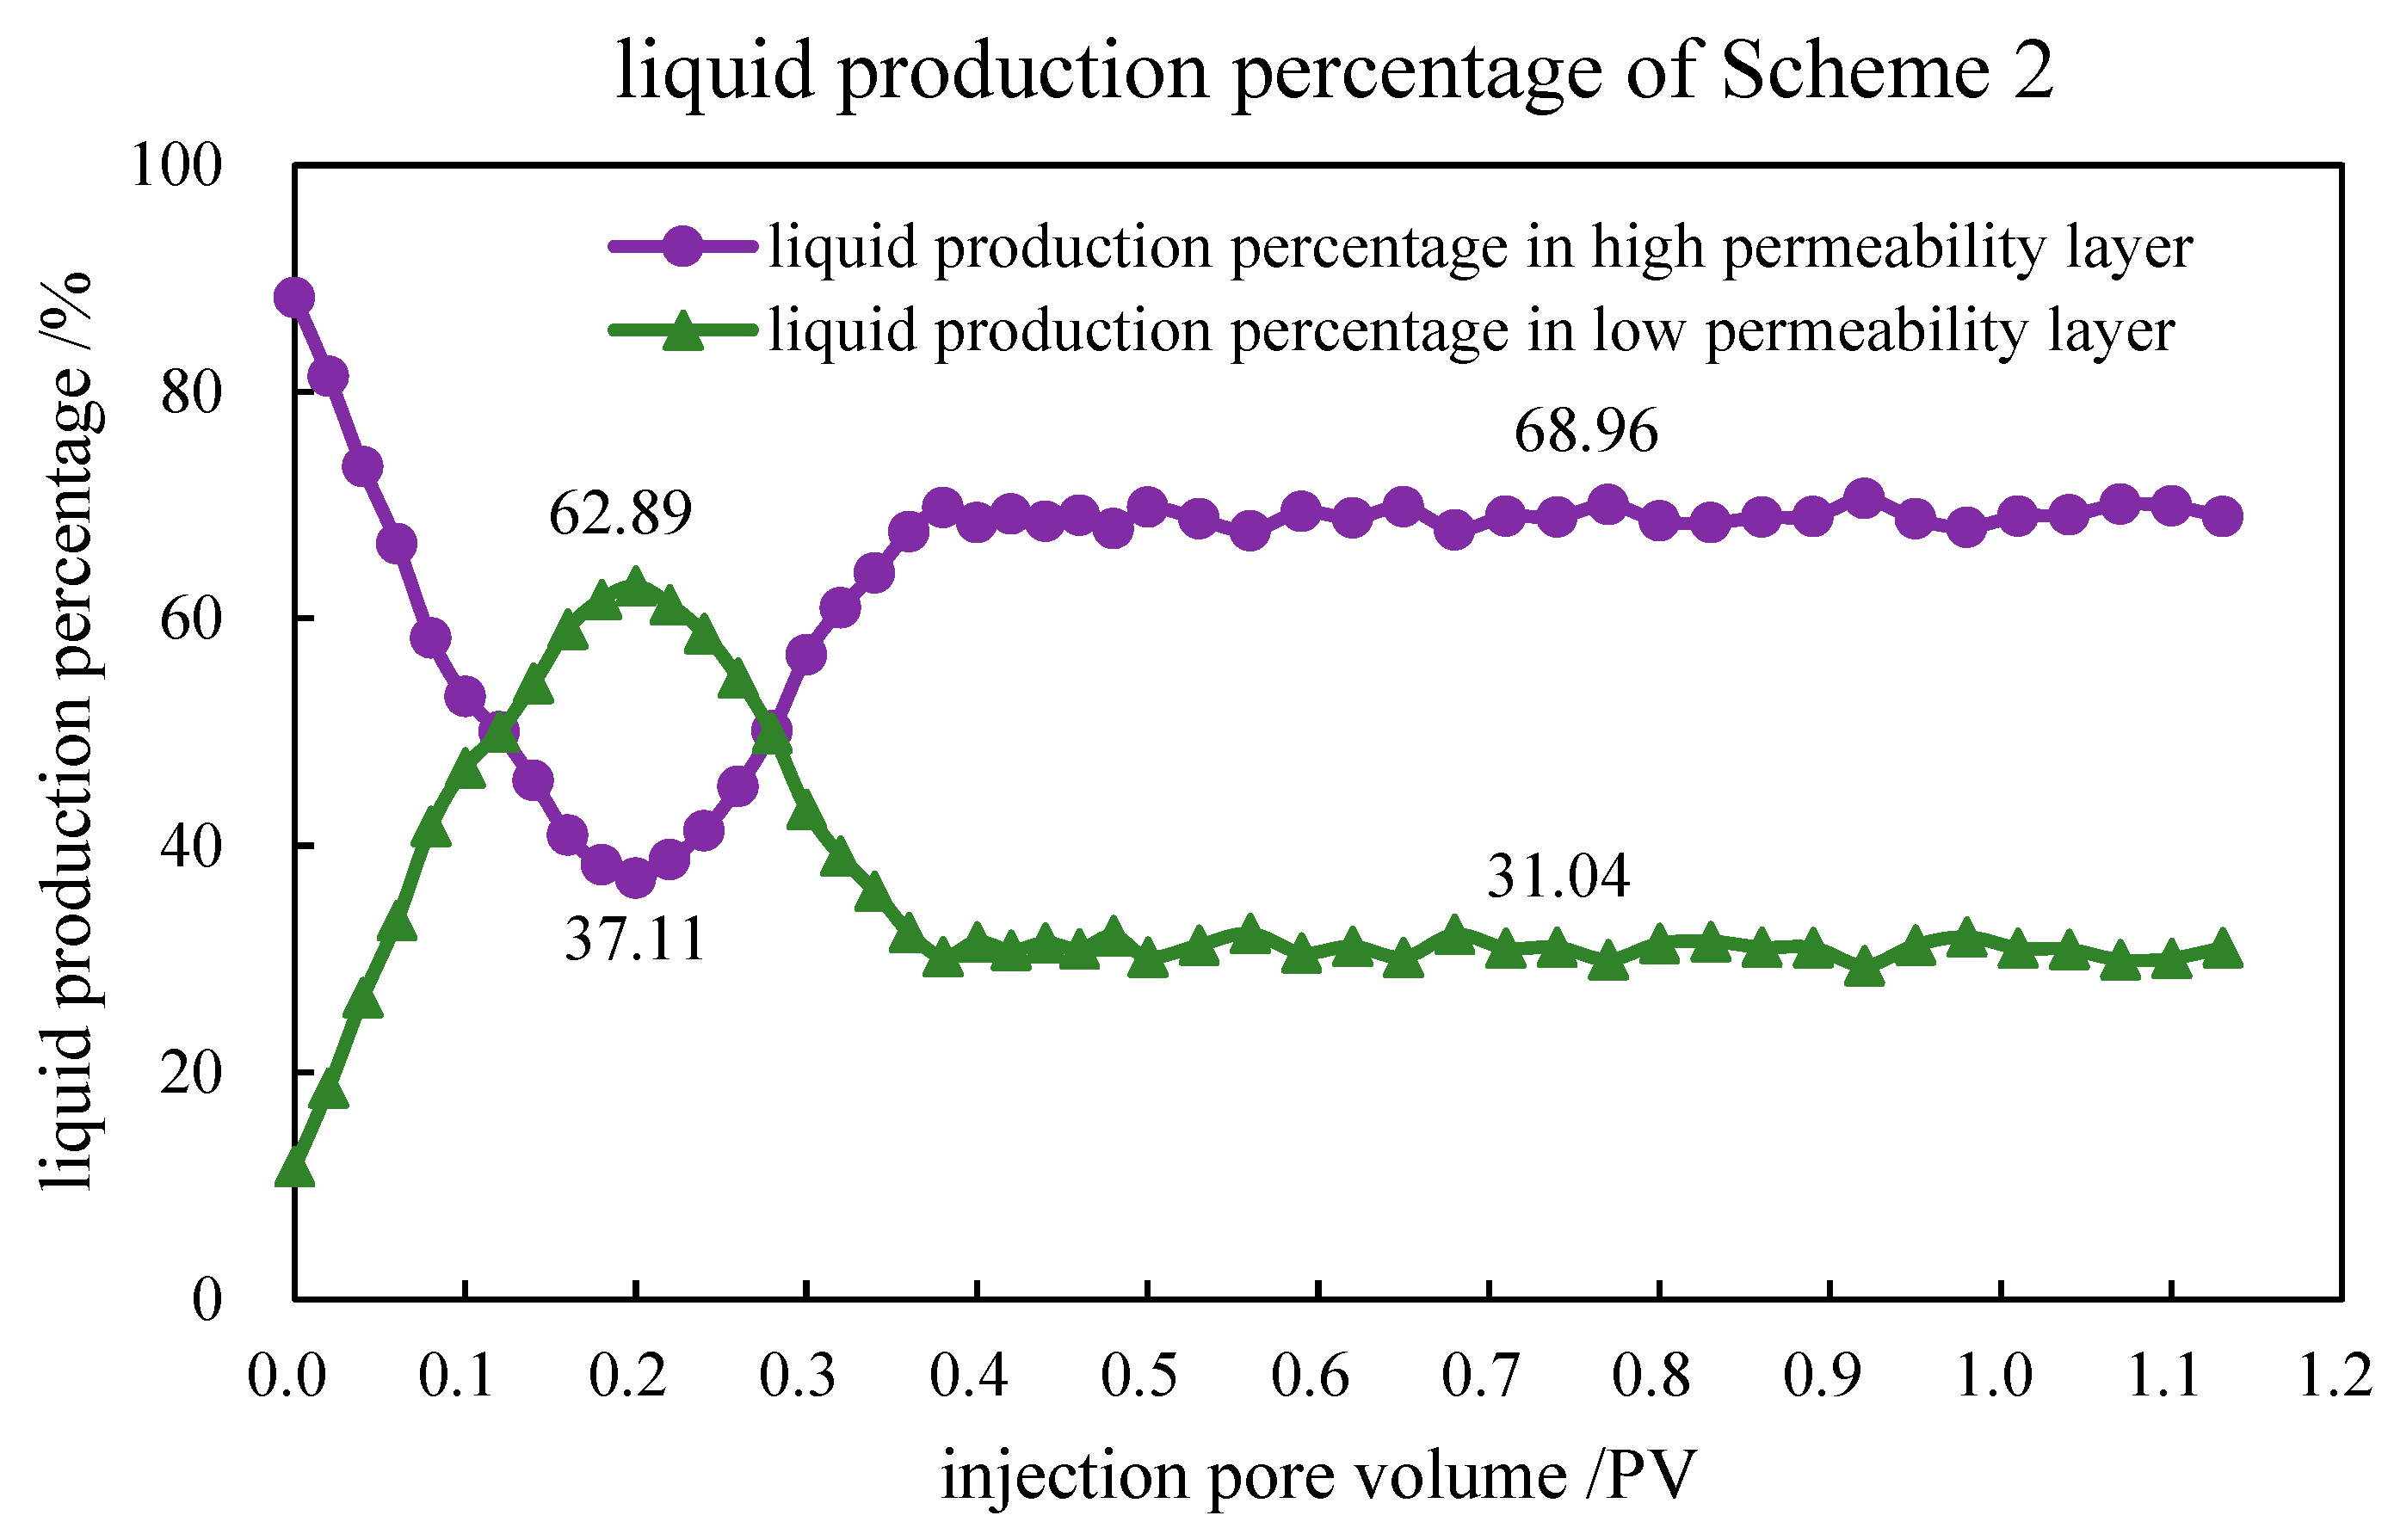
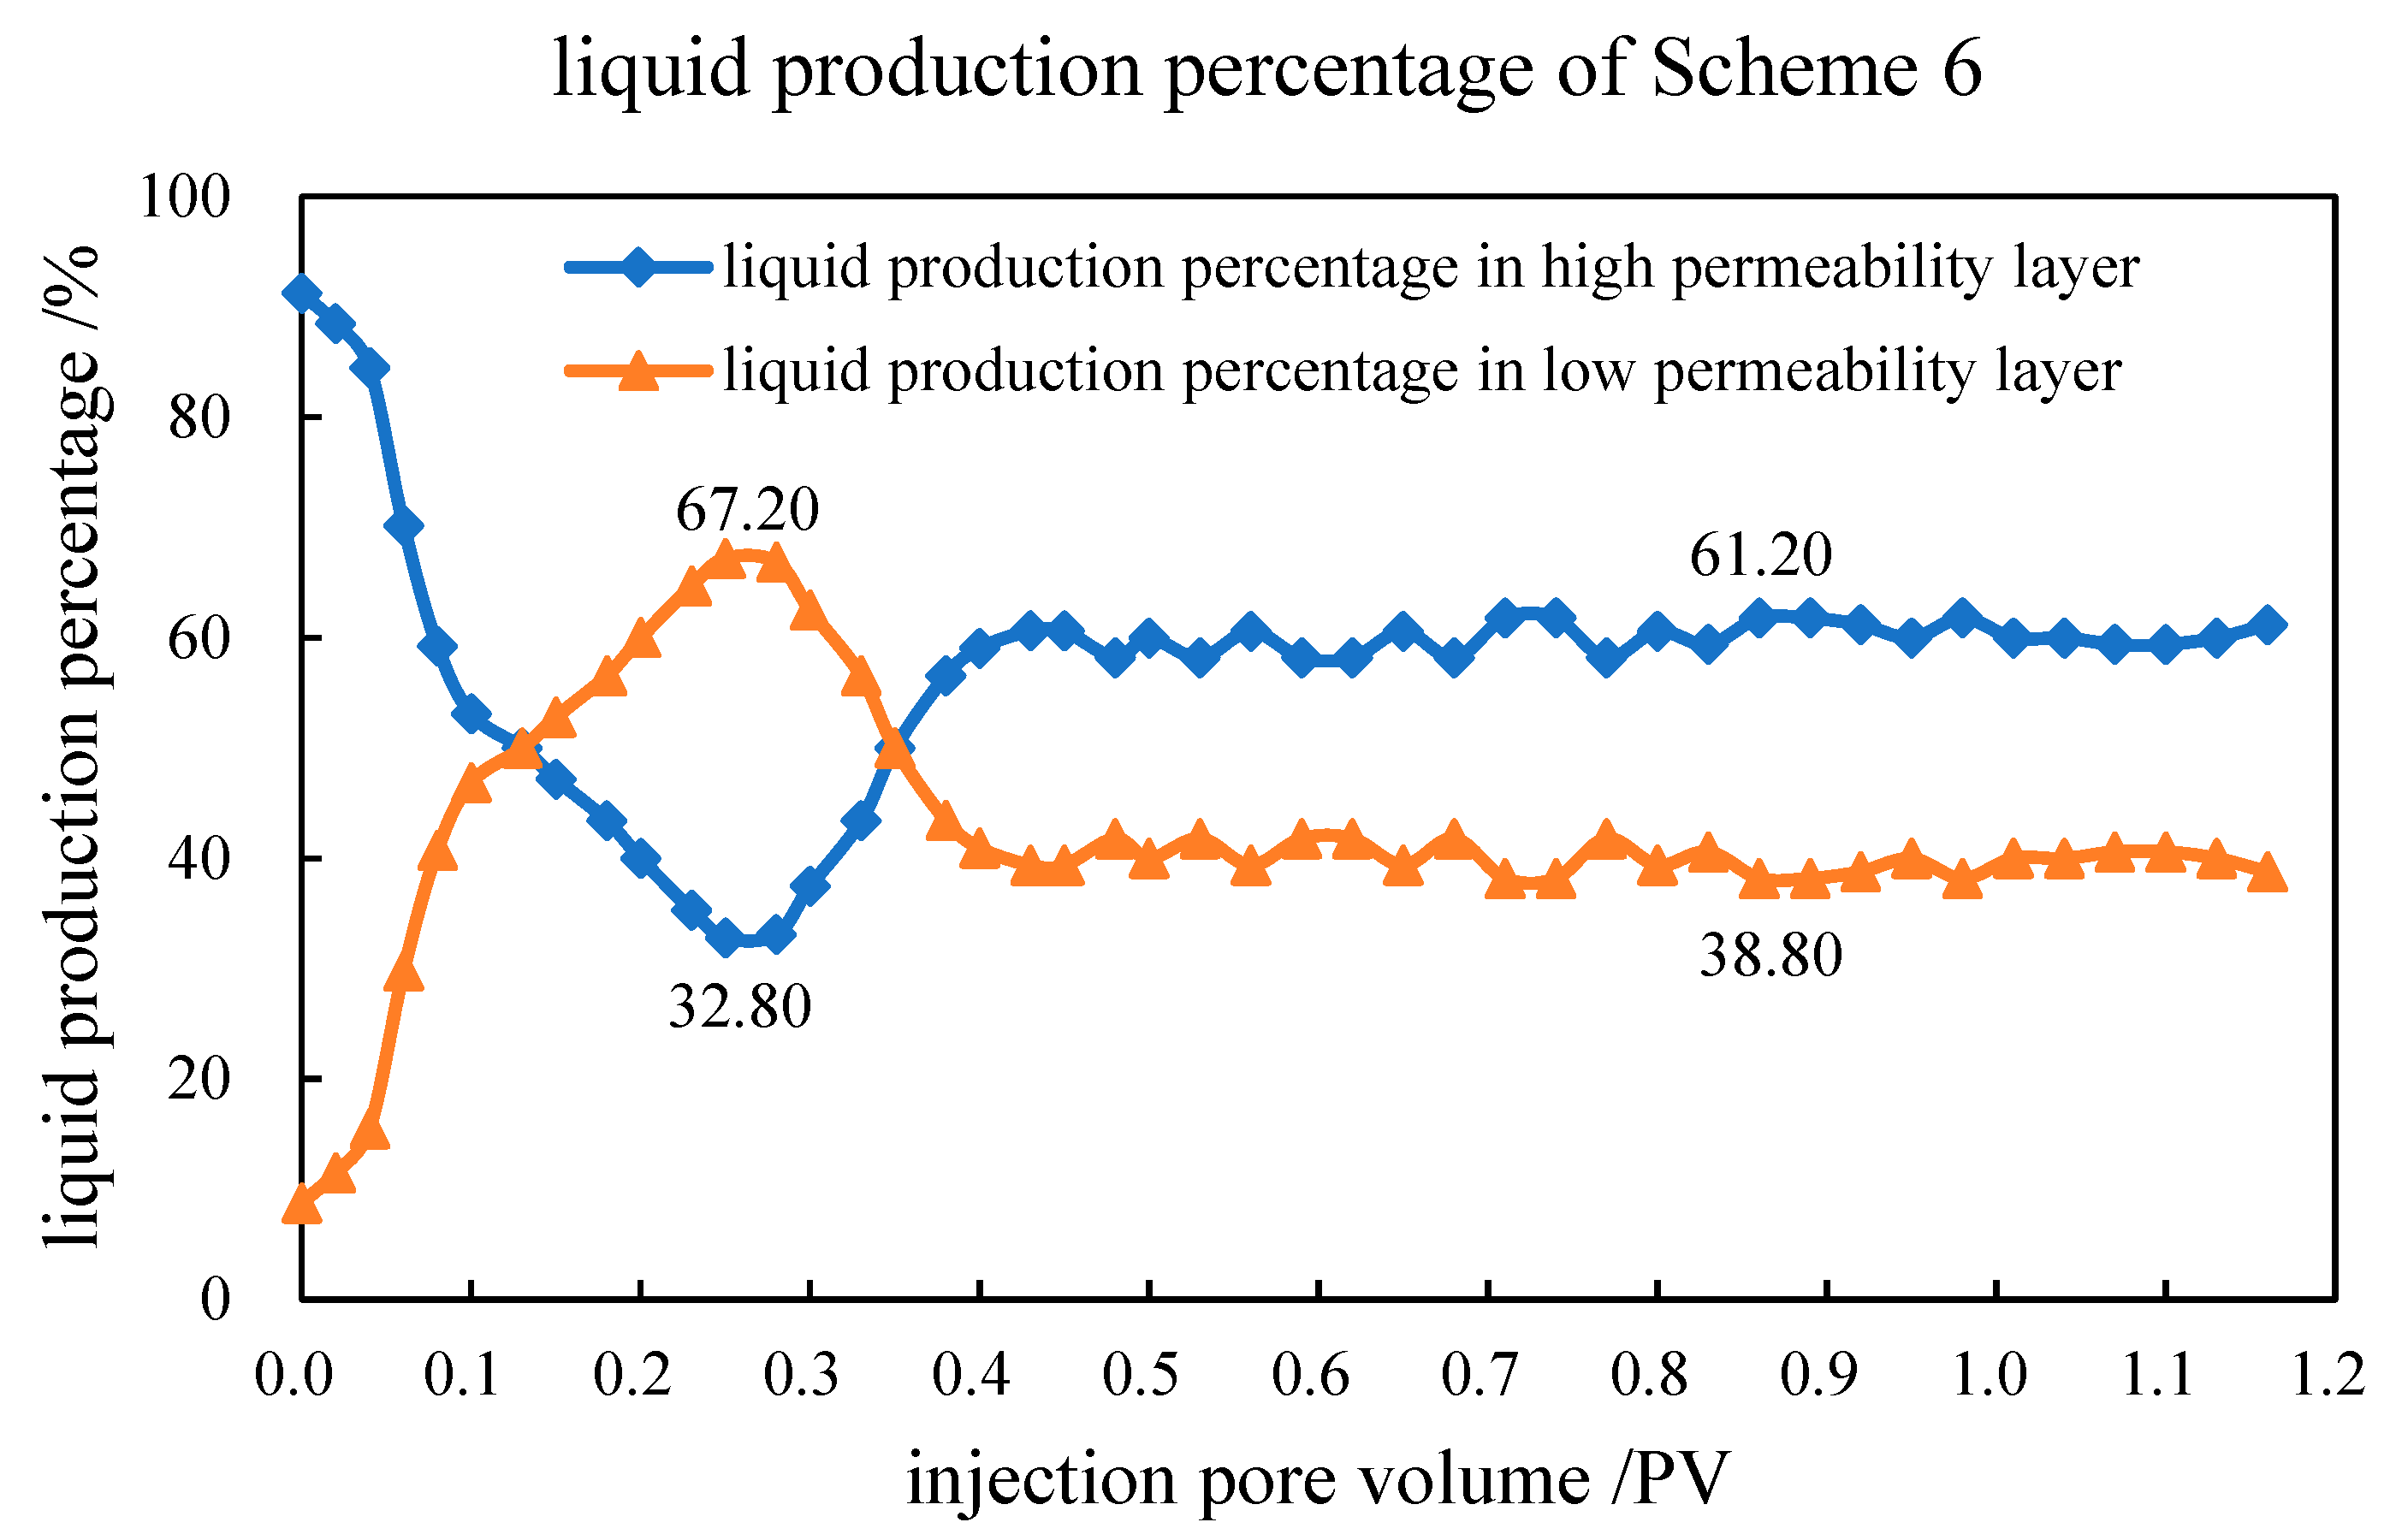
Under essentially the same injection volume, the laboratory experiment results showed that the alternating injection of the oil displacement agent and viscosity reducer yielded better results than their mixed injection, and small segments alternating injections achieved the highest recovery. The enhanced oil recovery was 20.9% for Scheme 1 with a mixed injection, 24.3% and 22.2% for Scheme 2 and Scheme 3, with slug injection, respectively, and 27.2% for Scheme 6, with alternating injections of small segments, consisting of 0.03 PV of 2000 mg/L oil displacement agent solution followed by 0.02 PV of a 0.5% viscosity reducer solution. For Scheme 6, alternating injections of small segments, the maximum liquid production ratio was 2.0 between the high- and low-permeability layers, 1.21 times that of Scheme 2. The liquid production reverse duration was 0.22 PV between the high- and low-permeability layers, 1.38 times that 0.16 PV of Scheme 2, as shown in Figure 5 and Figure 6.
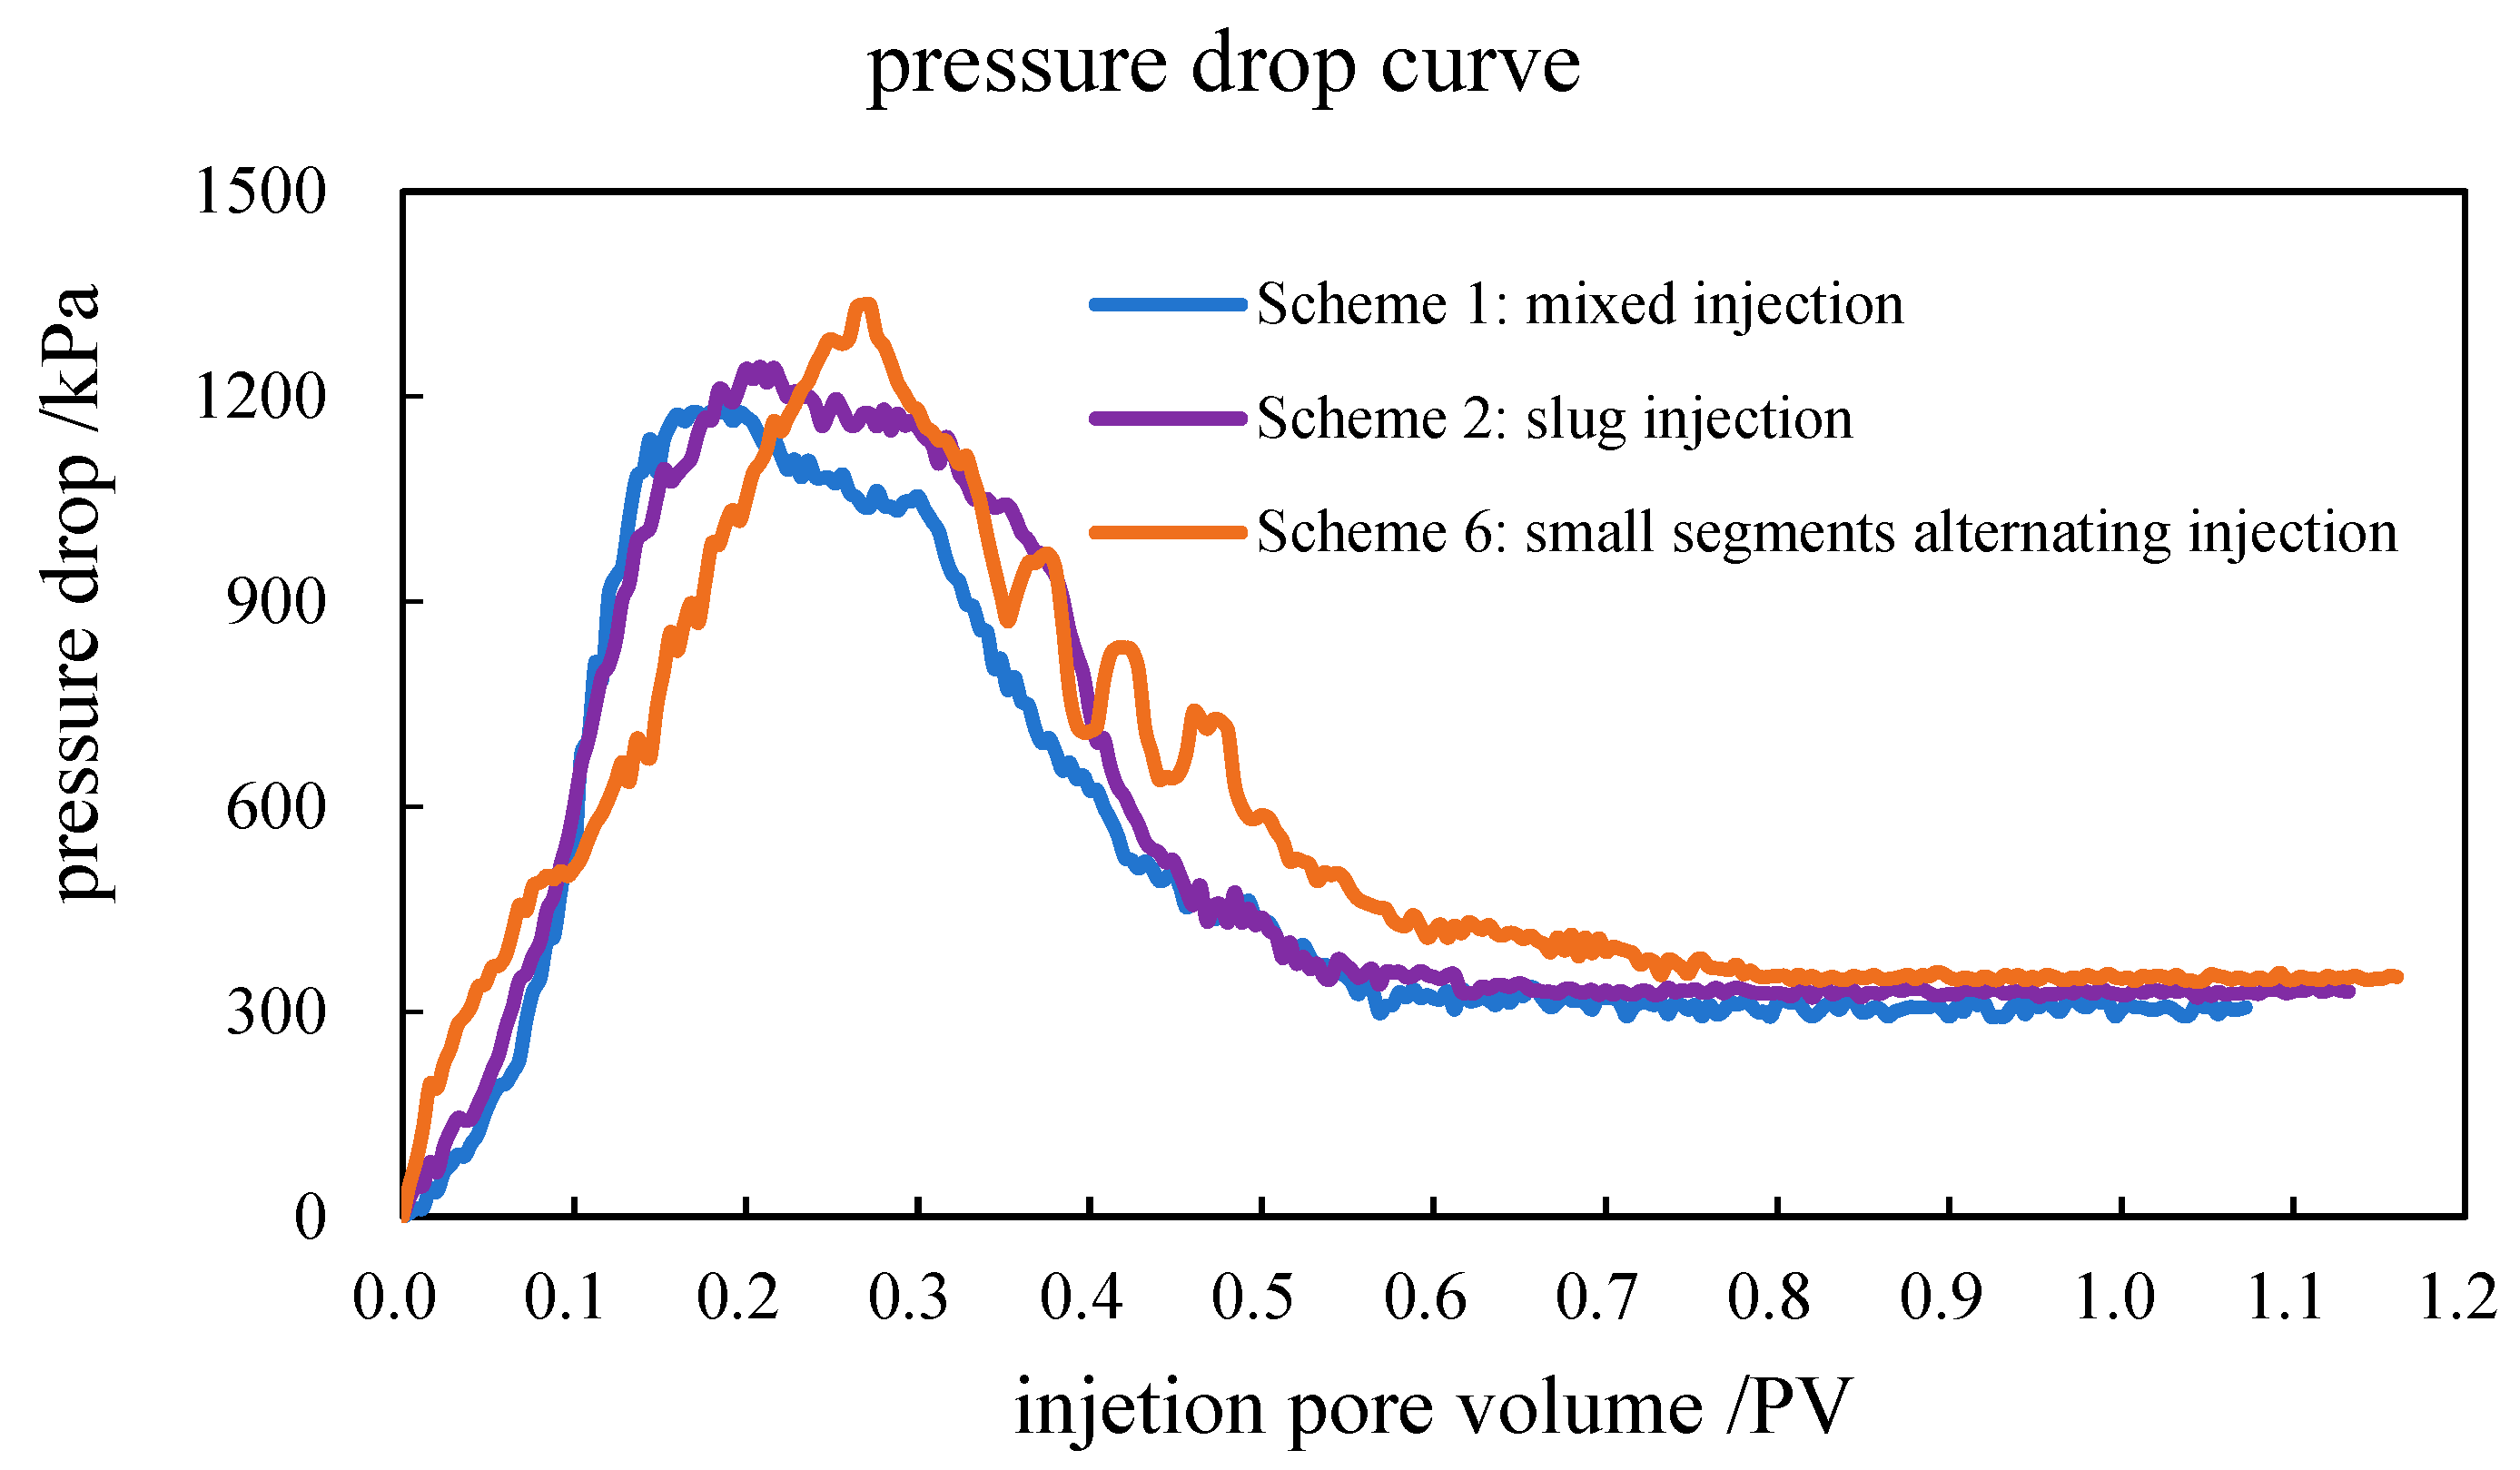
The stable pressure drop was approximately 200 kPa after huff-and-puff. Following the injection of the plugging agent, the pressure drop increased rapidly and then showed fluctuations up and down within a small range after alternating injections of small segments, reaching a maximum of 1334.5 kPa, higher than that of 1243.7 kPa of Scheme 2, slug injection, and 1180.6 kPa of Scheme 1, mixed injection, as shown in Figure 7. The pressure drop continued to fluctuate for a period before stabilizing at around 350 kPa during the subsequent water flooding, higher than the 330 kPa achieved by slug injection and 305 kPa achieved by mixed injection, which showed no obvious fluctuations up and down during the whole injection procedure. Therefore, the alternating injection of small segments could play a role in the gradual adjustment of the profile and increase seepage resistance.
The resistance factor (RF) was calculated as the ratio of the pressure drop during chemical compound flooding to that during huff-and-puff. The residual resistance factor (RRF) was calculated as the ratio of the pressure drop during subsequent water flooding to that during huff-and-puff. The RF of Scheme 6 was 6.7, greater than the 6.2 of Scheme 2 and 5.9 of Scheme 1. The RRF of Scheme 6 was 1.7. During the subsequent water flooding, the difference in the liquid production percentage between the high- and low-permeability layers was minimal, with approximately 61% in the high-permeability layer and 39% in the low-permeability layer for Scheme 6, showing that the system achieved optimal equilibrium displacement.
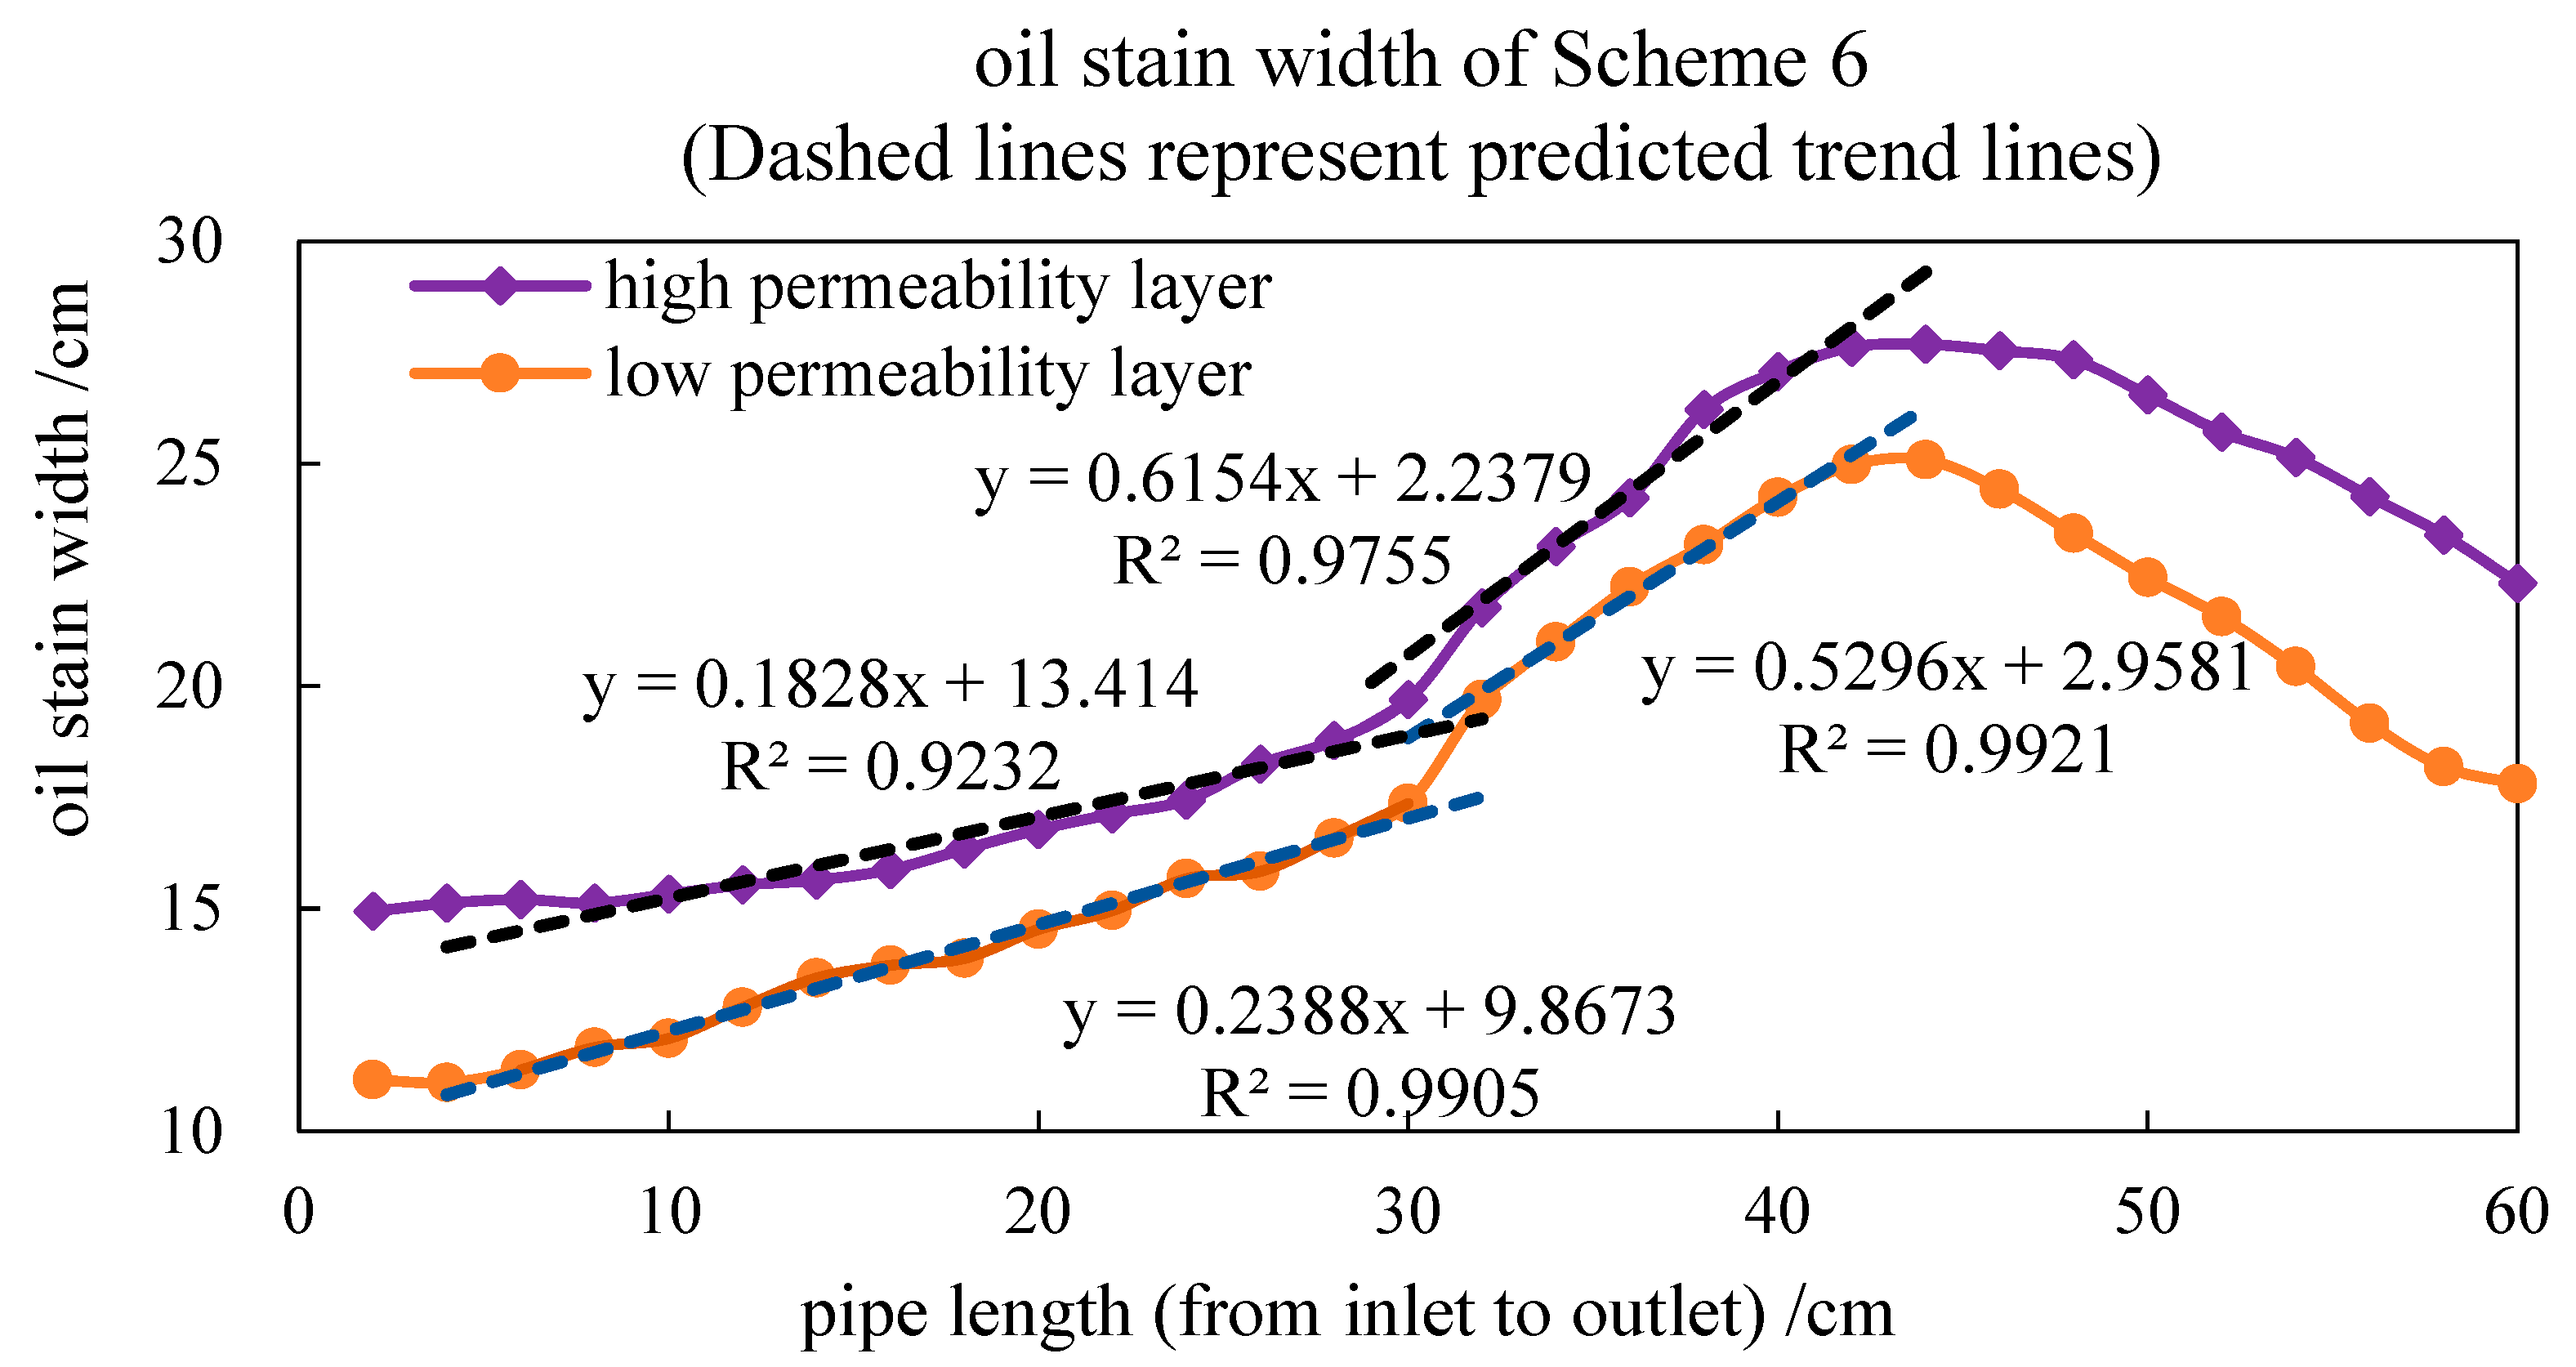
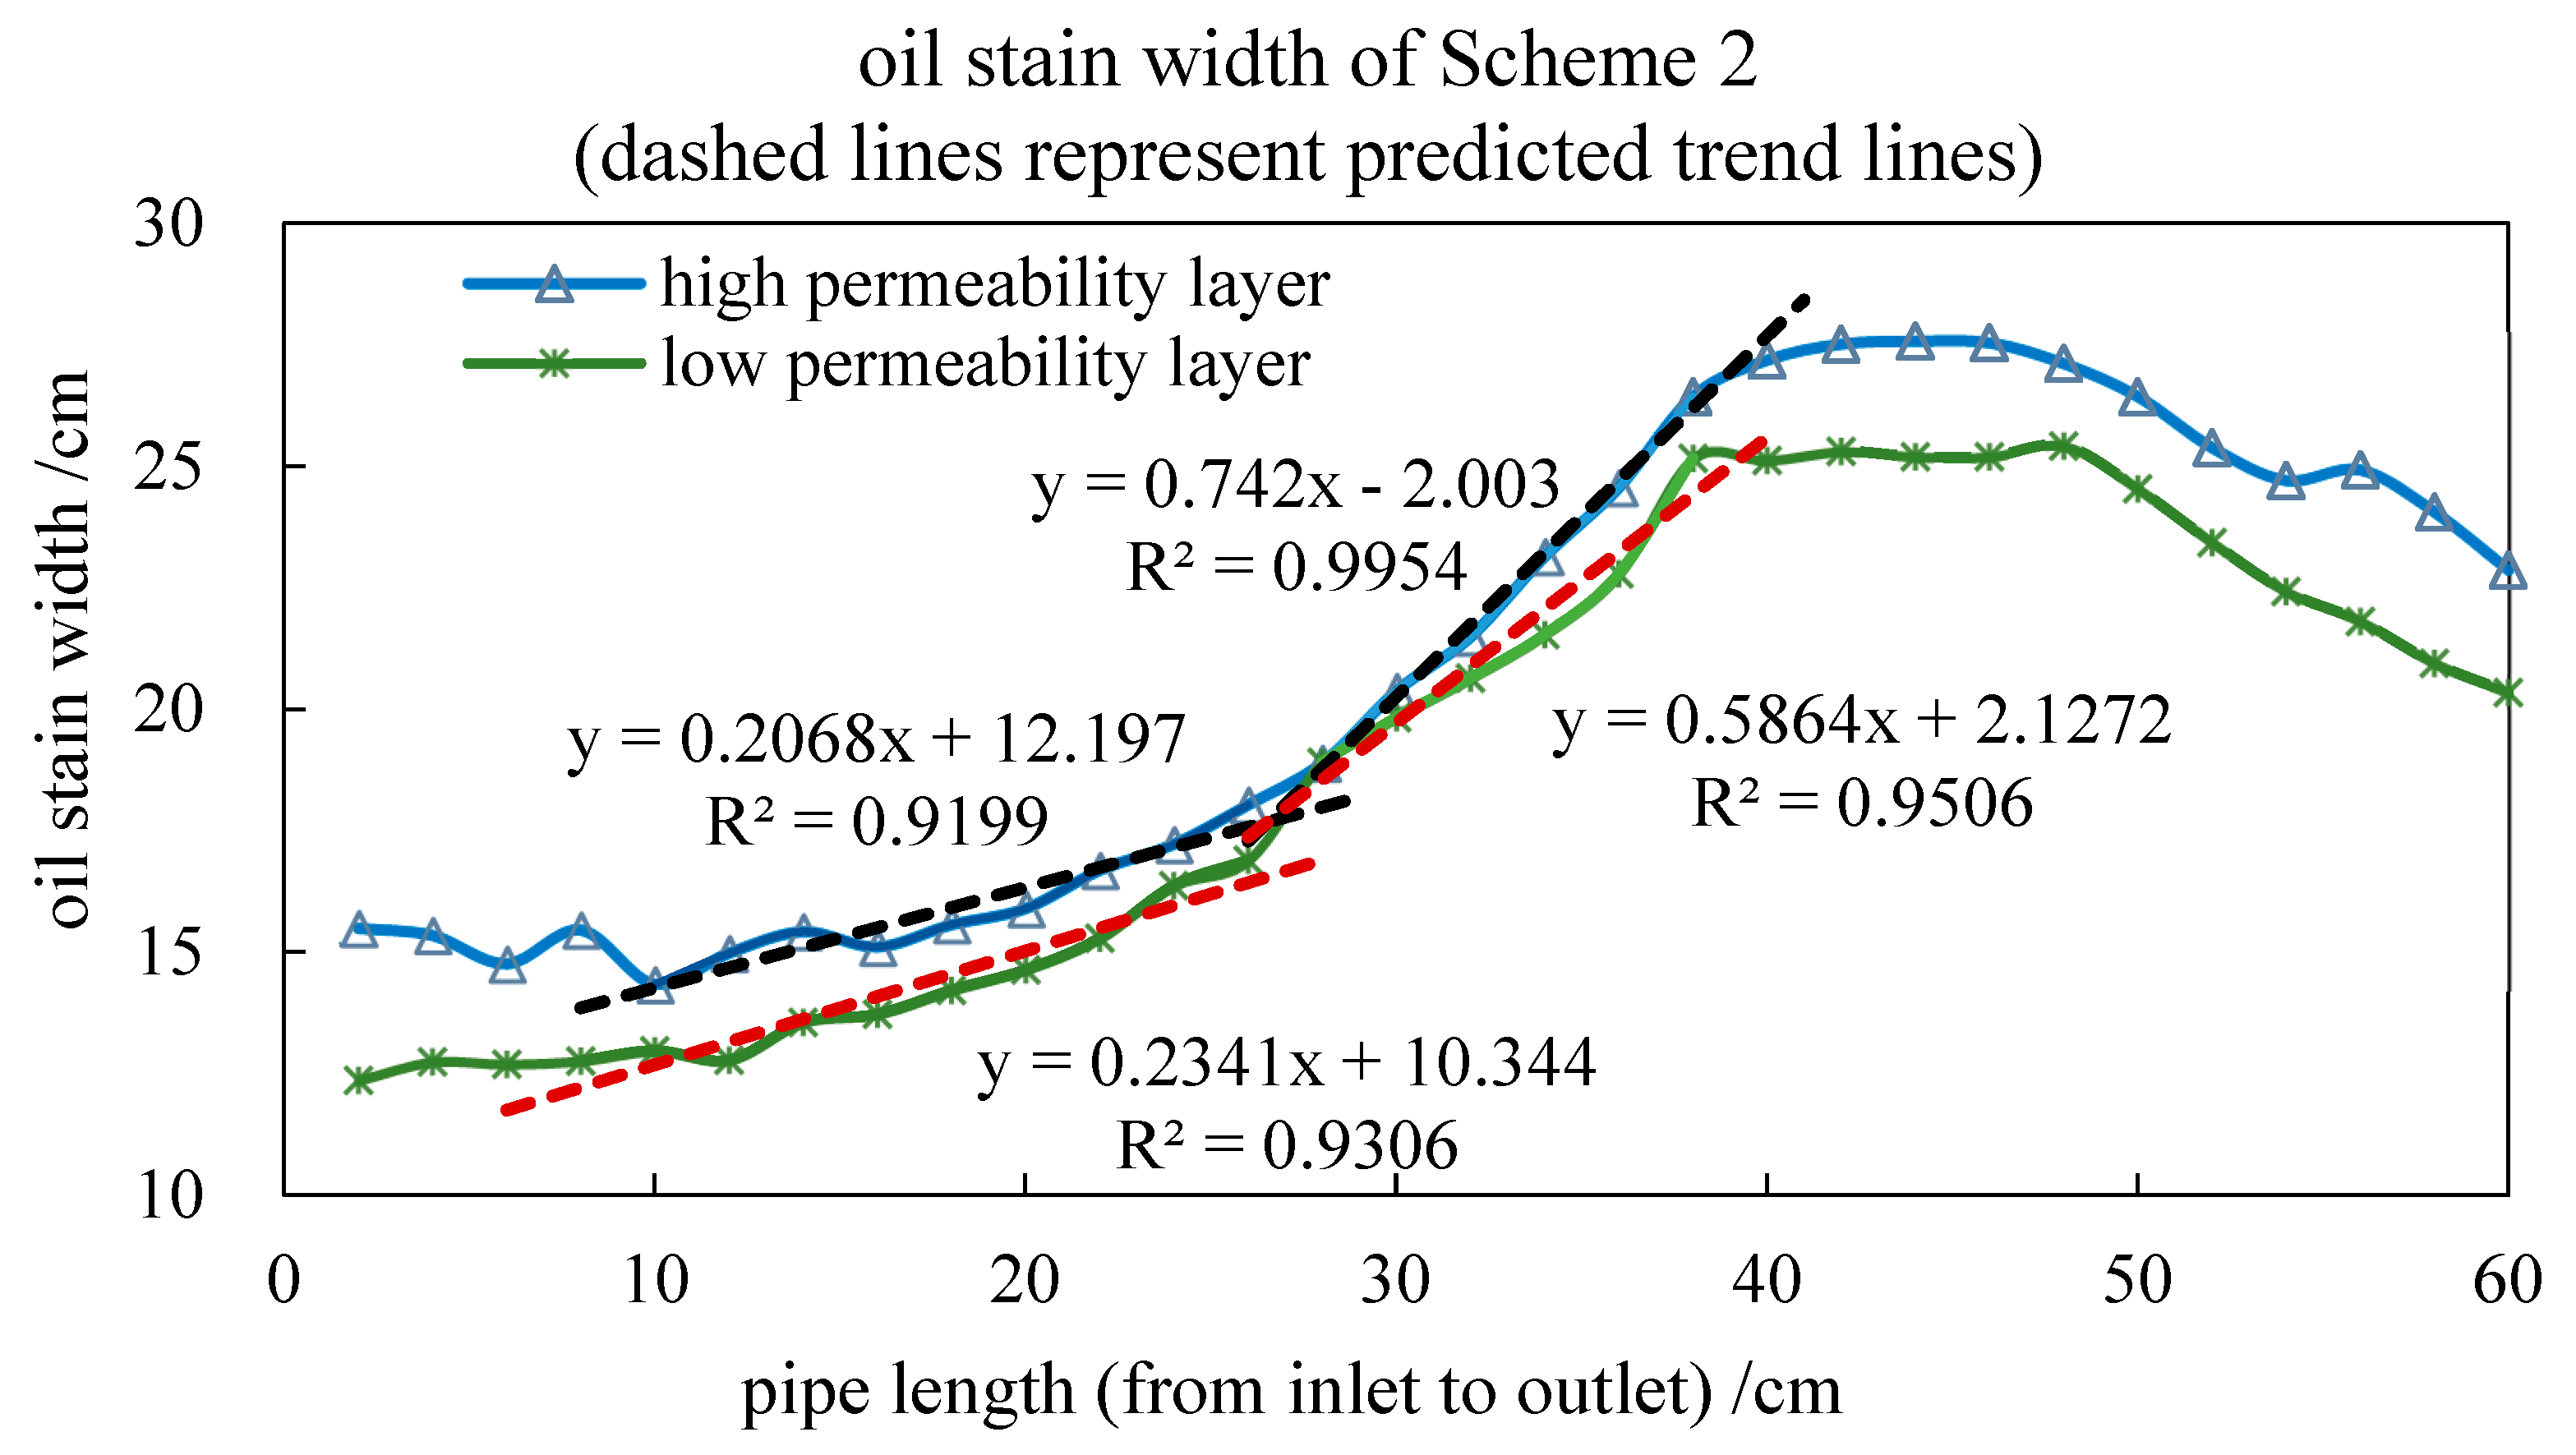
In this study, the oil stain width in the two-pipe models, obtained through physical drilling and chromogenic trace analysis, was used to discuss the distribution of the remaining oil. The wider and darker the oil stain, the more remaining oil in that section of the pipe. The color of the oil stains in Scheme 6, following the alternating injection of small segments, was much lighter than that in Scheme 2, slug injection, and Scheme 1, mixed injection, indicating less remaining oil. The effective depth was defined as the sand-filled pipe length corresponding to the point where the oil stain width increased significantly, that is, where the slope of the curve of the oil stain width versus pipe length exhibited a significant change. The distribution of oil stain width along the pipe in the high- and low-permeability layers, as shown in Figure 8 and Figure 9, shows that the effective depth of Scheme 6 was 30 cm, greater than the 26 cm of Scheme 2 and 22 cm of Scheme 1. Moreover, Scheme 6 demonstrated a narrower oil stain width compared to both Scheme 2 and Scheme 1, particularly from the inlet to the effective depth and near the outlet. This phenomenon was more pronounced in the low-permeability layer, indicating that Scheme 6 achieved better oil displacement efficiency and resulted in less remaining oil.
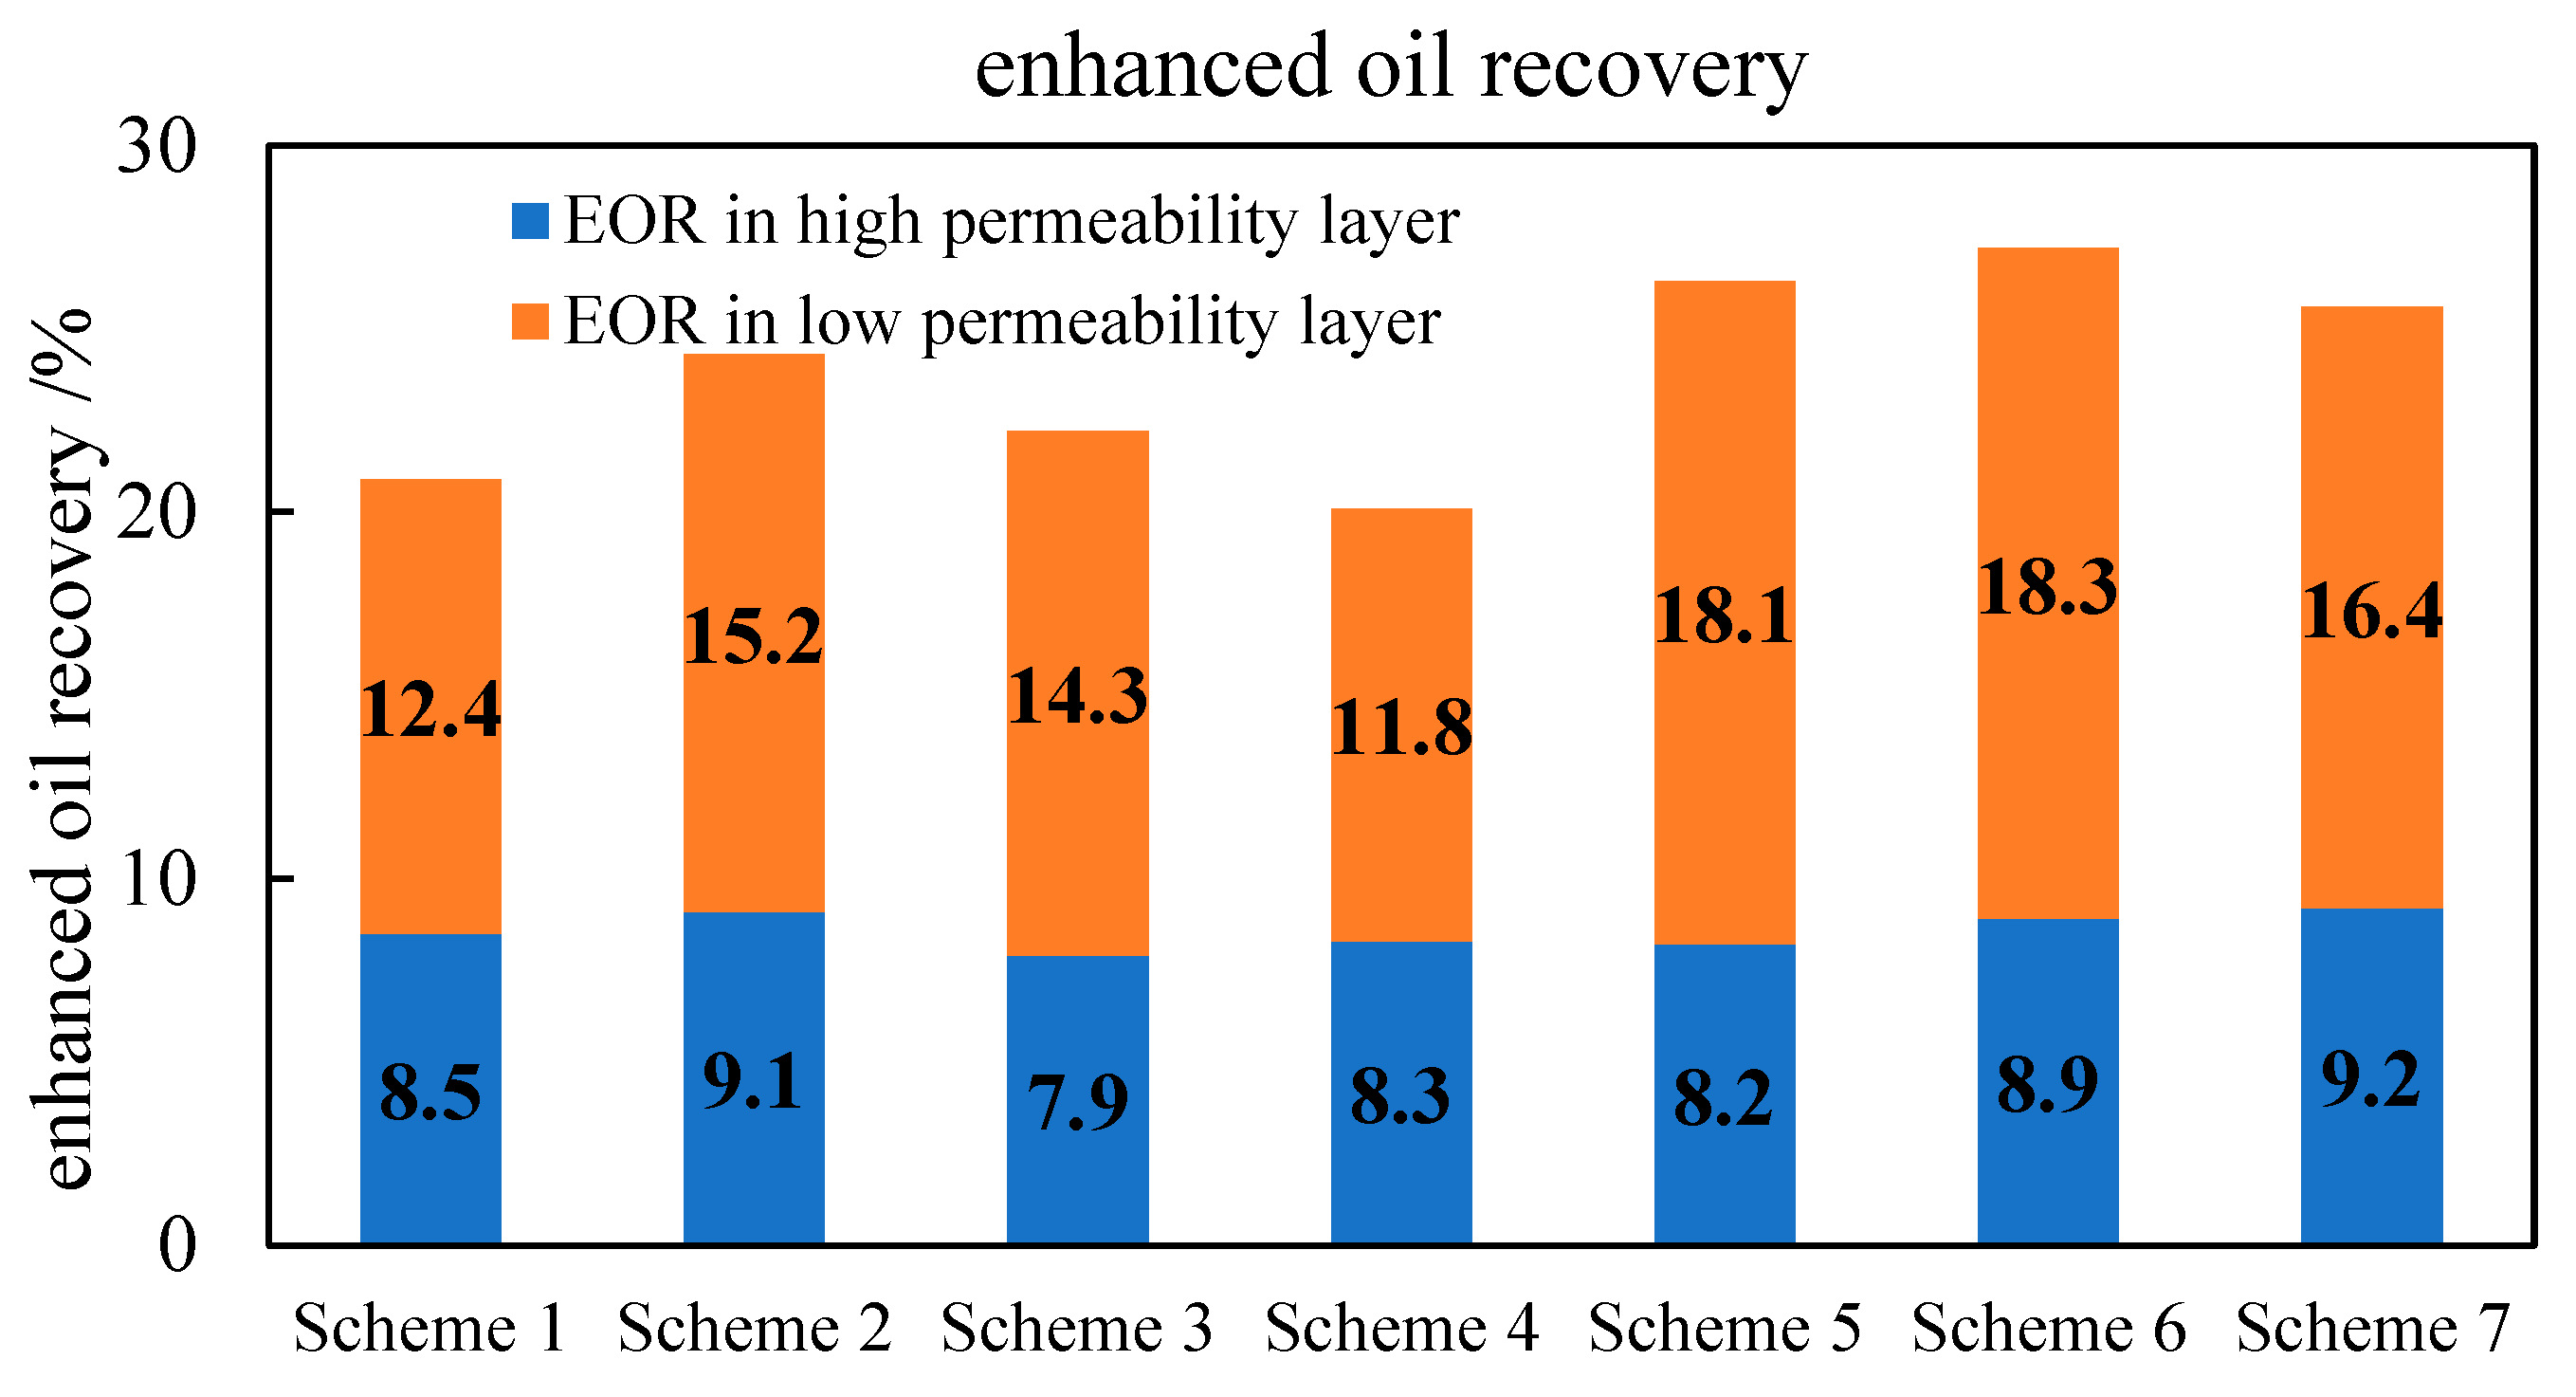
For the slug injection in Scheme 2, with the oil displacement agent followed by the viscosity reducer, the injection pressure drop increased more rapidly than that of Scheme 3, with the viscosity reducer followed by the oil displacement agent, and the maximum value 140.6 kPa higher. Therefore, the high-permeability layer was plugged effectively. The enhanced oil recovery was 9.1% and 15.2%, respectively, in the high- and low-permeability layers, higher than the 7.9% and 14.3%, respectively, observed in the high- and low-permeability layers in Scheme 3, as shown in Figure 10. The liquid production ratio was lower. During chemical compound flooding, the maximum liquid production percentage was 62.89% in the low-permeability layer, and the minimum was 37.11% in the high-permeability layer. In contrast, for Scheme 3, the corresponding values were 73.52% and 26.48% in the low- and high-permeability layers, respectively. However, the liquid production reverse duration was long, at 0.16 PV in Scheme 2, longer than the 0.12 PV in Scheme 3.
When the plugging agent injection volume was lower, such as the 0.05 PV observed in Scheme 4, the maximum injection pressure drop was low, at 809.7 kPa, resulting in incomplete plugging in the high-permeability layer and a relatively low enhanced oil recovery of 11.8% in the low-permeability layer. Consequently, the overall enhanced oil recovery was low, at 20.1%.
Based on the above experimental results, the analysis suggested that the plugging agent could effectively block the dominant flow channels and then increase the seepage resistance in the high-permeability layer, forcing the subsequently injected chemical agents to divert into the low-permeability layer, and thereby effectively expanding the swept volume of the low-permeability layer. The fluctuations in pressure drop and the reverse in liquid production showed that the chemical agents could lead to a plugging–migration–replugging–remigration pattern. The alternating injection of small segments continuously adjusted the injection profile, synergistically leveraging the oil displacement agent’s function of increasing displacing phase viscosity and reducing mobility, as well as the viscosity reducer’s roles in emulsification, viscosity reduction and oil washing. This simultaneously expanded the swept volume and enhanced the displacement efficiency, thus significantly enhancing the oil recovery.

3.2.3. Optimization of Slug Size Ratio

When employing the alternating injection of small segments, the slug size ratio and the concentration of chemical agents were further optimized. When the slug size ratio of oil displacement agent injection PV to viscosity reducer injection PV was 8:2, 6:4, and 2:8, the enhanced oil recovery was 26.3%, 27.2%, and 25.6%, respectively. An increase in the volume of the oil displacement agent injected resulted in an increase in the maximum liquid production ratio between the high- and low-permeability layers. During chemical compound flooding, the maximum liquid production percentage in the low-permeability layer was 71.6%, 67.2% and 61.0% for slug size ratios of 8:2,6:4 and 2:8, respectively. Moreover, an increase in the volume of oil displacement agent injected led to a shorter duration of liquid production reversal, at 0.17 PV for the slug size ratio of 8:2. A larger injection volume of the viscosity reducer resulted in a greater reduction in water cut. For the slug size ratio of 2:8, the minimum water cut in the high- and low-permeability layers was 57.1% and 35.5%, respectively, and a smaller maximum liquid production ratio was observed between the high- and low-permeability layers, as shown in Table 7.
The analysis indicated that when the injected oil displacement agent was insufficient, the plugging of the high-permeability layer was incomplete, making it easy for dominant flow channels to form and resulting in a low maximum liquid production ratio; therefore, the enhancement in oil recovery was low in the low-permeability layer. Conversely, a small injection of the viscosity reducer leaded to an insufficient viscosity reduction, resulting in wider oil stains and more remaining oil.

3.2.4. Optimization of Chemical Agent Concentration

For the chemical compound flooding system, a higher oil displacement agent (PAM) concentration resulted in a higher capacity to expand the swept volume and to adjust the profile, along with a larger maximum ratio of liquid production between the high- and low-permeability layers, and a longer liquid reverse duration. When the PAM concentration was 2500 mg/L, the maximum liquid production percentage in the high-permeability layer was 68.7%, and the liquid production reverse duration was 0.27 PV.
With the increase in the PAM concentration, the enhancement in oil recovery increased, but the increment rate gradually slowed down. Given an oil price of 50 $/bbl, a PAM cost of ¥10,000 per ton, a viscosity reducer (VR) cost of ¥6000 per ton, and a plugging agent (PA) cost of ¥11,000 per ton, the oil production increment of one ton of equivalent polymer (OPIEP) was calculated using the following formula:
OPIEP   =   oil   production   increment equivalent   polymer
equivalent   polymer   =   dosage   of   PAM   +   dosage   of   VR VR   cost PAM   cost   +   dosage   of   PA PA   cost PAM   cost
The equivalent polymer represents the amount of chemical agents used, including the plugging agent, oil displacement agent, and viscosity reducer, converted to the polymer amount according to their respective price. Based on the use of the same concentration of a viscosity reducer, as the PAM concentration was 2000 mg/L, the highest OPIEP was 25.3 t/t, as shown in Table 8.
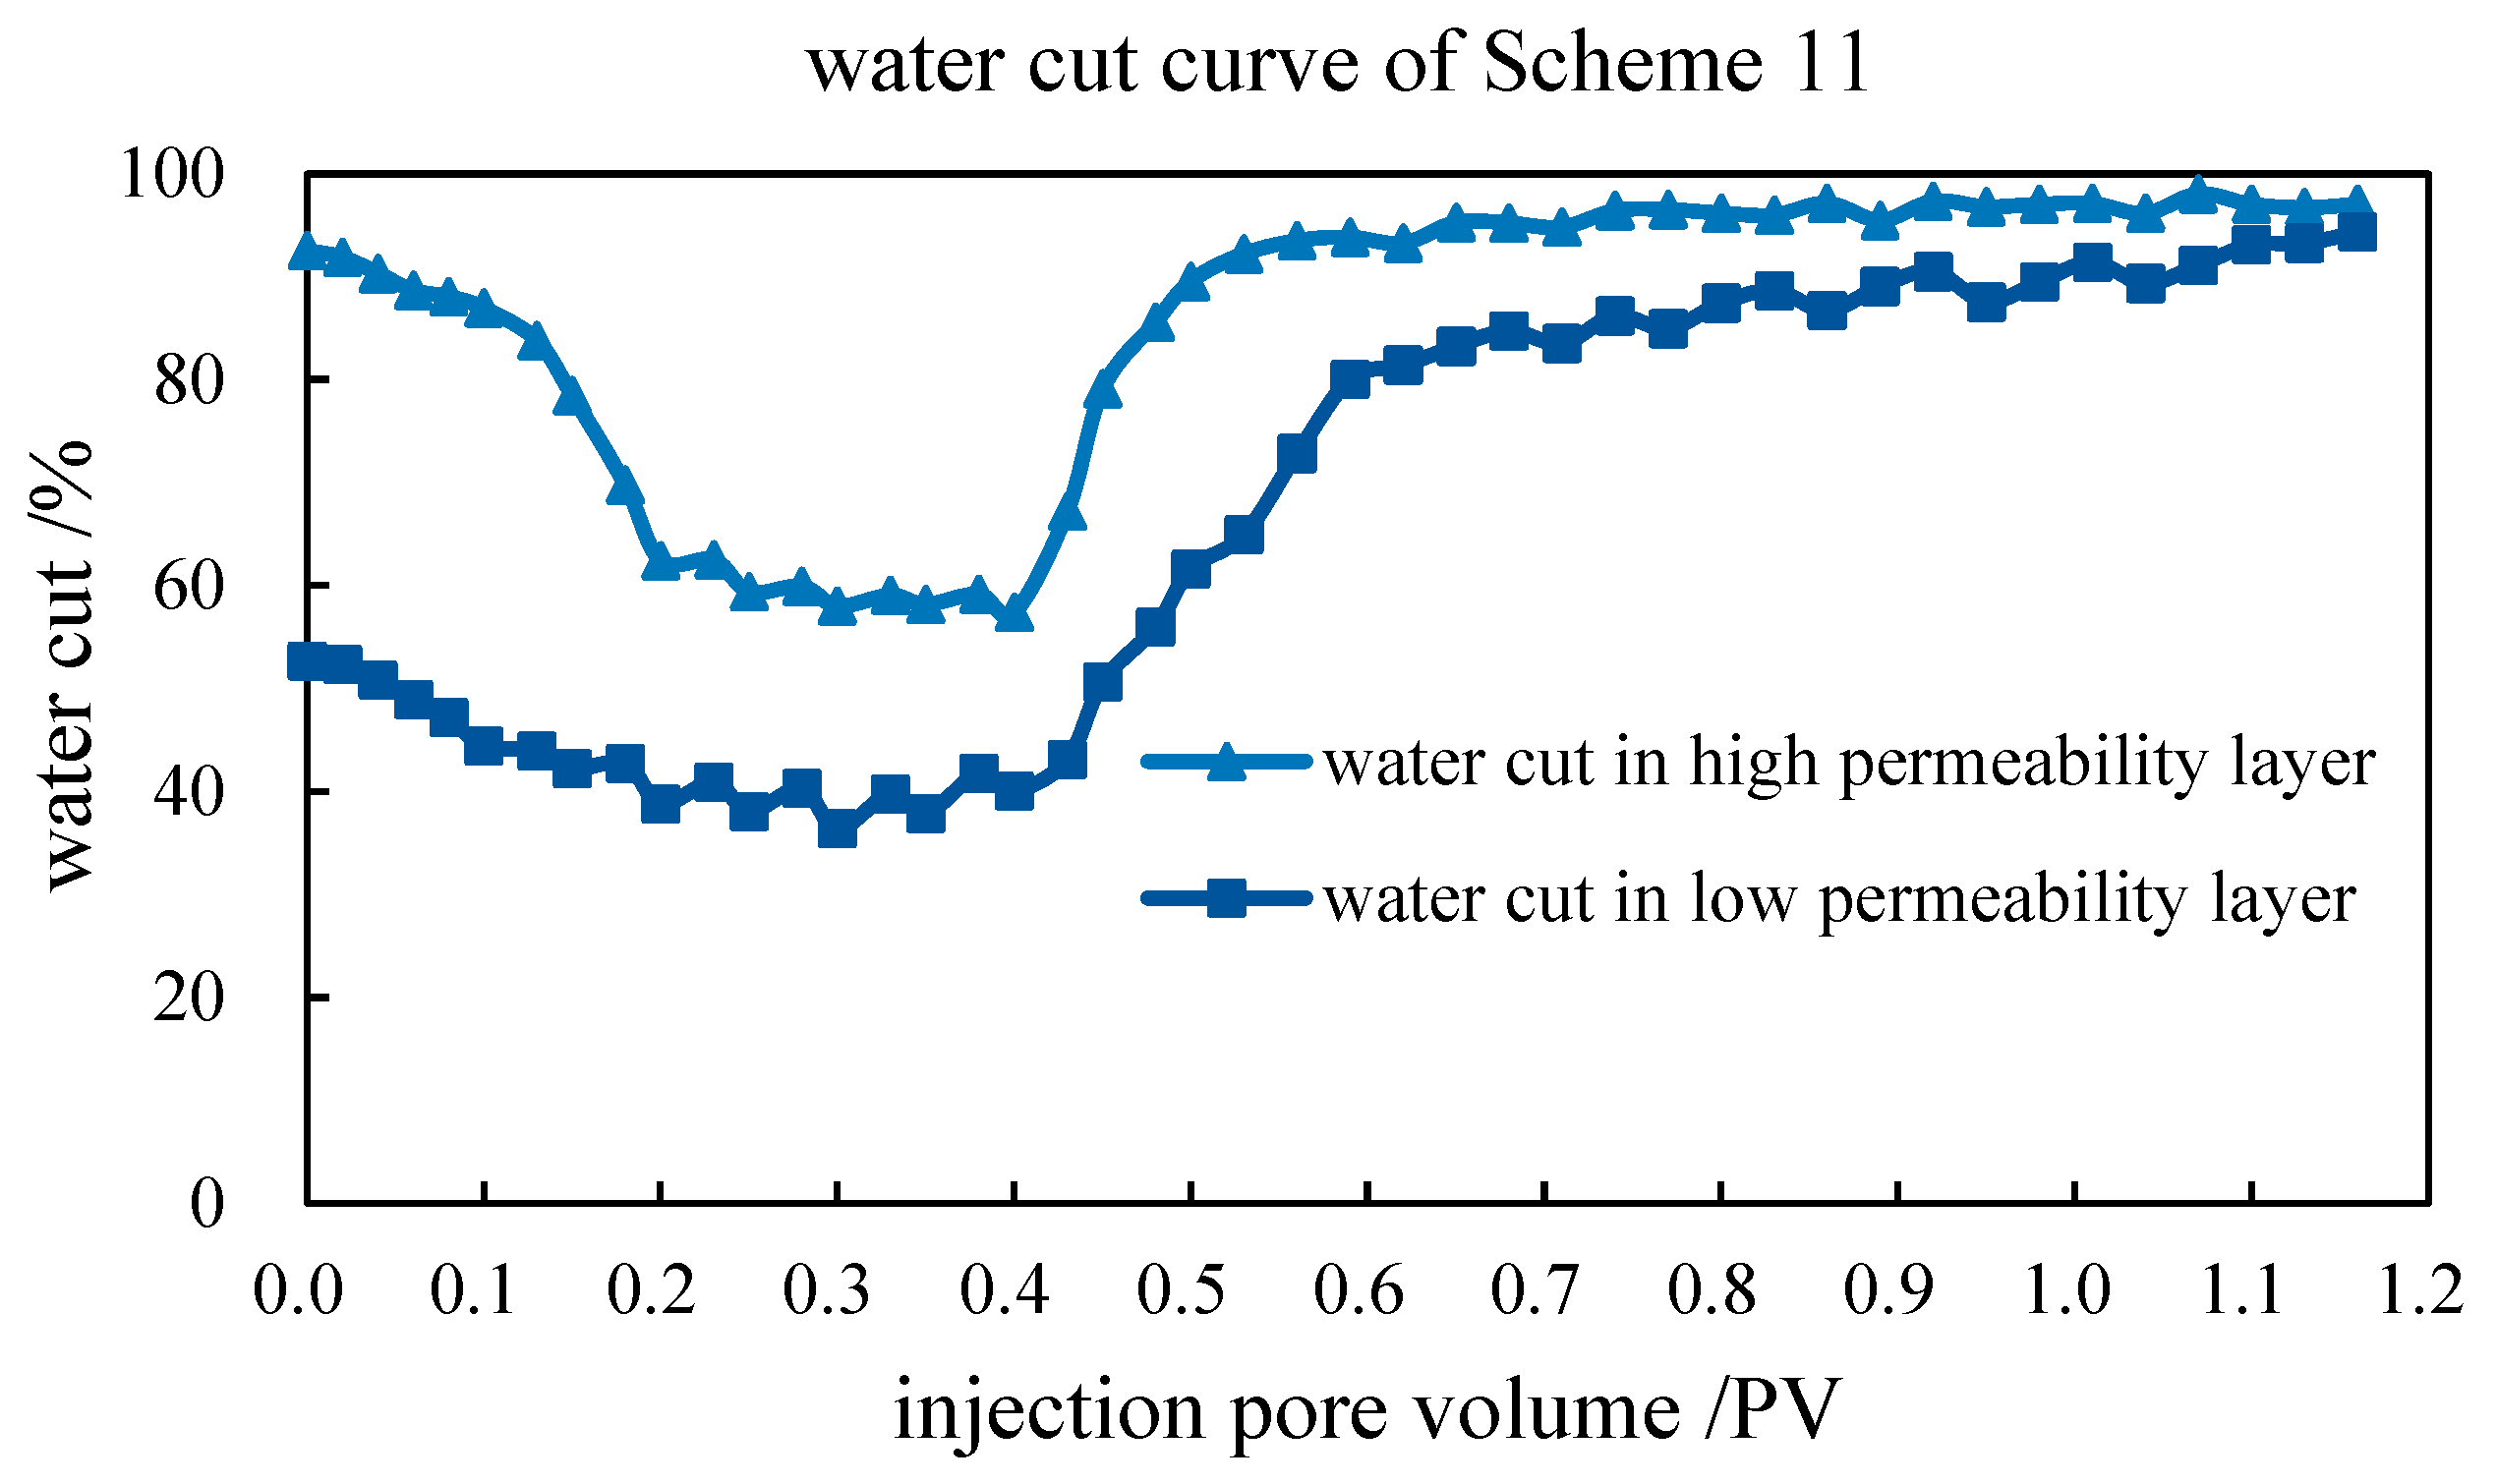
With an increase in the concentration of the viscosity reducer, the oil-in-water (O/W) emulsion became smaller, denser and more stable. The viscosity of the crude oil greatly reduced, thereby enhancing its fluidity. A higher concentration of the viscosity reducer led to a lower minimum water cut. When the viscosity reducer concentration was 0.75%, the minimum water cut in the high- and low-permeability layers was 57.38% and 36.38% respectively, and the rising rate of the water cut slowed down during the subsequent water flooding, as shown in Figure 11.
A higher viscosity reducer concentration resulted in an increase in the enhancement of oil recovery, but the increment rate gradually slowed down. Based on the same concentration of oil displacement agent, the OPIEP was the highest when the concentration of the viscosity reducer was 0.5%.
Based on the above laboratory experiments, the recommended injection mode for chemical compound flooding in the Zhong’er North Block in the Gudao oilfield is as follows: 0.1 PV plugging agent + 2000 mg/L oil displacement agent + 0.5% viscosity reducer, with small segments of the oil displacement agent followed by the viscosity reducer at an injection slug ratio of 6:4. However, the injection mode depends on oil prices and the price of chemical agents. When these prices fluctuate, the chemical agent concentration should be adjusted accordingly.

4. Conclusions

  • A suitable formulation system for chemical compound flooding was optimized and determined for the target reservoir, consisting of no less than 2000 mg/L PAM, a self-developed viscosity reducer with more than 95% viscosity reduction percentage, and a self-developed eco-friendly gel comprising 3000 mg/L polymer with a polymer-to-polyethyleneimine ratio of 1:1. The compatibility of the chemical agents was satisfactory.
  • The injection mode of chemical compound flooding was identified as a key factor affecting the displacement effects. Alternating injections yielded better results than mixed injections, and alternating injections of small segments achieved the highest recovery.
  • Chemical compound flooding could further enhance the oil recovery in heavy oil reservoirs after multiple cycles of huff-and-puff. For the Zhong’er block in the Gudao oilfield, given an oil price of 50 $/bbl, the recommended injection mode was 0.1 PV plugging agent + 2000 mg/L oil displacement agent + 0.5% viscosity reducer, with small segments of oil displacement agent followed by a viscosity reducer at an injection slug ratio of 6:4. The injection mode depends on the oil prices and the price of chemical agents. When these prices fluctuate, the chemical agent concentration should be adjusted accordingly.

Author Contributions

Conceptualization, L.Z. and L.T.; Methodology, L.T. and G.X.; Writing—original draft, L.Z. and J.B.; Writing—review and editing, L.Z. and J.B.; Formal analysis, L.Z. and J.B.; Data curation, G.X. and J.B.; Investigation, G.X.; Validation, J.B. All authors have read and agreed to the published version of the manuscript.

Funding

This research was funded by the National major science and technology project (2025ZD1408200) and the SINOPEC science and technology project (P24168).

Data Availability Statement

Restrictions apply to the availability of these data. The data were obtained from SINOPEC Petroleum Exploration and Production Research Institute and are available from the corresponding authors with the permission of SINOPEC Petroleum Exploration and Production Research Institute.

Conflicts of Interest

Authors Li Zhang and Guanli Xu were employed by the SINOPEC Petroleum Exploration and Production Research Institute. The remaining authors declare that the research was conducted in the absence of any commercial or financial relationships that could be construed as a potential conflict of interest.

References

  1. Wang, H.Z. Heavy Oil Recovery Technologies; Petroleum Industry Press: Beijing, China, 2019. [Google Scholar]
  2. Zhang, L. Progress and research direction of EOR technology in eastern mature oilfields of Sinopec. Oil Gas Geol. 2022, 43, 717–723. [Google Scholar]
  3. Hu, C.H. Research progress and development direction of steam flooding technology for medium and deep heavy oil reservoirs. Spec. Oil Gas Reserv. 2020, 27, 54–59. [Google Scholar]
  4. Wang, L.Z. Distribution Characteristics of Residual Oil After Multiple Huff and Puff Cycles in Heavy Oil Reservoirs; China University of Petroleum: Beijing, China, 2019. [Google Scholar]
  5. Yao, X.T.; Su, X.K.; Zheng, X.; Ma, J.; Gai, L.; Cui, C. 3D physical simulation experiments of development effects after well pattern adjustment in extra-high water cut reservoirs. Pet. Geol. Recovery Effic. 2023, 30, 139–145. [Google Scholar]
  6. Yuan, S.Y.; Wang, Q. New progress and prospect of oilfields development technologies in China. Pet. Explor. Dev. 2018, 45, 657–668. [Google Scholar] [CrossRef]
  7. Zhang, L.; Yue, X.A.; Wang, Y.Q. Physical simulation experimental study on the enhanced oil recovery in the late stage of ultra-high water cut. Oil Drill. Prod. Technol. 2020, 42, 363–368. [Google Scholar]
  8. Liao, J.; Huang, Z.X.; Zhang, F.M.; Wang, H.B.; Wei, Z.Y.; Wang, Y.F. Construction and performance evaluation of anionic surfactant/nonionic surfactant/polymer viscosity reduction composite flooding system. Oilfield Chem. 2026, 43, 45–53. [Google Scholar]
  9. Xue, M.H.; Chen, L.F.; Chen, H.Q.; Fu, L.; Bai, Y.; Lv, W.; Hou, B.; Riazi, M. Hydrogen-bond-modulated flowable weak gel for EOR in ultra-high temperature and ultra-high salinity fracture-cavity ordinary heavy oil reservoirs. Colloids Surf. A Physicochem. Eng. Asp. 2025, 725, 137–537. [Google Scholar] [CrossRef]
  10. Dong, X.H.; Liu, H.Q.; Chen, Z.X.; Wu, K.; Lu, N.; Zhang, Q. Enhanced oil recovery techniques for heavy oil and oilsands reservoirs after steam injection. Appl. Energy 2019, 23, 1190–1211. [Google Scholar] [CrossRef]
  11. Guan, W.L.; Jiang, Y.W.; Guo, E.P.; Wang, B. Heavy oil development strategy under the “Carbon Peaking and Carbon Neutrality” target. Acta Pet. Sin. 2023, 44, 826–840. [Google Scholar]
  12. Yu, B. Study on Property Control of Amphiphilic Polymers for Oil Displacement and Its Synergistic Mechanism. Ph.D. Thesis, China University of Petroleum, Beijing, China, 2019. [Google Scholar]
  13. Chen, X.R.; Hou, Q.F.; Liu, Y.F.; Liu, G.; Zhang, H.; Sun, H.; Zhu, Z.; Liu, W. Experimental study on surfactant–polymer flooding after viscosity reduction for heavy oil in matured reservoir. Energies 2025, 18, 756. [Google Scholar] [CrossRef]
  14. Hu, J.; Shi, L.T.; Luo, Y.; Chen, M.; Jin, C.; Guo, Y.J.; Yuan, N. A surfactant-polymer and macromolecular surfactant compound system for enhancing heavy oil recovery: Synthesis, characterization and mechanism. Colloid Polym. Sci. 2025, 303, 637–653. [Google Scholar] [CrossRef]
  15. Cao, X.L.; Ji, Y.F.; Zhu, Y.W.; Zhao, F. Research advance and technology outlook of polymer flooding. Reserv. Eval. Dev. 2020, 10, 8–16. [Google Scholar]
  16. Sun, L.D.; Wu, X.L.; Zhou, W.F.; Li, X.; Han, P. Technologies of enhancing oil recovery by chemical flooding in Daqing Oilfield, NE China. Pet. Explor. Dev. 2018, 45, 636–645. [Google Scholar] [CrossRef]
  17. Sun, H.Q. Recovery Theory and Technology of Marginal Heavy Oil; Petroleum Industry Press: Beijing, China, 2021. [Google Scholar]
  18. Wu, Z.B.; Liu, H.Q.; Wang, X. Adaptability research of thermal-chemical assisted of steam injection in heavy oil reservoirs. J. Energy Resour. Technol. 2018, 140, 052901. [Google Scholar]
Figure 1. Plugging agent viscosity with time (PAM-to-polyethyleneimine concentration ratio of 1:1).
Energies 19 01728 g001
Figure 2. Plugging agent viscosity with time (PAM-to-polyethyleneimine concentration ratio of 2:1).
Energies 19 01728 g002
Figure 3. Impact of viscosity reducer on the polymer’s viscosity.
Energies 19 01728 g003
Figure 4. Impact of polymer on the oil–water interfacial tension.
Energies 19 01728 g004
Figure 5. Liquid production percentage in high- and low-permeability layer for Scheme 2.
Energies 19 01728 g005
Figure 6. Liquid production percentage in high- and low-permeability layers for Scheme 6.
Energies 19 01728 g006
Figure 7. Pressure drop curve.
Energies 19 01728 g007
Figure 8. The distribution of oil stain width along the pipe for Scheme 6.
Energies 19 01728 g008
Figure 9. The distribution of oil stain width along the pipe for Scheme 2.
Energies 19 01728 g009
Figure 10. Enhanced oil recovery in high- and low-permeability layers.
Energies 19 01728 g010
Figure 11. Water cut curve in high- and low-permeability layers in Scheme 11.
Energies 19 01728 g011
Table 1. Viscosity of polymer solution at different concentrations.
Polymer Concentration
mg/L
Polymer Solution Viscosity mPa·s
Temperature 65 °CTemperature 77 °C
100013.9318.53
150027.7236.08
200052.6459.39
250083.2595.37
3000125.59137.09
Table 2. Viscosity retention percentage of polymer solution with time.
Time
day
051016202432404862758090
Viscosity retention percentage
%
100.0099.0498.9298.1095.4894.5890.3789.1588.6386.9886.3085.9684.87
Table 3. Viscosity reduction percentage at different viscosity reducer concentrations.
Viscosity Reducer Concentration
%
Viscosity Reduction Percentage
%
0.0534.51
0.1075.35
0.1589.44
0.2095.07
0.2597.18
0.3097.64
0.4097.89
0.5098.59
0.6098.85
Table 4. Impact of polymer on viscosity reducer performance.
Polymer Concentration
mg/L
Viscosity Reduction Percentage
%
50097.50
100096.95
150096.67
200096.33
250095.85
Table 5. Injection schemes using two-pipe models.
Injection ModeSchemeInjection Design
Mixed injection10.1 PV plugging agent + 0.4 PV 2000 mg/L oil displacement agent and 0.5% viscosity reducer
Slug injection20.1 PV plugging agent + 0.2 PV 2000 mg/L oil displacement agent + 0.2 PV 0.5% viscosity reducer
30.1 PV plugging agent + 0.2 PV 0.5% viscosity reducer + 0.2 PV 2000 mg/L oil displacement agent
40.05 PV plugging agent + 0.23 PV 2000 mg/L oil displacement agent + 0.23 PV 0.5% viscosity reducer
Alternating injection of small segments50.1 PV plugging agent + 0.04 PV 2000 mg/L oil displacement agent + 0.01 PV 0.5% viscosity reducer, alternating eight times
60.1 PV plugging agent + 0.03 PV 2000 mg/L oil displacement agent + 0.02 PV 0.5% viscosity reducer, alternating eight times
70.1 PV plugging agent + 0.01 PV 2000 mg/L oil displacement agent + 0.04 PV 0.5% viscosity reducer, alternating eight times
80.1 PV plugging agent + 0.03 PV 1500 mg/L oil displacement agent + 0.02 PV 0.5% viscosity reducer, alternating eight times
90.1 PV plugging agent + 0.03 PV 2500 mg/L oil displacement agent + 0.02 PV 0.5% viscosity reducer, alternating eight times
100.1 PV plugging agent + 0.03 PV 2000 mg/L oil displacement agent + 0.02 PV 0.25% viscosity reducer, alternating eight times
110.1 PV plugging agent + 0.03 PV 2000 mg/L oil displacement agent + 0.02 PV 0.75% viscosity reducer, alternating eight times
Table 6. Parameters of two-pipe models.
SchemePore Volume in High-Permeability Pipe
mL
Porosity in High-Permeability Pipe
%
Pore Volume in Low-Permeability Pipe
mL
Porosity in Low-Permeability Pipe
%
Total Pore Volume
mL
Permeability in High-Permeability Pipe
10−3 µm2
Permeability in Low-Permeability Pipe
10−3 µm2
1106.5336.1989.1130.27195.6430101020
2104.0935.3689.9630.56194.052990990
3102.1834.7191.9331.23194.112950970
4108.0936.7292.8531.54200.942970990
5103.2135.0692.4931.42195.7030001020
697.8833.2588.8430.18186.7230101010
799.7033.8792.0231.26191.732970980
8102.0934.6889.4630.39191.552980980
999.0933.6690.3430.69189.4330201000
10107.0936.3890.8730.87197.9729901010
11101.6534.5392.1731.31193.8229851000
mean deviation16.0313.882.660.911.250.432.86
relative mean deviation
%
0.541.392.592.591.381.381.47
Table 7. Displacement characteristics of different slug size ratios.
Slug Size RatioMaximum Liquid
Production Percentage in
Low-Permeability Layer
%
Minimum Liquid
Production Percentage in
High-Permeability Layer
%
Maximum Liquid
Production Ratio
Liquid Production
Reverse Duration
PV
Minimum Water
Cut in Low-Permeability
Layer
%
Minimum Water
Cut in High-Permeability
Layer
%
Enhanced Oil Recovery
%
8:271.628.42.50.1739.256.426.3
6:467.232.82.00.2237.652.327.2
2:861.039.01.60.2035.557.125.6
Table 8. Experimental results of different chemical agent concentrations.
Concentration of PAMDosage of PAMConcentration of VRDosage of VRDosage of PAEquivalent PolymerEnhanced Oil
Recovery
Oil
Production Increment
OPIEP
mg/Lg%ggg%Gt/t
15000.770.51.540.292.0124.849.1624.5
20001.010.51.500.282.2227.256.0725.3
25001.270.51.520.292.4928.357.8223.2
20001.060.250.790.301.8625.142.7323.0
20001.030.752.330.292.7528.156.1320.4
Disclaimer/Publisher’s Note: The statements, opinions and data contained in all publications are solely those of the individual author(s) and contributor(s) and not of MDPI and/or the editor(s). MDPI and/or the editor(s) disclaim responsibility for any injury to people or property resulting from any ideas, methods, instructions or products referred to in the content.