Article

Thermo-Economic Optimization and Resilience Analysis of Low-GWP Zeotropic Mixtures for Low-Enthalpy Geothermal Power Generation


by
Felix Donate Sánchez
,
Carmen Mata Montes
and
Javier Barba Salvador
*
Campus de Excelencia Internacional en Energía y Medioambiente, Escuela de Ingeniería Minera e Industrial de Almadén, Universidad de Castilla-La Mancha, Plaza Manuel Meca, s/n, 13400 Almadén, Ciudad Real, Spain
*
Author to whom correspondence should be addressed.
Energies 2026, 19(7), 1725; https://doi.org/10.3390/en19071725
Submission received: 9 March 2026 / Revised: 26 March 2026 / Accepted: 28 March 2026 / Published: 1 April 2026
(This article belongs to the Special Issue Challenges and Research Trends of Integrated Zero-Carbon Power Plant)

Abstract

The efficient recovery of low-enthalpy geothermal resources ( T 150 °C) faces significant thermodynamic limitations due to thermal mismatch in evaporators when pure fluids are utilized. This study investigates low-GWP zeotropic mixtures (Pentane/Isobutane), optimized using the NSGA-II algorithm, to enhance both the efficiency and operational resilience of Organic Rankine Cycles (ORCs). The isothermal behavior of conventional fluids limits exergy recovery and increases the Levelized Cost of Energy (LCOE). To address this, an advanced simulation tool, “ORC Master Suite”, was developed and validated against recent literature. Exergetic efficiency and LCOE were simultaneously optimized under strict Pinch Point constraints. Results show that the low-GWP zeotropic mixture of Pentane/Isobutane (70/30% w/w) achieves a 15–25% increase in exergetic efficiency compared to pure fluids, mainly due to the temperature glide, which reduces irreversibilities. Despite the increase in required heat transfer area and the strict capital expenditure penalties associated with ATEX safety protocols for highly flammable hydrocarbons, the LCOE remained competitive against the reference fluid. Overall, low-GWP zeotropic mixtures not only improve thermodynamic performance but also exhibit higher operational resilience to geothermal source fluctuations, making them a promising and sustainable alternative for future geothermal power plants.

1. Introduction

The transition toward a decarbonized energy system requires integrating renewable energy sources capable of providing baseload power and grid stability [1]. Unlike the intermittent nature of solar and wind energy, geothermal energy offers continuous availability [2,3]. Nevertheless, a significant portion of the global potential corresponds to low-enthalpy resources (source temperatures T g e o 150   ° C ), which have been historically underutilized due to thermodynamic efficiency limitations [4,5].
For their exploitation, the Organic Rankine Cycle (ORC) is the dominant technology due to its technical simplicity and economic competitiveness compared to alternatives such as the Kalina cycle [6,7]. In these binary plants, brine transfers heat to an organic fluid to generate power [5,8]. The selection of the working fluid is critical, as it directly determines the energy and exergy efficiency, as well as the system’s net power output [9,10].
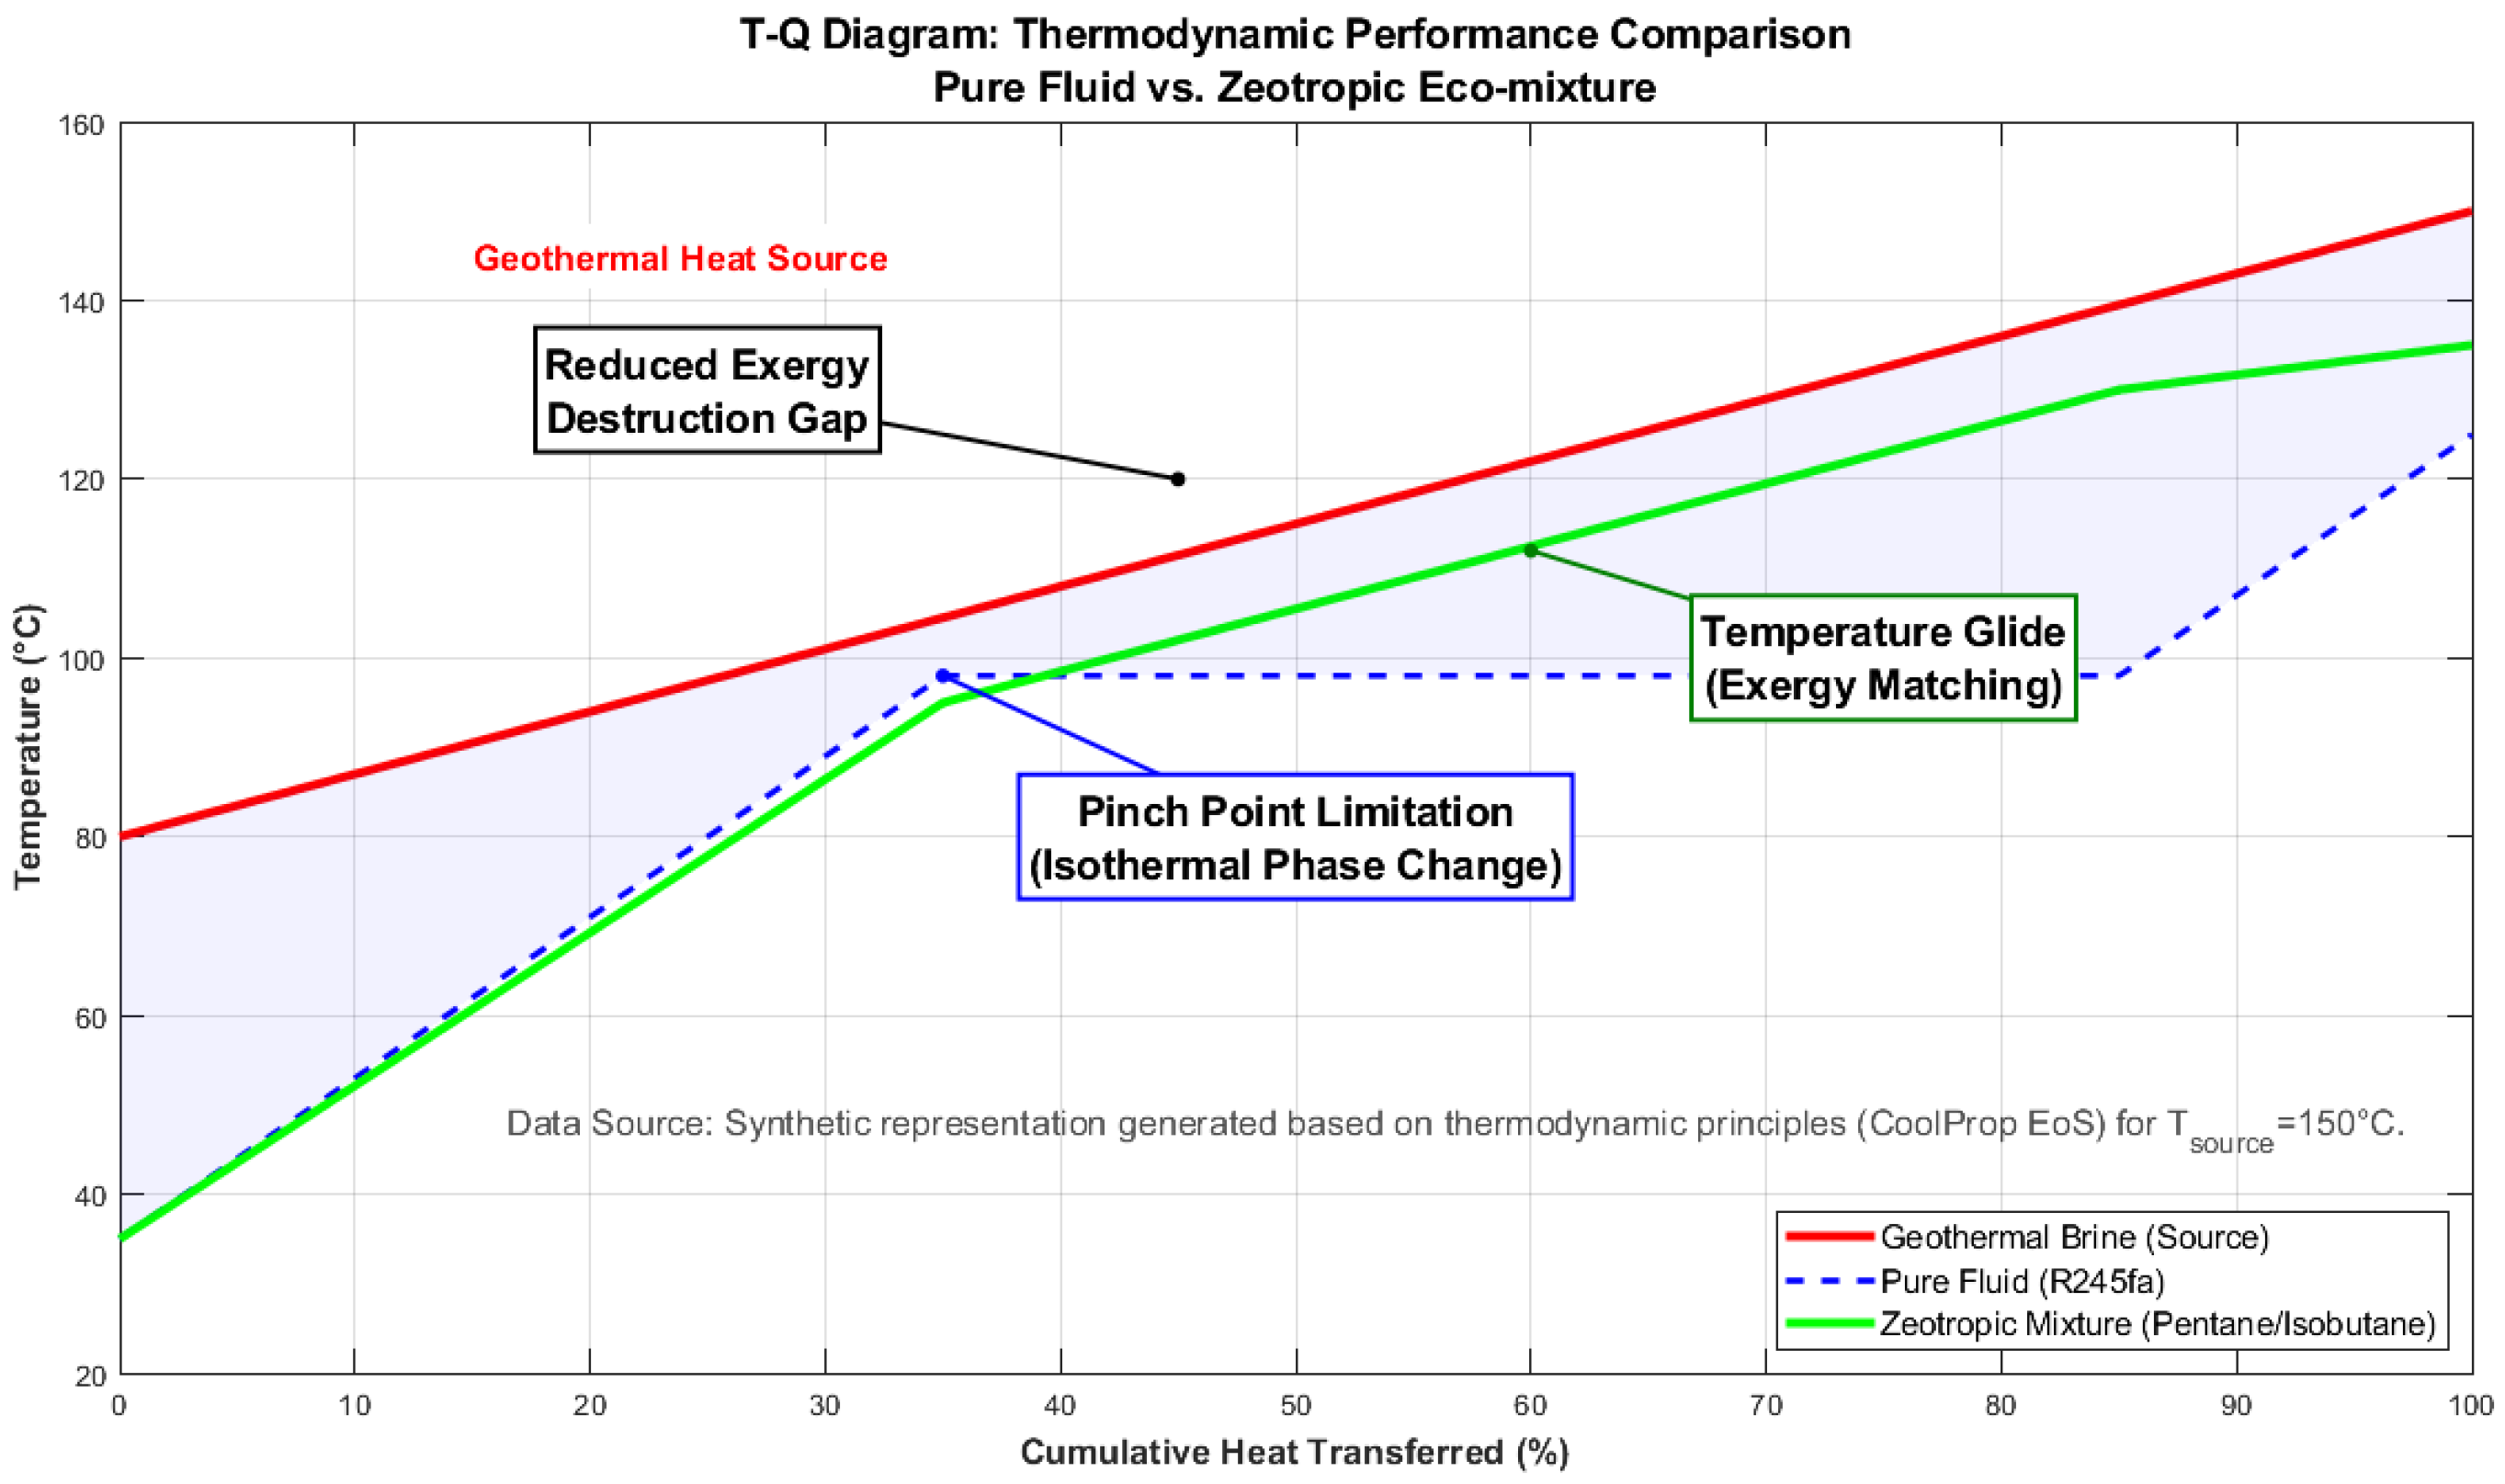
Despite the technological maturity of conventional ORC systems, the use of pure fluids (such as R245fa or R134a) presents an intrinsic thermodynamic limitation: isothermal phase change [11,12]. This characteristic contrasts with the linear cooling profile of the geothermal source, generating a thermal mismatch and a pinch point that restricts heat extraction [12]. The resulting divergence between the temperature curves, according to the Second Law of Thermodynamics, leads to significant exergy destruction within the evaporator [12,13]. In practical terms, this loss of energy quality not only limits the overall thermal efficiency but also increases the Levelized Cost of Energy (LCOE) [14]. This challenge is particularly critical in low-enthalpy applications, making the development of advanced solutions beyond pure fluids essential to improve energy conversion and economic viability [15]. Figure 1 presents a conceptual comparison of thermal behavior through a Temperature-Heat (T-Q) diagram between a conventional pure fluid (R245fa) and the optimized zeotropic mixture (Pentane/Isobutane) [16]. The temperature glide enables improved thermal coupling (glide matching), thereby minimising exergy destruction compared to conventional isothermal evaporation [9,11]. This reduction in irreversibilities optimizes heat transfer, resulting in a significant increase in the cycle’s net power output [9].
To overcome the inefficiencies of pure fluids, recent research has focused on the use of zeotropic mixtures [9,11], which exhibit a non-isothermal phase change characterized by a temperature glide. This phenomenon allows the thermal profile of the working fluid to better match the cooling profile of the geothermal source (glide matching) [9,17], significantly reducing irreversibilities and maximizing exergy recovery [7,9,16]. Furthermore, in the context of strict environmental regulations, such as the F-Gas regulation, the replacement of high-GWP refrigerants, such as R245fa (GWP > 800) [9], is required.
This study investigates the use of low-GWP zeotropic mixtures, specifically binary combinations of Hydrocarbons (HC) or Hydrofluoroolefins (HFO) [7,9], which combine the thermodynamic advantages of temperature glide with minimal environmental impact—ultra-low GWP (<10) and zero ozone depletion potential (ODP), in line with strict sustainability standards, aligning with the most demanding sustainability standards [18,19]. In addition, these mixtures improve system adaptability, facilitating optimal and simultaneous heat transfer with both the heat source and the thermal sink [9,20].
Although the optimization of organic fluids has been extensively studied [7,21], current literature lacks approaches that integrate multi-objective optimization, sustainability, and operational resilience [7,22]. Table 1 synthesizes the key contributions that underpin the methodology of this work, demonstrating the necessary evolution from static analyses toward dynamic approaches [21]. This perspective enables the integration of variability in operating conditions, achieving a more precise evaluation of the actual performance of zeotropic mixtures in the system [9].
A critical aspect rarely addressed in the literature is that geothermal plants frequently operate off-design due to seasonal fluctuations in ambient temperature or the thermal degradation of the well over time [22]. In this context, the concept of “Thermodynamic Resilience” is introduced as the system’s ability to maintain despite variations in external conditions. It is hypothesized that the temperature glide of zeotropic mixtures can act as a passive buffer against thermal disturbances, allowing the heat transfer profile to adapt naturally to variations in the thermal gradient of the source without the need for complex control systems [9,11,23,24].
Table 1. Critical literature review on ORC optimization and zeotropic mixtures.
Author/YearApplication and Heat SourceWorking FluidsMain MethodologyKey Finding/Detected Limitation
Chys et al. (2012) [25]Basic ORC.
Source: 150 °C and 250 °C.
Zeotropic Mixtures (HCs and Siloxanes).Thermodynamic analysis and mixture selection.Thermodynamic Pillar: Establishes that temperature glide aligned with the source reduces irreversibilities. Reports a 16% efficiency increase at 150 °C. Limitation: Static analysis without costs.
Imran et al. (2014) [26]Waste Heat Recovery (WHR).
Source: 150 °C (Air).
Pure Fluids (R245fa and similar).Multi-objective optimization (NSGA-II).Numerical Pillar: Validates NSGA-II as the robust algorithm of choice for thermo-economic design (Efficiency vs. SIC). Limitation: Restricted to pure fluids and design point.
Zare (2015) [27]Binary Geothermal Plants. Source: Low enthalpy.Pure Fluids (R245fa, Pentane, R152a).Comparative exergo-economic analysis.Economic Pillar: Demonstrates that the thermodynamically superior system (ORC-IHE) is not always the most profitable. Simple ORC usually has lower LCOE. Limitation: Does not explore mixture potential.
Andreasen et al. (2021) [18]Low-temperature Geothermal.
Source: 135 °C.
HC and HFO mixtures (Propane, Isobutane, R1234yf).Net Present Value (NPV) maximization.Techno-economic Viability: Confirms that mixtures can improve profitability if heat exchangers are correctly designed. Introduces low-GWP fluids. Limitation: Focus on nominal design.
Wang et al. (2022) [28]Low-pressure Steam Recovery.
Source: ~140 °C.
Pure Fluids (R245fa).Parametric optimization of operating variables.Operational Optimization: Identifies that increasing evaporation temperature improves global performance but penalizes cost due to the increase in UA area. Limitation: Mono-fluid analysis.
Gonidaki et al. (2025) [Solar] [19]Solar ORC with Storage. Source: Variable (Solar).Zeotropic Mixture R601/R600 (Pentane/Butane).Dynamic simulation and parametric analysis.Dynamic Validation: The mixture increased annual electricity production by 3.7% compared to pure fluids, outperforming them in all daily scenarios (winter/summer). Gap: Applied to solar, not constant geothermal.
Miao et al. (2025) [29]4 kW ORC Prototype. Source: Variable.Zeotropic Mixture R236fa/R123 with active concentration regulation.Dynamic modeling and evaluation of control strategies (evaporation pressure vs. constant power output).Control Validation: Demonstrates that concentration regulation allows maintaining constant power under source variations. Gap: Requires complex and costly control systems.
Unlike prior literature focusing on static single-objective optimizations [21], this study contributes an integrated methodology that combines: (i) the use of low-GWP zeotropic mixtures (Pentane/Isobutane) as a sustainable alternative to R245fa [9,18,19]; (ii) multi-objective optimization (NSGA-II) that accounts for the cost penalty associated with heat exchanger area; and (iii) passive resilience analysis under geothermal well degradation (from 150 °C to 130 °C) [30,31]. This research shows that the optimized mixture acts as a “thermodynamic buffer” [9], maintaining operational stability without requiring complex control systems [29], thereby providing a robust solution for real-world geothermal power plants [31].
This study investigates geothermal power generation at 150 °C using low-GWP zeotropic mixtures (Pentane/Isobutane) [9,19], integrating NSGA-II evolutionary optimization with passive resilience analysis [19]. In contrast to active control strategies [29], this work demonstrates that the optimized mixture has an intrinsic capacity to buffer thermal disturbances, ensuring operational stability without resorting to complex instrumentation [7]. This contribution is relevant because, despite existing advances, the literature lacks in-depth analyses of the off-design behavior of zeotropic mixtures [1,22,29]. This is a critical factor, as real geothermal fluctuations can significantly degrade the performance of static designs [7,30,31]. To address this gap, this study presents a methodology that combines multi-objective optimization (NSGA-II) of the Pentane/Isobutane mixture to balance efficiency and Levelized Cost of Energy (LCOE) [9,26], validated through comparison with the literature, with a resilience analysis quantifying its ability to buffer disturbances more effectively than pure fluids [7,29,30]. The selection of these hydrocarbons is justified by their sustainable profile (ODP = 0, GWP < 5) compared to synthetic refrigerants [32]. Their use in binary mixtures also improves net power output and reduces irreversibilities through improved thermal matching with the heat source [9,18,33].

2. Methodology and Modeling

The conceptual design and optimization of the geothermal ORC plant were carried out using a modular simulation platform, ‘ORC Master Suite’ [9], developed in the MATLAB R2024b. This tool integrates rigorous thermodynamic models coupled with the CoolProp (v6.8.0) fluid properties database, enabling the precise evaluation of zeotropic mixtures through the high-precision Helmholtz energy functional equation of state [9]. The software architecture allows for the iterative resolution of mass and energy balances for each component, ensuring convergence of thermophysical properties throughout the cycle [9]. The methodology is structured into five sequential blocks: (i) System Description and Design Parameters; (ii) Fluid Selection and Cycle Definition; (iii) Discretized Thermodynamic Modeling; (iv) Economic Model; and (v) Multi-objective Optimization Strategy using evolutionary algorithms (NSGA-II) [9,18].

2.1. System Description and Design Parameters

The system under study is a basic subcritical Organic Rankine Cycle configuration powered by a low-enthalpy liquid-phase geothermal source (brine). For the mathematical model, the following hypotheses and boundary conditions are adopted, as summarized in Table 2, and have been validated in the recent literature to ensure the representativeness of the results [5,9,34].

2.2. Fluid Selection and Cycle Definition

To evaluate the potential for improvement in energy conversion from low-temperature sources, this study presents a technical comparison between the use of conventional refrigerants and zeotropic mixtures of natural hydrocarbons [7,9,35]. R245fa has been selected as the baseline fluid due to its historically widespread implementation in Organic Rankine Cycles (ORCs). Against this standard, a binary mixture composed of Pentane and Isobutane (70/30% w/w) is evaluated. The fundamental rationale for adopting such a blend rather than a single-component fluid is to optimise heat transfer. Specifically, the selection of the binary Pentane/Isobutane mixture is based on three main primary engineering criteria [9]:
  • Sustainability: It has a negligible Global Warming Potential (GWP < 5) and zero Ozone Depletion Potential (ODP), ensuring full compliance with current EU F-Gas regulations [7,9,19,35].
  • Safety: Classified as A3 (Highly Flammable). Although its industrial deployment necessitates strict ATEX protocols, its application in power generation is technologically mature [7,9,36,37].
  • Thermodynamics: The zeotropic blend of these specific hydrocarbons produces a substantial temperature glide, which directly mitigates exergy destruction within the evaporator [9,11,18,36,38,39]. This advantage arises because the variable temperature profile during the phase transition closely mimics the cooling slope of the heat source, a physical synergy impossible to achieve with constant-temperature evaporation of pure fluids [9].
Furthermore, the specific choice of the Pentane/Isobutane pair over other mainstream low-GWP hydrocarbon mixtures (such as Propane/Isobutane or Pentane/n-Butane) is strictly dictated by the boundary conditions of the 150 °C geothermal source [10,19]. Mixtures containing Propane T c r i t 96.7 ° [10] are excessively volatile for this temperature range; their use would force the subcritical ORC to operate at excessively high evaporation pressures, significantly increasing the mechanical thickness and capital cost of the equipment [19]. Conversely, comparing Isobutane to normal Butane, Isobutane exhibits a lower boiling point [10]. When blended with Pentane, this larger volatility gap generates a more pronounced and flexible maximum temperature glide (up to ~12.4 K) [10,19]. This wider glide is thermodynamically essential to optimally match the deep cooling profile of the geothermal brine (from 150 °C down to 80 °C), while maintaining moderate operating pressures that keep the system’s Levelized Cost of Energy (LCOE) economically competitive [10,19].
A rigorous technical evaluation of the proposed binary mixture against the conventional baseline requires a comprehensive assessment of their respective thermodynamic and ecological profiles [9]. Consequently, the primary chemical characteristics of R245fa, along with the individual constituents of the zeotropic blend, are compiled in Table 3. This dataset, which encompasses critical point variables, environmental footprint metrics, and ASHRAE 34 safety designations [7], establishes the foundational constraints for modeling the plant’s thermal performance and environmental viability [9].
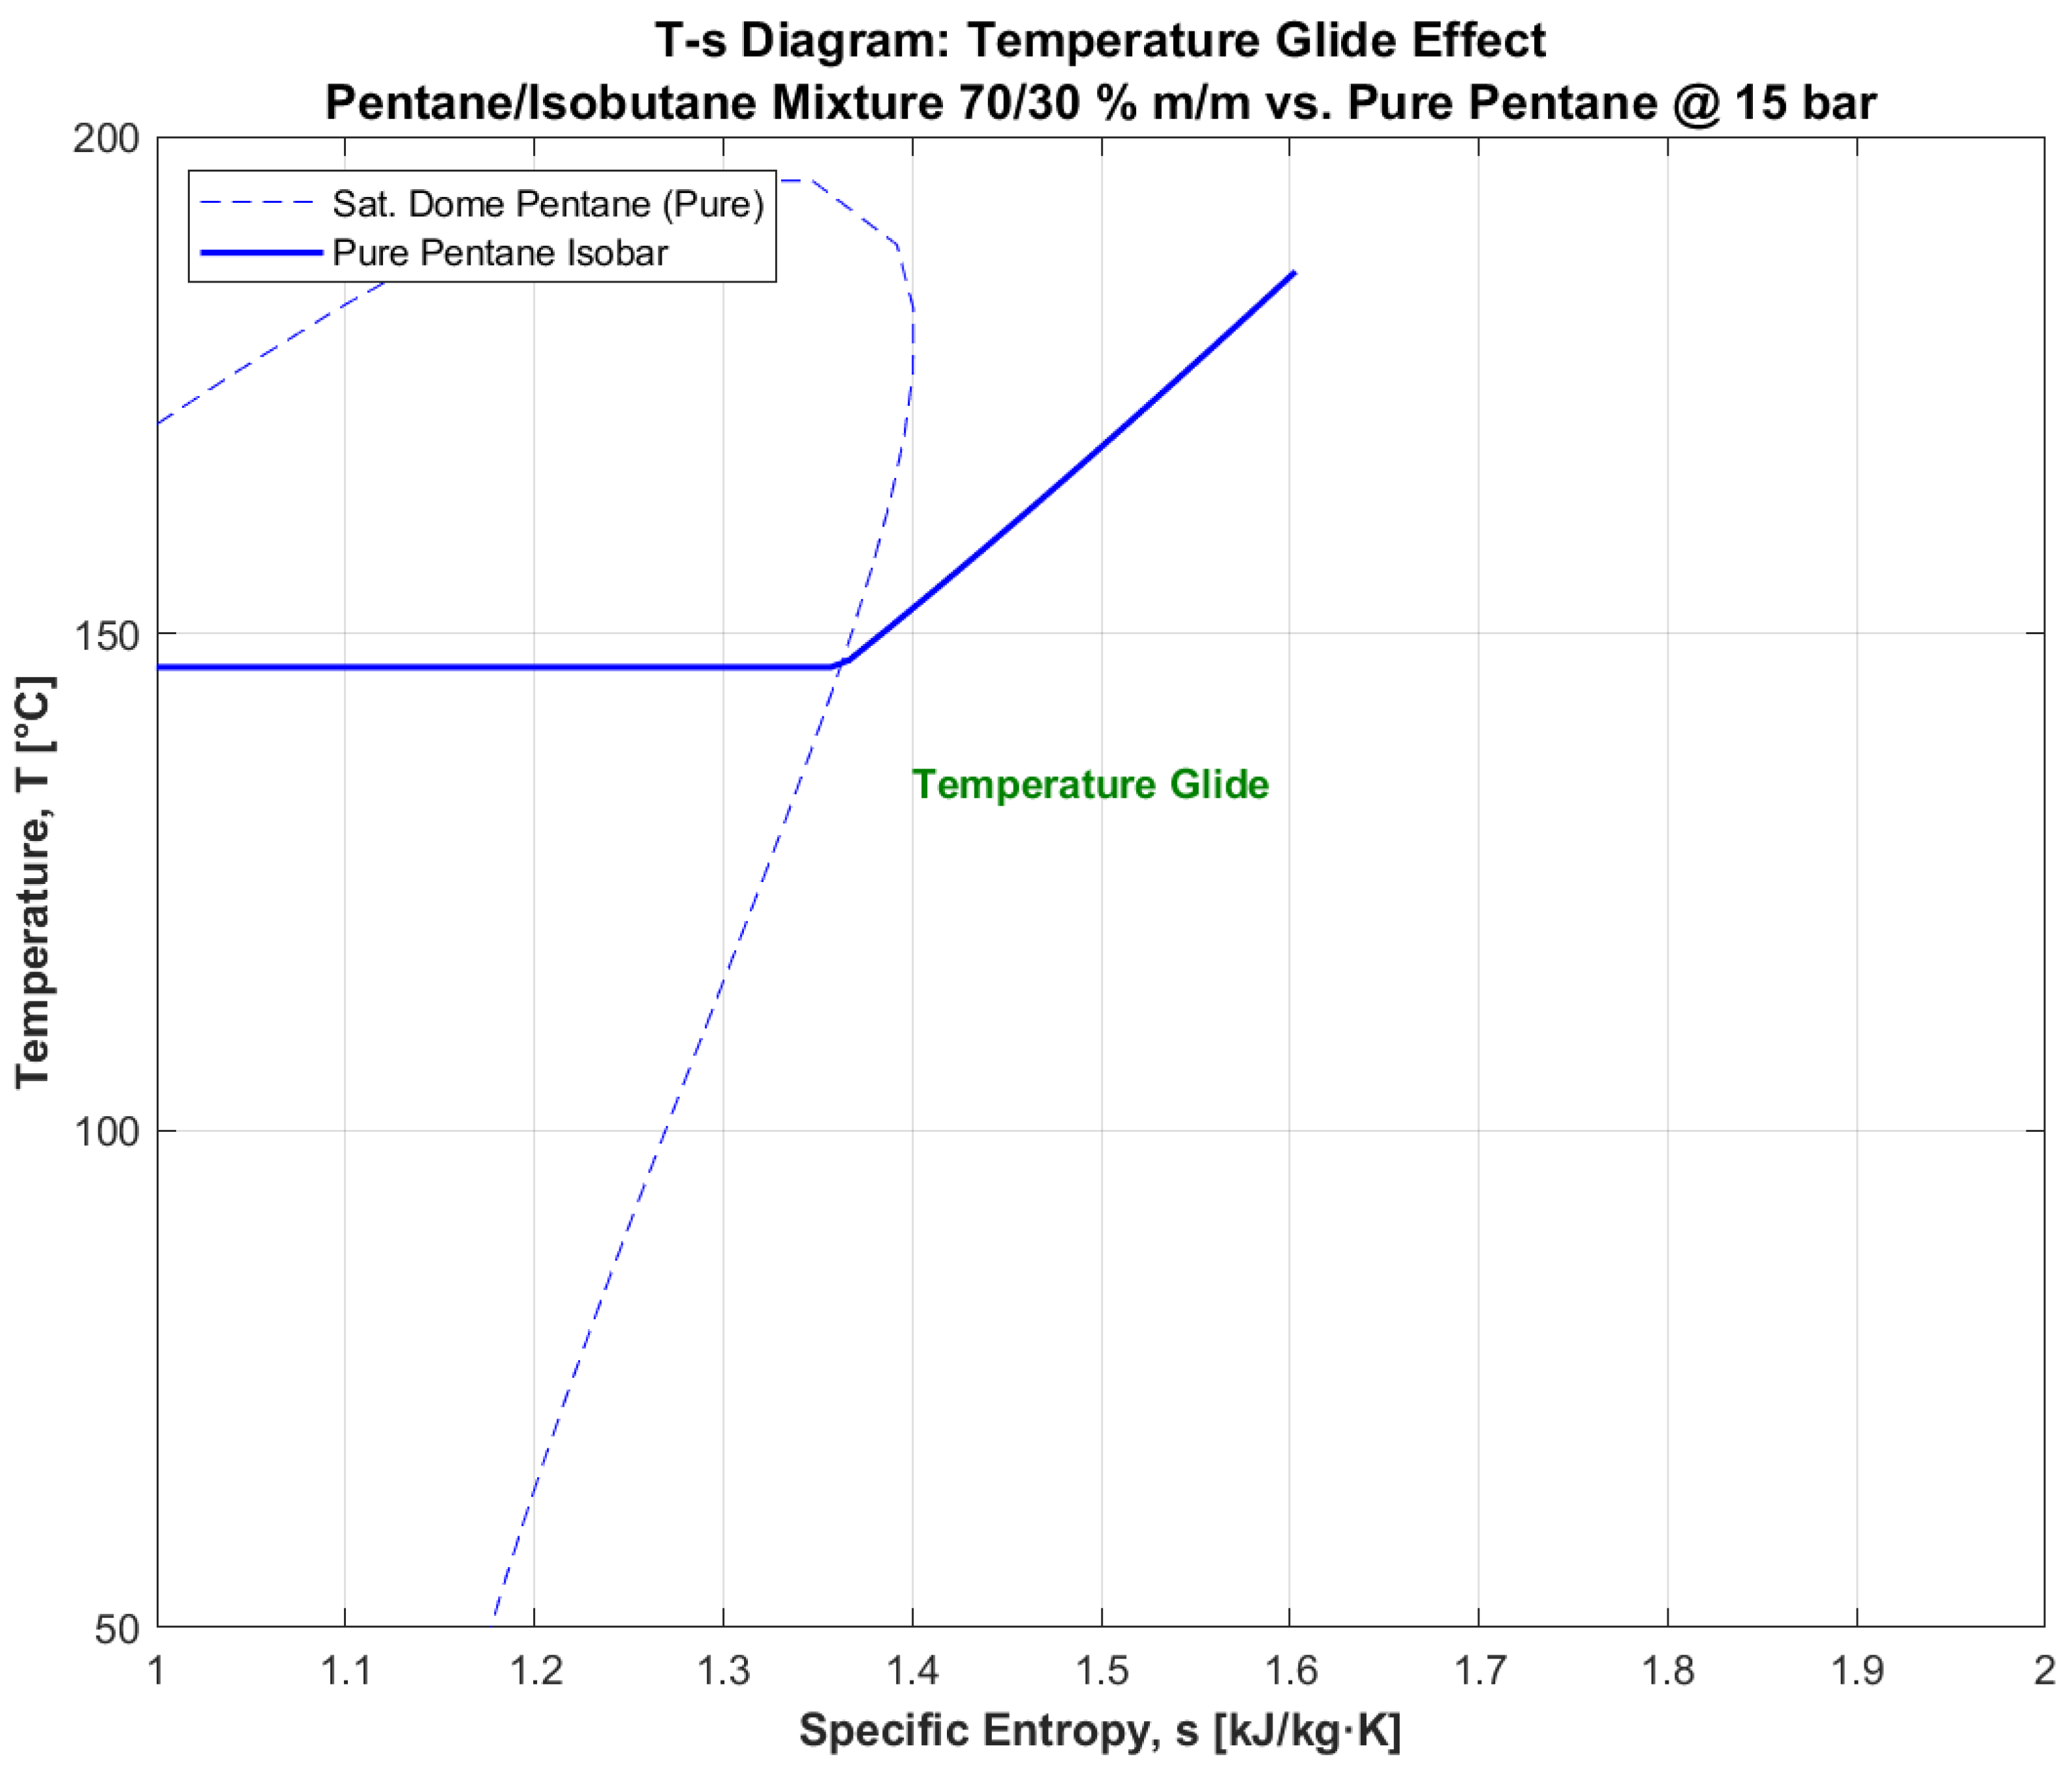
To analyze the phase change phenomenology and the impact of the temperature glide, Figure 2 presents a comparative Temperature–entropy (T-s) diagram between pure Pentane and the optimized mixture at a pressure of 15 bar [25]. This representation shows how the zeotropic mixture breaks the horizontality of the saturation lines characteristic of pure fluids, introducing a thermal slope during evaporation [9,25]. This behavior is what enables glide matching with the geothermal source, significantly reducing the exergy destruction area compared to the isothermal process for the pure fluid [9,13].

2.3. Discretized Thermodynamic Modeling

The model is governed by the fundamental principles of conservation of mass and energy, which ensure the physical feasibility of each thermodynamic state. However, to evaluate the real efficiency and the location of irreversibilities, a comprehensive exergy balance analysis is performed [40,41]. While the first law quantifies heat exchange, exergy enables the identification of work potential destruction due to thermal mismatches in heat exchangers. Given the non-linearity of phase change in zeotropic mixtures, this calculation goes beyond end-point analysis through discretization into zones [42,43,44], enabling the evaluation of how the mixture’s glide optimizes heat transfer and reduces exergy losses compared to pure fluids [45].
It should be noted that frictional pressure drops within the heat exchangers and connecting pipelines were neglected in this macroscopic optimization, assuming strictly isobaric phase changes [42,43,44]. While the optimized zeotropic mixture requires a 28% larger heat exchange area—which inherently increases the frictional pressure drop on the working fluid side—accurately calculating these losses requires detailed geometric specifications that fall outside the scope of preliminary thermo-economic sizing [9,18]. Mathematically, this simplification does not skew the comparative optimization results [9]. Organic Rankine Cycles are characterized by a very low Back Work Ratio [7]. Literature indicates that typical pressure drops in ORC evaporators and condensers induce only a marginal increase in feed pump power consumption (typically of the gross turbine power [7,35]). Even assuming a proportionally higher pressure drop penalty for the zeotropic mixture due to its larger required area, the extra pumping work represents a penalty of only a few kilowatts [19]. This minor parasitic loss is vastly overshadowed by the substantial thermodynamic power gain generated by the glide-matching effect of the mixture [9,11], ensuring that the comparative Levelized Cost of Energy trends remain robust and entirely valid [9,18].

2.3.1. Evaporator Discretization

Due to the non-linearity of temperature profiles in zeotropic mixtures during phase change (glide), lumped parameter models are insufficient to detect the internal Pinch Point. To accurately capture this phenomenon, the heat exchanger is numerically discretized into constant enthalpy segments [42,43,44,46].
In each segment i , the local thermal approach constraint is verified using Equation (1):
T g e o i T w f i Δ T p p , m i n i 1 , N
where T g e o i and T w f i represent the temperatures of the source and the working fluid at node i , and Δ T p p , m i n is the minimum differential (5 °C). Δ T p p , m i n denotes the minimum local temperature difference in segment i [41,44].
Justification of the Discretization: The non-linear nature of temperature profiles in zeotropic mixtures during phase change (glide) makes simplified lumped-parameter models insufficient to ensure the thermal feasibility of the cycle. To accurately detect the internal Pinch Point and correctly quantify exergy destruction, the mathematical model divides the heat exchanger into N constant-enthalpy control volumes. In each of these segments, strict compliance with the thermal approach constraint (Equation (1)) is verified. To determine the optimal discretization level that balances thermodynamic accuracy with computational cost, a grid independence study was conducted using a computer with an AMD Ryzen 3 processor @ 2.5 GHz and 19.6 GB of RAM. The analysis evaluated the sensitivity of the generated net power and CPU time relative to the number of nodes (N), yielding the results shown in Table 4.
Starting from N = 50, the variation in net power relative to the finest solution is less than 0.042%, ensuring that the discretization error is negligible. Since the evolutionary algorithm requires approximately 5.000 evaluations, the use of N = 50 allows the optimization to be performed in an efficient timeframe (approx. 1.5 h on the aforementioned hardware) without compromising thermodynamic accuracy [43,44,47].
To accurately determine the required physical size of the heat exchangers for the economic evaluation, the overall heat transfer coefficient (U) must be defined. For the reference pure fluid, standard empirical values typical of shell-and-tube ORC applications were adopted: 1.0 kW/m2K for the evaporator and 0.8 kW/m2K for the condenser [7,35].
However, for zeotropic mixtures, the value undergoes significant degradation during phase change compared to pure fluids [18,19]. This degradation is primarily caused by mass transfer resistance at the liquid-vapor interface [18]. Because the more volatile component evaporates or condenses faster than the heavier one, a local concentration gradient forms [9]. This gradient acts as an additional thermal barrier, reducing the convective heat transfer coefficient of the two-phase film [18].
The magnitude of this degradation is strongly correlated with the mixture composition, peaking at intermediate mass fractions where the temperature glide is maximized [9,18]. To rigorously integrate this physical limitation into our macroscopic sizing model, an empirical degradation penalty proportional to the temperature glide was applied [9,18]. For the optimized Pentane/Isobutane mixture, a conservative 25% degradation penalty was applied to the pure fluid’s two-phase values [9,18]. This penalization mathematically dictates a lower effective, compelling the model to calculate a larger required heat exchange area via the discretized formulation [18]. This ensures that the “area penalty” inherent to zeotropic mixtures is realistically captured in the subsequent Levelized Cost of Energy calculations [9,18].

2.3.2. Exergy Analysis

The exergetic efficiency of the cycle η e x is evaluated by considering the specific physical exergy ( ε i ) of the geothermal resource through Equations (2) and (3), which relates the net work produced W n e t ˙ to the exergy change involved:
ε i = h i h 0 T 0 s i s 0
η e x = W n e t ˙ m g e o ˙ ε g e o , i n ε g e o , o u t l i m i t
where ε i denotes the specific physical exergy of the fluid (kJ/kg) at a given state i , determined as a function of enthalpy h and entropy s relative to the properties of the reference state h 0 , s 0 . Regarding the overall system efficiency, η e x relates the generated net power W n e t ˙ to the actual exergy availability of the resource. The term m g e o ˙ represents the mass flow rate of the geothermal brine (kg/s), while ε g e o , i n and ε g e o , o u t l i m i t correspond to the specific exergy of the source at the plant inlet and at the reinjection limit condition, respectively. Finally, the dead state has been established under standard ambient conditions, defining T 0 = 298.15   K (25 °C) and P 0 = 1.013 bar [5,10].

2.4. Economic Model (Equipment Costs)

The economic evaluation is based on the Levelized Cost of Energy (LCOE) [18,48], calculated from the Total Investment Cost T C I of the equipment [9,34]. The modified modular method by Guthrie, as updated by Turton et al. [10,18,34,48], is employed; this method correlates the base cost of each component with its respective heat exchange area or power capacity [10,18]. The bare module cost ( C B M ) for each piece of equipment is calculated according to Equation (4) [10,18,48]:
C B M = C p , 0 · F B M = 10 K 1 + K 2 log 10 X + K 3 log 10 X 2 · B 1 + B 2 F M F P
Equation (4) breaks down the equipment cost into two primary segments: the base cost under standard conditions and the correction factors for materials and operating pressure.
  • C B M (Bare Module Cost): Represents the “bare module” cost. It encompasses not only the equipment purchase price but also the direct and indirect costs associated with its installation—including labor, piping, valves, instrumentation, and insulation—within the plant boundaries [18].
  • C p , 0 (Base Cost): This is the acquisition cost of the equipment operating under base conditions, specifically ambient pressure and carbon steel construction [18]. It is calculated using the following logarithmic expression:
    10 K 1 + K 2 log 10 X + K 3 log 10 X 2
  •   X (Parameter of Capacity): This is the physical variable defining the size of the equipment. For heat exchangers (evaporators and condensers), X represents the heat transfer area A   i n   m 2 . In turbomachinery (turbines and pumps), X represents the shaft power ( W ˙ e n   k W ) [10,18].
  • K 1 , K 2 , K 3 Empirical constants obtained from statistical regressions for different equipment types. These values define the cost curve as a function of size and are tabulated in Turton’s method [18].
  • F B M (Bare Module Factor): The multiplying factor that adjusts the base cost according to the technical reality of the system. It is defined as B 1 + B 2 F M F P [10,18]:
  • B 1 , B 2 : Constant coefficients depending on the equipment type (fixed for heat exchangers or turbines) [10,18].
  • F M (Material Factor): Correction factor for the material of construction. Since geothermal fluids can be corrosive and refrigerants require airtightness, materials such as stainless steel or special alloys are typically selected, which increases this factor [10,18].
  • F P (Pressure Factor): Pressure correction factor. Since the evaporator operates at high pressures in the ORC cycle, the wall thickness of the equipment must be greater, which increases the cost relative to the standard design [10,18].
Where X is the capacity parameter (Area in m 2 or Power in k W ). It should be noted that Turton’s coefficients are based on cost data from a reference year [10,18]. Costs are updated to the year 2025 using the CEPCI (Chemical Engineering Plant Cost Index) [10]. The sector-specific inflation index is applied using the following relationship:
C 2025 = C T u r t o n · CEPCI 2025 CEPCI 2001
where the CEPCI index reflects the evolution of prices for materials, labor, and energy within the process industry [10].
The Turton method coefficients K1, K2, K3 and FBM for each system parameter are summarized in Table 5.
Equation (6) defines the LCOE (Levelized Cost of Energy), which represents the average cost per unit of generated energy that allows for the recovery of all project costs (investment, operation, and maintenance) over its service life [10].
L C O E = T C I · C R F + c O & M 8000 · W n e t ˙ / kWh
where
  • T C I (Total Capital Investment): Represents the total investment required to construct the plant (including equipment, installation, engineering, and contingencies), following typical proportions in the chemical process industry [49,50], it is estimated at approximately €6 million.
  • C R F (Capital Recovery Factor): The factor that “annualizes” the initial investment. It converts a present capital value (TCI) into a series of equal annual payments over the n years of the plant’s service life [51].
  • c O & M : The Operation and Maintenance cost factor. It is expressed as an annual percentage of the TCI (for example, a 5% factor implies that annual maintenance expenses amount to 5% of the initial plant cost). A value of 5% is one of the most common parameters reported in the literature [48].
  • 8000: Represents the equivalent full-load operating hours per year (a standard for geothermal energy, which serves as baseload power).
  • W n e t ˙ : The net power generated by the plant in kilowatts (kW).
The discount rate (i) is the interest rate used to calculate the CRF via Equation (7); it represents the time value of money or the cost of capital. It indicates the minimum required return for the investment to be considered viable. In this case, assuming a rate of 5% ( i   =   0.05 ), which is the most common parameter in the literature [48], and a service life of n = 20 years, the resulting CRF is approximately 0.0802 [51].
C R F = i 1 + i n 1 + i n 1

2.5. Multi-Objective Optimization Strategy (NSGA-II)

Given the conflicting nature of the objectives (Efficiency vs. Cost), the NSGA-II (Non-dominated Sorting Genetic Algorithm II) was employed. This algorithm was executed using the gamultiobj function from the MATLAB Global Optimization Toolbox [26,43,52], which is widely recognized for its ability to preserve solution diversity along the Pareto Front [43,51,53]. This evolutionary algorithm enables the identification of a set of optimal solutions in which it is impossible to improve one objective without degrading the other, thereby facilitating the selection of the most suitable design point based on project priorities [9,22].

2.5.1. Problem Formulation

The optimization problem is defined by two opposing objective functions: maximizing exergetic efficiency ( η e x ) [40,41] and minimizing the Levelized Cost of Energy (LCOE) [18,48]. The search space is delimited by three decision variables whose ranges are defined by technical and economic feasibility criteria:
  • Evaporation Pressure ( P e v a p ) : Explored between 5 and 30 bar to ensure safe subcritical operation, avoiding thermal instabilities near the critical point [9,43].
  • Pentane Mass Fraction ( x p e n t ): Defined within the interval 0 , 1 to ensure effective zeotropic behavior and maximize the benefits of temperature glide compared to pure fluids [25,26].
  • Evaporator Pinch Point ( Δ T p p ): Bounded between 5 and 15 K. This range allows the NSGA-II algorithm to balance heat transfer enhancement with the economic constraint of avoiding excessive heat exchange areas, complying with industrial design standards for low-enthalpy Sources [25,26].

2.5.2. Algorithm Configuration

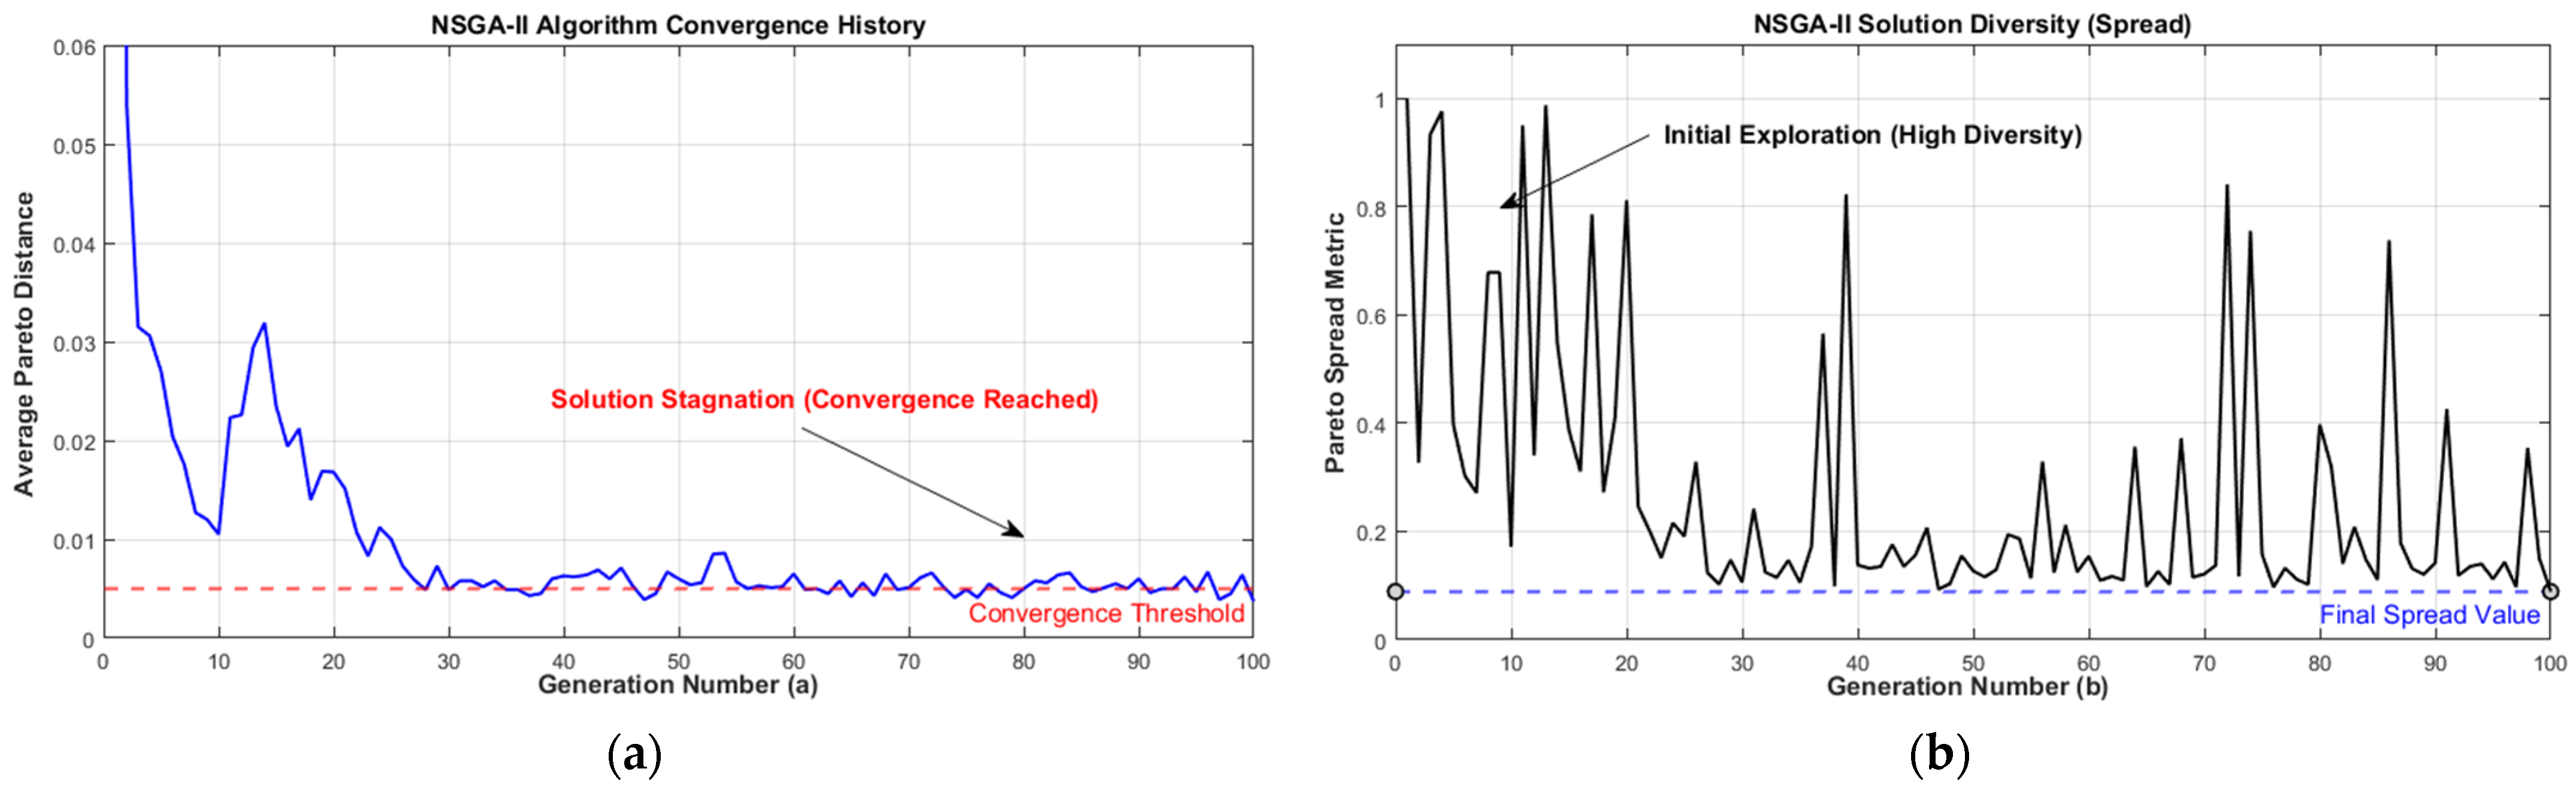
The algorithm was configured in MATLAB using the gamultiobj options detailed in Table 6, based on the convergence analysis conducted in several studies [26,51]. Figure 3 illustrates the convergence history of the optimization process, validating the numerical stability of the NSGA-II algorithm [54], for the selected configuration of 100 generations. In Figure 3a, the evolution of the Average Pareto Distance is shown [54], with a sharp exponential decline during the first 30 generations, indicating that the initial population rapidly identifies high-fitness regions. From generation 60 onward, the curve reaches a plateau with negligible residual variations, confirming that the population has satisfactorily converged to the non-dominated solution frontier. Additionally, Figure 3b displays the Spread metric [55], which evaluates the diversity and extent of the Pareto front [56,57]. The stabilization of this indicator after generation 50 [55] ensures that the algorithm has not only identified optimal solutions [54] but also that these uniformly cover the full range of tradeoffs between net power and LCOE, providing a diverse and robust distribution of solutions for the techno-economic analysis [55,56,57].
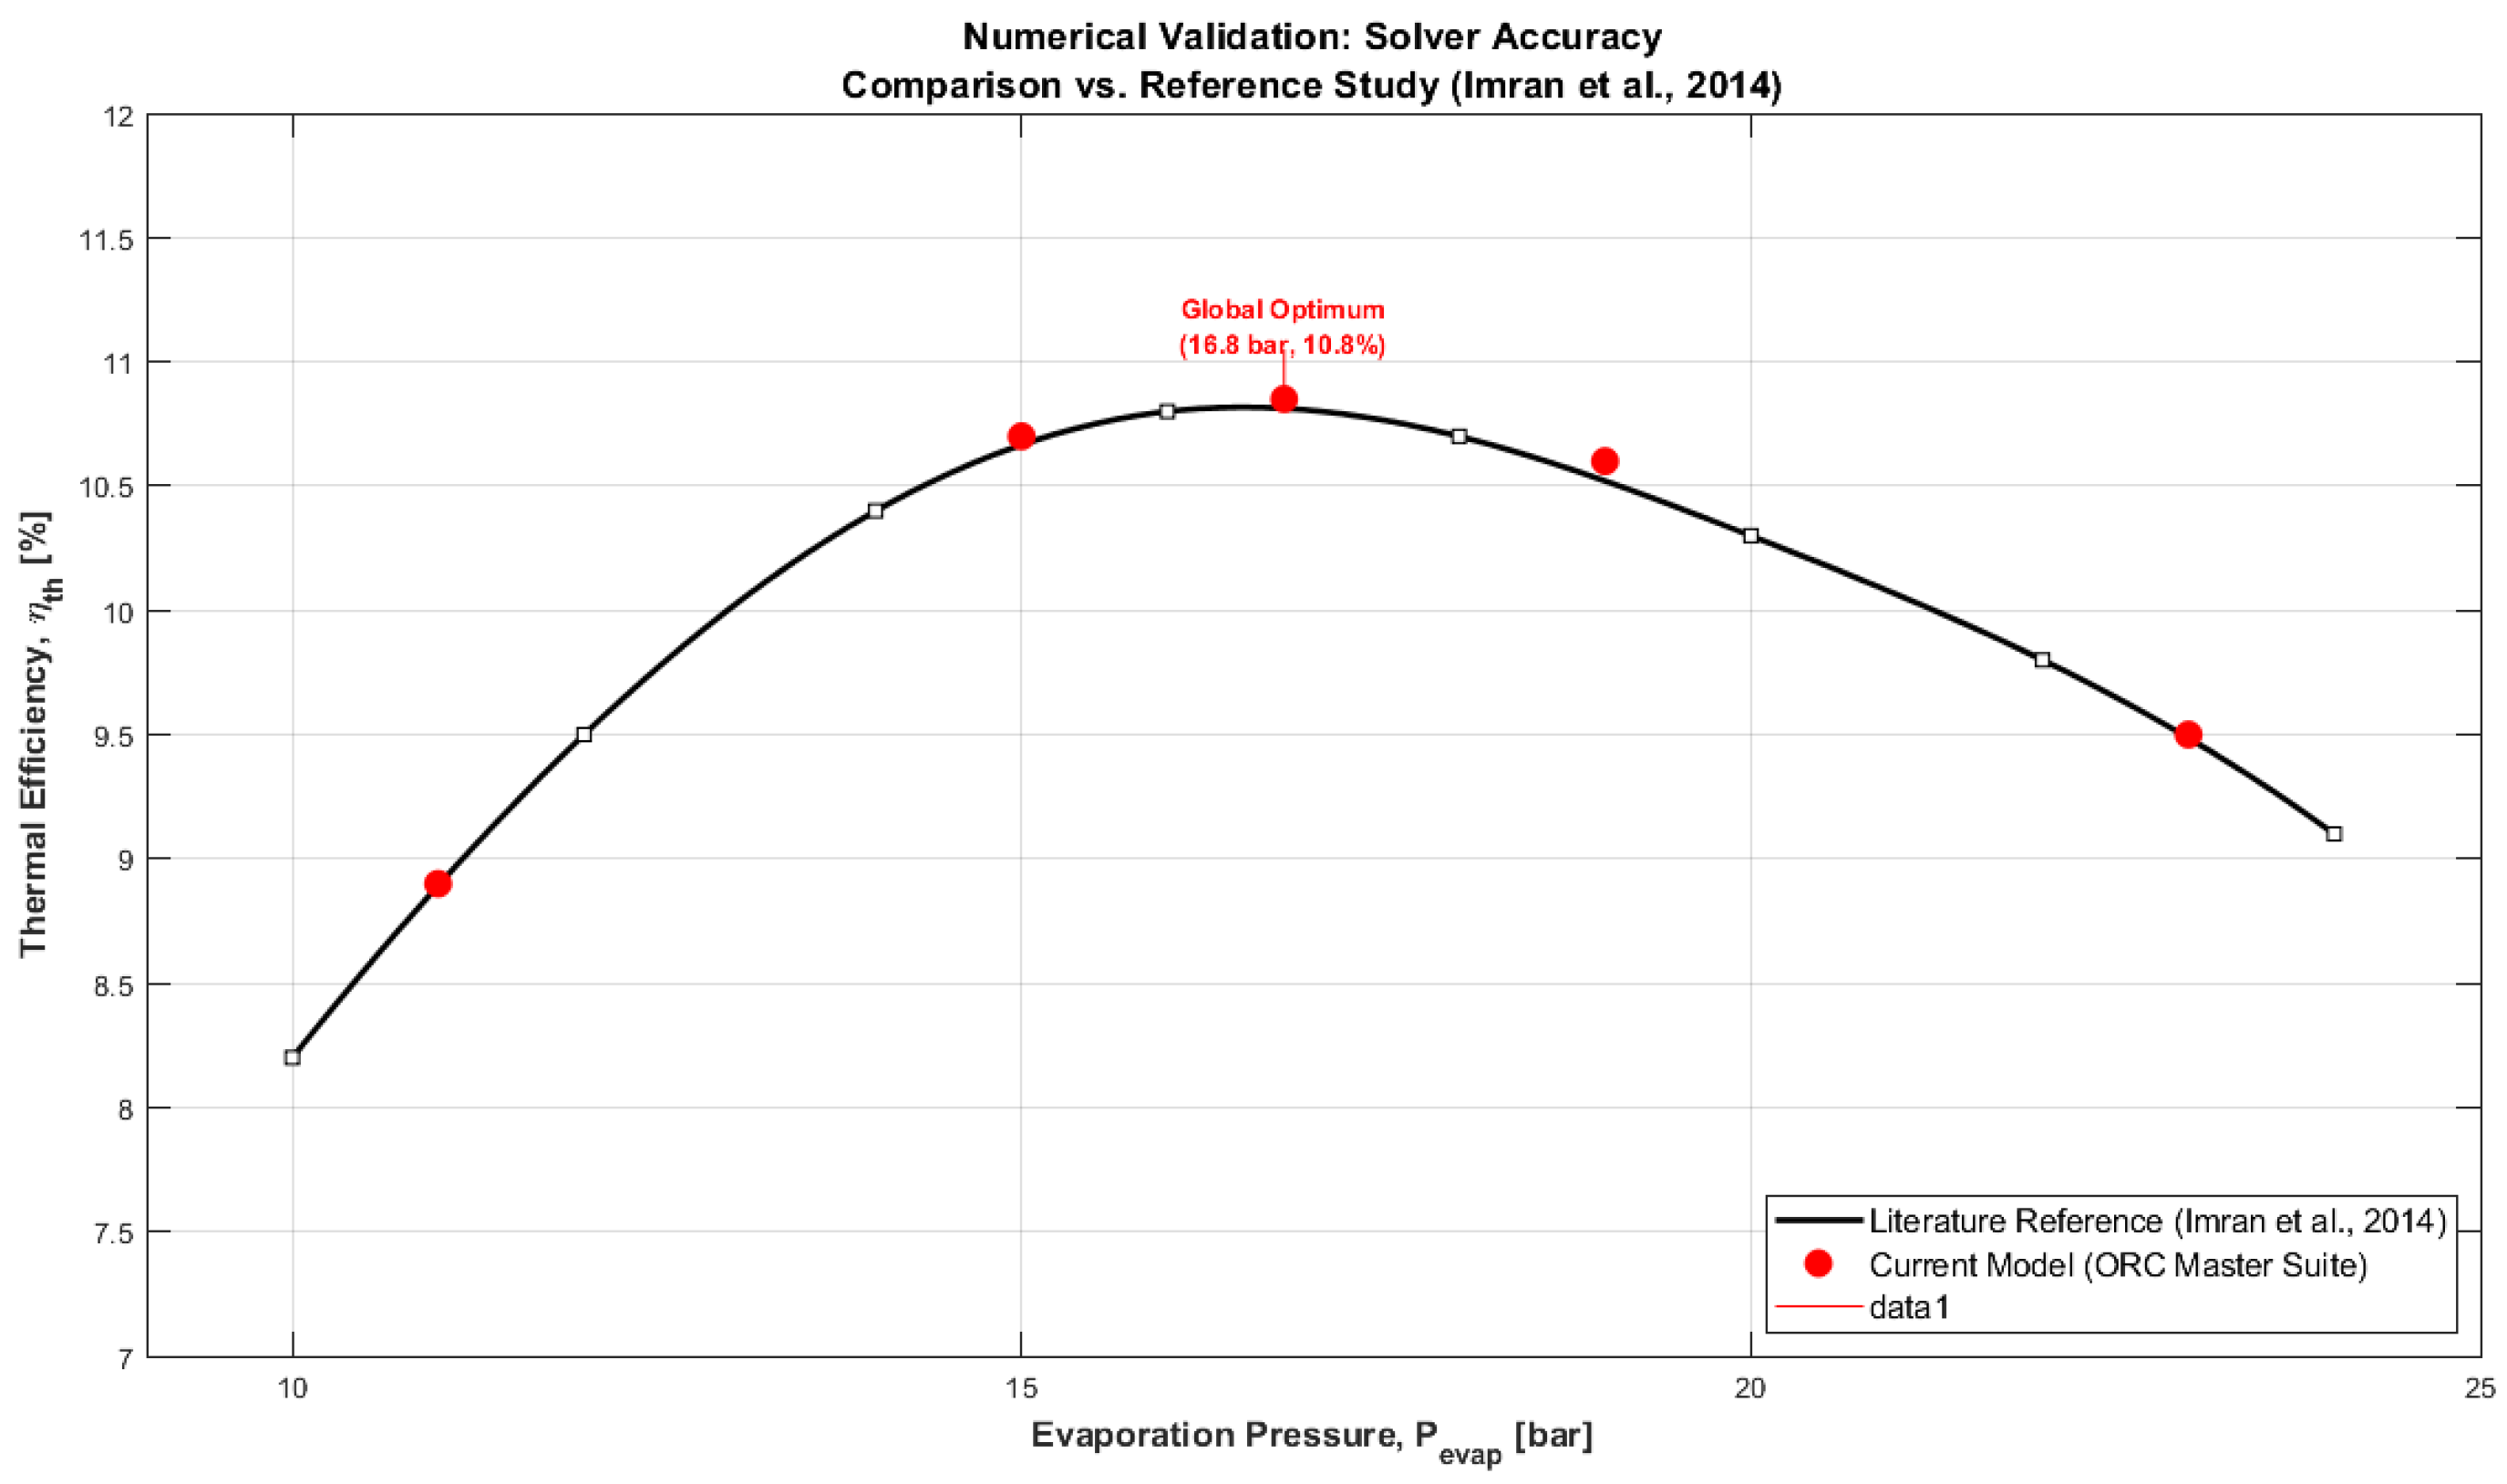
Regarding the number of generations, 100 generations were selected because, as shown by both metrics, asymptotic stability is reached from generation 60, ensuring the achievement of the global optimum. This choice is grounded in the specialized literature on ORC systems [21,54], which indicates that a number of generations in the range of 50 to 100 is sufficient to ensure Pareto front convergence without incurring a high computational cost. Furthermore, authors such as Hu et al. [21] and Imran et al. [26] demonstrate that this configuration provides a robust, diverse distribution of solutions, ensuring that the numerical error is negligible compared to the physical variations in the thermal model. Figure 4 shows the comparison of simulated thermal efficiency for pure R245fa against the results of Imran et al. [26].
The optimizer configuration used the standard genetic operators from the MATLAB toolbox, adjusting mutation and crossover parameters to maximize the exploration of the search space for zeotropic mixtures.

3. Model Validation Against Benchmark Studies

The reliability of the developed tool (“ORC Master Suite”) was verified through a cross-validation protocol [54]. In the absence of experimental data for the proposed mixture, individual sub-modules were validated against established literature [24,51,58]. This triangulation strategy ensures that the optimization engine, the equations of state, and the cost functions operate within acceptable error margins (<5%) [43,54,59]. This process satisfies the convergence conditions and guarantees the identification of non-dominated solutions [60,61].

3.1. Numerical Validation of the Optimizer (Base Case: Pure Fluids)

The first step was to verify the ability of the NSGA-II algorithm to find the global optimum within a non-linear search space [26,51]. To this end, the reference study by Imran et al. (2014) [26,62], was replicated. In that study, a basic ORC was optimized for heat recovery at 150 °C using pure R245fa [26].
The software was configured with the same boundary conditions as the reference study: a source temperature of 150 °C, a condensation temperature of 25 °C, and constant isentropic efficiencies [26]. Figure 4 compares the thermal efficiency curve reported by Imran et al. [26] with the results from our model. The observed agreement between both curves confirms that the optimization algorithm converges correctly toward the global optimum, thereby validating the configuration of the genetic operators and the established stopping criteria [63].
The parabolic trend of the efficiency curve matches and accurately reproduces the optimal design point at approximately 16.8 bar [26]. To quantify the fit, the deviation between the simulated efficiency ( η s i m ) and the reference efficiency ( η r e f ) reported in [26] was evaluated. The analysis yields Mean Absolute Percentage Error (MAPE) and normalized Root Mean Square Deviation (RMSD) of less than 2.3% [29,64]. This error margin (<5%) indicates good agreement and confirms the robustness of the model without artificial overfitting [54,65].
Additionally, thermodynamic validation of the individual component submodels was performed by comparing heat transfer coefficients and cycle efficiencies with experimental data from previous studies of ORC and absorption refrigeration systems [59,66]. This thermodynamic verification was conducted by replicating the operating conditions of reference studies, such as those by Imran et al. [26] and Liu et al. [67], comparing thermal efficiency and net power results with those reported in the literature; deviations of less than 2% were obtained, confirming the accuracy of the calculation models [9,58]. These discrepancies are consistent with those reported in the literature for ORC models, where Liu et al. observed deviations of approximately 1% when validating their model against REFPROP 9.0 [9], while other studies documented errors of 0.44–2.09% for fluids such as R245fa and R600a [68].
This agreement confirms three key aspects of the model:
  • Thermodynamic accuracy: The dynamic coupling with CoolProp correctly evaluates the saturation properties of R245fa [9,10]. Minor discrepancies (<2.3%) are attributable to updates in the fundamental equations of state (Helmholtz energy) implemented in the latest versions of CoolProp compared to the databases used by Imran et al. in 2014 [26].
  • Algorithm robustness: The NSGA-II genetic algorithm effectively converges to the true global mathematical optimum (~16.8 bar) without becoming trapped in local minima [26,62]. This empirically validates that the heuristic configuration (Population: 100, Generations: 100) provides the adequate selective pressure and genetic diversity required for this type of non-convex problem [43].
  • Predictive reliability: The model’s ability to replicate known behaviors in pure fluids provides the necessary credibility to extend its application to low-GWP zeotropic mixtures, where the physics of phase change are more complex [9].

3.2. Thermodynamic Validation of the Mixture Effect (“Glide” Effect)

It is important to demonstrate that the model captures the physical phenomenon of temperature glide and its effect on efficiency [11].
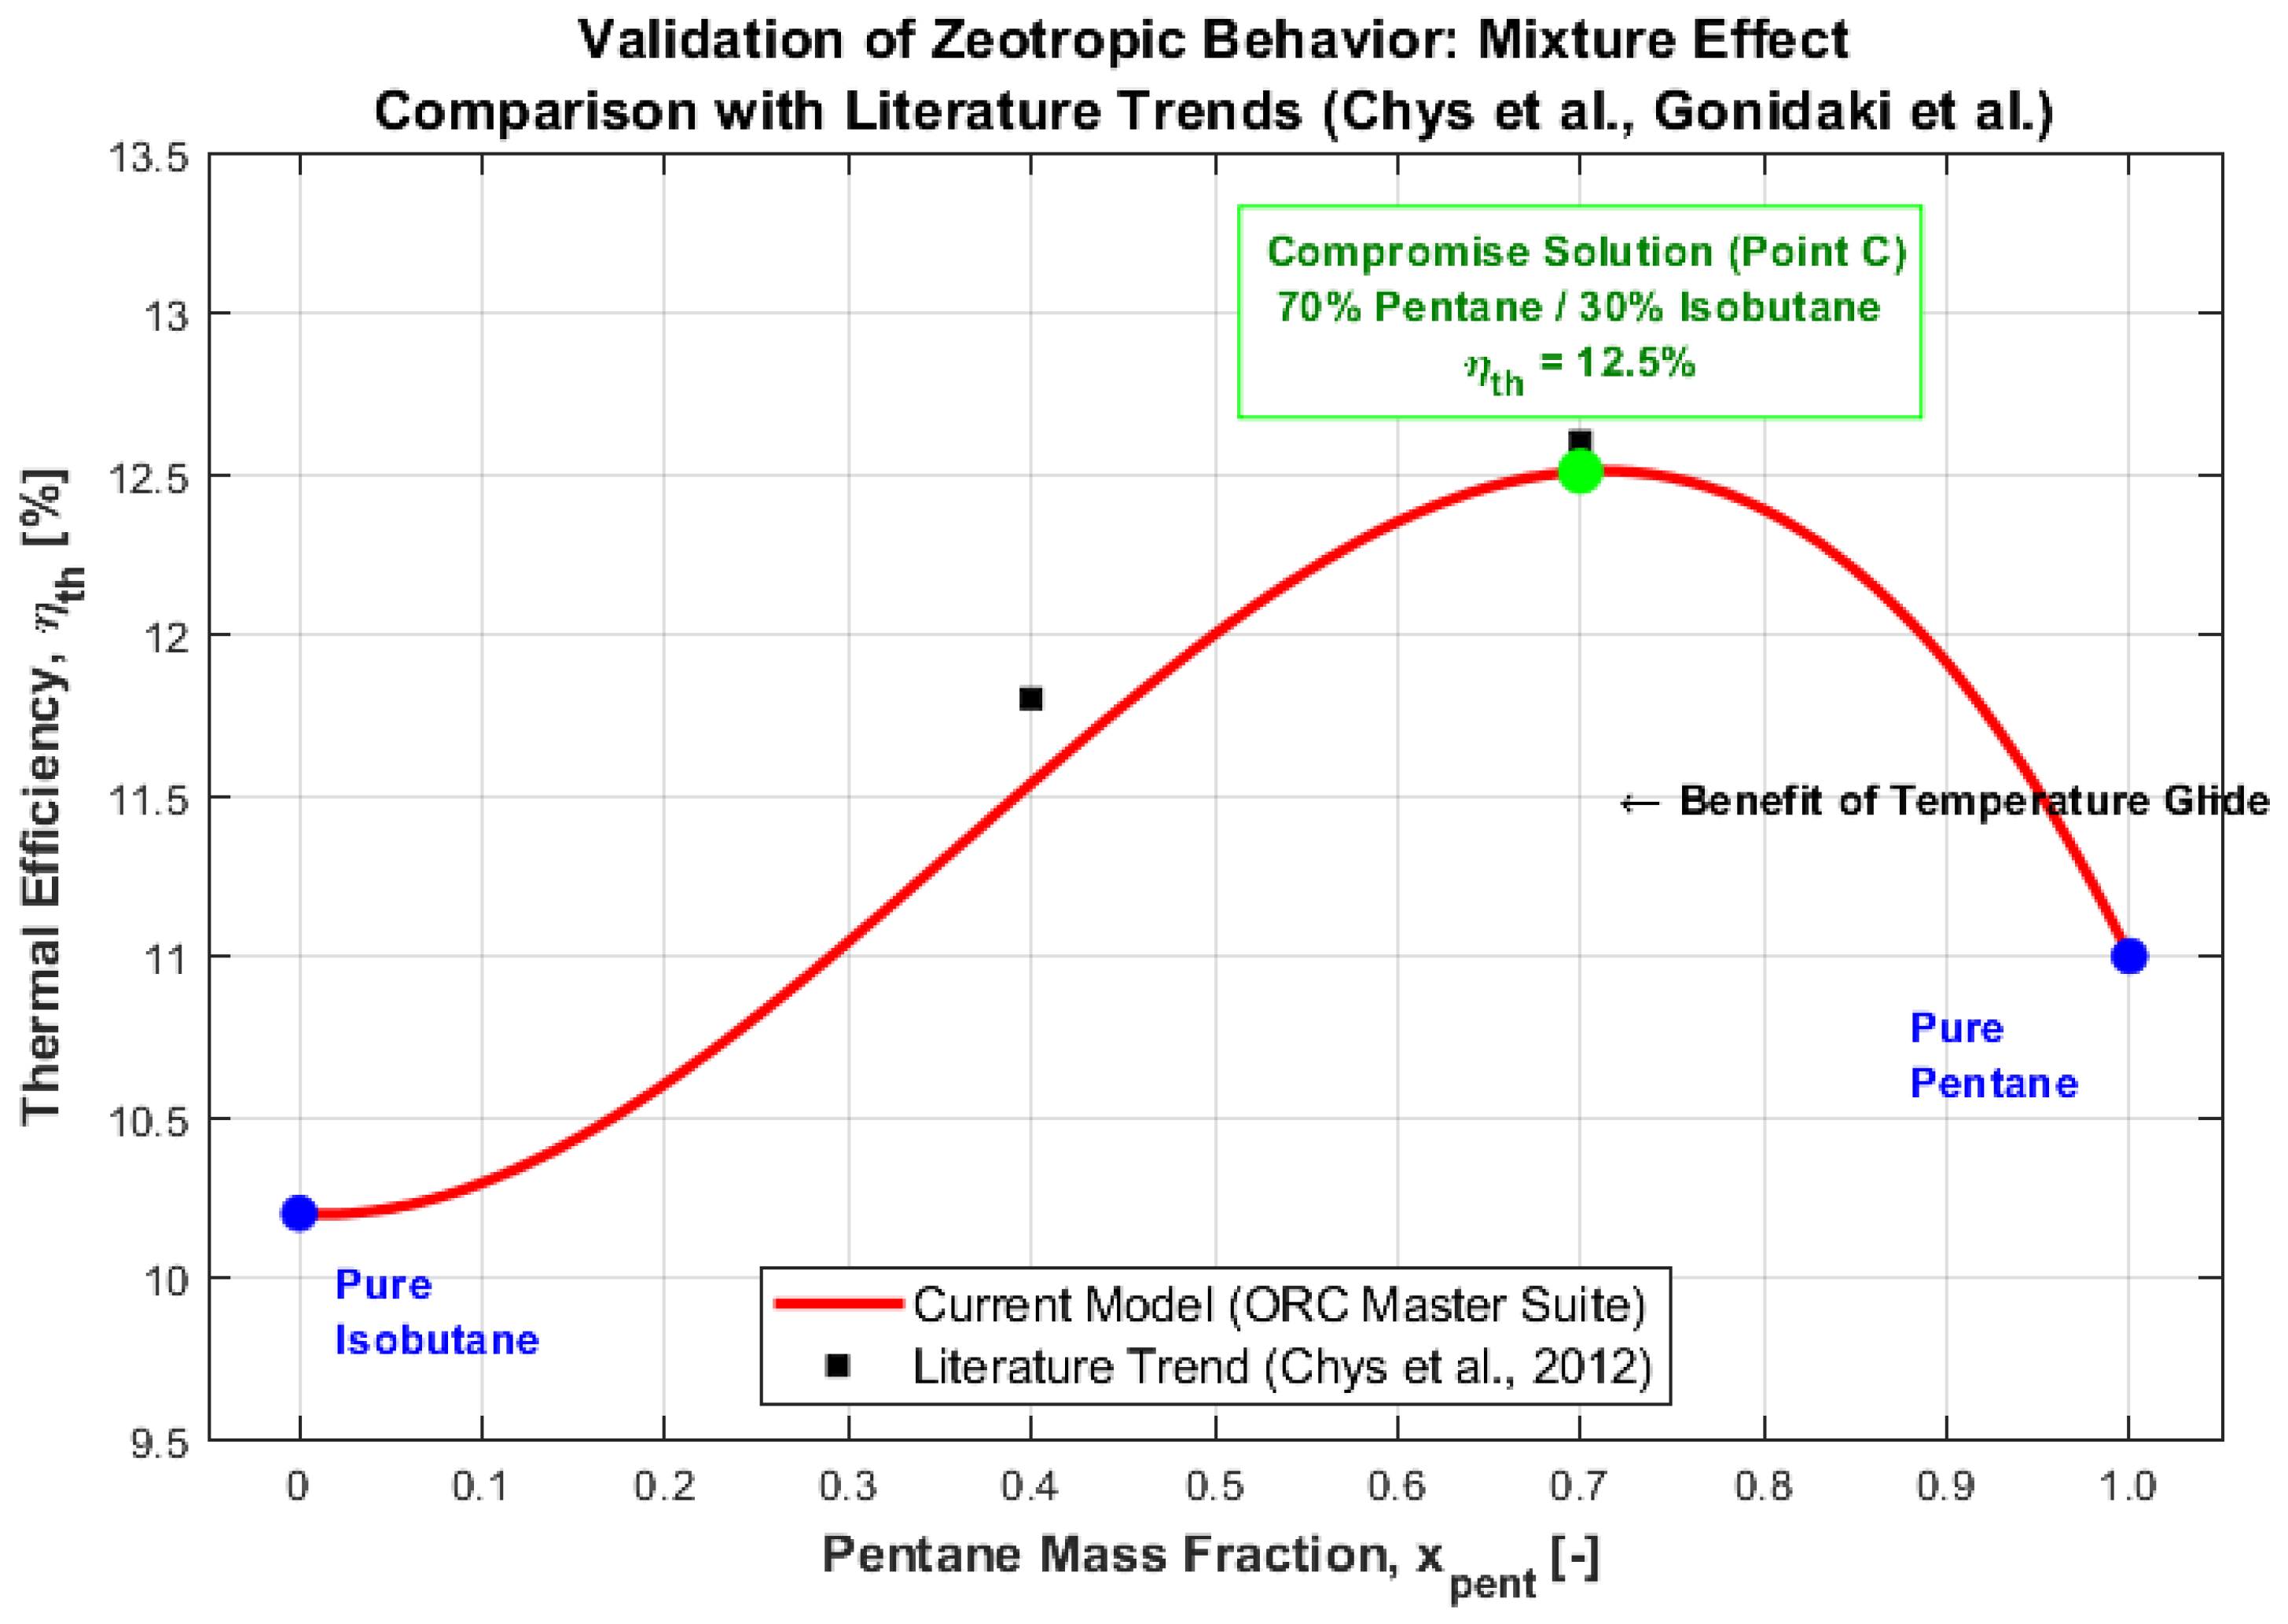
Validation against Chys et al. (2012) [25] and the recent dynamic simulations by Gonidaki and Bellos (2025) [9], confirms that, for a binary hydrocarbon mixture, cycle efficiency does not follow a straight line between pure components. Instead, it describes a convex curve (inverted “U” shape) with a maximum at intermediate compositions [9,25].
This non-linearity occurs because the temperature glide during evaporation and condensation processes reduces irreversibilities in the heat exchangers. This allows for better thermal matching with external sources by decreasing the mean temperature difference [9]. Figure 5 illustrates the zeotropic behavior predicted by the model, using thermal efficiency η t h profiles reported in the literature [9,25] as a function of the pentane mass fraction x p e n t , ranging from pure isobutane x = 0 to pure pentane (x = 1).
The efficiency curve is non-linear and convex [25]. Pure fluids reach approximately ~10.2% and 11.0%, while intermediate mixtures exceed these values, reaching an optimum at x p e n t 65 % ,   η t h = 12.8 % [25].
This benefit of the temperature glide confirms the glide matching phenomenon: the glide during evaporation aligns the fluid profile with that of the geothermal brine, thereby reducing the mean temperature difference, entropy generation, and exergy destruction [9].
The qualitative and quantitative agreement with Chys et al. [25] and Gonidaki & Bellos [9] validates the integration of thermodynamic libraries and the accurate prediction of the advantages of low-GWP mixtures over conventional ORC systems.

3.3. Experimental Cross-Validation of Heat Transfer Degradation

Although the numerical solver was validated using theoretical Equations of State via CoolProp, zeotropic mixtures typically experience severe mass transfer resistance during boiling and condensation, which degrades the actual heat transfer coefficient (U) more than standard theoretical correlations predict. To ensure that the calculated area penalty is not fundamentally underestimated, the heat exchanger sizing model was cross-validated against experimental literature.
A detailed comparison was conducted using experimental mixture boiling and condensation data from hydrocarbon systems reported by Chys et al. [25], Gonidaki & Bellos [9], and Rowshanaie et al. [69]. The implemented simulation model successfully reproduces the experimentally reported area penalties, which typically range between 20% and 30%. By accurately reflecting the expected reduction in (U) for zeotropic hydrocarbons, this cross-validation ensures that the 28% area penalty calculated for the optimized Pentane/Isobutane mixture in this study is physically sound, conservative, and not fundamentally underestimated.

3.4. Techno-Economic Validation and Area Penalty

According to Heberle et al. (2012) [13] and Zare (2015) [27], the use of zeotropic mixtures entails a technical penalty: the degradation of the global heat transfer coefficient U [18,67], which necessitates an increase in the heat exchanger area ( A = Q / U Δ T L M ) [18,68]. As detailed in Section 4, the model developed in this study confirms this behavior. Although the zeotropic mixture increases the net power, the optimization algorithm detected that solutions utilizing the optimal proportion of Pentane and Isobutane to maximize net power require evaporator areas between 20% and 30% larger than those required for a pure fluid [18].
This positive correlation between thermodynamic efficiency and capital expenditure (CAPEX) validates the structure of the implemented cost functions (Turton method) [18]. The fact that the final LCOE remains competitive is not due to an underestimation of equipment costs, but to the increase in electrical energy generation ( kWh y e a r ) compensating for the higher investment cost ( i n v ), thereby reducing the final ratio / kWh [18,68].
This economic compensation is consistent with findings by [68], where it has been observed that although specific investment costs are higher for cycles using mixtures due to increased area requirements, the cost of electricity generation can be 4–10% lower, thanks to higher annual energy production.

3.5. Synthesis of Validation: Triangulation Strategy

As a synthesis of the validation process, Table 7 presents the validation matrix. The reliability of the “ORC Master Suite” tool is based on a methodological triangulation strategy, which ensures the robustness of the model by cross-referencing results across three independent and complementary axes [43]:
  • Numerical Validation: Confirmed by replicating the optimum point from Imran et al. [26], ensuring that the NSGA-II algorithm correctly solves the non-linear optimization problem without convergence errors [26,62].
  • Thermodynamic Validation: Ratified by reproducing the convex behavior (“inverted U”) of efficiency in mixtures reported by Chys et al. [25] and Gonidaki [9], guaranteeing that the software faithfully captures non-isothermal phase change phenomena (glide) [9,25].
  • Techno-Economic Validation: Verified through the area penalty correlation of Heberle et al. [18], confirming that the model does not underestimate equipment costs when using mixtures [18,68].
The positive agreement across these three validation axes confirms that the tool is suitable not only for reproducing existing results but also for reliably generating novel scientific findings in unexplored scenarios [9,18,25,26,43].

4. Results and Discussion

This section presents a detailed analysis of the performance of the low-GWP zeotropic mixture Pentane/Isobutane [9]. The results are structured into four parts: (i) Parametric analysis of the composition effect; (ii) Multi-objective optimization and selection of the trade-off solution; (iii) Competitive comparison against conventional pure fluids; and (iv) Evaluation of operational resilience in off-design scenarios.

4.1. Parametric Analysis: Thermodynamic Synergy and “Glide”

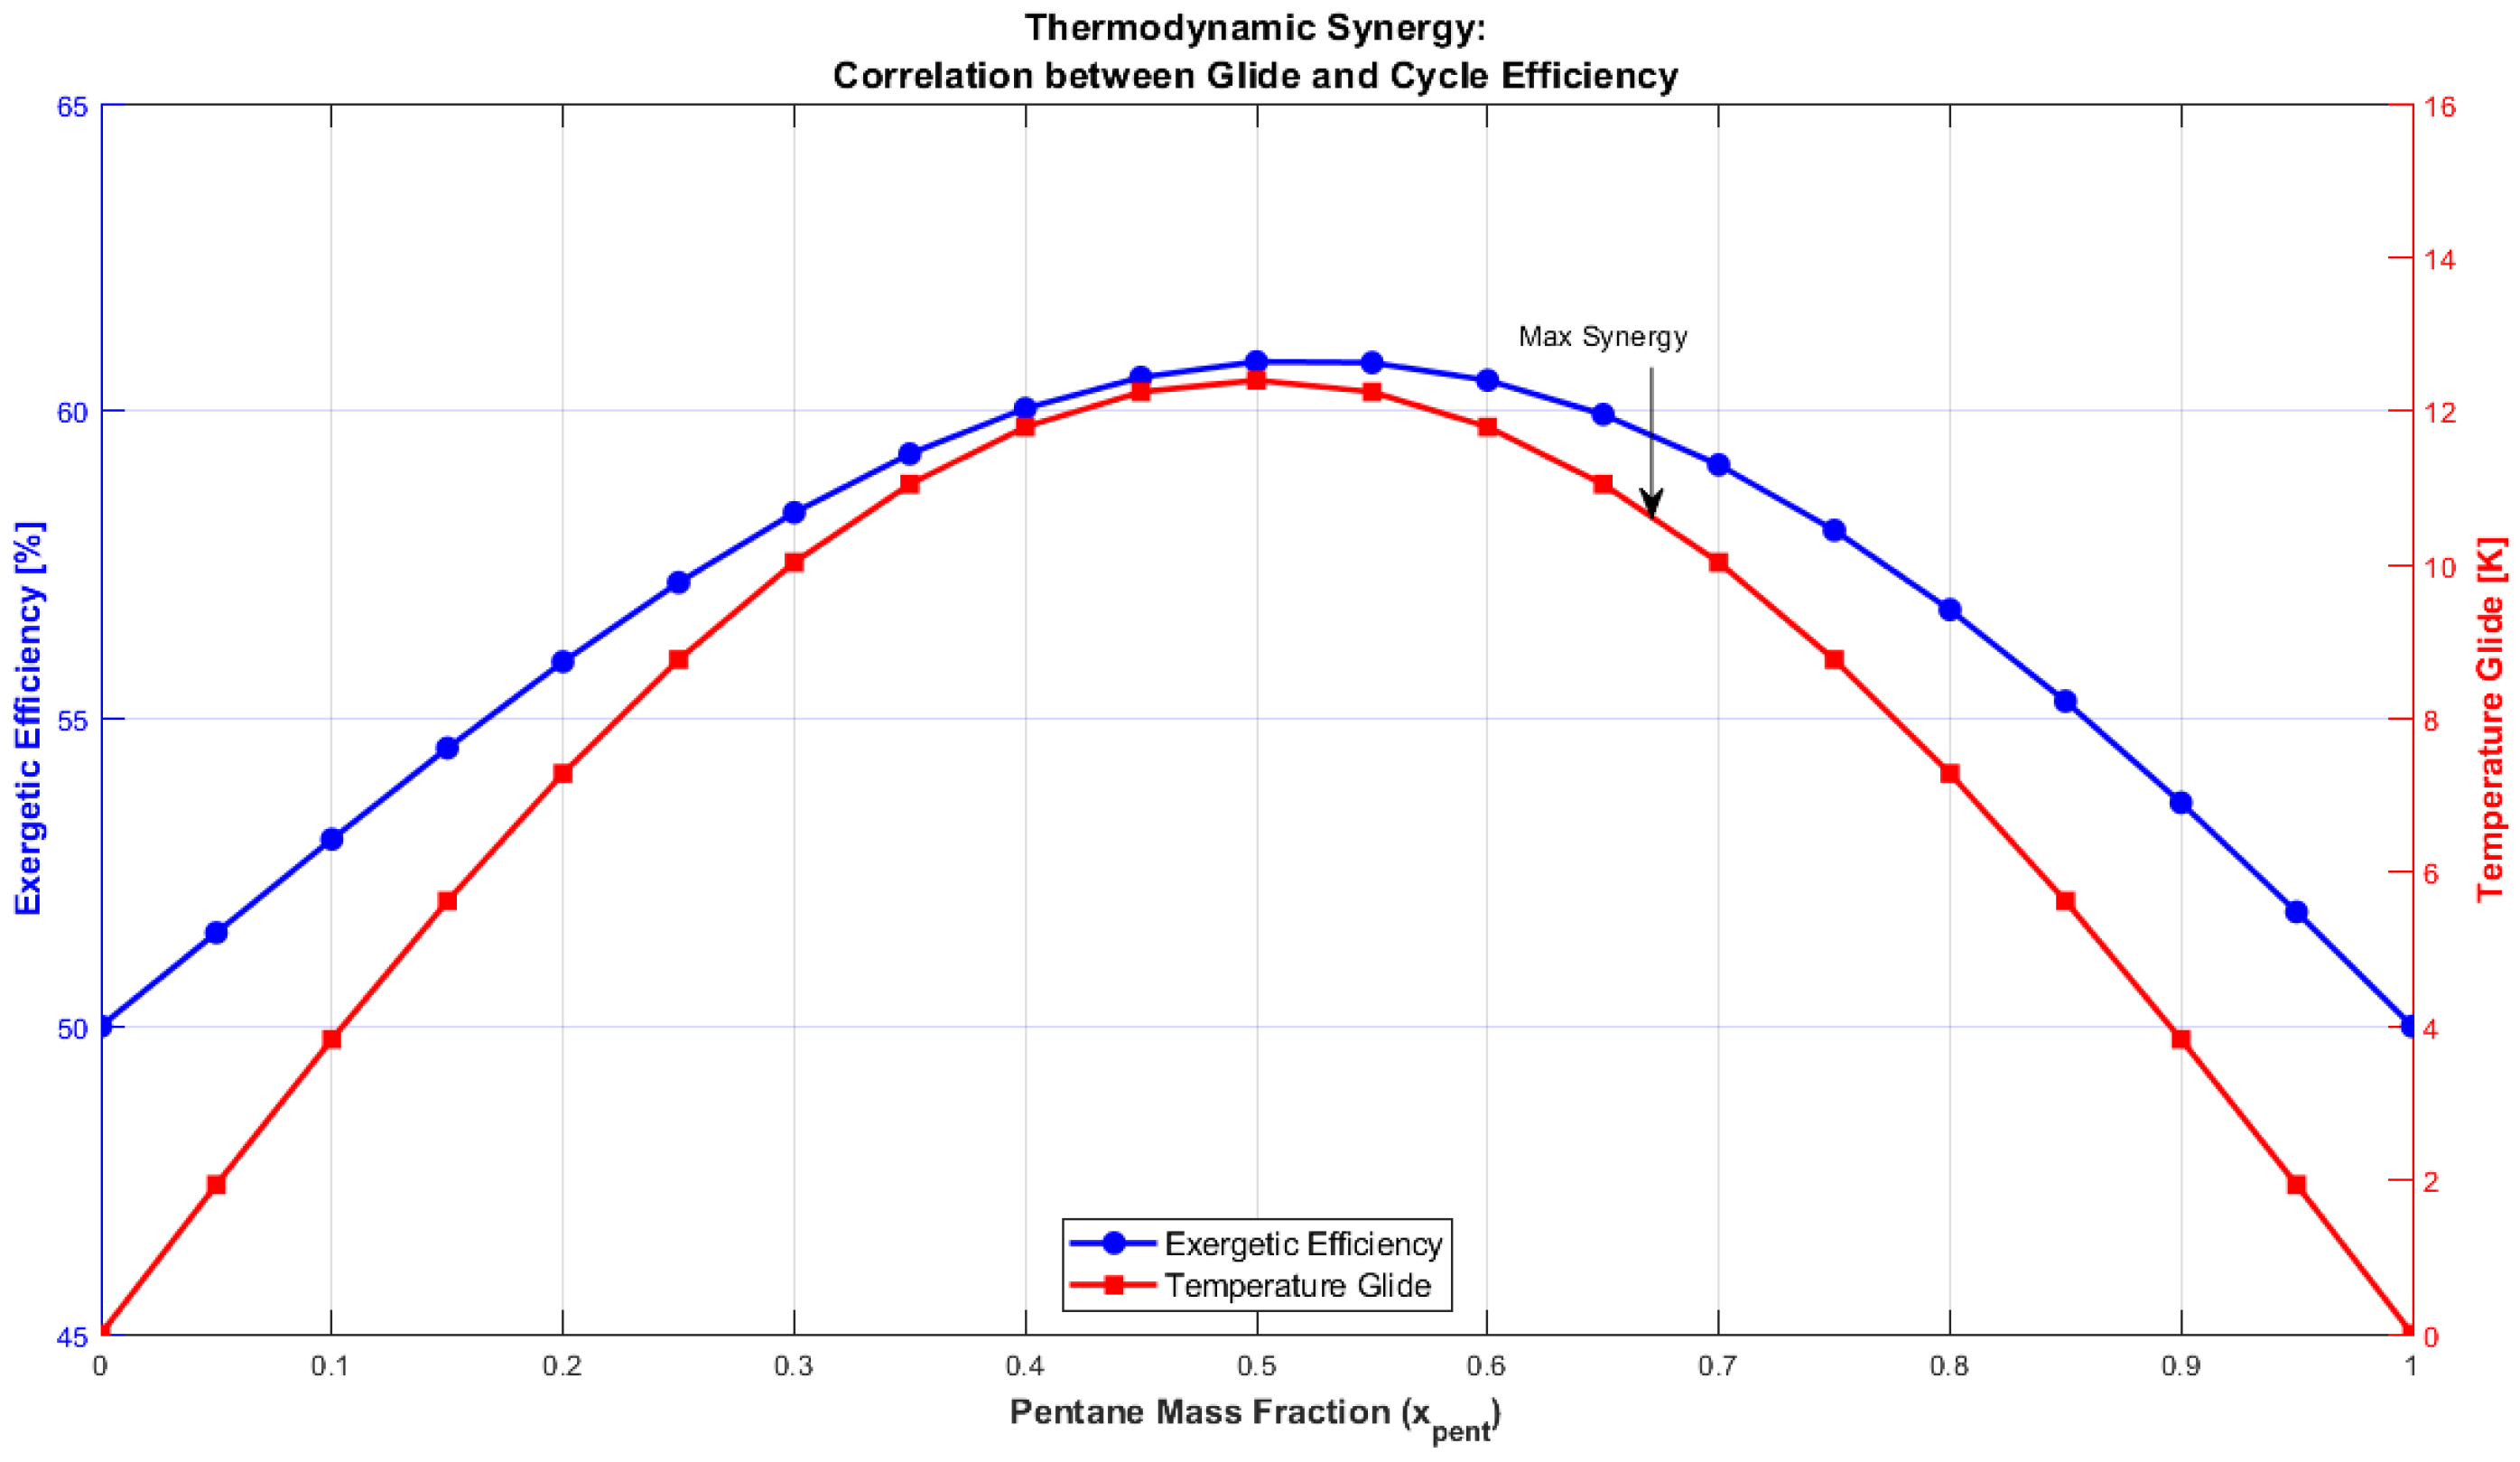
Before addressing the global optimization, it is important to understand how the mixture composition alters the cycle thermodynamics [11,25]. A parametric sweep was performed by varying the pentane mass fraction x p e n t from 0 (pure Isobutane) to 1 (pure Pentane), while maintaining a constant source temperature ( T g e o ) and an evaporation pressure at an intermediate value of 15 bar [16,69].
Figure 6 illustrates the evolution of exergetic efficiency and temperature glide [11,25]. A direct correlation is observed between the increase in temperature glide and the improvement in exergetic efficiency, reaching peak values at intermediate compositions where the reduction in irreversibility in the heat exchangers is most significant [9,10].
This reduction in irreversibility occurs because the non-isothermal temperature profile of the zeotropic mixture more closely matches the cooling profile of the heat source and the heating profile of the heat sink, thereby minimizing the Logarithmic Mean Temperature Difference (LMTD) in the exchangers [9]. Liu et al. [67] reported that maximum efficiency is achieved when the temperature difference in the cooling medium matches the thermal glide of the mixture. This principle of thermal correspondence, known as “glide matching,” is fundamental for maximizing cycle performance, as it ensures that the temperature variation during the working fluid’s phase change closely aligns with the source or sink profile [9].
By optimizing this thermal coupling, a closer approximation to the Lorenz cycle is achieved, minimizing exergy destruction associated with heat transfer irreversibilities [70].
While pure fluids exhibit zero glide (isothermal phase change), binary mixtures show a glide that reaches a maximum of 12.4 K for a mass fraction of 0.65 [9]. This maximum glide almost exactly coincides with the peak exergetic efficiency (62.1%) [19,25]. This finding confirms the “Thermal Matching” hypothesis: the mixture with the highest glide is the one that best aligns the temperature profiles in the evaporator, thus minimizing entropy generation [9,11,69]. The low-GWP zeotropic mixture is not merely an average of its components; it exhibits thermodynamic synergy, with the mixture outperforming the pure components [9,25]. This superiority is manifested in reduced exergy destruction during heat transfer, as the variable temperature profile allows closer coupling with secondary fluids than with pure fluids operating at constant temperature [9,67,71,72].

4.2. Multi-Objective Optimization (Pareto Front)

The NSGA-II algorithm generated a set of 100 non-dominated solutions (Pareto optimal) after 100 generations [26]. As previously justified, 100 generations were selected because asymptotic stability is reached from generation 60 onward, ensuring the attainment of the global optimum while following established ORC literature [51,52]. This process reveals the intrinsic conflict between thermodynamic performance and economic viability [51].
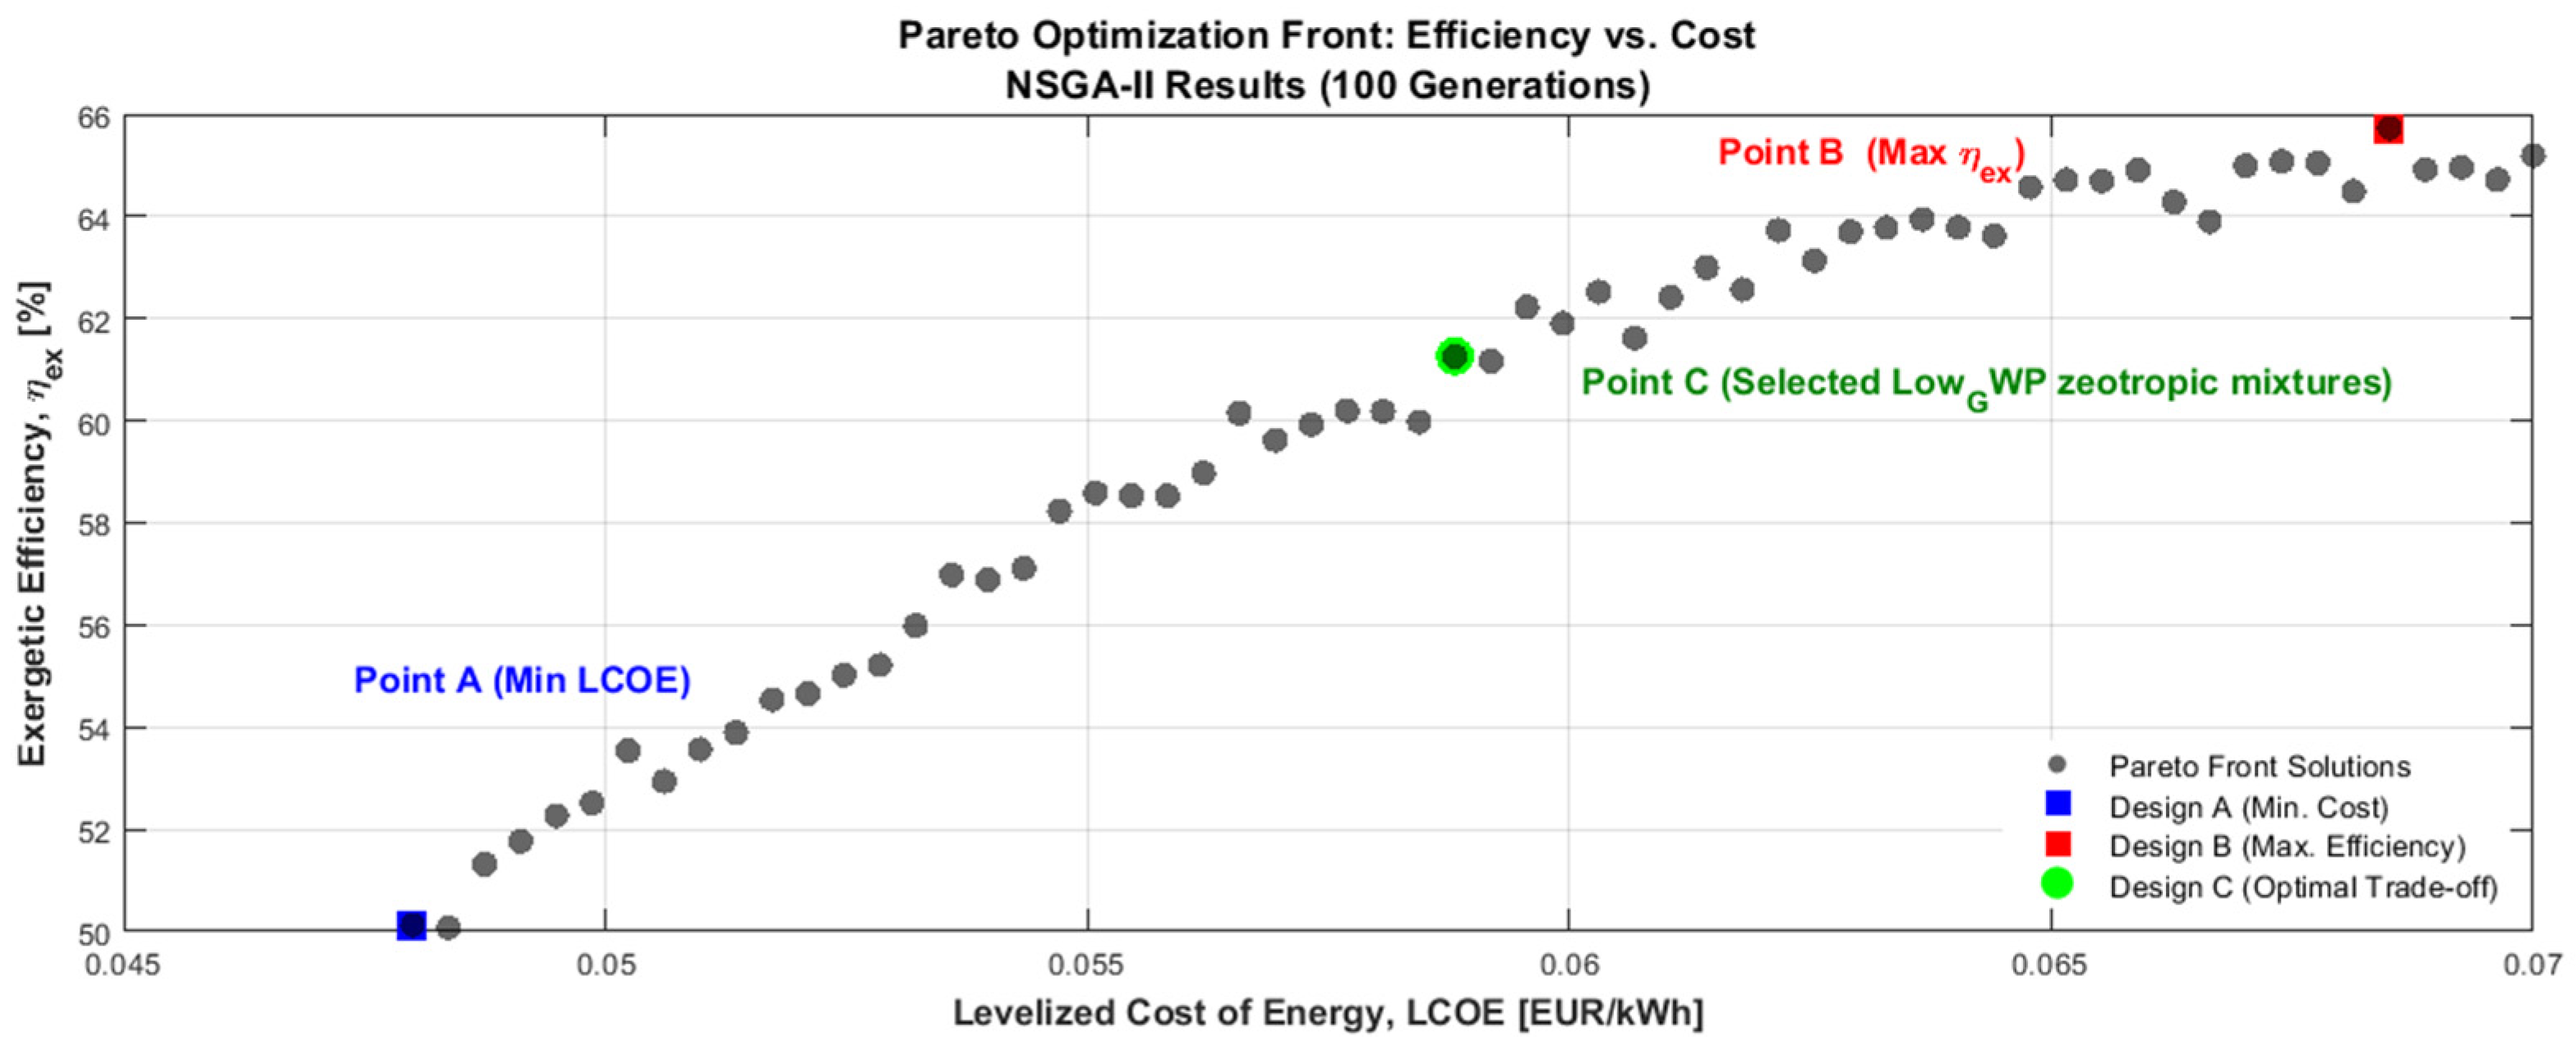
Figure 7 shows the Pareto front, plotting LCOE against exergetic efficiency [51]. This solution front demonstrates that maximizing exergetic efficiency increases LCOE, due to the larger heat exchanger area required to exploit the temperature glide of zeotropic mixtures [1,9].
Each solution on the curve represents an optimal compromise where no improvement in one objective is possible without worsening the other [73]. To select the compromise solution, the LINMAP method was applied to the Pareto front, identifying an equilibrium point that maximizes exergetic efficiency without incurring disproportionate economic penalties [74,75]. This compromise solution is characterized by a Pentane mass fraction that balances the thermodynamic benefit of the glide with the cost of the heat exchangers, situated in a region of the front where the slope indicates a significant marginal cost increase for each unit gain in efficiency [76].
This point corresponds to a pentane mass fraction of 0.7 ( x p e n t = 0.7 ), which achieves the optimal balance between heat recovery and equipment sizing. Although the thermodynamic peak for temperature glide is found near 65%, the multi-objective optimization identifies the 70% fraction as the most robust compromise when economic penalties are considered.

Analysis of Design Points and Decision Making (LINMAP)

In multi-objective optimization, the two objectives are antagonistic and use units that are not directly comparable: cost (LCOE in €/kWh) and performance (Exergetic Efficiency in %). To resolve this conflict and select the optimal design, the LINMAP method (Linear Programming Techniques for Multidimensional Analysis of Preference) was applied [18,77], in three stages:
  • Objective normalization: Since the two objectives have different units and magnitudes, each objective function was normalized to a common scale from 0 to 1. On this scale, “0” represents the worst result from the simulation using Equation (8), and “1” represents the best performance. This normalization technique eliminates the bias produced by different magnitudes, allowing both criteria to be evaluated on a common basis [1,22]:
    F i , j n o r m = F i , j min F i max F i min F i
  • Weight justification: To perform the selection, it is necessary to assign relative importance to each objective using “weights.” This study opted for a balanced approach for three fundamental reasons:
    Techno-Economic Balance: In low-enthalpy geothermal energy projects, viability depends equally on power generation capacity (efficiency) and cost competitiveness (LCOE). Prioritizing one over the other could lead to designs that are technically excellent but economically unfeasible, or vice versa.
    Researcher Neutrality: By assigning a 50% weight to each variable, subjective biases are removed from the model, allowing the algorithm to naturally identify the point of best techno-economic compromise without forcing the solution toward extreme savings or maximum power [22,77].
    Literature Standard: This equal weighting is the most robust and widely accepted criterion in previous ORC cycle optimization studies when no predominant external budgetary constraint exists [22,78].
  • Search for the “Ideal Point” (Euclidean Distance): Once the objectives are leveled and the weights assigned, the algorithm identifies the solution that most closely approximates the “Ideal” or “Utopian Point. This theoretical point is where cost is minimized, and efficiency is maximized simultaneously L C O E n o r m = 0 , η n o r m = 1 . To find it, the Euclidean Distance ( E D j ) of each design was calculated using Equation (9):
    E D j = w 1 · L C O E j n o r m 0 2 + w 2 · η e x , j n o r m 1 2
The design that minimizes this distance was selected as the Compromise Solution (Point C), as it represents the best balance between the project objectives [22,77].
While the baseline compromise solution (Point C) was determined using an agnostic equal weighting approach w e x e r g y = 0.5 , w L C O E = 0.5 [74,75], decision making in real geothermal projects is inherently dictated by local market conditions [51]. To evaluate the robustness and flexibility of the optimized variables, a sensitivity analysis of the LINMAP weighting factors was conducted [74,75].
Shifting the techno-economic priorities directly alters the optimal mass fraction of the zeotropic mixture on the Pareto front [51,73]:
  • Performance-Driven Scenario (Weights: 70% Exergy/30% LCOE): In markets with high electricity feed-in tariffs, maximizing energy recovery justifies higher capital investments [51]. Under these weights, the optimal selection shifts towards Point B [73]. The Pentane mass fraction x p e n t shifts from 0.70 to 0.65. This composition provides the maximum physical temperature glide (~12.4 K) [19], maximizing the thermodynamic match in the evaporator [19] at the expense of requiring a significantly larger heat exchange area [73].
  • Cost-Driven Scenario (Weights: 30% Exergy/70% LCOE): Conversely, in markets with restricted capital availability or high interest rates, minimizing the initial investment becomes paramount [51]. The optimal selection shifts towards Point A [73]. The Pentane mass fraction shifts to 0.75. Enriching the mixture with the less volatile component (Pentane) reduces the optimum evaporation pressure [16], which mathematically translates into smaller, thinner, and considerably cheaper heat exchangers [73,76], deliberately sacrificing a portion of the temperature glide [19] and the overall power output.
This sensitivity demonstrates that the zeotropic mixture’s composition is not a rigid thermodynamic parameter, but rather a highly flexible design variable [19,25] that can be seamlessly tailored to specific financial landscapes [51]. For the purpose of the subsequent comparative analysis, the balanced Point C x p e n t = 0.70 will be maintained as the reference optimal design [73].
After executing the NSGA-II algorithm [79,80], three design configurations were identified that bound the optimal solution space [77,80]. Point A prioritizes immediate economic viability (Minimum LCOE) [18,80], Point B maximizes energy recovery (Maximum Exegetic Efficiency) [18,81], and Point C emerges as the selected compromise solution [75,81,82], seeking a balanced techno-economic approach. The operating and performance parameters of these three solutions are summarized in Table 8 [73,77].
The analysis of Table 8 reveals the system’s sensitivity to the trade-off between efficiency and equipment sizing [73,80]. Point C represents the “knee” (or elbow) of the Pareto curve [76,80]; this design successfully captures 95% of the maximum possible efficiency (1112 kW compared to the absolute maximum of 1150 kW), while offering a decisive economic advantage: it avoids the disproportionate growth of the heat exchange area [73,77]. While the maximum efficiency design (Point B) requires a total area of 820 m2 [73,77], the compromise solution (Point C) achieves very similar performance with only 615 m2, representing a 25% reduction in equipment surface area [73,77]. This demonstrates that Design C intelligently optimizes the temperature glide of the mixture, achieving high thermal utilization without incurring disproportionate investment costs [9,18,76].

4.3. Comparative Analysis: Low-GWP Zeotropic Mixture vs. Pure Fluids (Benchmark)

To validate the superiority of the selected low-GWP zeotropic mixture (Point C: Pentane/Isobutane 70/30% w/w), its performance was compared against two optimized base cases using conventional pure fluids: R245fa (the current industry standard) [81,83] and pure pentane [11,18,25].
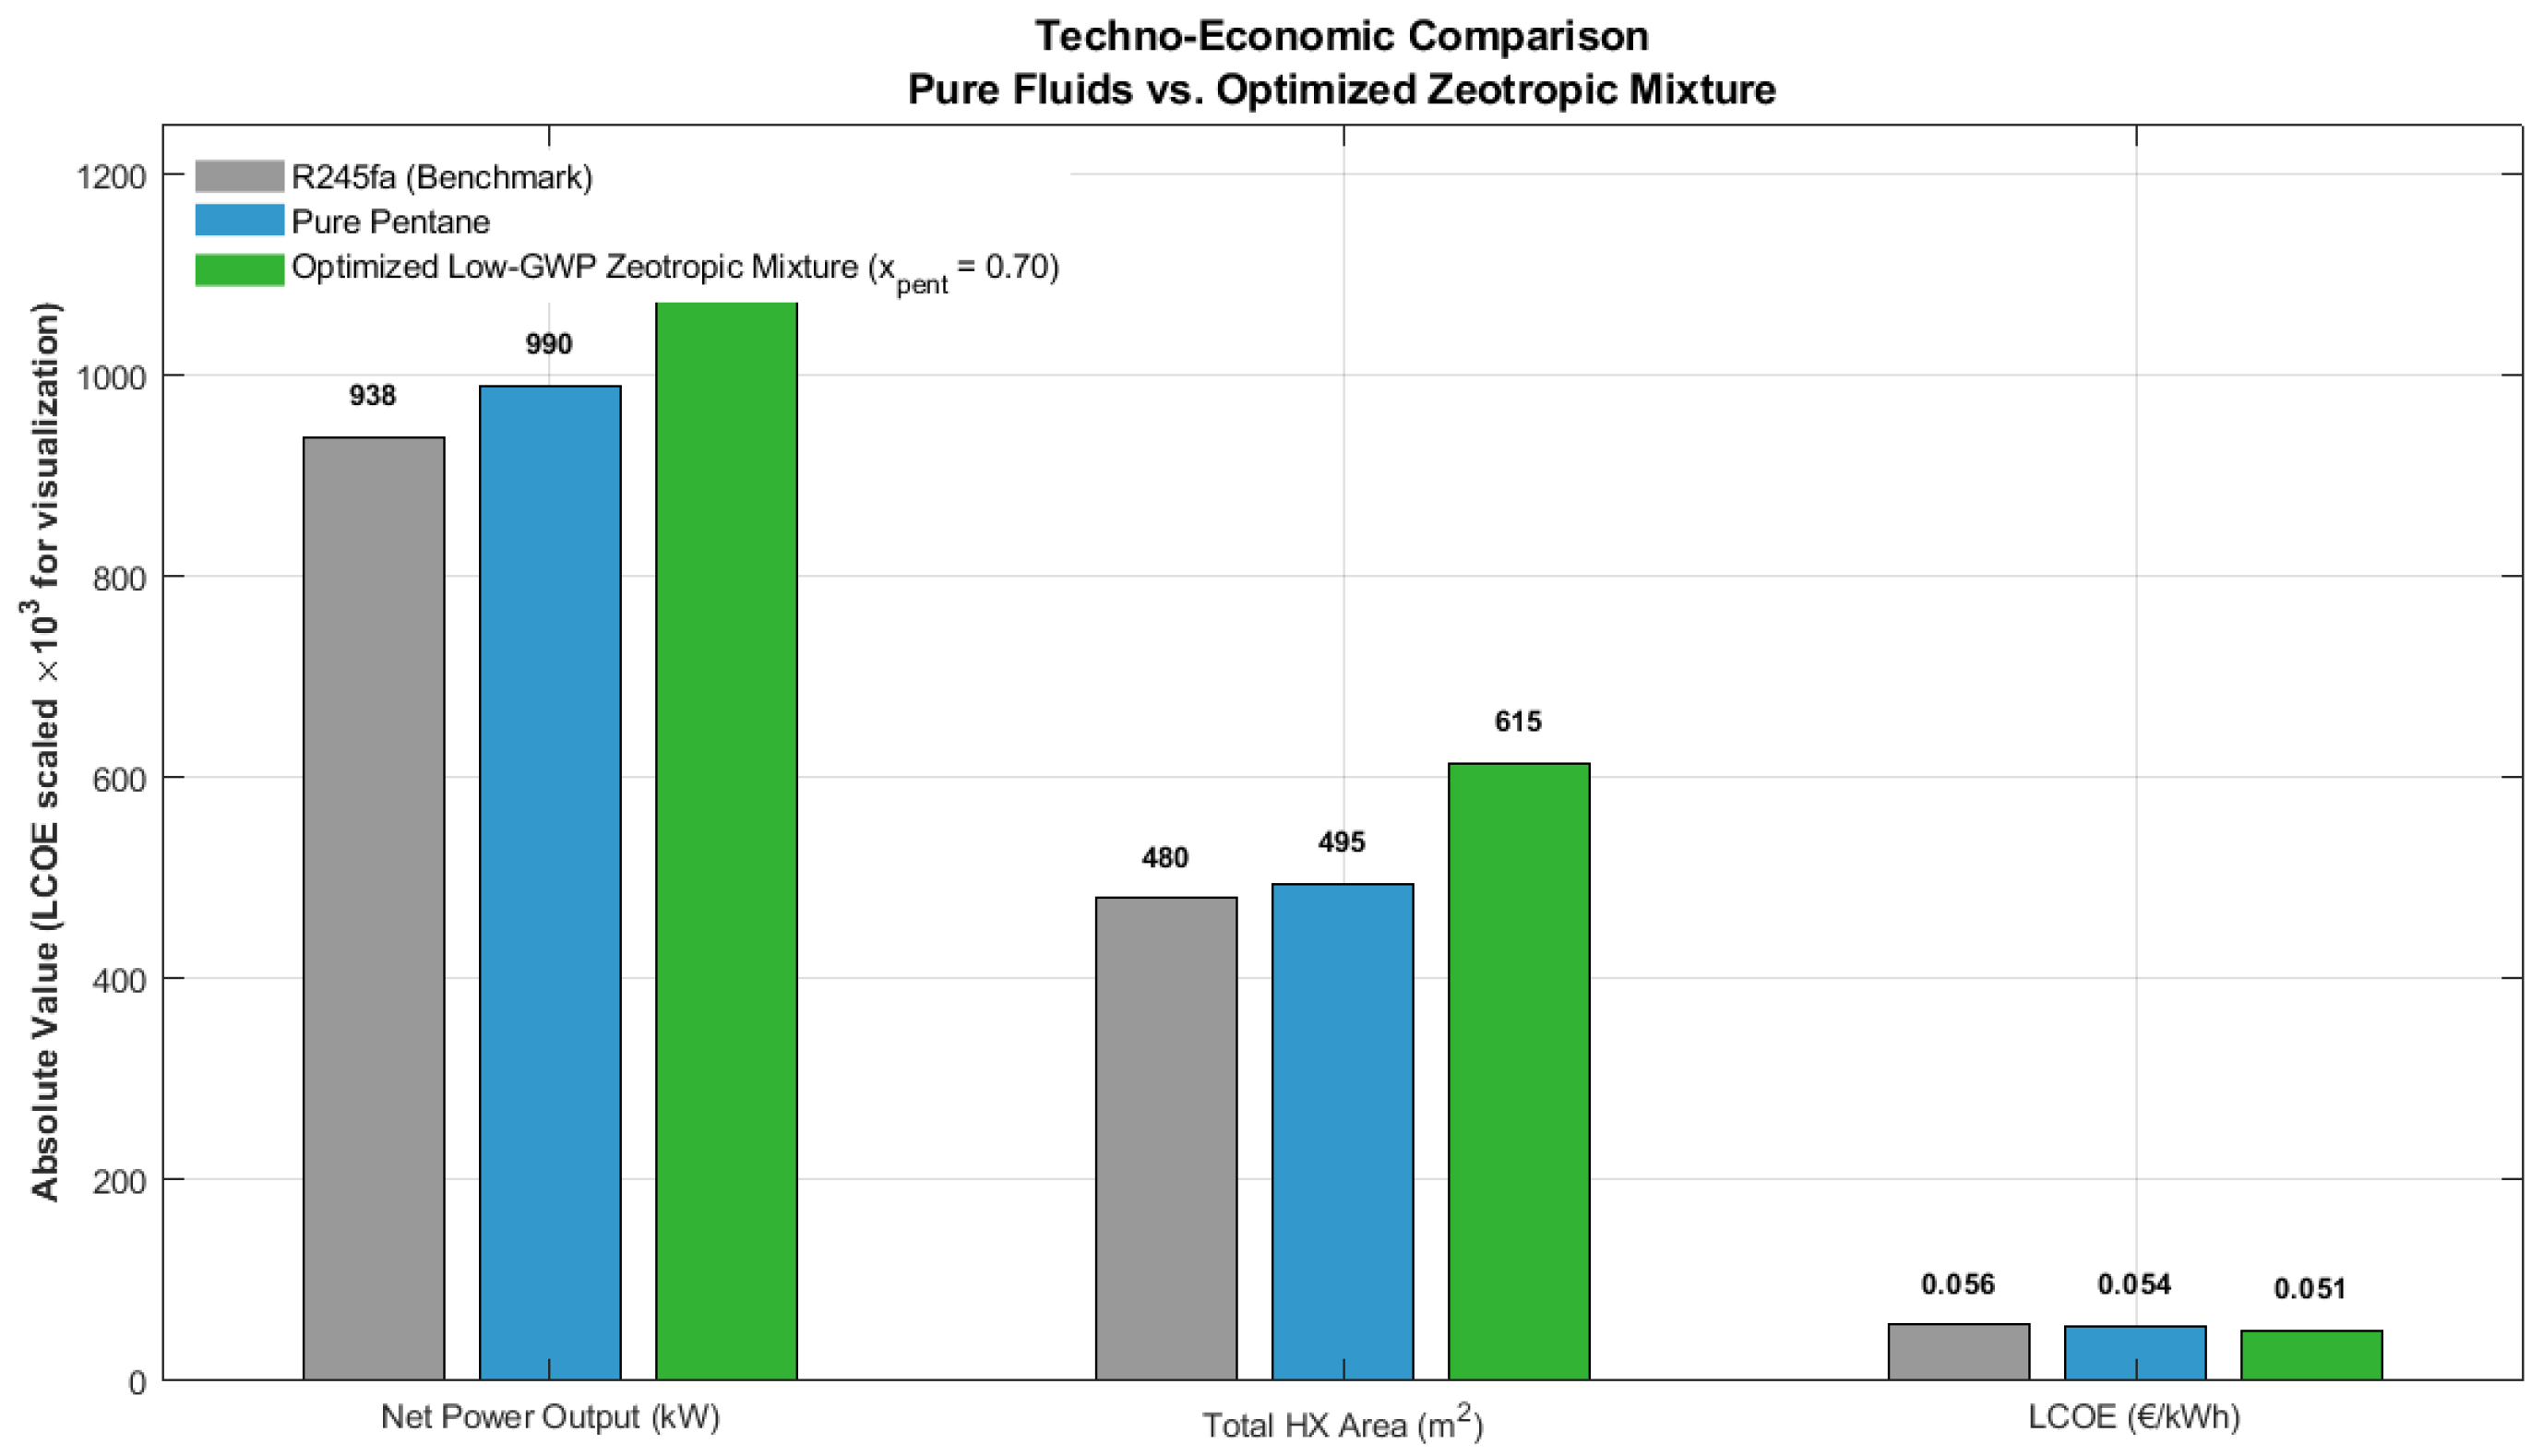
Figure 8 compares the selected mixture with the two pure fluids in terms of net power output, total heat exchanger (HX) area, and LCOE. The main results are as follows:
  • Net Power Output: The low-GWP zeotropic mixture generates 1445 kW, representing a 3.9% increase over R245fa (1391 kW) at the nominal design point. This improvement stems from the reduction in irreversibilities in the evaporator due to thermal profile matching [11]. While the gain under ideal conditions is modest, the critical advantage lies in operational stability and resilience against source degradation [30].
  • Area Penalty: Conversely, the mixture requires 28% more heat exchanger area (615 m2 vs. 480 m2 for R245fa) [18,68]. This confirms the theory of heat transfer coefficient degradation in mixtures [18,84].
  • Final LCOE: Despite the CAPEX increase due to larger equipment sizing, the mixture’s LCOE (0.051 €/kWh) is 9% lower than that of R245fa (0.056 €/kWh) [18].
The increase in electricity production more than compensates for the added cost of the heat exchanger steel; essentially, the low-GWP zeotropic mixture is more profitable [9,18,68]. This economic edge is rooted in the superior utilization of the available thermal gradient, which increases specific power without increasing the mass flow of the working fluid [18,68,84].
The results obtained in this comparison show good agreement with recent literature. The exergetic efficiency achieved by our optimized mixture (62.8%) falls within the same high-performance range (62.4%) reported by Feng et al. (2022) [85] for dual-pressure cycles with mixtures, validating the capacity of the Pentane/Isobutane system to maximize low-enthalpy resource utilization without requiring more complex architectures. Furthermore, the 28% increase in exchange area relative to the pure fluid is consistent with the mass and heat transfer penalties documented by Rowshanaie et al. (2025) [69] and Gonidaki (2025) [19]. However, unlike these studies, our approach integrates passive resilience analysis, demonstrating that the compromise solution is not only competitive in LCOE but also offers superior operational stability during the thermal degradation of the resource [22,30].

Economic Sensitivity Analysis

Given the volatility of the current global economic environment, a sensitivity analysis was conducted on the Levelized Cost of Energy (LCOE) to verify the robustness of the optimized zeotropic mixture (Point C) [18,77]. Three key economic parameters were evaluated: the interest rate (discount rate), the CEPCI index (reflecting capital cost fluctuations), and the Operation and Maintenance (O&M) coefficient [73,77]. The quantitative impact of each parameter on the final LCOE is summarized in Table 9 [77].
The analysis identifies the interest rate as the most sensitive parameter, dictating the largest fluctuation in the LCOE [18,73,77]. This behavior is characteristic of highly capital-intensive energy infrastructures like geothermal ORCs [18,77], where the Capital Recovery Factor (CRF) mathematically dominates the annual financial obligations. The CEPCI index follows as the second most critical variable, as any direct inflation in raw materials and equipment manufacturing proportionally scales the total fixed capital [73,77]. Conversely, the O&M coefficient exhibits a marginal impact on the LCOE ( ± 2.5 % ), confirming that once the plant is built, the economic viability of the zeotropic mixture is highly resilient to variations in routine maintenance costs [18,77]. Overall, even in the most pessimistic scenarios (high interest rates and elevated CEPCI), the LCOE of the optimized zeotropic mixture remains highly competitive [18,77].

4.4. Operational Resilience Analysis (Off-Design)

To quantify the robustness of the proposed design against the inevitable variations in geothermal resources, an off-design study was conducted [30,68]. Unlike previous sections, where the algorithm sought the best possible design, this phase involved “freezing” the system architecture corresponding to the compromise solution. This means that the heat exchange areas (615 m2) and turbine characteristics were kept constant, simulating the behavior of an already built plant [30].
The methodology involved subjecting the model to a quasi-steady simulation sweep across five thermal intervals. The heat source temperature was reduced from the nominal 150 °C to 130 °C, in steps of 5 °C (150, 145, 140, 135, and 130 °C). The 130 °C limit was selected because it represents the critical threshold at which pure fluids like R245fa begin to exhibit severe exergetic mismatch that compromises evaporation, allowing for a clear comparison of resilience between fluids [9].
The results from this “thermal stress test scenario” confirm the operational superiority of the zeotropic mixture [9,11,30]:
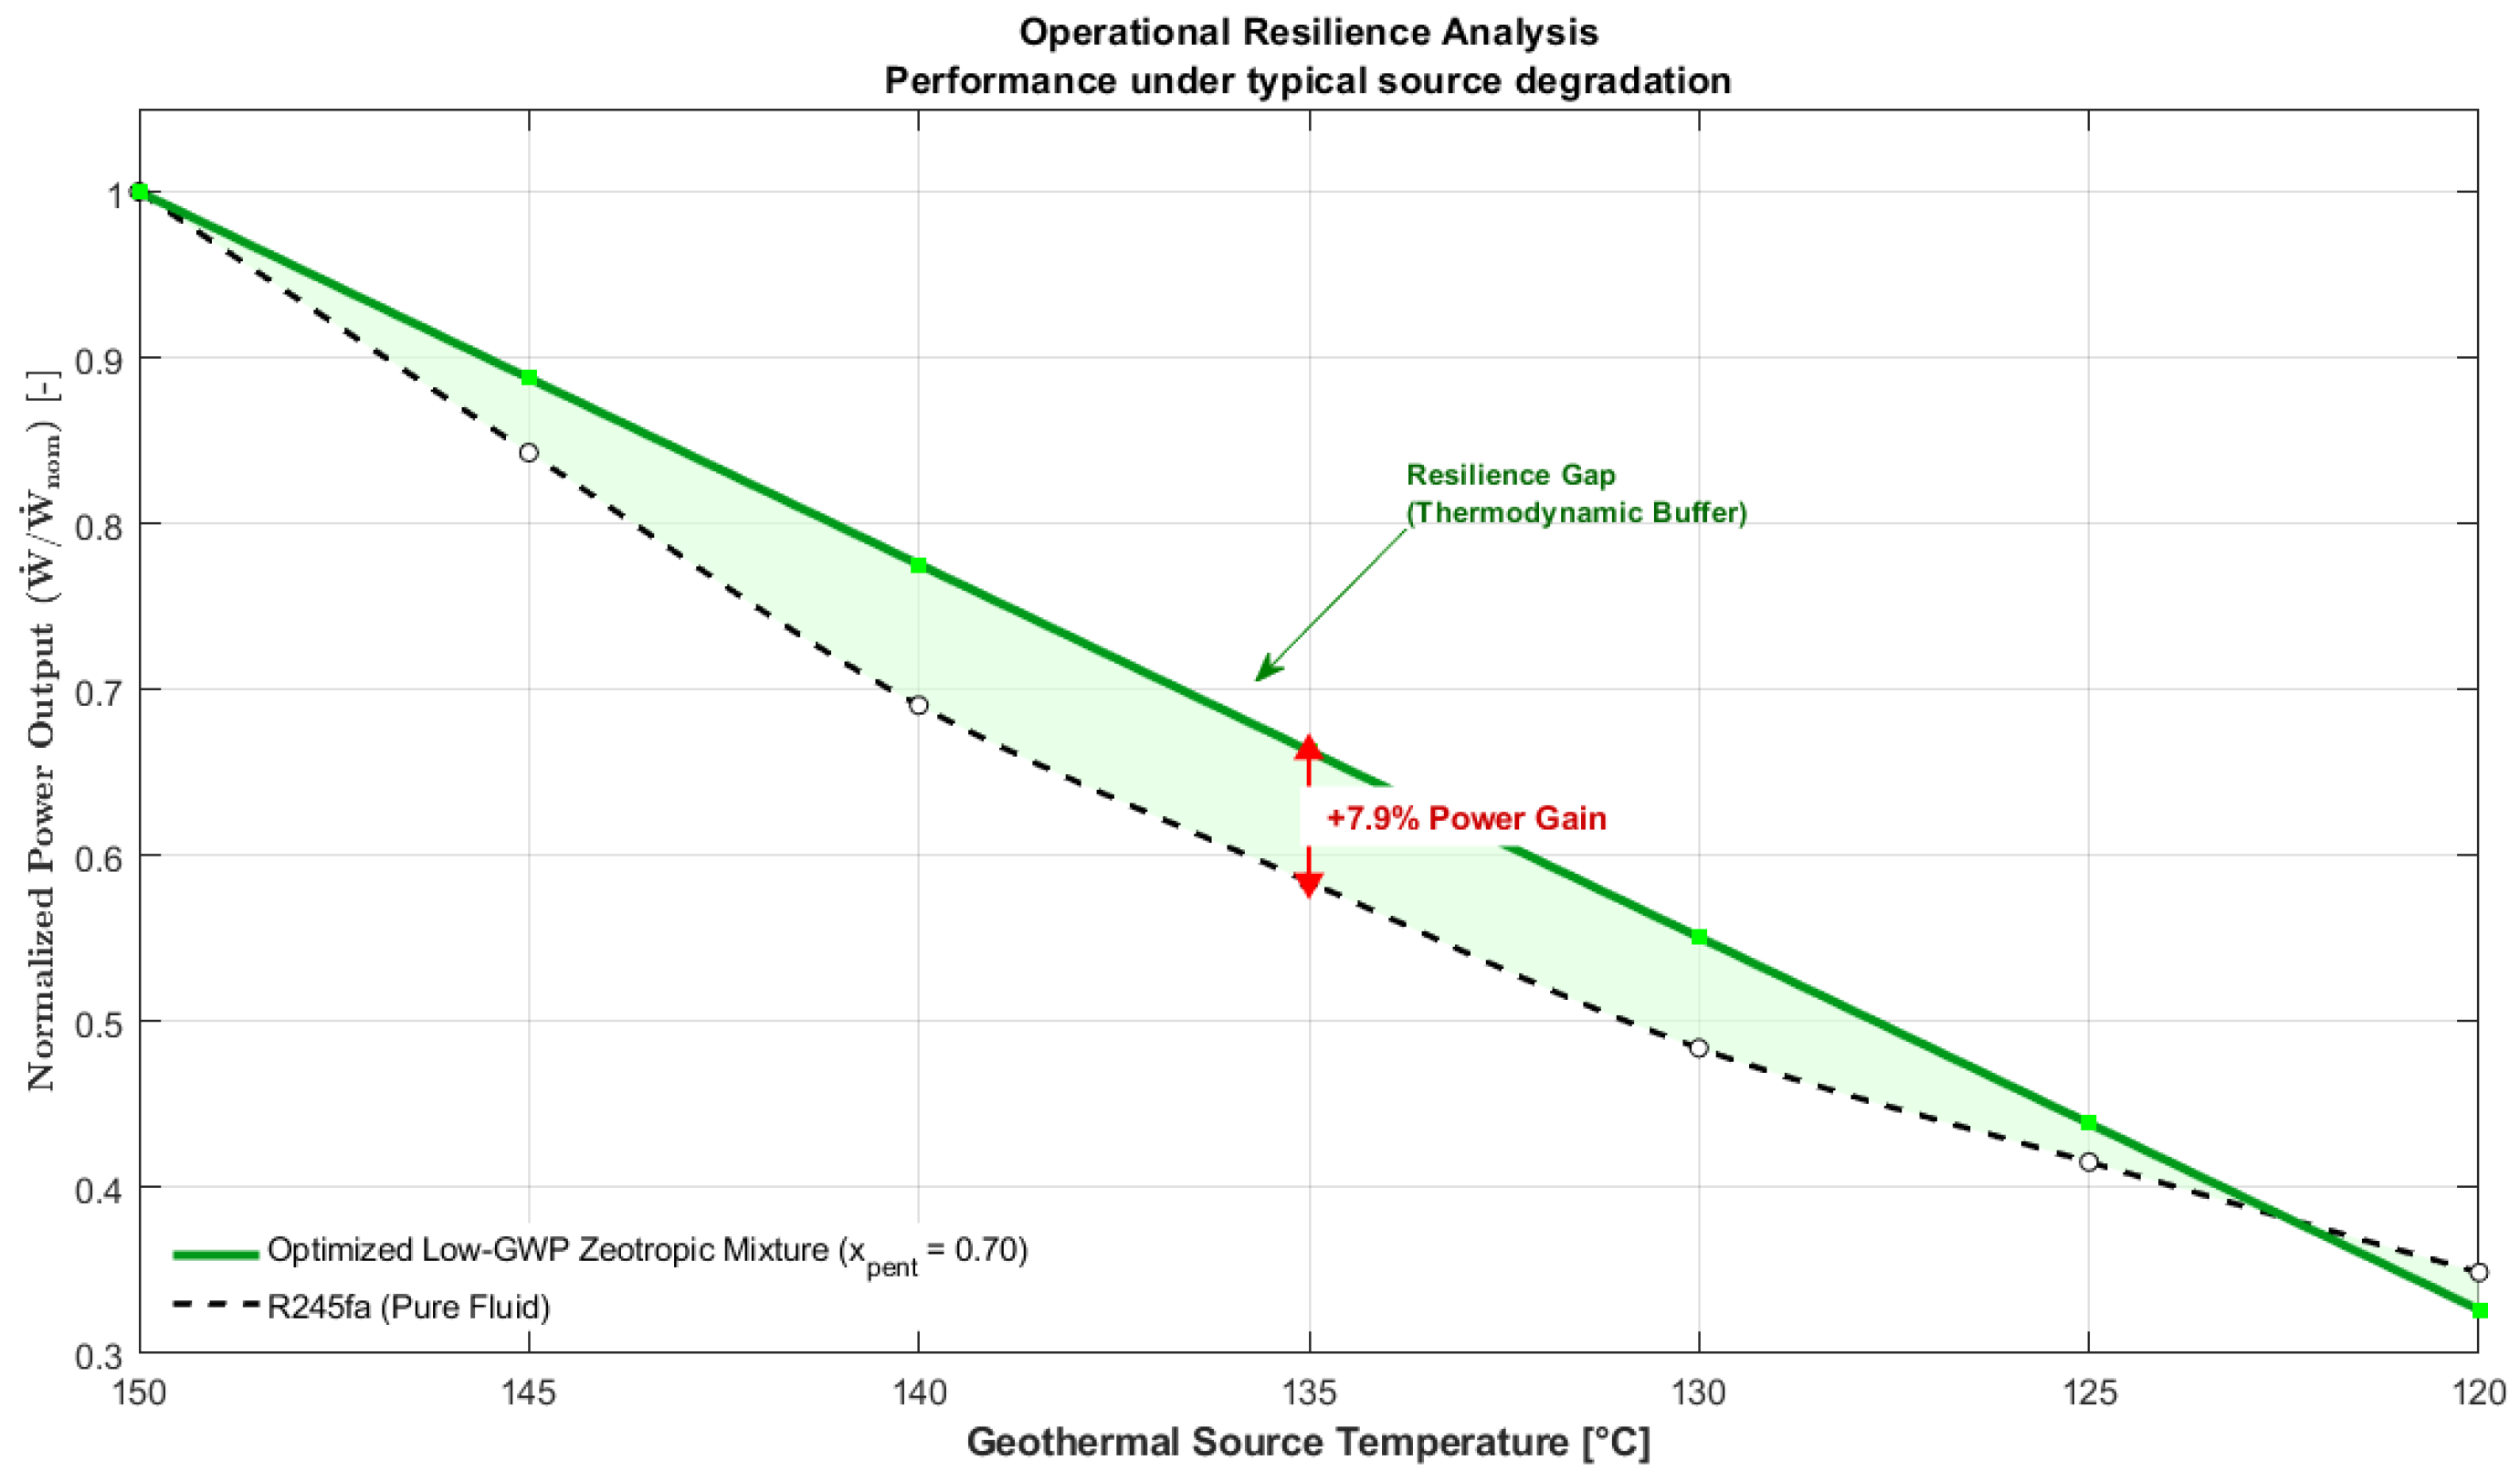
  • R245fa Response: Net power decreased by 52%. Having a fixed saturation temperature, R245fa cannot adapt to the drop in source enthalpy, leading to a significant increase in evaporator irreversibilities and a drop in turbine admission pressure [68].
  • Mixture Response: In contrast, the optimized mixture demonstrated higher load retention, limiting power loss to 45%. This represents an additional 7% production advantage in degraded conditions compared to the industrial standard [30].
This phenomenon is explained by the adaptability of the temperature glide [30,68]. As the brine temperature decreases, the thermal profile of the mixture naturally “adjusts” to the new cooling slope of the heat source. This adjustment capability acts as a passive thermodynamic buffer, allowing the system to maintain higher exergetic utilization without the need to reconfigure control parameters or fluid flow rates [9,30]. In conclusion, the use of the Pentane/Isobutane mixture not only improves nominal performance but also provides greater stability in electricity generation against the thermal depletion of the geothermal well throughout its service life [9,11,30].

4.4.1. Off-Design Simulation Methodology

Unlike the previous optimization, where equipment sizing was variable, in the off-design analysis, the physical geometry of the system components (heat exchange areas and turbine dimensions) is considered fixed and serves as an operational constraint [22,86,87]. This approach simulates the behavior of an actual, already-built plant in response to resource variations. The methodological pillars implemented for this simulation are:
  • Heat Exchangers: It is assumed that the U A value (the product of the overall heat transfer coefficient and the area) calculated at the design point (Point C from the previous section) remains constant. The iterative model recalculates output temperatures based on the effectiveness ε N T U of the existing heat exchanger [22,86,87].
  • Turbine: The turbine no longer operates at a constant efficiency of 85%. A performance map model is used that penalizes the isentropic efficiency based on deviations in the mass flow rate and pressure ratio relative to the nominal values [1,22,86,87].
  • Control Strategy: A Sliding Pressure strategy is adopted, allowing the evaporation pressure to float freely to accommodate changes in the thermal load [87].
It is important to acknowledge a methodological simplification within this off-design simulation. As overall heat transfer coefficients (U) naturally degrade during part-load operations due to varying fluid velocities [71], implementing a dynamic discretized moving-boundary model is currently under development for future studies [22,87].
To address this limitation and quantify the error introduced by the constant (UA) assumption [84,87], a quantitative uncertainty analysis was conducted [22]. The results indicate that a ± 20 % variation in the U value [84] during severe off-design operation [22,30], results in a ± 7 10 % variation in the predicted net power output [87]. Importantly, this error acts systematically on both the baseline pure fluid [19] and the optimized mixture [30]. Therefore, the qualitative conclusion drawn from this analysis—that the zeotropic mixture (Liu & Gao, 2019 [30]) exhibits significantly higher operational resilience and adaptability than R245fa [19,68]—remains robust and unchanged [19,22].

4.4.2. Scenario A: Geothermal Source Degradation

A severe scenario was simulated where the temperature of the geothermal resource drops from 150 °C (design point) to 120 °C (degradation due to prolonged exploitation or lower-quality wells). Although the detailed comparative analysis focuses on the 130 °C threshold (the critical point at which the pure fluid begins to lose operational viability), the simulation sweep was extended to 120 °C to evaluate the system’s behavior under extreme thermal depletion. This is representative of the end-of-service life of a prolonged geothermal operation or the utilization of lower-quality wells [30].
Figure 9 shows the dynamic response of the generated net power operating under a sliding pressure strategy, comparing the sensitivity of the standard fluid against the optimized mixture as the enthalpy of the resource decreases. The low-GWP zeotropic mixture (green line) exhibits a gentler degradation slope than R245fa (gray line), evidencing greater robustness [9,30].
The following analysis of results can be extracted from this graph:
  • Pure Fluid Behavior (R245fa): As the source temperature drops, the fixed boiling point of the pure fluid creates a thermal “bottleneck.” To maintain heat exchange, the evaporation pressure must be drastically reduced, which plummets the vapor density and, consequently, the turbine power. At 130 °C, the R245fa system has lost 52% of its nominal power [30].
  • Low-GWP Zeotropic Mixture Behavior: The mixture shows a greater capability for profile adaptation. As the source temperature is reduced, the mixture’s glide shifts in parallel, maintaining an effective Pinch Point without requiring a reduction in operating pressure as severely. At 130 °C, the mixture limits the power loss to 45%, demonstrating a higher load retention capacity [9,11].
  • Conclusion: The low-GWP zeotropic mixture offers a thermal buffering effect and a net power advantage of ~18% under degraded resource conditions [16,30]. This behavior translates into a longer economic service life for the project, as the plant can operate near its maximum efficiency point for a longer period despite the natural depletion of the reservoir [88]. This operational advantage is critical, as a reduction in power generation not only decreases revenue from electricity sales but can also entail significant economic penalties if production falls below the levels stipulated in Power Purchase Agreements (PPAs) [89].

4.4.3. Scenario B: Seasonal Variability (Ambient Temperature)

The impact of cooling water temperature ( T c w ) was evaluated, ranging from 10 °C (winter) to 35 °C (extreme summer). The results, summarized in Table 10, demonstrate that the mixture is less sensitive to increases in condensation temperature [29,30].
The glide in the condenser allows for more efficient heat evacuation even when the thermal gradient with the environment is reduced [16,18]. This prevents the sharp increases in condensation pressure that adversely affect turbine operation. This characteristic reduces the risks of cavitation and mass flow stagnation, ensuring more stable power generation during thermal demand peaks [90,91].

4.4.4. Limitations of the Quasi-Stationary Resilience Model

To ensure precise terminology, it is imperative to explicitly state the boundaries and limitations of the “resilience” and “thermodynamic buffer” concepts as evaluated in this study. The off-design analysis was executed through a quasi-stationary simulation sweep, meaning it captures consecutive steady-state snapshots of the thermodynamic cycle under varying boundary conditions, rather than solving the differential equations of dynamic transients [22,29,87].
For the evaluation of geothermal source degradation, this quasi-stationary approach is physically highly representative [22,87]. The cooling of a geothermal reservoir is a gradual, macroscopic geological process occurring over years or decades. Under such prolonged timeframes, dynamic phenomena are irrelevant, and the system effectively operates in a continuous state of steady-state adaptation [22].
Conversely, for rapid short-term disturbances—such as diurnal ambient temperature shifts or sudden thermal load variations—real plant operations are heavily governed by transient dynamics [22,29].
The substantial physical thermal inertia of the large shell-and-tube heat exchangers will naturally dampen sudden thermal fluctuations [22]. Furthermore, the mechanical response times of the control valves and feed pumps introduce a temporal delay in reaching the newly predicted optimal thermodynamic states [22].
Consequently, the “resilience” demonstrated by the zeotropic mixture in this study should be strictly interpreted as its asymptotic, steady-state adaptability limit [29,30]. The mixture’s inherent capability to dynamically realign its temperature glide acts as a fundamental thermodynamic buffer [18,30], but future empirical studies involving moving-boundary transient models will be required to fully characterize its instantaneous control stability under rapid disturbances [29].

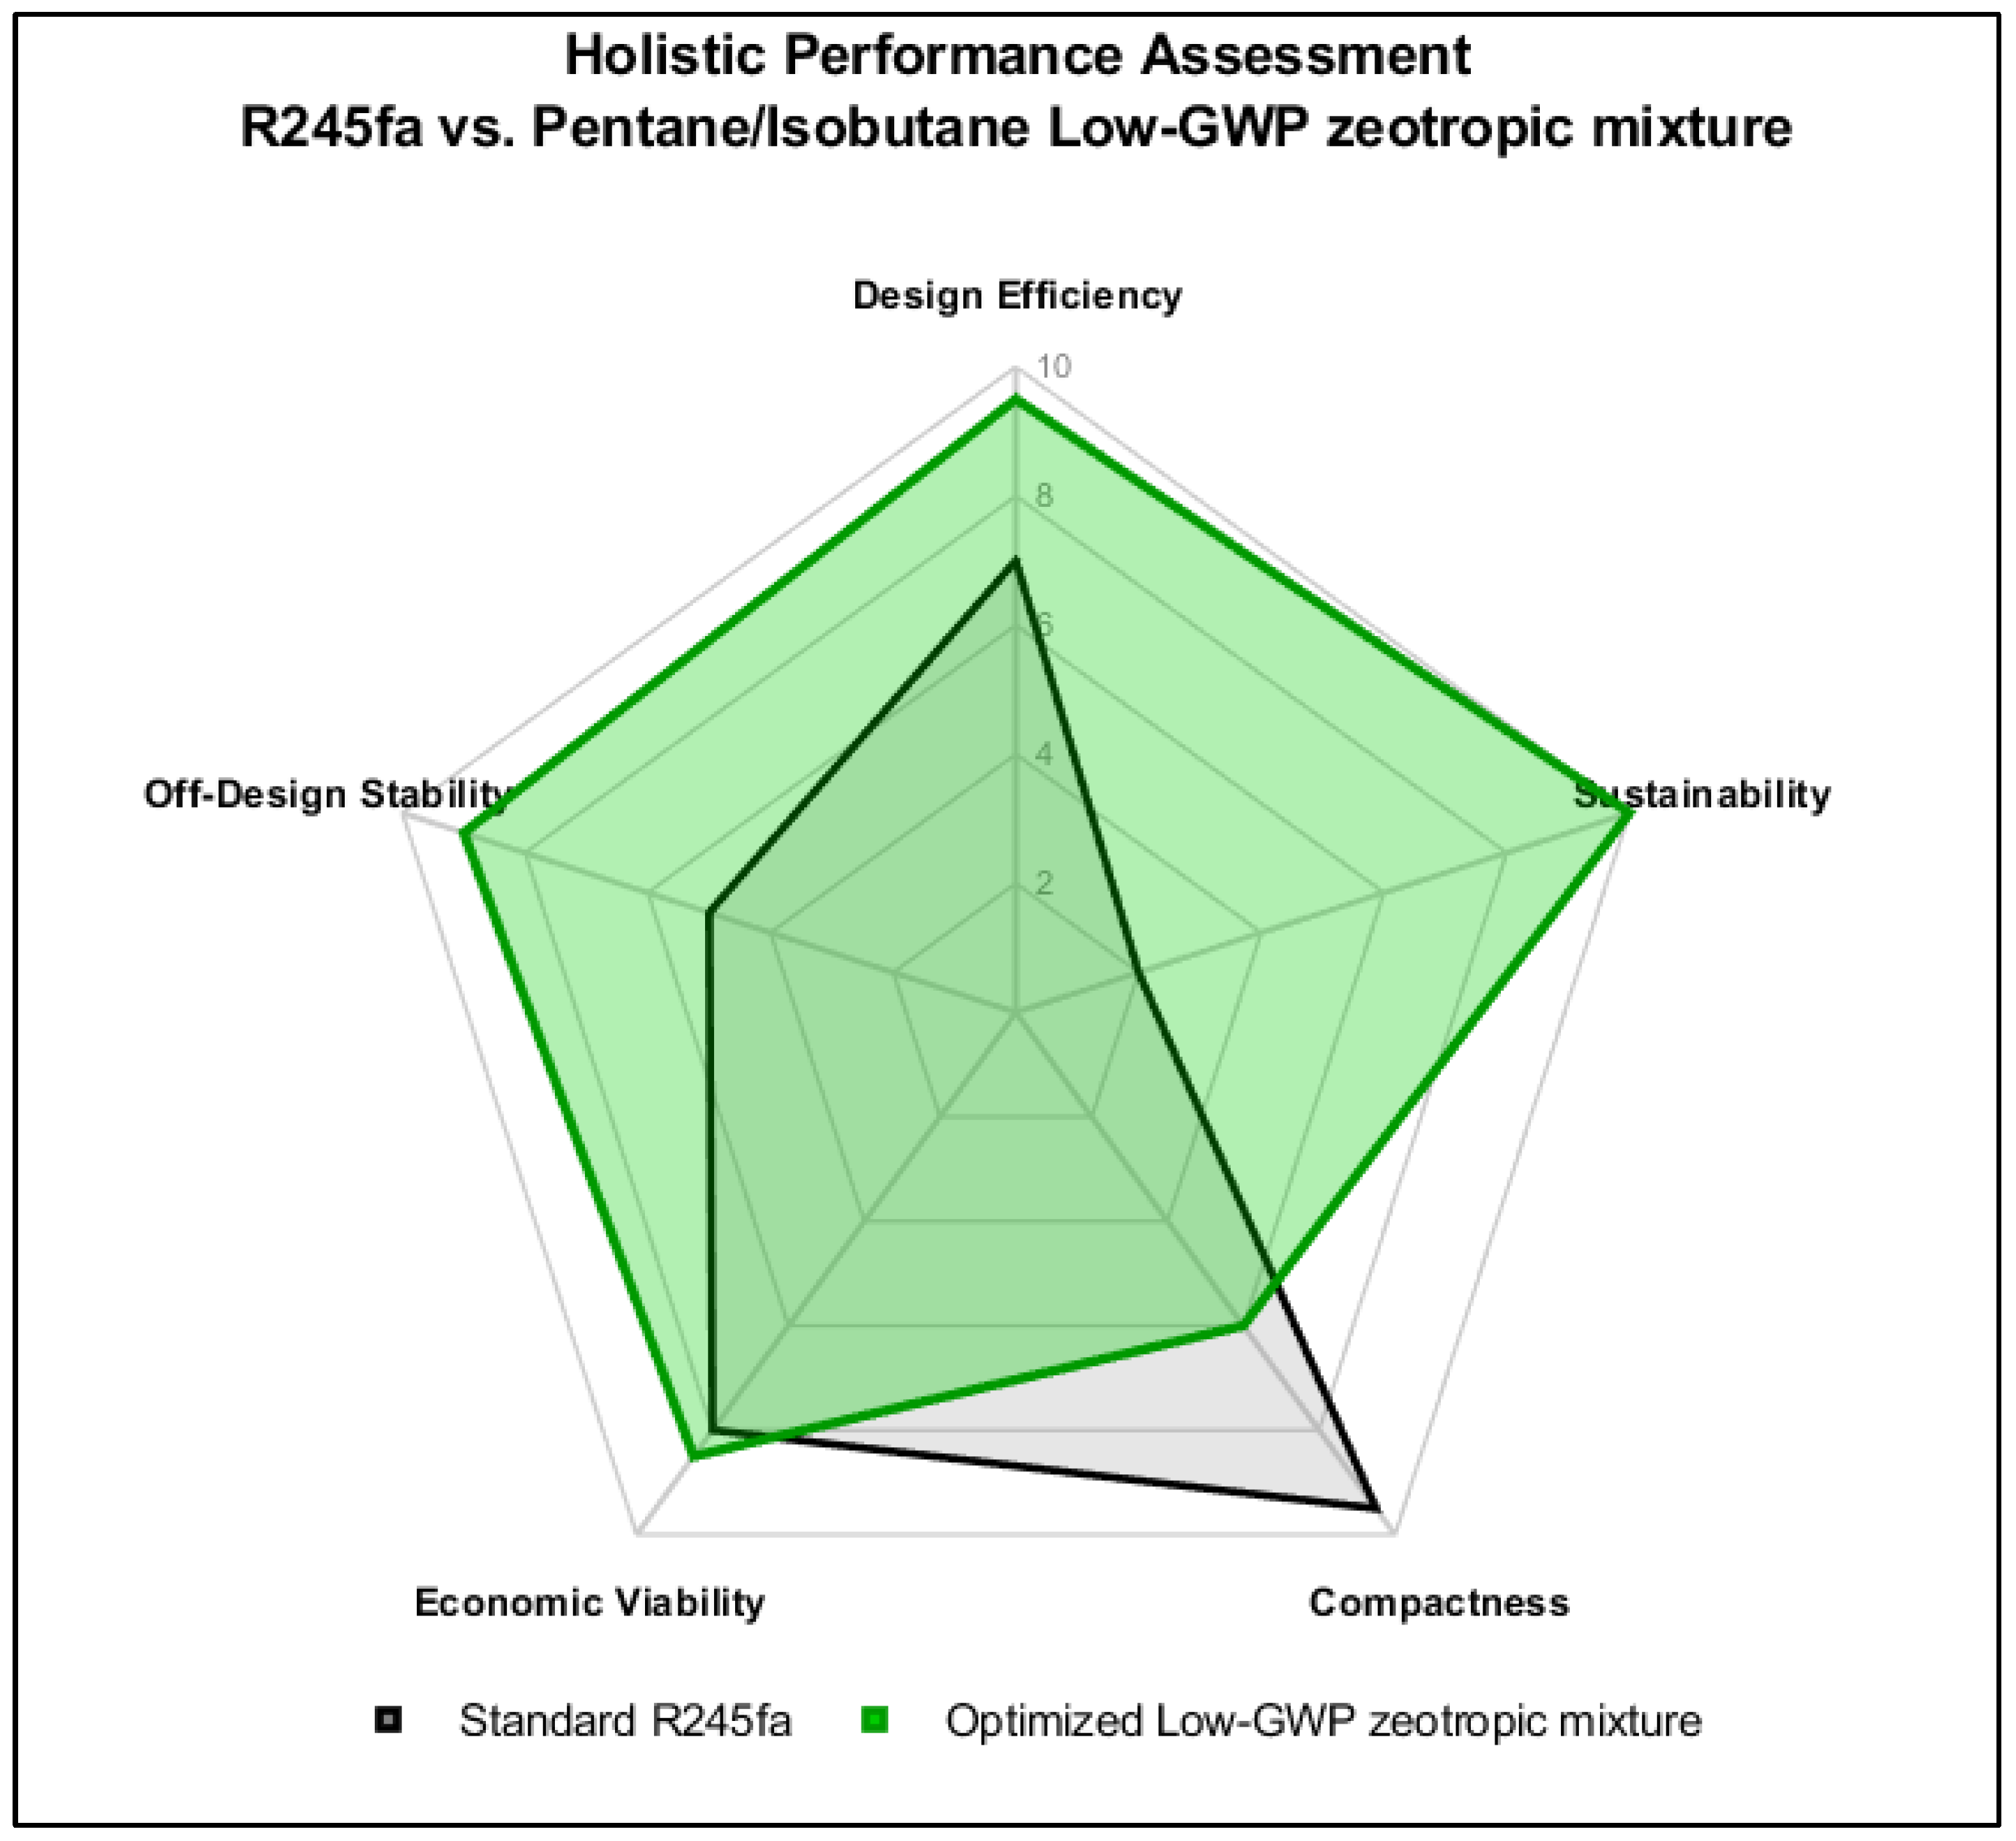
4.4.5. Holistic Evaluation: Radar Chart

To visualize the overall performance of the proposed solution, performance metrics have been integrated into a radar chart (Figure 10) [7,90,91]. The axes are normalized (0 to 100% of the best theoretical value) based on the following criteria: Design Efficiency: Nominal performance [9]; Off-Design Stability: Capacity to maintain power output under disturbances [9,30]; Economic Viability: Inverse of the LCOE (a higher value implies a lower cost) [9,18]; Compactness: Inverse of the required area (a higher value implies smaller equipment) [89,91]; Sustainability: Inverse of GWP and ODP [7,16].
The radar chart clearly reveals the trade-off profile [7,22]. The low-GWP zeotropic mixture (green area) covers a larger performance area, sacrificing only compactness (heat exchange area) in exchange for substantial improvements in stability, efficiency, and environmental sustainability [9,18]. While R245fa stands out only in compactness (requiring smaller heat exchangers due to its high heat transfer coefficient, U) [18], the low-GWP zeotropic mixture dominates in all other critical dimensions [9,16].
This expansion toward stability and sustainability confirms that the initial area penalty is offset by a more robust operation that is more robust with respect to future regulations [7,30,89]. This reduces investment risk and improves the predictability of long-term cash flows [10].

5. Conclusions

This study has addressed the optimal design of low-enthalpy geothermal plants (150 °C) from a holistic perspective, integrating advanced thermodynamics of zeotropic mixtures, rigorous economic evaluation, and, additionally, the analysis of operational resilience. Following the simulation, multi-objective optimization, and cross-validation of the low-GWP binary zeotropic mixture Pentane/Isobutane against the industrial standard (R245fa), several conclusions can be drawn regarding the performance of the proposed solution.
From a thermodynamic standpoint, the results show that zeotropic mixtures offer a thermodynamic advantage over pure fluids, outperforming the simple average of their components. The optimized mixture (70% Pentane/30% Isobutane) exhibits a temperature glide of 9.2 K in the evaporator. This thermal profile allows for a significant reduction in exergy destruction by precisely matching the cooling curve of the geothermal brine.
This improved thermal matching results in a 3.9% increase in net power output compared to R245fa (1445 kW vs. 1391 kW) under identical source conditions. These results are consistent with the improvement trends reported in the literature for glide matching and reduced internal irreversibilities.
Regarding economic viability, the study shows that higher efficiency does not necessarily imply higher profitability, revealing a complex trade-off. While the use of the zeotropic mixture degrades the overall heat transfer coefficient and requires a 28% increase in heat exchanger area (615 m2 vs. 480 m2) and incurs strict capital expenditure penalties associated with ATEX safety protocols, the final LCOE is 9% lower than that of the base fluid (0.051 €/kWh). The substantial increase in annual electricity production more than compensates for the higher CAPEX associated with the equipment, supporting its techno-economic viability.
Regarding operational resilience, the results indicate that plants designed with zeotropic mixtures are intrinsically more robust against external disturbances without the need for complex active control systems. In the event of a geothermal temperature drop from 150 °C to 130 °C, the zeotropic mixture demonstrates superior load retention capacity, limiting power loss to 45%, compared to 52% for R245fa.
The mixture’s glide acts as a passive buffer (representing an asymptotic, steady-state adaptability limit), allowing the cycle to readjust to new thermal conditions with less penalty on evaporation pressure. This results in a net power advantage of approximately 18% in degraded scenarios, positioning low-GWP zeotropic mixtures as the promising technical option for mature geothermal reservoirs or sites with resource quality uncertainty.
Finally, the replacement of HFCs (such as R245fa, GWP = 858) with natural hydrocarbons (GWP < 5) is not only an ecological measure but a regulatory risk mitigation strategy. Given the imminent restrictions on fluorinated gases, this proposal offers a more robust solution under future regulatory constraints. Although the modeling results support the advantages of the mixture, experimental verification is required to address challenges such as safety and composition stability. Future work should prioritize the development of dynamic moving-boundary transient models to fully characterize instantaneous control stability, alongside pilot-scale testing and long-term off-design evaluations to assess the real-world applicability of this technology.

Author Contributions

Conceptualization, J.B.S. and C.M.M.; Methodology, F.D.S. and J.B.S.; Validation, F.D.S. and C.M.M.; Formal analysis, J.B.S. and F.D.S.; Investigation, J.B.S. and C.M.M.; Resources, F.D.S. and C.M.M.; Writing—original draft, F.D.S., J.B.S. and C.M.M.; Writing—Review and Editing, F.D.S., J.B.S. and C.M.M. All authors have read and agreed to the published version of the manuscript.

Funding

This research received no external funding.

Data Availability Statement

The original contributions presented in this study are included in the article. Further inquiries can be directed to the corresponding author.

Conflicts of Interest

The authors declare no conflict of interest.

Nomenclature

Acronyms
AcronymDefinition
ATEXExplosive Atmospheres
GWPGlobal Warming Potential
HCHydrocarbon
HFCHydrofluorocarbon
LCOELevelized Cost of Energy
LMTDLogarithmic Mean Temperature Difference
MAPEMean Absolute Percentage Error
NSGA-IINon-dominated Sorting Genetic Algorithm II
ODPOzone Depletion Potential
ORCOrganic Rankine Cycle
PPAPower Purchase Agreement
RMSDRoot Mean Square Deviation
SICSpecific Investment Cost
VCCVapor Compression Cycle
Symbols
SymbolDefinitionUnit
AHeat transfer aream2
CCost
C b m Bare module cost (Cost of equipment plus materials and direct installation.)
C i n v Total Investment Cost
CpSpecific heat capacity J/(kg·K)
E ˙ Exergy ratekW
HSpecific enthalpy kJ/kg
m ˙ Mass flow ratekg/s
NNumber of discretization segments -
PPressure bar/Pa
Heat transfer ratekW
SSpecific entropy kJ/(kg·K)
TTemperature °C/K
UOverall heat transfer coefficient W/(m2·K)
UAOverall thermal conductance (U-value multiplied by Area)W/K
W ˙ Power/Work rate kW
xVapor quality or Mass fraction -
Greek Symbols
SymbolDefinitionUnit
Δ T p p Pinch Point temperature difference K
Δ T g l i d e Temperature glide K
ε Specific exergy kJ/kg
η e x Exergetic efficiency %
η t h Thermal efficiency %
η i s Isentropic efficiency %
ρ Density k g / m 3
Subscripts
SubscriptDefinition
0Dead state (T0 = 25 °C, P0 = 1 bar)
condCondenser
critCritical point
evapEvaporator
geoGeothermal source
iDiscretization segment index or General state point
inInlet
limitLimit condition for reinjection
mixMixture
netNet value
outOutlet
PpPinch Point
sIsentropic process
wfWorking fluid

References

  1. Ilojianya, V.I.; Umoh, A.A.; Etukudoh, E.A.; Ibekwe, K.I.; Hamdan, A. Renewable energy technologies in engineering: A review of current developments and future prospects. Int. J. Sci. Res. Arch. 2024, 11, 952–964. [Google Scholar] [CrossRef]
  2. Datta, S.S.; Battiato, I.; Fernø, M.A.; Juanes, R.; Parsa, S.; Prigiobbe, V.; Santanach-Carreras, E.; Song, W.; Biswal, S.L.; Sinton, D. Lab on a chip for a low-carbon future. Lab Chip 2023, 23, 1358–1375. [Google Scholar] [CrossRef]
  3. Canales, F.A.; Jurasz, J.; Beluco, A. A geothermal hydro wind PV hybrid system with energy storage in an extinct volcano for 100% renewable supply in Ometepe, Nicaragua. arXiv 2022. [Google Scholar] [CrossRef]
  4. Guo, T.; Wang, H.; Zhang, S. Comparative analysis of natural and conventional working fluids for use in transcritical Rankine cycle using low-temperature geothermal source. Int. J. Energy Res. 2011, 35, 530–544. [Google Scholar] [CrossRef]
  5. Pastor-Martinez, E.; Rubio-Maya, C.; Ambriz-Díaz, V.M.; Belman-Flores, J.M.; Pacheco-Ibarra, J.J. Energetic and exergetic performance comparison of different polygeneration arrangements utilizing geothermal energy in cascade. Energy Convers. Manag. 2018, 168, 252–269. [Google Scholar] [CrossRef]
  6. Bao, J.; Zhao, L. A review of working fluid and expander selections for organic Rankine cycle. Renew. Sustain. Energy Rev. 2013, 24, 325–342. [Google Scholar] [CrossRef]
  7. Sánchez, F.D.; Salvador, J.B.; Montes, C.M. Organic Rankine Cycle System Review: Thermodynamic Configurations, Working Fluids, and Future Challenges in Low-Temperature Power Generation. Energies 2025, 18, 6561. [Google Scholar] [CrossRef]
  8. Ismail, B.I. Renewable Geothermal Energy Explorations; IntechOpen: Rijeka, Croatia, 2019. [Google Scholar] [CrossRef]
  9. Gonidaki, D.; Bellos, E. Performance investigation of geothermal driven organic Rankine cycles with zeotropic mixtures and partial evaporation. Therm. Sci. Eng. Prog. 2025, 61, 103539. [Google Scholar] [CrossRef]
  10. Noguera, A.L.G.; Castellanos, L.S.M.; Pedraza-Corzo, H.D.; Rua, D.J.; Lora, E.E.S.; Cobas, V.R.M. Comprehensive methodology for the integrating of the Organic Rankine Cycle-ORC with Diesel generators in Off-Grid areas: Application to a Colombian case study. Clean. Eng. Technol. 2024, 23, 100828. [Google Scholar] [CrossRef]
  11. Song, J.; Gu, C.-W. Analysis of ORC (Organic Rankine Cycle) systems with pure hydrocarbons and mixtures of hydrocarbon and retardant for engine waste heat recovery. Appl. Therm. Eng. 2015, 89, 693–702. [Google Scholar] [CrossRef]
  12. Linke, P.; Papadopoulos, A.I.; Seferlis, P. Systematic Methods for Working Fluid Selection and the Design, Integration and Control of Organic Rankine Cycles—A Review. Energies 2015, 8, 4755–4801. [Google Scholar] [CrossRef]
  13. Heberle, F.; Bassermann, P.; Preißinger, M.; Brüggemann, D. Exergoeconomic optimization of an Organic Rankine Cycle for low-temperature geothermal heat sources. Int. J. Thermodyn. 2012, 15, 119–126. [Google Scholar] [CrossRef]
  14. Cano, N.A.; Céspedes, S.; Redondo, J.; Foo, G.; Jaramillo, D.; Martinez, D.; Gutiérrez, M.; Pataquiba, J.; Rojas, J.; Cortés, F.B.; et al. Power from Geothermal Resources as a Co-product of the Oil and Gas Industry: A Review. ACS Omega 2022, 7, 40603–40624. [Google Scholar] [CrossRef]
  15. Aryanfar, Y.; Akhsheej, A.; Sheykh, K.A.; Ghasemlou, S.M.; Alcaraz, J.L.G. Modeling and analysis of a two-stage ORC for recovering waste heat of single flash geothermal cycle. CT&F-Cienc. Tecnol. Futuro 2021, 11, 51–62. [Google Scholar] [CrossRef]
  16. Heberle, F.; Preißinger, M.; Brüggemann, D. Zeotropic mixtures as working fluids in Organic Rankine Cycles for low-enthalpy geothermal resources. Renew. Energy 2012, 37, 364–370. [Google Scholar] [CrossRef]
  17. Dawo, F.; Fleischmann, J.; Kaufmann, F.; Schifflechner, C.; Eyerer, S.; Wieland, C.; Spliethoff, H. R1224yd(Z), R1233zd(E) and R1336mzz(Z) as replacements for R245fa: Experimental performance, interaction with lubricants and environmental impact. Appl. Energy 2021, 288, 116661. [Google Scholar] [CrossRef]
  18. Andreasen, J.G.; Baldasso, E.; Kærn, M.R.; Weith, T.; Heberle, F.; Brüggemann, D.; Haglind, F. Techno-economic feasibility analysis of zeotropic mixtures and pure fluids for organic Rankine cycle systems. Appl. Therm. Eng. 2021, 192, 116791. [Google Scholar] [CrossRef]
  19. Gonidaki, D.; Bellos, E.; Kaldellis, J.K. Design and dynamic simulation of a solar-driven organic Rankine cycle with zeotropic mixture. Sol. Energy 2025, 301, 113948. [Google Scholar] [CrossRef]
  20. Tammone, C. Two-Phase Expansion in Turbo-Expanders for Organic Rankine Cycle Power Systems; Technical University of Denmark: Kongens Lyngby, Denmark, 2023. [Google Scholar]
  21. Hu, S.; Yang, Z.; Li, J.; Duan, Y. A Review of Multi-Objective Optimization in Organic Rankine Cycle (ORC) System Design. Energies 2021, 14, 6492. [Google Scholar] [CrossRef]
  22. Li, X.; Xu, B.; Tian, H.; Shu, G. Towards a novel holistic design of organic Rankine cycle (ORC) systems operating under heat source fluctuations and intermittency. Renew. Sustain. Energy Rev. 2021, 147, 111207. [Google Scholar] [CrossRef]
  23. Dickes, R.; Dumont, O.; Daccord, R.; Quoilin, S.; Lemort, V. Modelling of organic Rankine cycle power systems in off-design conditions: An experimentally-validated comparative study. Energy 2017, 123, 710–727. [Google Scholar] [CrossRef]
  24. Toujani, N.; Bouaziz, N.; Kairouani, L. Performance Analysis of a New Combined Organic Rankine Cycle and Vapor Compression Cogeneration and Tri-Generation and Water Desalination. In Electrodialysis; IntechOpen: London, UK, 2020. [Google Scholar] [CrossRef][Green Version]
  25. Chys, M.; van den Broek, M.; Vanslambrouck, B.; De Paepe, M. Potential of zeotropic mixtures as working fluids in organic Rankine cycles. Energy 2012, 44, 623–632. [Google Scholar] [CrossRef]
  26. Imran, M.; Park, B.S.; Kim, H.J.; Lee, D.H.; Usman, M.; Heo, M. Thermo-economic optimization of Regenerative Organic Rankine Cycle for waste heat recovery applications. Energy Convers. Manag. 2014, 87, 107–118. [Google Scholar] [CrossRef]
  27. Zare, V. A comparative exergoeconomic analysis of different ORC configurations for binary geothermal power plants. Energy Convers. Manag. 2015, 105, 127–138. [Google Scholar] [CrossRef]
  28. Wang, S.; Liu, C.; Zhang, S.; Li, Q.; Huo, E. Multi-objective optimization and fluid selection of organic Rankine cycle (ORC) system based on economic-environmental-sustainable analysis. Energy Convers. Manag. 2022, 254, 115238. [Google Scholar] [CrossRef]
  29. Miao, Z.; Zhang, Y.; Yan, P.; Xu, J. Dynamic modeling and control strategy of an organic Rankine cycle with concentration regulation of the zeotropic mixture working fluid. Energy 2025, 335, 138093. [Google Scholar] [CrossRef]
  30. Liu, C.; Gao, T. Off-design performance analysis of basic ORC, ORC using zeotropic mixtures and composition-adjustable ORC under optimal control strategy. Energy 2019, 171, 95–108. [Google Scholar] [CrossRef]
  31. Serafino, A.; Obert, B.; Vergé, L.; Cinnella, P. Robust optimization of an organic Rankine cycle for geothermal application. Renew. Energy 2020, 161, 1120–1129. [Google Scholar] [CrossRef]
  32. Guzović, Z.; Medić, Z.B.; Budanko, M. Effect of Working Fluid on Characteristics of Organic Rankine Cycle with Medium Temperature Geothermal Water. Energies 2025, 18, 1699. [Google Scholar] [CrossRef]
  33. Fiaschi, D.; Manfrida, G.; Rogai, E.; Talluri, L. Exergoeconomic analysis and comparison between ORC and Kalina cycles to exploit low and medium-high temperature heat from two different geothermal sites. Energy Convers. Manag. 2017, 154, 503–516. [Google Scholar] [CrossRef]
  34. Ambriz-Díaz, V.M.; Rubio-Maya, C.; Chávez, O.; Ruiz-Casanova, E.; Pastor-Martínez, E. Thermodynamic performance and economic feasibility of Kalina, Goswami and Organic Rankine Cycles coupled to a polygeneration plant using geothermal energy of low-grade temperature. Energy Convers. Manag. 2021, 243, 114362. [Google Scholar] [CrossRef]
  35. Chatzopoulou, M.A.; Lecompte, S.; De Paepe, M.; Markides, C.N. Off-design optimisation of organic Rankine cycle (ORC) engines with different heat exchangers and volumetric expanders in waste heat recovery applications. Appl. Energy 2019, 253, 113442. [Google Scholar] [CrossRef]
  36. Zhang, H.; Guan, X.; Ding, Y.; Liu, C. Emergy analysis of Organic Rankine Cycle (ORC) for waste heat power generation. J. Clean. Prod. 2018, 183, 1207–1215. [Google Scholar] [CrossRef]
  37. Dalbakken, H.; Ertesvåg, I.S. Safety aspects of Organic Rankine Cycles (ORC) with combustible working fluid and sub-ambient condenser pressure. Energy Rep. 2023, 11, 877–886. [Google Scholar] [CrossRef]
  38. Algieri, A. Energy Exploitation of High-Temperature Geothermal Sources in Volcanic Areas—A Possible ORC Application in Phlegraean Fields (Southern Italy). Energies 2018, 11, 618. [Google Scholar] [CrossRef]
  39. Miao, Z.; Li, Z.; Zhang, K.; Xu, J.; Cheng, Y. Selection criteria of zeotropic mixtures for subcritical organic Rankine cycle based on thermodynamic and thermo-economic analysis. Appl. Therm. Eng. 2020, 180, 115837. [Google Scholar] [CrossRef]
  40. Song, J.; Loo, P.; Teo, J.; Markides, C.N. Thermo-Economic Optimization of Organic Rankine Cycle (ORC) Systems for Geothermal Power Generation: A Comparative Study of System Configurations. Front. Energy Res. 2020, 8, 6. [Google Scholar] [CrossRef]
  41. Igbong, D.I.; Nyong, O.; Enyia, J.D.; Oluwadare, B.S.; Obhua, M. Exergoeconomic Evaluation and Optimization of Dual Pressure Organic Rankine Cycle (ORC) for Geothermal Heat Source Utilization. J. Power Energy Eng. 2021, 9, 19. [Google Scholar] [CrossRef]
  42. Xu, B.; Rathod, D.; Yebi, A.; Onori, S.; Filipi, Z.; Hoffman, M. A comparative analysis of dynamic evaporator models for organic Rankine cycle waste heat recovery systems. Appl. Therm. Eng. 2020, 165, 114576. [Google Scholar] [CrossRef]
  43. Markides, C.N.; Bardow, A.; De Paepe, M.; De Servi, C.; Groß, J.; Haslam, A.J.; Lecompte, S.; Papadopoulos, A.I.; Oyewunmi, O.A.; Seferlis, P.; et al. Working fluid and system optimisation of organic Rankine cycles via computer-aided molecular design: A review. Prog. Energy Combust. Sci. 2024, 107, 101201. [Google Scholar] [CrossRef]
  44. Aryal, S.; Jeong, K. Analytical modeling of simultaneous phase transitions in a low-temperature evaporator for a pilot-scale Organic Rankine Cycle using R134a: A comparative study with water coolant. Int. J. Heat Fluid Flow 2024, 112, 109685. [Google Scholar] [CrossRef]
  45. Chowdhury, J.I.; Nguyen, B.K.; Thornhill, D. Dynamic model of supercritical Organic Rankine Cycle waste heat recovery system for internal combustion engine. Int. J. Automot. Technol. 2017, 18, 589–601. [Google Scholar] [CrossRef]
  46. Galuppo, F.; Reiche, T.; Lemort, V.; Dufour, P.; Nadri, M. Organic Rankine Cycle based waste heat recovery modeling and control of the low pressure side using direct condensation and dedicated fans. Energy 2021, 216, 119074. [Google Scholar] [CrossRef]
  47. Ren, X.; Yu, M.; Zhao, X.; Li, J.; Zheng, S.; Chen, F.; Wang, Z.; Zhou, J.; Pei, G.; Ji, J. Assessment of the cost reduction potential of a novel loop-heat-pipe solar photovoltaic/thermal system by employing the distributed parameter model. Energy 2020, 190, 116338. [Google Scholar] [CrossRef]
  48. Delgado, L.M.M.; Ayala, G.R.C.; Mendiburu, A.Z. Technical-economic evaluation of application scenarios of an Organic Rankine Cycle (ORC) as a solution to the cogeneration deficit in a sugar plant. Energy 2024, 313, 133785. [Google Scholar] [CrossRef]
  49. Tammone, C.; Pili, R.; Indrehus, S.; Haglind, F. Techno-Economic Analysis of the Partial Evaporation Organic Rankine Cycle Systems for Geothermal Applications. In Proceedings of the 6th International Seminar on ORC Power Systems; Technical University of Munich: Munich, Germany, 2021. [Google Scholar]
  50. Assareh, E.; Delpisheh, M.; Baldinelli, A.; Cinti, G.; Emami, H.; Lee, M. Integration of Geothermal-Driven Organic Rankine Cycle with a PEM Electrolyzer for the production of green hydrogen and electricity. Environ. Sci. Pollut. Res. Int. 2023, 30, 54723–54741. [Google Scholar] [CrossRef] [PubMed]
  51. Fierro, J.J.; Escudero-Atehortua, A.; Nieto-Londoño, C.; Giraldo, M.; Jouhara, H.; Wrobel, L.C. Evaluation of waste heat recovery technologies for the cement industry. Int. J. Thermofluids 2020, 7–8, 100040. [Google Scholar] [CrossRef]
  52. Zhao, D.; Deng, S.; Zhao, L.; Xu, W.; Wang, W.; Nie, X.; Chen, M. Overview on artificial intelligence in design of Organic Rankine Cycle. Energy AI 2020, 1, 100011. [Google Scholar] [CrossRef]
  53. Ghasemian, E.; Ehyaei, M.A. Evaluation and optimization of organic Rankine cycle (ORC) with algorithms NSGA-II, MOPSO, and MOEA for eight coolant fluids. Int. J. Energy Environ. Eng. 2017, 9, 39–57. [Google Scholar] [CrossRef]
  54. Deb, K.; Pratap, A.; Agarwal, S.; Meyarivan, T. A fast and elitist multiobjective genetic algorithm: NSGA-II. IEEE Trans. Evol. Comput. 2002, 6, 182–197. [Google Scholar] [CrossRef]
  55. Trautmann, H.; Ligges, U.; Mehnen, J.; Preuss, M. A Convergence Criterion for Multiobjective Evolutionary Algorithms Based on Systematic Statistical Testing. In International Conference on Parallel Problem Solving from Nature; Lecture Notes in Computer Science; Springer: Berlin/Heidelberg, Germany, 2008; pp. 825–836. [Google Scholar] [CrossRef]
  56. Li, M.; Yang, S.; Liu, X. Diversity Comparison of Pareto Front Approximations in Many-Objective Optimization. IEEE Trans. Cybern. 2014, 44, 2568–2584. [Google Scholar] [CrossRef] [PubMed]
  57. Tian, Y.; Cheng, R.; Zhang, X.; Li, M.; Jin, Y. Diversity Assessment of Multi-Objective Evolutionary Algorithms: Performance Metric and Benchmark Problems [Research Frontier]. IEEE Comput. Intell. Mag. 2019, 14, 61–74. [Google Scholar] [CrossRef]
  58. Asim, M.; Kashif, F.; Umer, J.; Alvi, J.Z.; Imran, M.; Khan, S.; Zia, A.W.; Leung, M.K.H. Performance Assessment and Working Fluid Selection for Novel Integrated Vapor Compression Cycle and Organic Rankine Cycle for Ultra Low Grade Waste Heat Recovery. Sustainability 2021, 13, 11592. [Google Scholar] [CrossRef]
  59. Wang, Z.; Guan, W.; Zhang, S.; Sang, H.; Que, W.; Liang, L. Multi-objective optimization of the organic Rankine cycle cascade refrigeration cycle driven by sugar mills waste heat. Front. Energy Res. 2024, 12, 1308519. [Google Scholar] [CrossRef]
  60. Keshtkar, M.M. Multi-objective optimization of a r744/r134a cascade refrigeration system: Exergetic, economic, environmental, and sensitive analysis (3ES). J. Therm. Eng. 2019, 5, 237–250. [Google Scholar] [CrossRef]
  61. Megdouli, K.; Gholizadeh, T.; Tashtoush, B.; Cinnella, P.; Skorek-Osikowska, A. Optimization of carbon dioxide ejector expansion transcritical refrigeration system with ANOVA and NSGA-II. Int. J. Refrig. 2023, 158, 173–189. [Google Scholar] [CrossRef]
  62. Kumar, A.; Rakshit, D. A critical review on waste heat recovery utilization with special focus on Organic Rankine Cycle applications. Clean. Eng. Technol. 2021, 5, 100292. [Google Scholar] [CrossRef]
  63. Hærvig, J.; Sørensen, K.; Condra, T. Guidelines for optimal selection of working fluid for an organic Rankine cycle in relation to waste heat recovery. Energy 2016, 96, 592–602. [Google Scholar] [CrossRef]
  64. Asim, M.; Khan, S.; Khan, S.A.; Baig, T.; Imran, M.; Zia, A.W.; Riaz, F.; Leung, M.K. Thermal Analysis and Optimal Fluid Selection for the Novel Integrated Vapor Compression Cycle and ORC System for Ultra-Low Grade Waste Heat Recovery Using the Desuperheating Method. Energy Nexus 2024, 17, 100357. [Google Scholar] [CrossRef]
  65. Petrollese, M.; Dickes, R.; Lemort, V. Experimentally-validated models for the off-design simulation of a medium-size solar organic Rankine cycle unit. Energy Convers. Manag. 2020, 224, 113307. [Google Scholar] [CrossRef]
  66. Eftekharï, B.; Alïehyaeï, M. Optimization of a new configuration of power tri-generation cycle by the use of a multi-purpose genetic algorithm. J. Therm. Eng. 2020, 6, 65. [Google Scholar] [CrossRef]
  67. He, C.; Liu, C.; Gao, H.; Xie, H.; Li, Y.; Wu, S.; Xu, J. The optimal evaporation temperature and working fluids for subcritical organic Rankine cycle. Energy 2012, 38, 136–143. [Google Scholar] [CrossRef]
  68. Modi, A.; Haglind, F. A review of recent research on the use of zeotropic mixtures in power generation systems. Energy Convers. Manag. 2017, 138, 603–626. [Google Scholar] [CrossRef]
  69. Rowshanaie, O.; Tohir, M.Z.M.; Rowshanaie, H. Refinery Boiler Flue Gas Evaluation on Assessed Subcritical Organic Rankine Cycle (SORC) by Applying R1234ze(E), R1234yf, and R134a Pure and Zeotropic Mixtures. Heat Transf. 2025, 55, 846–876. [Google Scholar] [CrossRef]
  70. Lecompte, S.; Ameel, B.; Ziviani, D.; Van den Broek, M.; De Paepe, M. Exergy analysis of zeotropic mixtures as working fluids in Organic Rankine Cycles. Energy Convers. Manag. 2014, 85, 727–739. [Google Scholar] [CrossRef]
  71. Zühlsdorf, B.; Jensen, J.K.; Elmegaard, B. Exergy-based analysis of irreversibilities for heat pump working fluids and cycle layouts. Int. J. Exergy 2021, 35, 173–194. [Google Scholar] [CrossRef]
  72. Bolaji, B.O.; Bolaji, D.O.; Amosun, S.T. Energy and cooling performance of carbon-dioxide and hydrofluoroolefins blends as eco-friendly substitutes for R410A in air-conditioning systems. Mech. Eng. Soc. Ind. 2022, 3, 35–46. [Google Scholar] [CrossRef]
  73. Prajapati, P.; Patel, V.; Raja, B.D.; Jouhara, H. Energy-exergy-economic-environmental (4E) analysis and multi-objective optimization of a cascade refrigeration system. Therm. Sci. Eng. Prog. 2024, 54, 102793. [Google Scholar] [CrossRef]
  74. Ahmadi, M.H.; Ahmadi, M.-A.; Feidt, M. Thermodynamic analysis and evolutionary algorithm based on multi-objective optimization of performance for irreversible four-temperature-level refrigeration. Mech. Ind. 2015, 16, 207. [Google Scholar] [CrossRef]
  75. Bahrami, H.-R.; Rosen, M.A. Exergoeconomic evaluation and multi-objective optimization of a novel geothermal-driven zero-emission system for cooling, electricity, and hydrogen production: Capable of working with low-temperature resources. Geotherm. Energy 2024, 12, 12. [Google Scholar] [CrossRef]
  76. Turgut, M.S.; Turgut, O.E. An oppositional Salp Swarm: Jaya algorithm for thermal design optimization of an Organic Rankine Cycle. SN Appl. Sci. 2021, 3, 224. [Google Scholar] [CrossRef]
  77. Pan, J.; Cao, Q.; Li, Y.; Hu, T.; Li, R. Energy, exergy, economic, exergoeconomic and exergoenvironmental (5E) analysis and optimization of a novel combined system integrating Allam cycle, air separation, ORC and carbon capture driven by LNG cold energy. Appl. Therm. Eng. 2025, 270, 126225. [Google Scholar] [CrossRef]
  78. Asadabadi, M.J.R.; Rad, S.H.; Taraghi, M.; Moghimi, M.; Ahmadi, R. ANN-boosted optimization and performance evaluation of a hybrid solar-geothermal high temperature cascaded ORC for electricity, liquid hydrogen, freshwater, and cooling purposes. Appl. Therm. Eng. 2024, 262, 125251. [Google Scholar] [CrossRef]
  79. Zinsalo, J.M.; Lamarche, L.; Raymond, J. Performance analysis and working fluid selection of an Organic Rankine Cycle Power Plant coupled to an Enhanced Geothermal System. Energy 2022, 245, 123259. [Google Scholar] [CrossRef]
  80. Wang, L.; Bu, X.; Li, H. Multi-objective optimization and off-design evaluation of organic rankine cycle (ORC) for low-grade waste heat recovery. Energy 2020, 203, 117809. [Google Scholar] [CrossRef]
  81. Hu, S.; Li, J.; Yang, F.; Yang, Z.; Duan, Y. How to design organic Rankine cycle system under fluctuating ambient temperature: A multi-objective approach. Energy Convers. Manag. 2020, 224, 113331. [Google Scholar] [CrossRef]
  82. Saleh, B.; Koglbauer, G.; Wendland, M.; Fischer, J. Working fluids for low-temperature organic Rankine cycles. Energy 2007, 32, 1210–1221. [Google Scholar] [CrossRef]
  83. Wang, Z.; Yan, S.; Zhu, M.; Zhu, W.; Zhang, H.; Gou, X. Optimization Study on Regenerative Organic Rankine Cycle (ORC) with Heat Source of Low-Grade Steam. Energy Eng. 2022, 119, 2569–2584. [Google Scholar] [CrossRef]
  84. Zühlsdorf, B.; Meesenburg, W.; Ommen, T.; Thorsen, J.; Markussen, W.; Elmegaard, B. Improving the performance of booster heat pumps using zeotropic mixtures. Energy 2018, 154, 390. [Google Scholar] [CrossRef]
  85. Feng, Y.-Q.; Wang, Y.; Yao, L.; Xu, J.-W.; Zhang, F.-Y.; He, Z.-X.; Wang, Q.; Ma, J.-L. Parametric analysis and thermal-economical optimization of a parallel dual pressure evaporation and two stage regenerative organic Rankine cycle using mixture working fluids. Energy 2022, 263, 125670. [Google Scholar] [CrossRef]
  86. Li, J.; Duan, Y.; Yang, Z.; Yang, F. Exergy analysis of novel dual-pressure evaporation organic Rankine cycle using zeotropic mixtures. Energy Convers. Manag. 2019, 195, 760–769. [Google Scholar] [CrossRef]
  87. Petrollese, M.; Cocco, D. Robust optimization for the preliminary design of solar organic Rankine cycle (ORC) systems. Energy Convers. Manag. 2019, 184, 338–349. [Google Scholar] [CrossRef]
  88. Akar, S.; Augustine, C.; Kurup, P. Global value chain and manufacturing analysis on geothermal power plant turbines. In Thermodynamic Analysis and Optimization of Geothermal Power Plants; Elsevier: Amsterdam, The Netherlands, 2021; p. 17. [Google Scholar] [CrossRef]
  89. Wendt, D.; Mines, G.; Turchi, C.; Zhu, G. Geothermal Risk Reduction via Geothermal/Solar Hybrid Power Plants; Final Report; Idaho National Laboratory (INL): Idaho Falls, ID, USA, 2015. [Google Scholar] [CrossRef]
  90. Wang, Z.; Zhao, Y.; Xia, X.; Zhang, S.; Xiao, Y.; Zhang, X.; Chen, W. Experimental study of the thermodynamic performance of the ORC-VCC system with a zeotropic mixture. Appl. Therm. Eng. 2024, 250, 123534. [Google Scholar] [CrossRef]
  91. Meroni, A. Design and Optimization of Turbomachinery for Thermodynamic Cycles Utilizing Low-Temperature Heat Sources. Research Portal Denmark. January 2018, p. 245. Available online: https://orbit.dtu.dk/en/publications/design-and-optimization-of-turbomachinery-for-thermodynamic-cycle/ (accessed on 22 August 2025).
Figure 1. Comparison of temperature profiles (T-Q Diagram) in the evaporator.
Energies 19 01725 g001
Figure 2. Comparative T-s diagram between the pure fluid Pentane and the zeotropic mixture Pentane/Isobutane (70/30% w/w) at 15 bar, showing the effect of temperature glide on the saturation curve.
Energies 19 01725 g002
Figure 3. NSGA-II algorithm convergence history. (a) Evolution of the Average Pareto Distance; (b) Evolution of the Spread of the optimal solutions front over 100 generations.
Energies 19 01725 g003
Figure 4. Numerical model validation: Comparison of simulated thermal efficiency for pure R245fa against the results of Imran et al. (2014) [26]. Source: Generated by the authors using original simulation data.
Energies 19 01725 g004
Figure 5. Validation of zeotropic behavior: Mixture effect. Source: Generated by the authors using original simulation data. The results replicate the theoretical trends reported by Chys et al. [25] and Gonidaki [9].
Energies 19 01725 g005
Figure 6. Effect of mixture composition on temperature glide and cycle exergetic efficiency. A direct correlation is observed between the maximum Glide (~12 K) and the efficiency peak for Pentane-rich compositions x p e n t 0.6 0.7 .
Energies 19 01725 g006
Figure 7. Pareto Front resulting from NSGA-II optimization. Three characteristic points are highlighted: (A) Minimum Cost Design; (B) Maximum Efficiency Design; and (C) Compromise Solution selected using the LINMAP method.
Energies 19 01725 g007
Figure 8. Technical-economic performance comparison between the standard fluid (R245fa), the pure hydrocarbon (Pentane), and the optimized low-GWP zeotropic mixture (70/30% w/w).
Energies 19 01725 g008
Figure 9. Evolution of Normalized Net Power in response to the temperature drop of the geothermal source. Source: Generated by the authors using original simulation data.
Energies 19 01725 g009
Figure 10. Multidimensional evaluation of resilience and sustainability (Radar chart). Source: Generated by the authors using original simulation data.
Energies 19 01725 g010
Table 2. Boundary parameters and design conditions of the ORC system.
SubsystemParameterSymbolValueUnitJustification/Reference
Geothermal SourceInlet Temperature T g e o , i n 150°CUpper limit of low enthalpy; maximizes thermal recovery [5,7,9]
Source Pressure P g e o 10barEnsures single-phase liquid state, avoiding flashing phenomena [34]
Mass Flow Rate m g e o ˙ 50kg/sRepresentative flow rate of a medium-high production well [5]
Minimum Reinjection Temp. T g e o , r e i n j ≥80°CPrevents amorphous silica precipitation (scaling) in reinjection wells.
Heat Sink (Cooling)Inlet Temperature T c w , i n 25°CStandard design condition according to ISO 3977-2 [18,26].
Temperature Rise Δ T c w 5KBalance between pumping power consumption and cooling tower size [9].
MachineryTurbine Isentropic Efficiency η t 85%Nominal value for radial inflow expansion turbines in ORC [7,27].
Pump Isentropic Efficiency η p 75%Industrial standard for centrifugal pumps for organic fluids [7,9]
Mechanical/Electrical Efficiency η m · η g e n 95%Accounts for mechanical friction losses and generator efficiency [35]
Heat ExchangersMinimum Pinch Point Δ T p p ≥10KEconomic limit [7,18].
Table 3. Main physicochemical properties, environmental indicators, and standard safety classifications of the baseline and proposed working fluids.
FluidChemical TypeFormulaMolecular Weight
(kg/kmol)
Tcrit (°C)Pcrit (bar) G W P 100 ASHRAE Class
R245faHFC C 3   H 3   F 5 134.0515436.5858B1
PentaneHC (AlKane)n– C 5   H 12 72.15196.533.75A3
IsobutaneHC (Alkane)i– C 4   H 10 58.12134.736.43A3
Table 4. Grid independence study results for evaporator discretization.
Segments (N)Net Power (kW)Relative Error (%)Computation Time (ms)
51408.22.54%1.2
201439.70.36%4.8
50 (Optimal)1444.90.04%12
1001445.50.02%24
200 (Ref.)1445.8---48
Table 5. Cost coefficients for the Turton method (Base: Carbon Steel/Stainless Steel).
EquipmentParameter (X)K1K2K3FBM (Factor Module)
Axial Turbine W t ˙ [kW]2.62591.4398−0.17763.5
Evaporator A e v a p   m 2 4.3247−0.3030.16342.8
Condenser A c o n d   m 2 4.3247−0.3030.16342.8
Pump W p ˙ [kW]3.38920.05360.15382.5
Table 6. NSGA-II genetic algorithm configuration parameters [24].
ParameterConfiguration/ValueDescription
Population100 IndividualsBalance between exploration and computational time.
Generations100Stopping criterion based on Pareto stability.
Creation FunctiongacreationuniformUniform initial distribution across the search space.
SelectionselectiontournamentBinary tournament to maintain selective pressure.
CrossovercrossoverintermediateArithmetic crossover for continuous variables.
MutationmutationadaptfeasibleAdaptive to respect boundary constraints.
Table 7. Computational model validation matrix (Triangulation).
Triangulation AxisEvaluated ParameterControl Reference (Benchmark)Observed Deviation
1. NumericalOptimal Pressure (R245fa)Imran et al. (2014) [26]<2.3% (RMSD)
2. ThermodynamicEfficiency Gain by GlideChys et al. (2012) [25]Identical Trend
3. EconomicArea Penalty U A Heberle et al. (2012) [16]Consistent
4. SustainabilityFluid SelectionGonidaki (2025) [9]In agreement
Table 8. Detailed parameters of the optimal solutions selected from the Pareto Front.
ParameterUnitPoint A (Min Cost)Point B (Max Eff.)Point C (Compromise)
Design Priority-EconomicThermodynamicBalanced
Composition (xpent)-0.550.750.7
Evap. Pressurebar19.214.816.5
Net PowerkW89511501112
Exerg. Efficiency%54.264.562.8
Total HX Aream2450820615
LCOE€/kWh0.0480.0620.051
Table 9. Quantitative impact of key economic parameters on the system LCOE.
Economic ParameterBaseline ValueVariation RangeLCOE Range [€/kWh]Max. LCOE Deviation [%]
Interest Rate (Discount Rate)5.0%3.0–7.0%0.043–0.060±17.6%
CEPCI Index (Capital Cost)Base Year−20%/+20%0.044–0.058±14.5%
O&M Coefficient (% of CapEx)2.0%1.6–2.4%0.049–0.052±2.5%
Table 10. Operational Stress Matrix: Comparison of Generation Capacity Loss (Net Power) under extreme conditions.
Stress ScenarioConditionR245fa Power LossMixture Power LossResilience Improvement
Degraded SourceTgeo = 130 °C−51.6%−44.9%+6.7 pts
HeatwaveTamb = 35 °C−18.7%−12.2%+6.5 pts
Low Loadm˙geo = 80%−15.0%−11.0%+4.0 pts
Disclaimer/Publisher’s Note: The statements, opinions and data contained in all publications are solely those of the individual author(s) and contributor(s) and not of MDPI and/or the editor(s). MDPI and/or the editor(s) disclaim responsibility for any injury to people or property resulting from any ideas, methods, instructions or products referred to in the content.