Article

Extended FOC for High-Performance SPMSMs in EVs Incorporating Flux Linkage Vector Decomposition and Nonlinear Dependencies: Experimental Evaluation and Performance Enhancement


by
Rubén Rodríguez Vieitez
1,*,
Paulo Gabriel Rial Aspera
1,
Jorge Rivas Vázquez
1,
Daniel Villanueva Torres
2,
Nicola Bassan
3 and
Jacobo Porteiro Fresco
2
1
Automotive Technology Center of Galicia (CTAG), 36475 Porriño, Pontevedra, Spain
2
Grupo de Tecnología Energética (GTE), CINTEX, Universidade de Vigo, 36310 Vigo, Pontevedra, Spain
3
QEV Technologies, 08160 Montmeló, Barcelona, Spain
*
Author to whom correspondence should be addressed.
Energies 2026, 19(7), 1690; https://doi.org/10.3390/en19071690
Submission received: 4 March 2026 / Revised: 20 March 2026 / Accepted: 24 March 2026 / Published: 30 March 2026
(This article belongs to the Collection "Electric Vehicles" Section: Review Papers)

Abstract

Surface-mounted permanent magnet synchronous motors (SPMSMs) are widely used in high-performance electric vehicles due to their power density; however, conventional field-oriented control (FOC) relies on simplified models in which electromagnetic torque is described as a function of the quadrature current component, together with constant parameters and idealized trajectories in the i d i q plane, limiting adaptability and reducing efficiency and operating range under real conditions. This work introduces a flux linkage vector decomposition approach for SPMSMs, in which the permanent-magnet flux is decomposed into d- and q-axis components under core saturation and integrated into an extended field-oriented control framework. An extended FOC strategy is proposed that incorporates flux linkage vector decomposition, nonlinear magnetic saturation, cross-coupling effects, and nonlinear dependencies of electrical parameters, along with resolver angle correction and dynamic modulation index management. These enhancements modify torque and voltage trajectories by shifting the voltage-limit center and improving the definition of the MTPA, FW, and MTPV regions to better match real motor behavior, enabling performance improvements. Experimental validation on an automotive powertrain using a vehicle control unit (VCU) and precalculated lookup tables (LUTs) demonstrates improvements of up to 13.5% in low-speed torque, 13.7% in high-speed power, and efficiency gains of 4–8% across operating conditions.

1. Introduction

The automotive industry plays a significant role in modern society. Original equipment manufacturers (OEMs), along with Tier 1, Tier 2, and Tier 3 suppliers, as well as various research and development companies, are increasingly entering the electric vehicle sector. Their objective is to improve the sector continuously by focusing on high efficiency, particularly in electric drive systems [1]. In this context, permanent magnet synchronous motors (PMSMs) are currently the most widely used motors for electric propulsion due to their notable advantages, including high torque density, precision, dynamic performance, and reduced losses [2].
Radial flux PMSMs are considered a mature technology, as they are commonly used in industry. However, Rallabandi et al. [3] highlighted that axial flux motors offer certain advantages over radial flux motors. These advantages include higher specific torque, even when both motor types are optimized for the same application, and greater efficiency in high-demand scenarios. As axial flux motor technology develops further and manufacturing costs decrease, their share in the propulsion system market is expected to increase.
Nevertheless, the higher torque density of axial flux motors introduces greater challenges in heat dissipation due to the reduced available surface area. This increases the need for efficiency improvements, which require optimization of the motor’s physical characteristics, as well as enhancements in control strategies. A variety of methods have been proposed to control these motors, ranging from predictive models and neural networks to state observers. Some approaches aim for controlling the motor over its complete operating range, while others focus on specific operating zones. However, many fail to adequately address variations in motor parameters, such as changes in the main flux linkage λ p m caused by temperature fluctuations and current injection, the overestimation of inductances when reduced by saturation, and the underestimation of the stator phase resistance R s when it rises with temperature. Wang et al. [4] addressed these issues through generalized predictive control (GPC), which demonstrates better dynamic response and disturbance rejection than conventional proportional-integral (PI) control. The main drawback of GPC is its high computational demand, which limits practical application. Wu et al. [5] attempt to address this limitation through an interleaved current control system, though their solution remains insufficient.
Field-oriented control (FOC) is the most common method for managing PMSM performance. However, it is often associated with simplifications and limitations. One line of research investigates explicit model predictive direct speed control (EMP-DSC), where the maximum current circumference and maximum voltage ellipse are approximated as a hexagon to reduce computational load. Zhao et al. [6] identify several drawbacks in these models, including difficulty in reaching maximum current and speed limits and excessive direct-axis current injection in the flux-weakening zone. Their proposed solutions partially mitigate these issues but do not eliminate them entirely. They also simplify non-operational regions of the motor, which creates challenges in zone transition.
In baseline FOC, the direct-axis current component in the maximum torque per ampere (MTPA) region is typically set to zero, assuming equal d- and q-axis inductances. However, Li et al. [7], in the context of IPMSMs, demonstrate that torque production may also depend on variations in the magnitude and angular orientation of the permanent-magnet flux under core saturation, formulating this behavior through a current-dependent flux linkage decomposition framework. Building upon this concept, the present work extends its application to SPMSMs and integrates flux linkage vector decomposition into the control formulation within an automotive-oriented FOC framework.
At very low speeds or in standstill operation, some approaches avoid explicit parameter knowledge by exploiting rotor saliency through variations in stator inductance with rotor position [8]. Sul [9] notes that such saliency-based methods remain under development. Similarly, Lu et al. [10] report improved rotor position detection compared with conventional techniques, although limited to the MTPA region and with core losses still affecting accuracy.
Rotor position measurement errors, as highlighted by Datlinger and Hirz [11], are seldom addressed in control strategies despite their importance. In conventional FOC implementations, Hu and Lu [12] avoid parameter estimation entirely, instead using lookup tables (LUTs) generated by testing a high number of points and selecting those that meet torque and power requirements. Mansouri et al. [13] determine saturation characteristics using a static method and improve control in the flux-weakening zone without accounting for temperature effects or parameter variation during motor operation. Meesala et al. [14] make incremental improvements to direct torque control (DTC) by manually adjusting torque matrices, aiming to reduce torque ripple and total harmonic distortion (THD), though without matching the performance of other control strategies.
Artificial intelligence (AI) has also been applied to PMSM control in an effort to overcome these limitations. Wang et al. [15] develop a neural network-based mathematical model of a PMSM, but note that its accuracy depends heavily on the availability of extensive training data, which remains the main obstacle to AI adoption in motor control. Lu et al. [16] apply AI to control strategy development by incorporating saturation compensation and core losses but faced the same challenge of requiring large datasets for each motor, hence limiting scalability. As a result, AI-based solutions are not yet ready to serve as the primary control method.
New advances in PMSM modeling have introduced digital twin and hybrid physics-data approaches, combining physics-based models with machine learning for predictive maintenance, thermal monitoring, and fault diagnosis [17]. Bayesian calibration frameworks and hierarchical physics-aware neural networks have further improved state estimation and parameter adaptability [18], while comprehensive reviews highlight the rapid growth of digital twin applications for PMSMs and their emerging role in condition monitoring [19]. However, these methods exhibit high computational complexity, rely heavily on operational datasets, and are primarily suited for monitoring diagnostics rather than online embedded motor control, reinforcing the need for practical, computationally efficient strategies compatible with automotive VCUs.
In parallel, advanced nonlinear control strategies such as model predictive control, adaptive parameter estimation, and observer-based approaches have been proposed to address nonlinearities in PMSM drives. While these methods can improve modeling accuracy and control performance, they typically increase computational complexity and require significant real-time processing capabilities, which may limit their implementation in automotive electronic control units. This highlights the need for control strategies capable of incorporating nonlinear electromagnetic effects while preserving the computational structure and robustness of conventional FOC implementations.
Recent research has emphasized the need for nonlinear flux-linkage modeling in highly saturated PMSMs. In particular, the identification of flux linkage surfaces under strong saturation has been experimentally addressed in [20], while improved MTPA and MTPV criteria based on nonlinear flux-linkage models have been developed in [21]. These works highlight the growing relevance of modeling flux linkage as a nonlinear function of current. However, their application is mainly focused on interior PMSMs, whereas the impact of flux linkage vector decomposition in high-saturation surface-mounted PMSMs remains insufficiently explored and, to our knowledge, was never demonstrated experimentally for this type of motors.
This paper proposes an extension of the baseline FOC used in high-saturation surface-mounted PMSMs by explicitly modeling the decomposition of the permanent-magnet flux linkage into d- and q-axis components under core saturation, together with the nonlinear dependence of key electrical parameters such as λ p m , L , and R s on operating conditions, including temperature effects identified in [22].
Another important limitation of the baseline FOC is that it neglects cross-coupling effects between the d- and q-axis currents. In practical SPMSMs, the magnetic coupling introduces additional voltage terms in the model, which become more relevant under high-current and high-speed conditions. Several works, such as that of Shi et al. [23], have highlighted that ignoring this interaction leads to deviations in the torque estimation and voltage limit trajectories, reducing accuracy in flux weakening and high-speed operation. The proposed approach accounts for magnetic saturation, cross-coupling effects, flux linkage vector decomposition, and resolver angle offset. Unlike conventional methods, it incorporates dynamic management of the modulation index, which is adjusted according to the operating point to maximize inverter efficiency.
The remainder of this paper is structured as follows. Section 2 presents the mathematical model of both the baseline and extended FOC, as well as their limitations. Section 3 describes the materials and methods used to validate the proposed control. Section 4 details the implementation of the extended FOC in MATLAB/Simulink™ (R2024a) and its compilation directly on the system’s vehicle control unit (VCU), demonstrating its applicability in automotive contexts, along with a performance evaluation.

2. SPMSM Control and Mathematical Model

2.1. Baseline Control

2.1.1. Mathematical Model Baseline Control

The effectiveness of a rotating electric machine can be defined by the torque it generates; therefore, it is important to understand the torque components. The mechanical torque is the sum of the electromagnetic torque, the mechanical losses, and the torque generated by the angular momentum, shown in (1).
M m = M e + M l o s s + M L
Using the reference framework based on the direct and quadrature current axes [24], (2) shows the electromagnetic torque generated by an SPMSM. The reluctance torque generated here is practically zero because the inductance values of the direct and quadrature axes can be considered approximately equal, L d L q , as defined by Pellegrino et al. [25]. In consequence, the torque depends on the number of phases, the number of pole pairs, the flux linkage, and the quadrature current.
M e = m 2 p λ p m i q + ( L d L q ) i d i q = m 2 p λ p m i q
Equations (3)–(6) present the d- and q-axis flux-linkage and voltage relations for SPMSMs, following the conventional dq model reported by Chen et al. [26].
λ d = L d i d + λ p m
λ q = L q i q
u d = i d R s + d λ d d t ω e L q i q
u q = i q R s + d λ q d t + ω e L d i d + λ p m ω e
In electric motors, the calculation of peak voltage and current, along with maximum allowable voltage and electrical angular velocity, is performed using the next equations.
U m a x , p h = U D C 3   ( L i n e a l   z o n e )
U p e a k , p h = u d 2 + u q 2
U R M S = U p e a k , p h 2
I p e a k , p h = i d 2 + i q 2
I R M S = I p e a k , p h 2
ω e = ω m p
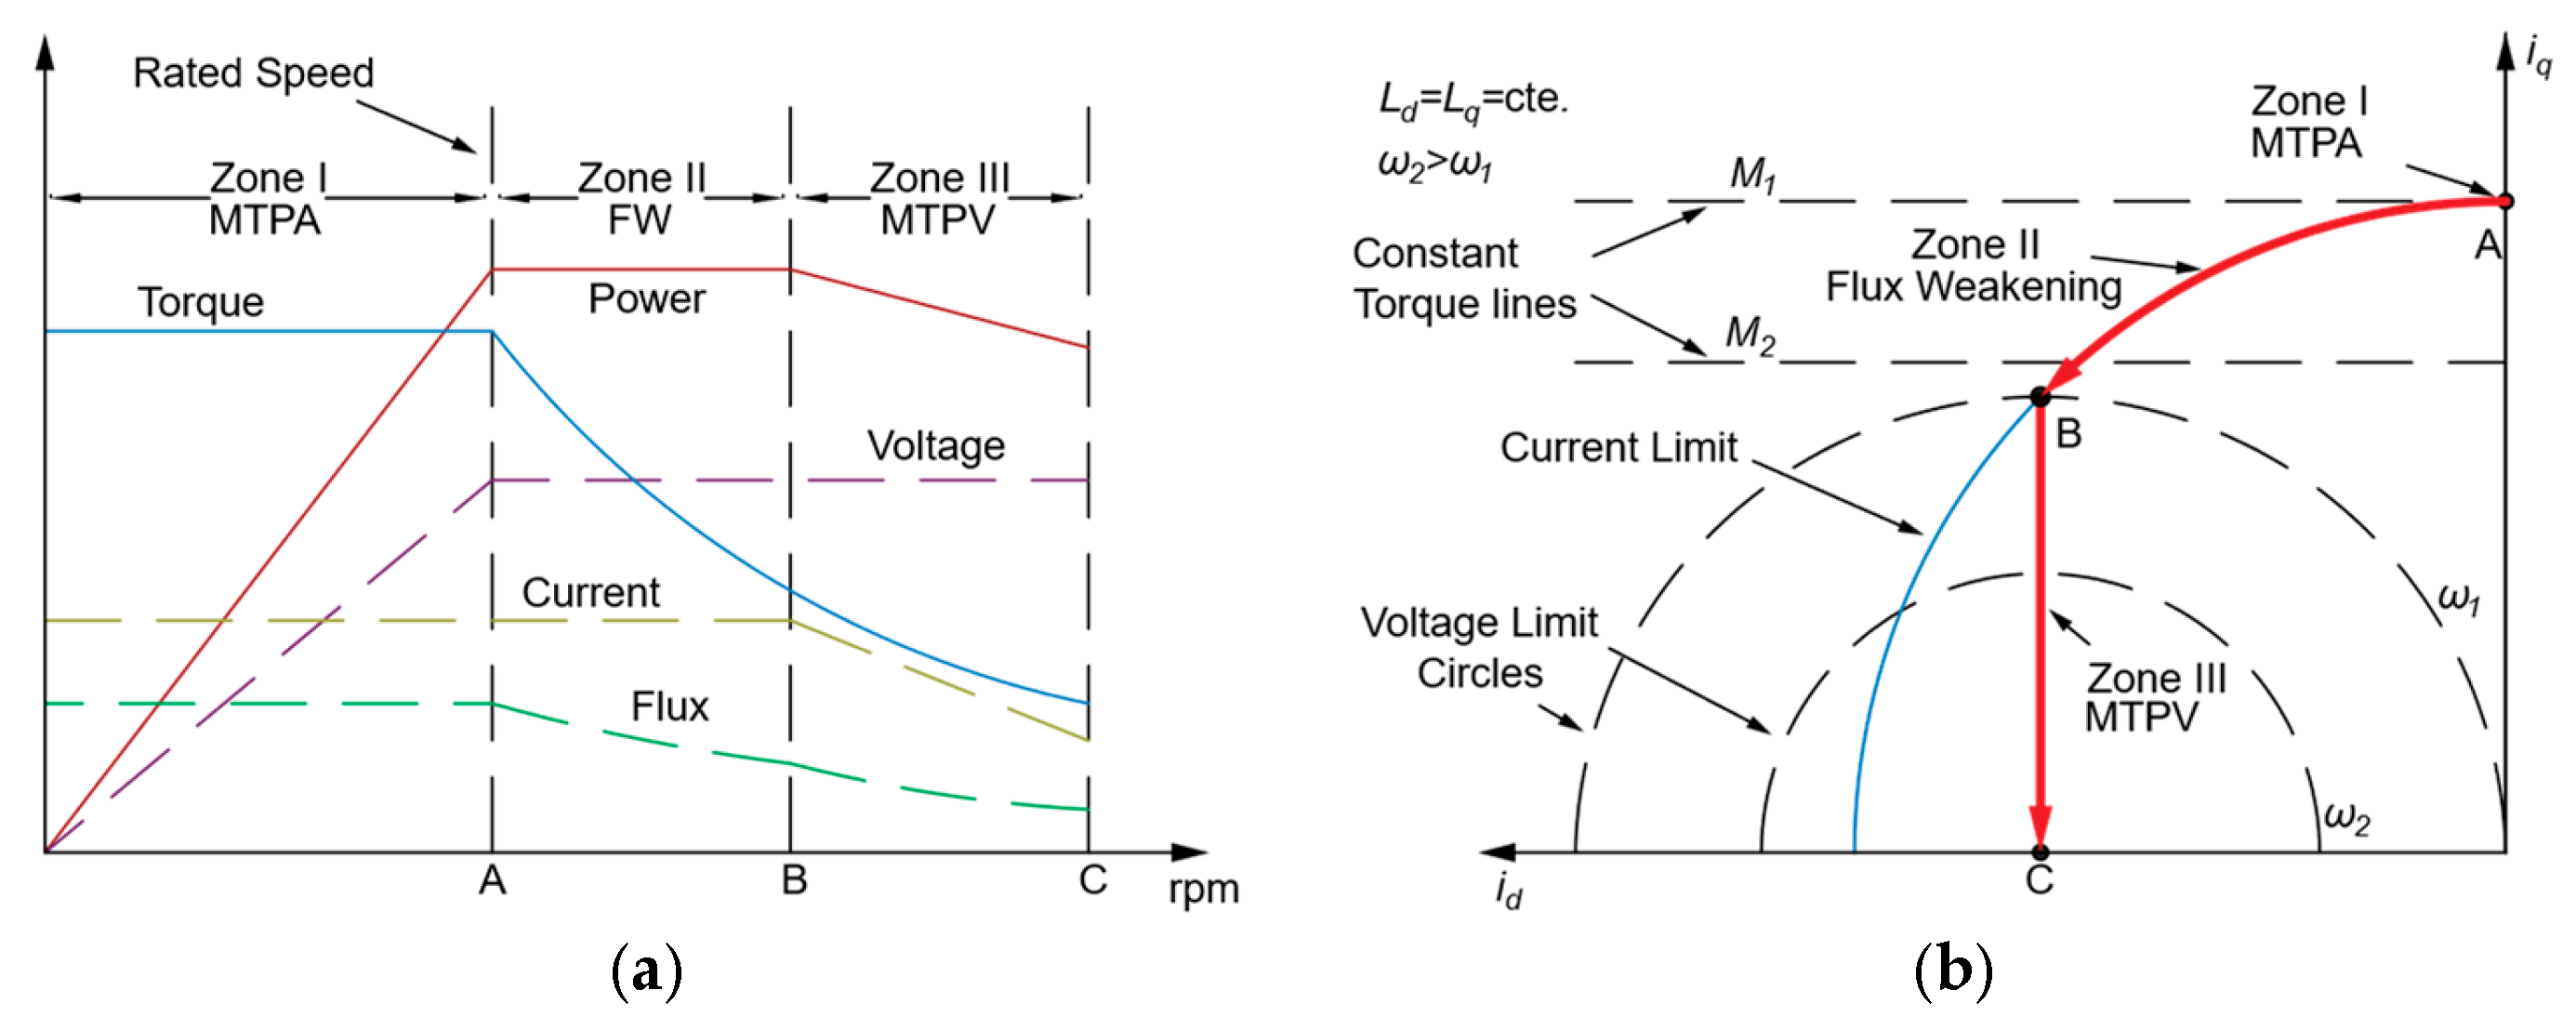
Based on the above equations and in order to improve the system efficiency, control paths for SPMSMs can be determined using field-oriented control (FOC). This control weakens the magnetic field when it exceeds the rated speed, reaching a constant maximum voltage, as shown in point A of Figure 1a.
The baseline control represents the commonly used FOC for SPMSMs without compensation mechanisms or parameter variability modeling. The three control zones for SPMSMs are further described next. Zone I, or the MTPA path, maximizes electromagnetic torque with minimum current. This strategy is applied before the back electromotive force (BEMF), together with the internal voltage drops, reaches the voltage available on the DC link bus. In baseline FOC for SPMSMs, torque in this operating zone depends solely on the quadrature axis, meaning that the direct-axis current component remains zero, following the next equations.
i d , M T P A = 0
i q , M T P A = M e 3 2 p λ p m
U p e a k , p h < U m a x , p h
Zone II, or flux weakening (FW) path, is reached after the rated speed. There are various types of control for FW, as described by Klinachev & Kuleva [27], such as constant current constant power (CCCP), constant voltage constant power (CVCP), and constant voltage maximum torque (CVMT). CVCP, which is commonly used in SPMSMs, as indicated by Dalal and Sreejeth [28], maintains constant maximum voltage and power, injecting current in the direct axis and reducing voltage in the quadrature axis to maintain the voltage ratio in the inverter.
P m = M m ω m = c t e .
u d L q ω e i q
u q L d ω e i d + ω e λ p m
U p e a k , p h = U m a x , p h
i d , F W = ( ω e b a s e ω e ) λ p m ω e L d
i q , F W = M e 3 2 p λ p m
Finally, there is Zone III, which applies the maximum torque per voltage (MTPV) path and maximizes allowable torque for constant maximum voltage, (7) [29]. In the MTPV zone, the reference trajectory follows the center of the voltage-limit circle. This circle is derived from the infinite-speed limit case in Equations (5) and (6), allowing the identification of the maximum possible relationship between the i d and i q components without exceeding the available voltage. Remaining in the upper part of this circle ensures that the operating point coincides with the intersection between the voltage limit and the maximum achievable torque under those conditions, thereby maximizing motor performance in this operating region.
( i d , c , i q , c ) = λ pm L d , 0
i d , M T P V = λ p m L d
i q , M T P V = U m a x , p h ω e · L d
The baseline FOC in SPMSMs is often simplified in its implementation by removing the tracking of the current-limit contour. This strategy, common in the industry for its ease of use and implementation approach, reduces the need for complex calibration and computation, facilitating compatibility between inverter and motor, especially when sourced from different manufacturers.
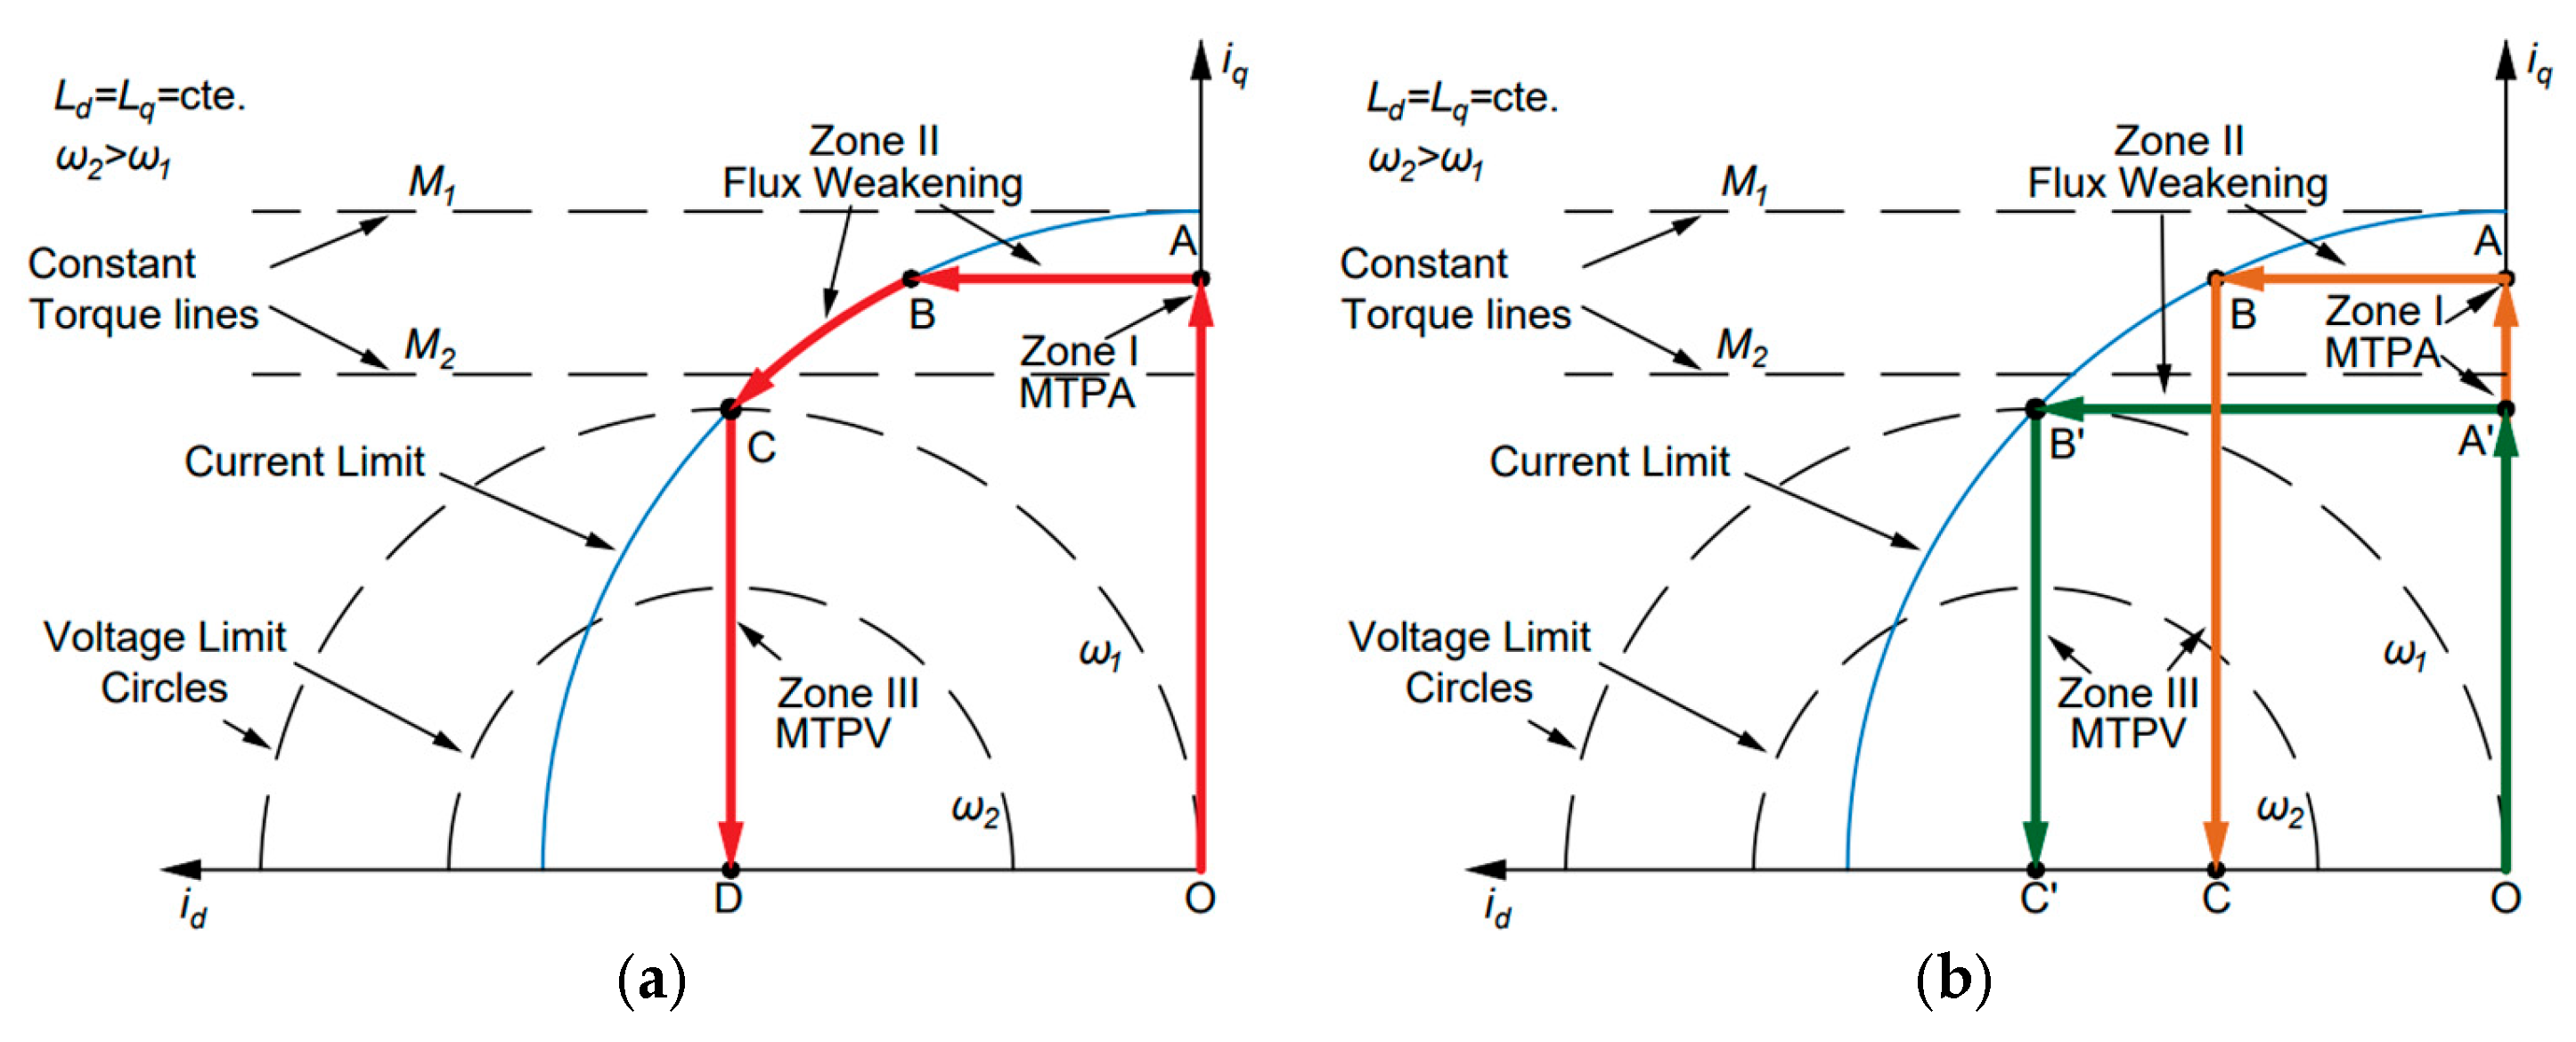
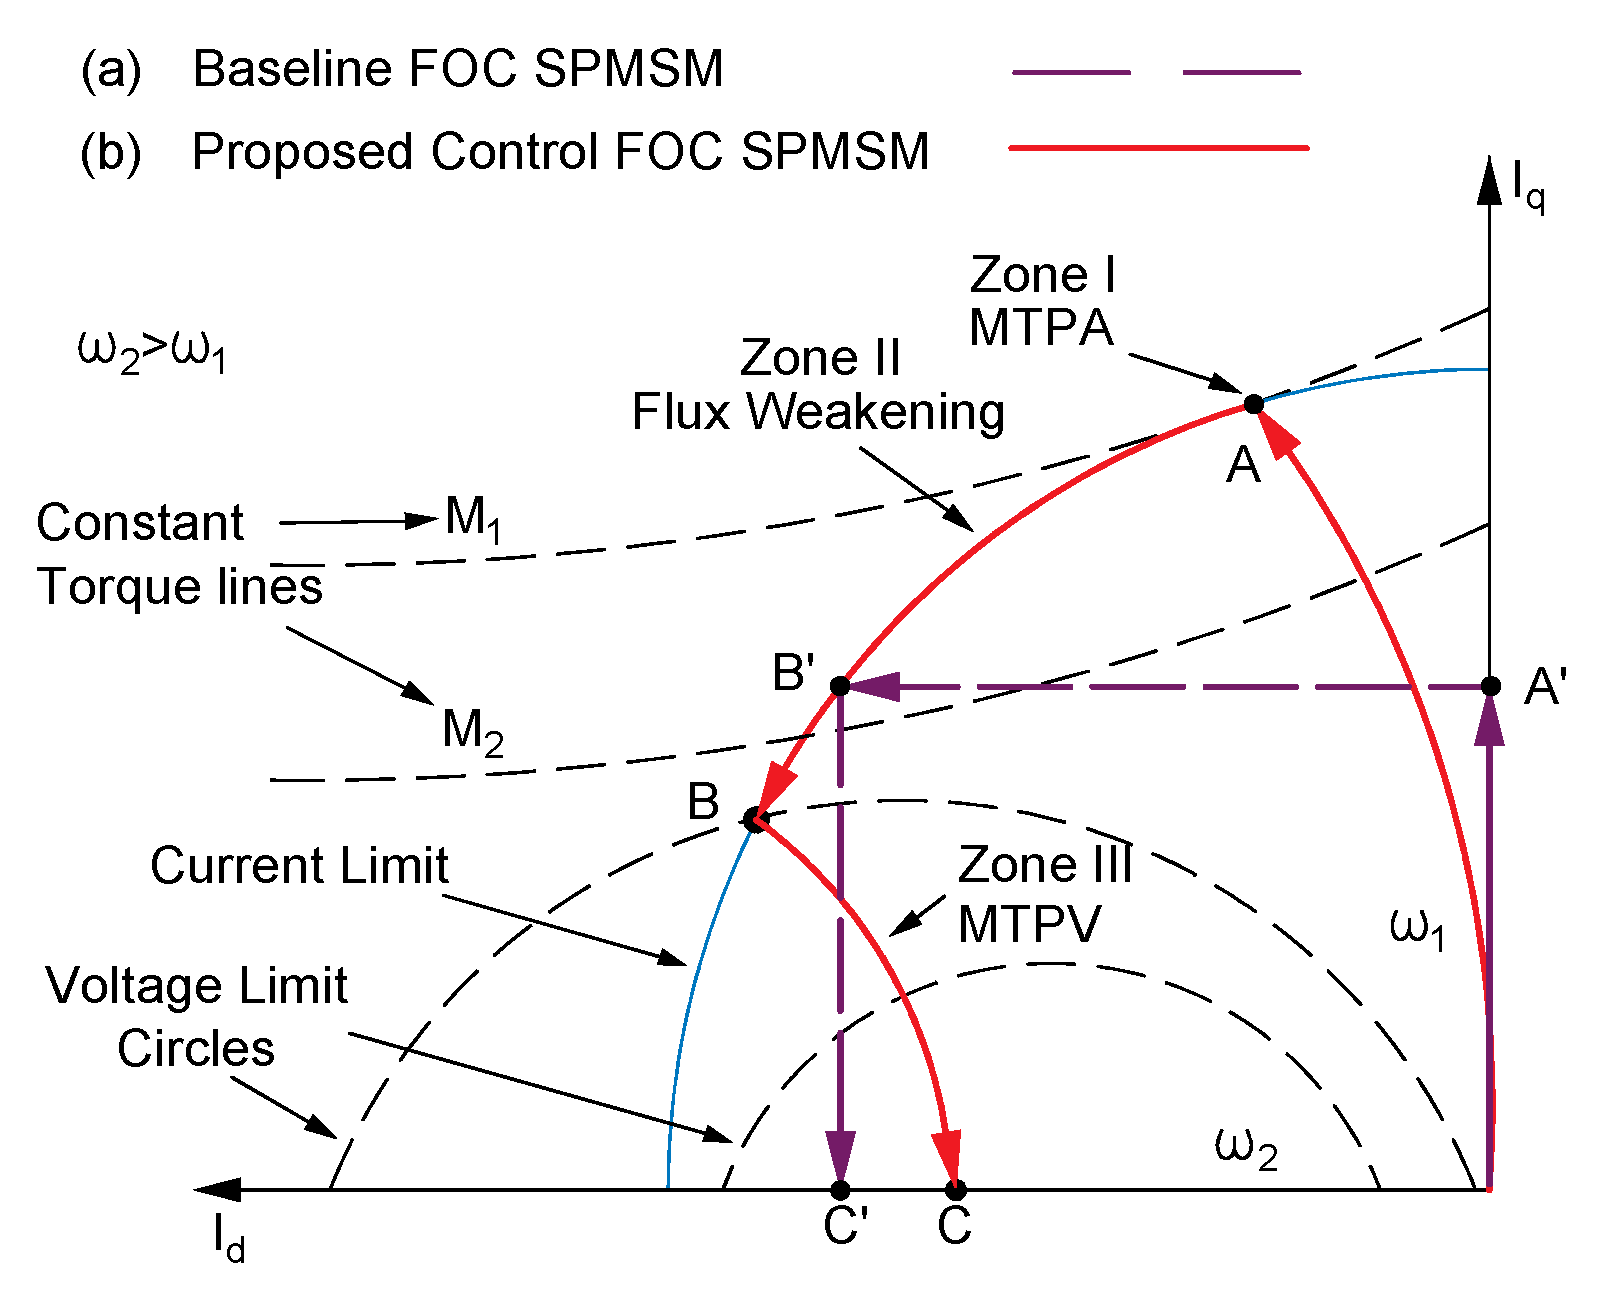
In Figure 2a, the baseline control is shown, which describes the trajectory of a torque demand that does not reach the limit. In the MTPA region, the direct-axis component is kept at zero, and the quadrature-axis component is adjusted according to the desired torque [30]. In the FW region, the trajectory advances horizontally until it reaches the current limits and then follows the maximum current circle [29]. In the MTPV region, the path is vertical because the inductance is considered constant with a center in λ p m / L d , as indicated by Miguel-Espinar et al. [31]. To simplify computation, some control schemes replace the tracking of the current-limit circle in the FW region with a horizontal path. This approach may aim for better performance in the MTPA region at the expense of the MTPV region, as in trajectory A–B–C in Figure 2b, or vice versa, as in trajectory A′–B′–C′ in Figure 2b; in both cases, performance in the FW region is compromised. In practice, a trade-off is adopted depending on the motor’s application.
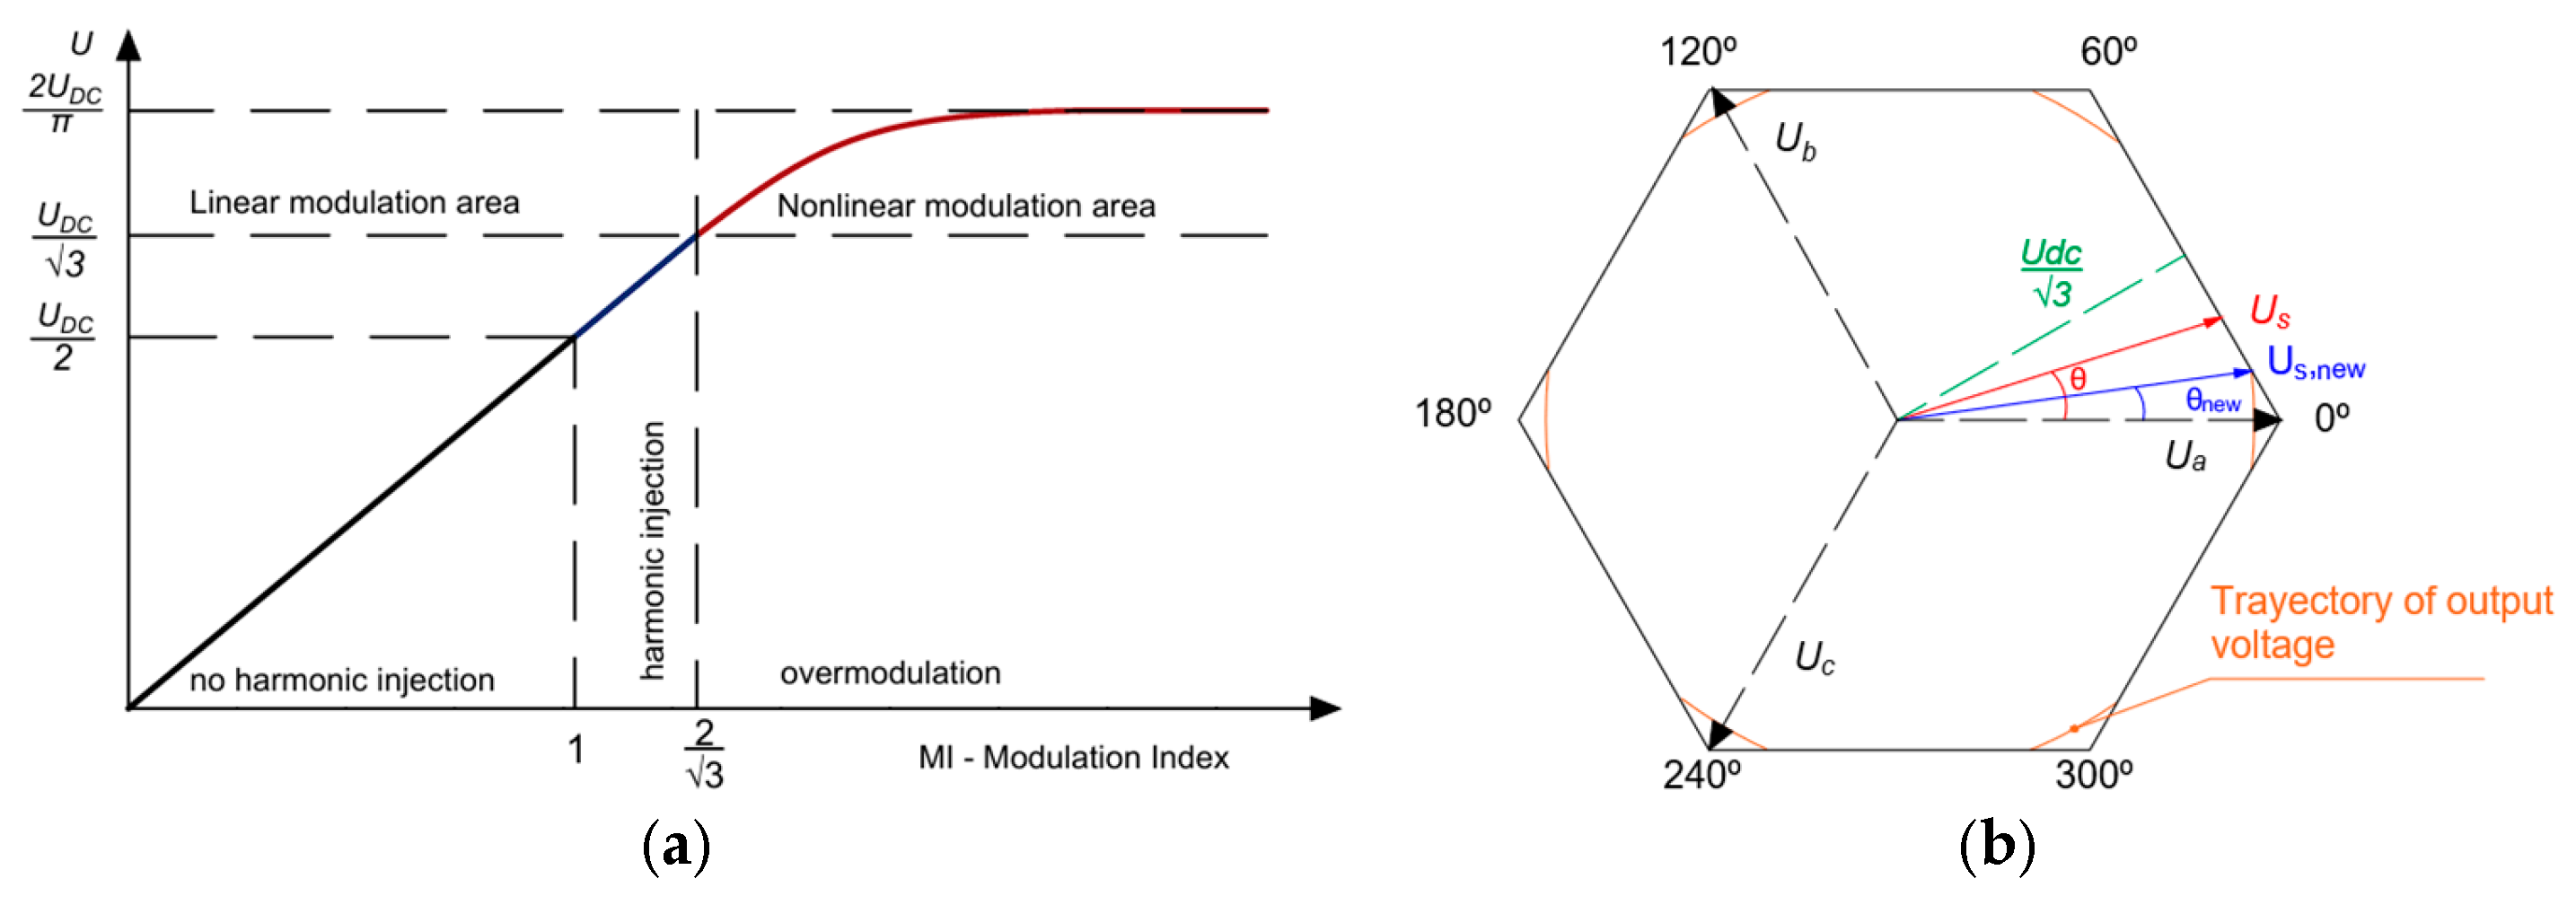
The modulation index (MI) is a parameter that indicates the ratio between the DC link voltage and the output voltage used by the inverter. It is defined as the ratio of the maximum phase voltage ( U p e a k , p h ) to half of the DC link voltage ( U D C ), according to Zhao et al. [32]. Its value determines the modulation system: linear (MI ≤ 1.1547) or overmodulation. A higher MI allows higher voltage to be applied to the motor, extending the usable range of the inverter, albeit with greater harmonic distortion. MI adjustment is key for optimizing inverter use, improving efficiency, and adapting the system’s response to different operating conditions.
M I = 2 · U p e a k , p h U D C  
For this class of applications, the prevailing inverter control strategy is Space Vector Pulse Width Modulation (SVPWM), also called Space Vector Modulation (SVM), as indicated by Zanelli et al. [33], to control the three-phase voltage output. This method allows the modulation index to work linearly up to M I = 2 / 3 (1.1547), thus obtaining an output of U p e a k , p h = U D C / 3   as seen in Figure 3a. This method considerably improves the Sine Pulse Width Modulation (SPWM), linear MI up to 1, obtaining an output of voltage U p e a k , p h = U D C / 2 . For this reason, it is the most widely used in the automotive industry, despite its complexity. The maximum value of the output voltage in the linear modulation area is U D C / 3 , but thanks to the Bolognani overmodulation technique [34], when the reference voltage is exceeded, a new phase angle θ n e w is generated, and the voltage vector U s resulting from the three phases U a ,   U b , and U c can be increased within the limits of the voltage hexagon depicted in Figure 3b. This allows for voltage outputs of up to 2 U D C / π with a modulation index value of 4 / π (1.2732).
In the following subheadings, a concise and precise description of the experimental results, their interpretation, as well as the experimental conclusions that can be drawn is provided.

2.1.2. Limitations

Next, the limitations of the implemented baseline control depicted in Figure 2 will be further analyzed, with a focus on both the FOC trajectories with respect to the i d - i q plane, as well as on the limitations derived from the simplification modeling of certain parameters.
  • In the MTPA region, the control does not reach the maximum theoretical torque, since this coincides with the motor’s maximum admissible current, point A, in Figure 1b. Operating on such a point would eliminate the post-rated speed region, since the implemented trajectories are strictly horizontal lines. Under this constraint, it is not possible to inject negative i d current, which prevents field weakening and, therefore, the extension of the speed range beyond the nominal value. Consequently, the MTPA operation point is limited to a reduced point, compromising torque utilization at low speeds, points A and A’, in Figure 2b.
  • On the FW zone, the trajectory is simplified to a horizontal line on the i d - i q plane, which prevents following the real motor’s current limit, corresponding to the A-B trajectory in Figure 1b. This constraint reduces the usable operating range, leaving potentially exploitable areas beyond control’s reach, trajectories A-B and A’-B’, in Figure 2b.
  • On the MTPV zone, the proposed vertical trajectory is theoretically correct under an ideal model, trajectory C-D, in Figure 2a. This trajectory only appears in control schemes that prioritize the MTPV region, as shown in the trajectory B’-C’ in Figure 2b. For any other trajectory, effective range is lost, such as in trajectory B-C in Figure 2b. Nevertheless, none of them accurately represent the actual motor behavior in this zone due to the cross-coupling effects.
  • Phase resistance, whose actual value varies significantly with temperature, is usually considered to be a constant. This approximation leads to an imprecise calculation of u d and u q voltages, Equations (5) and (6), which prevents optimal operation at the voltage limit during the post-rated speed operation, reducing the utilization of this area.
  • The adjustment of rotor position reading error, AO, is performed linearly with ω e and is generally calibrated at low speed, provoking shift between the i d and i q commanded and actual currents, thereby degrading the accuracy and efficiency of the control.
  • The permanent magnet flux linkage is influenced by temperature, currents, and flux saturation. The baseline control assumes λ p m as a constant, linearly adjusting it with respect to the demanded torque. This simplification introduces inaccuracies in the quadrature current for the torque demand and does not consider temperature variation or saturation of λ p m . Together with AO, this causes a discrepancy between the demanded and actual torque and power.
  • Inductance is usually considered constant in conventional control, without modeling its dependence on motor currents. This simplification neglects the real cross-coupling, leading to less accurate voltage prediction. In the post-rated speed zone, this further limits performance, since the center of the voltage-limit circle is assumed to remain fixed, which does not faithfully represent real conditions. In practice, i d and i q variations modify both λ p m and L, shifting the center of the voltage-limit circle defined by (5) and (6). If this dependence is not correctly adjusted, the effective voltage boundary is altered, increasing the error in voltage-limit regulation and reducing control accuracy in that operating region.

2.2. Proposed Control

2.2.1. Proposed Control Model

The equations described in the previous section are conventionally used in industry for SPMSMs. In this work, a flux linkage vector decomposition under core saturation is incorporated into the control model, following the formulation introduced by Li et al. [7] for IPMSMs. While their analysis primarily focuses on the MTPA region, the present approach extends this concept to SPMSMs and integrates it consistently within the full operating range.
This behavior is physically caused by the interaction between the permanent magnet’s magnetic field and the armature reaction field generated by the stator currents. Under high load and magnetic saturation, this interaction modifies the magnetic permeability of the iron core, producing a rotation of the resultant flux linkage vector.
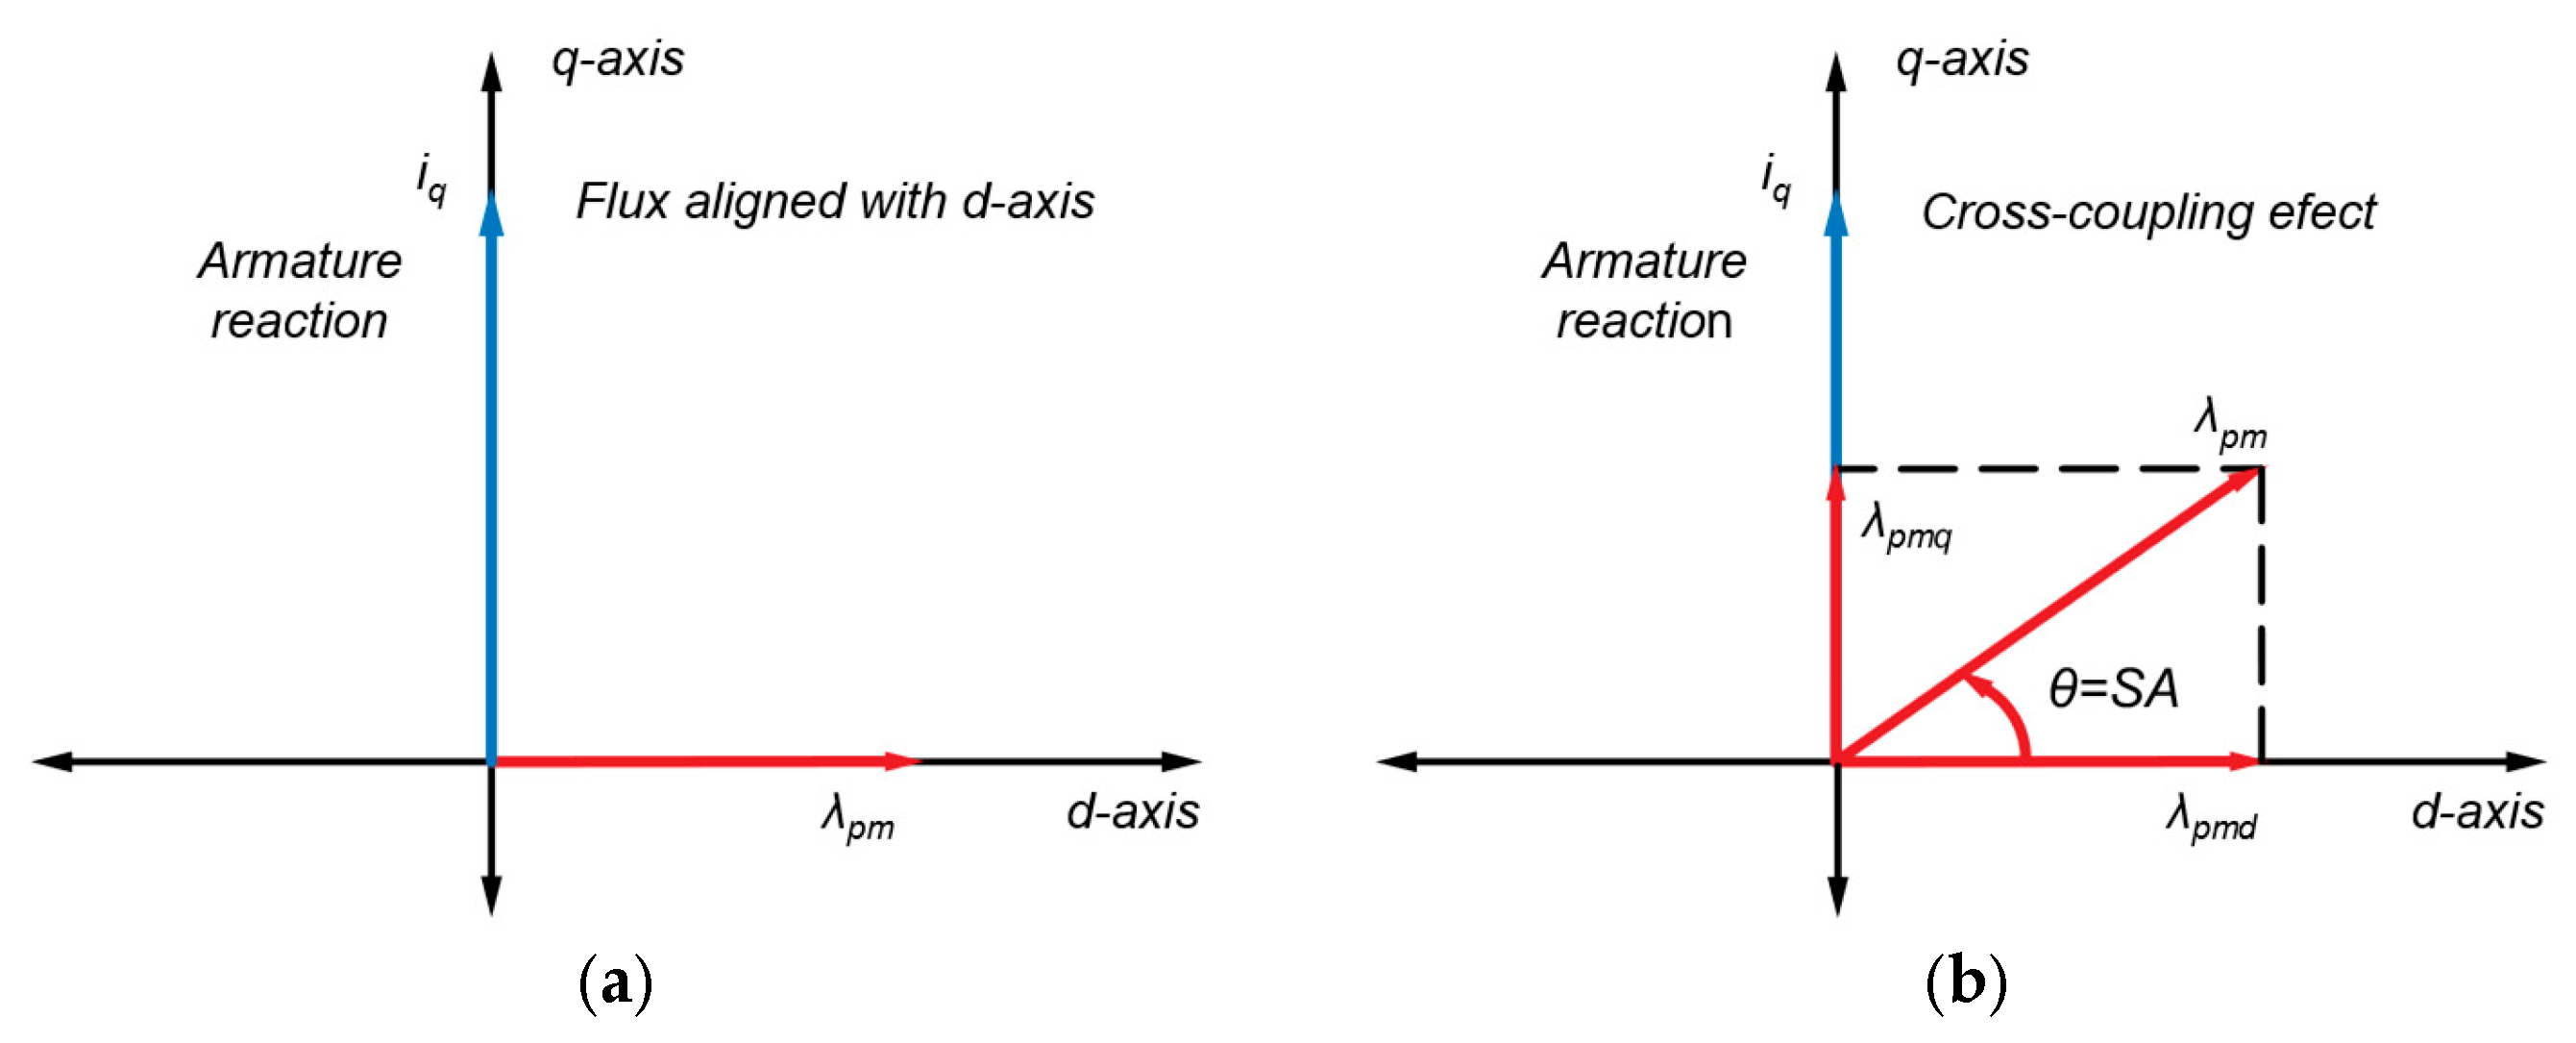
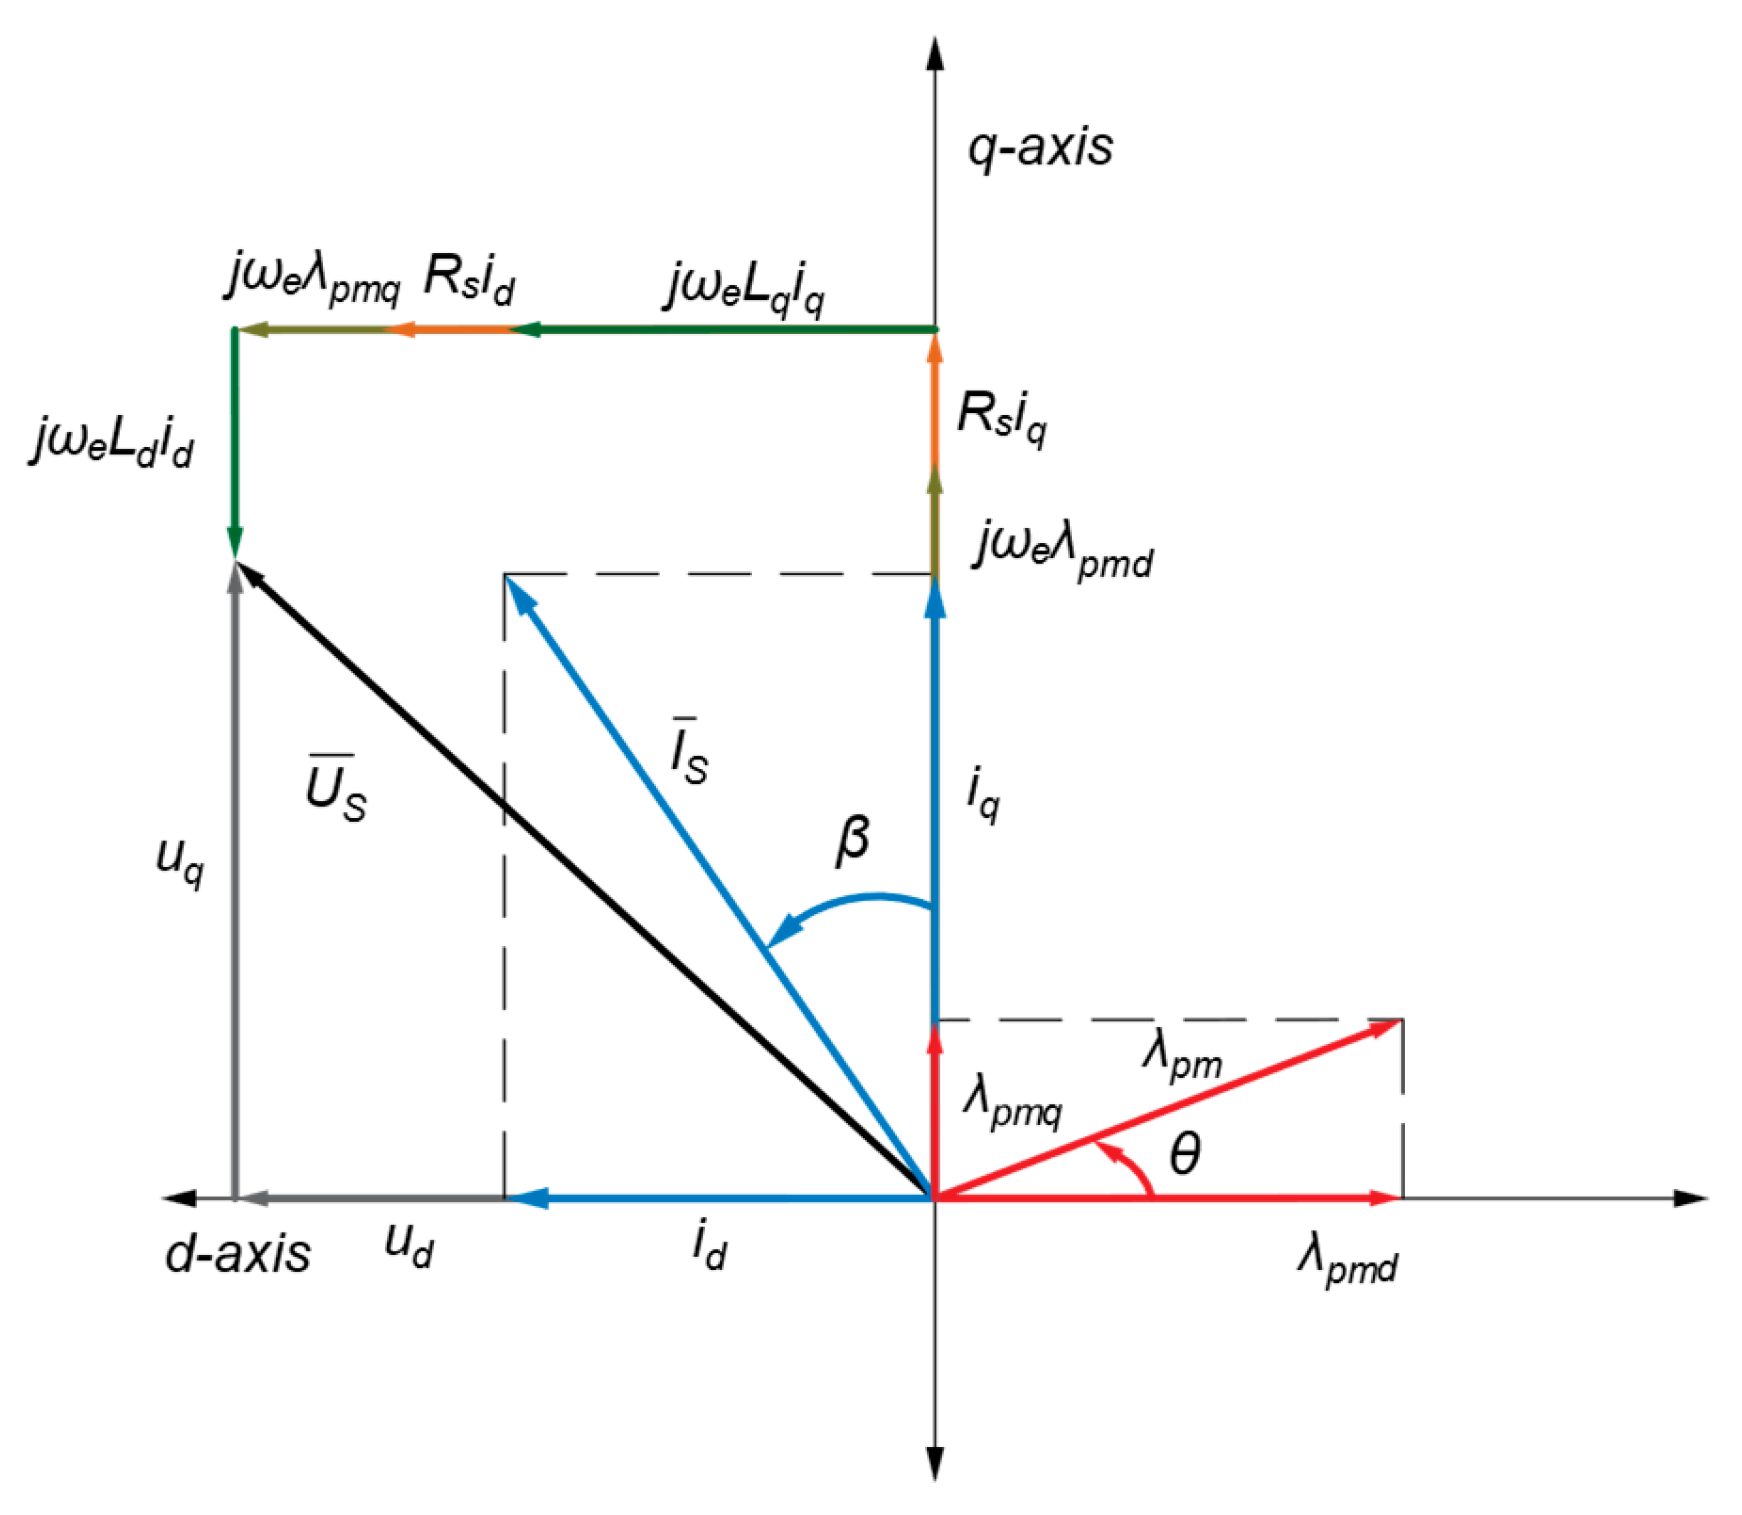
As a consequence, the permanent magnet flux linkage vector λ p m is displaced from its nominal alignment with the d-axis, generating a non-zero quadrature-axis component λ p m q , as illustrated in Figure 4.
From a modeling perspective, this behavior implies that the permanent magnet flux linkage is no longer strictly aligned with the d-axis and cannot be considered constant. Instead, the flux linkage vector can be expressed as a nonlinear function of the stator currents, leading to a decomposition into d- and q-axis components, λ d ( i d , i q ) and λ q ( i d , i q ).
This formulation reflects the effect of magnetic saturation and cross-coupling, whereby the quadrature-axis current ( i q ) modifies the magnetic state of the iron core through the armature reaction field. As a result, the permeability distribution becomes dependent on the operating point, causing the flux to deviate from its nominal path and introducing a non-zero quadrature-axis component.
Consequently, both the flux linkage and the inductances, which also depend on the operating currents ( i d , i q ), that is, L =   L ( i d , i q ) , become nonlinear functions of the operating point rather than constant parameters. This dependence directly modifies the voltage equations and constitutes the theoretical basis that explains the displacement of the voltage-limit circle center described in (33). This effect can also be interpreted from a phasor perspective, as shown in Figure 5.
This flux linkage vector decomposition effect is explicitly modeled in the proposed control, which also considers the reduction in the magnitude of λ p m due to magnetic saturation and temperature, cross-coupling between the d- and q-axis inductances, phase resistance variability, and resolver angle offsets.
Due to the appearance of λ p m q , generated by flux linkage vector decomposition due to core saturation, the permanent magnet flux linkage λ p m is divided into two components: one on the direct axis ( λ p m d ) and another on the quadrature axis ( λ p m q ). This requires the expression for the electromagnetic torque to be reformulated, as shown in Equation (28). In SPMSMs, the inductances L d and L q are often considered equal or nearly equal, which leads to the b term (27) becoming zero. This choice avoids oversimplification and highlights the specific contribution of each axis, ensuring that the origin of the different torque components is clearly understood, even if in practice their values may be very similar.
a = λ p m d i q λ p m q i d  
b = ( L d L q ) i d i q
M e = m 2 p a + b = m 2 p λ p m d i q λ p m q i d  
Due to the vector decomposition of λ p m , the quadrature axis flux and the direct axis voltage become dependent on λ p m q . Similarly, the direct axis flux and quadrature axis voltage depend on λ p m d .
λ d = L d i d + λ p m d
λ q = L q i q + λ p m q
u d = i d R s + d λ d d t ω e L q i q λ p m q ω e
u q = i q R s + d λ q d t + ω e L d i d + λ p m d ω e
It is important to note that core saturation directly affects vector variation and not λ p m saturation, which reduces the magnitude of the magnetic field generated by the magnets.
Due to flux linkage vector decomposition, the equations used to calculate the currents change, and therefore, the different control paths also change, producing significant differences in i d and i q diagrams and their work zones, as shown in Figure 6. In a core-saturated SPMSM, the torque curves are rounded, not horizontal lines, similar to those of an interior permanent magnet synchronous motor (IPMSM), as indicated by Choi et al. [35], due to the impact of i d on the magnetic flux and the resulting torque (28). Furthermore, the voltage-limit curves based on the angular velocity change from centered circumferences, as defined in (22), point C’, Figure 6, to circumferences with centers dependent on variation on L q (33), point C, Figure 6.
( i d , c , i q , c ) = λ p m d L d , λ p m q L q
If the SPMSM presents core saturation, the expressions for the 3 zones change, since the direct axis current influences the electromagnetic torque. This requires iteration to compute the current values.
The maximum torque for the MTPA zone can be found by iterating the i d and i q values in the torque Formula (28).
i d , M T P A = M e 3 2 p λ p m q λ p m d i q λ p m q
i q , M T P A = M e 3 2 p λ p m d λ p m q i d λ p m d
In the FW zone, the goal is to maintain constant power and voltage, adjusting i d and i q according to the torque needed at each speed, ensuring maximum constant voltage.
c = 9 λ p m d 2 U m a x , p h 2 p 2
d = 4 L 2 M e 2 ω e 2 + 9 λ p m q 2 U m a x , p h 2 p 2
e = 2 λ p m q L M e ω e
f = 3 p λ p m d 2 + λ p m q 2
g = 3 λ p m q 3 ω e p 3 λ p m d 2 λ p m q ω e p + 2 λ p m d L M e ω e
h = 3 L ω e p λ p m d 2 + λ p m q 2
i d , F W = λ p m d ω e λ p m d c d e f 1 L ω e
i q , F W = λ p m q c d g h
In the MTPV zone, the goal is to find the intersection between the highest torque curve and the voltage circumference for a determined speed. This requires iteration between the quadrature and direct current values.
i = λ p m q ω e U m a x , p h + i q L ω e
j = U m a x , p h + λ p m q ω e + i q L ω e
k = λ p m d ω e U m a x , p h + i d L ω e
l = U m a x , p h + λ p m d ω e + i d L ω e
i d , M T P V = i j λ p m d ω e ω e L
i q , M T P V = k l λ p m q ω e ω e L
To improve motor efficiency, the control proposed here considers not only the usual copper losses but also iron losses. Copper losses are easily calculated as they are proportional to the square of the currents, as shown in Equation (51). However, iron losses have a nonlinear nature, since they are composed of losses by hysteresis and eddy currents. The behavior can be estimated with the expression (53), depending on the electrical frequency and the total flux module.
M I = f T e , N m
P c u = R s i d 2 + i q 2
n = L i d + λ p m d 2 + L i q + λ p m q 2
P f e c f e ω β n = c f e ω β λ d 2 + λ q 2
In conventional controls, the MI is usually operated until harmonic injection in the linear zone to reduce the current and, therefore, the Joule losses P c u . Others operate on the overmodulation zone to maximize bus voltage use. However, these strategies do not account for increased iron losses P f e associated with the increase in magnetic flux linked to higher voltage and THD.
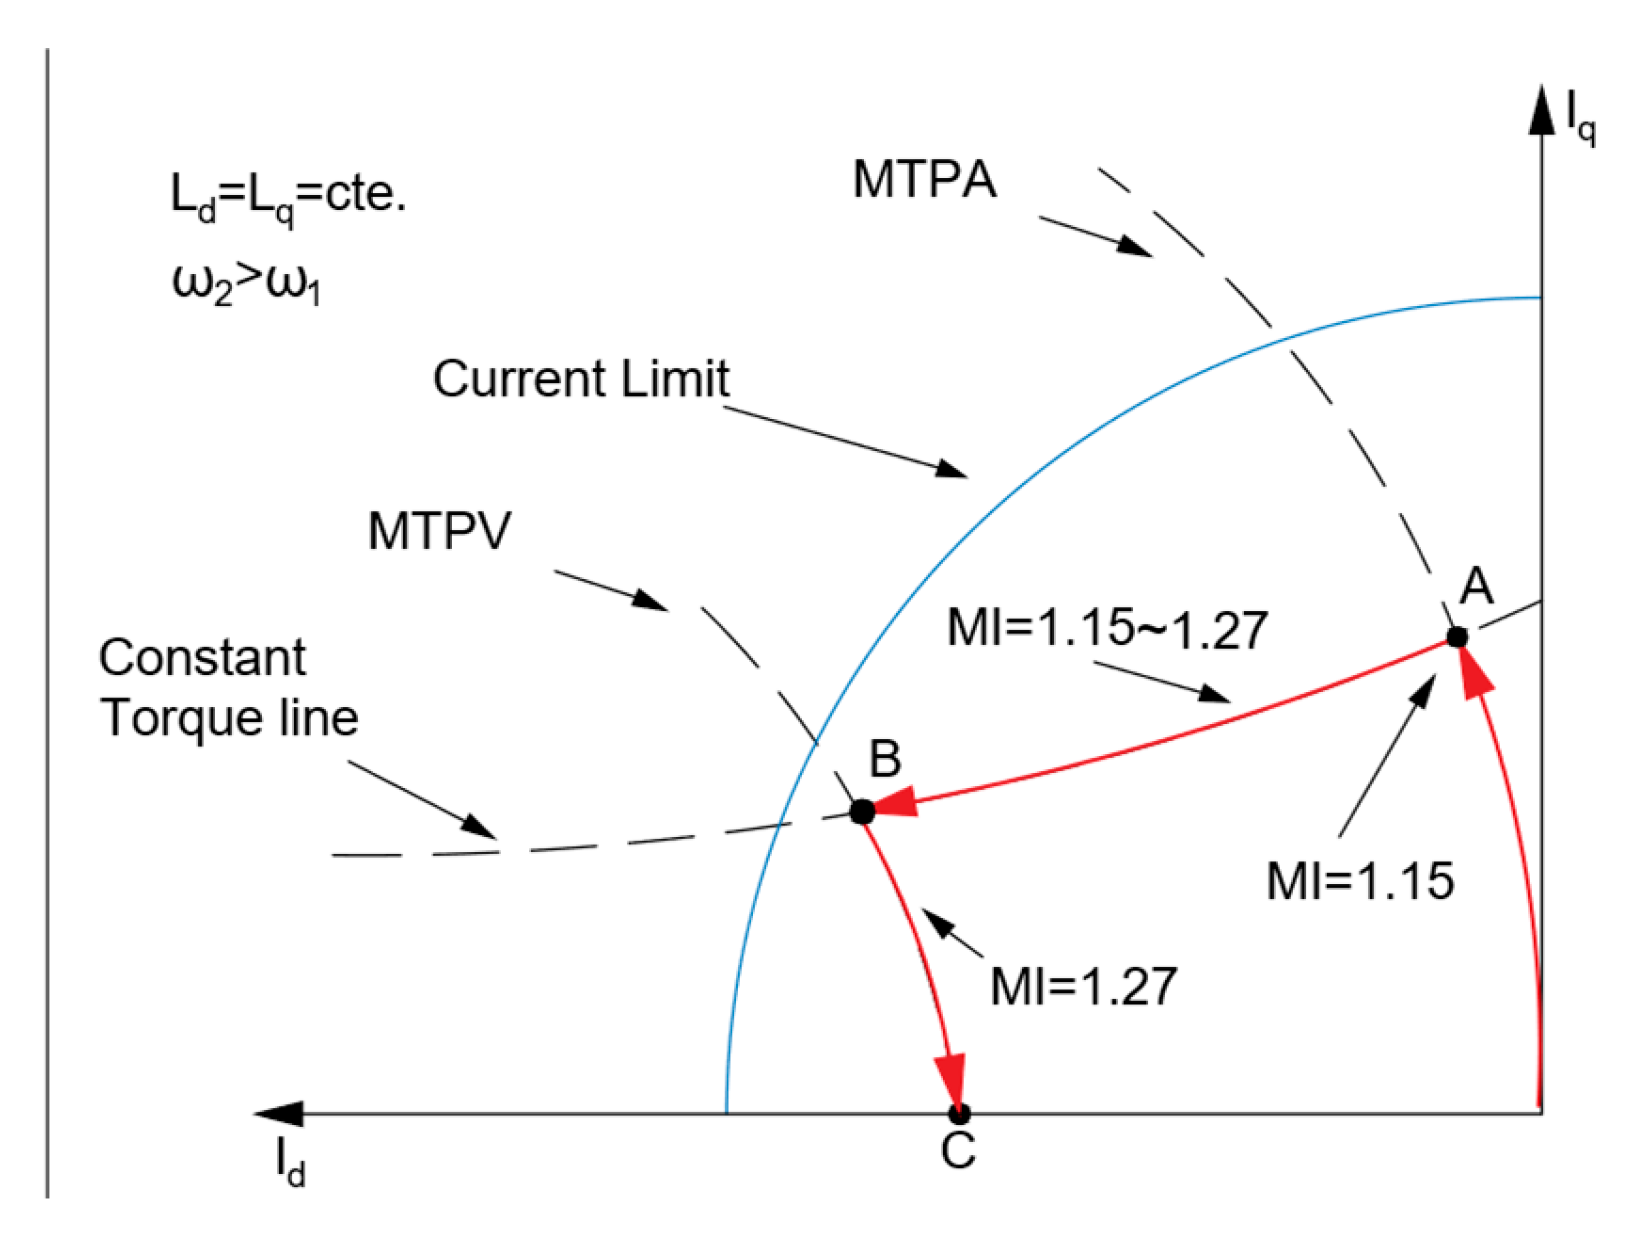
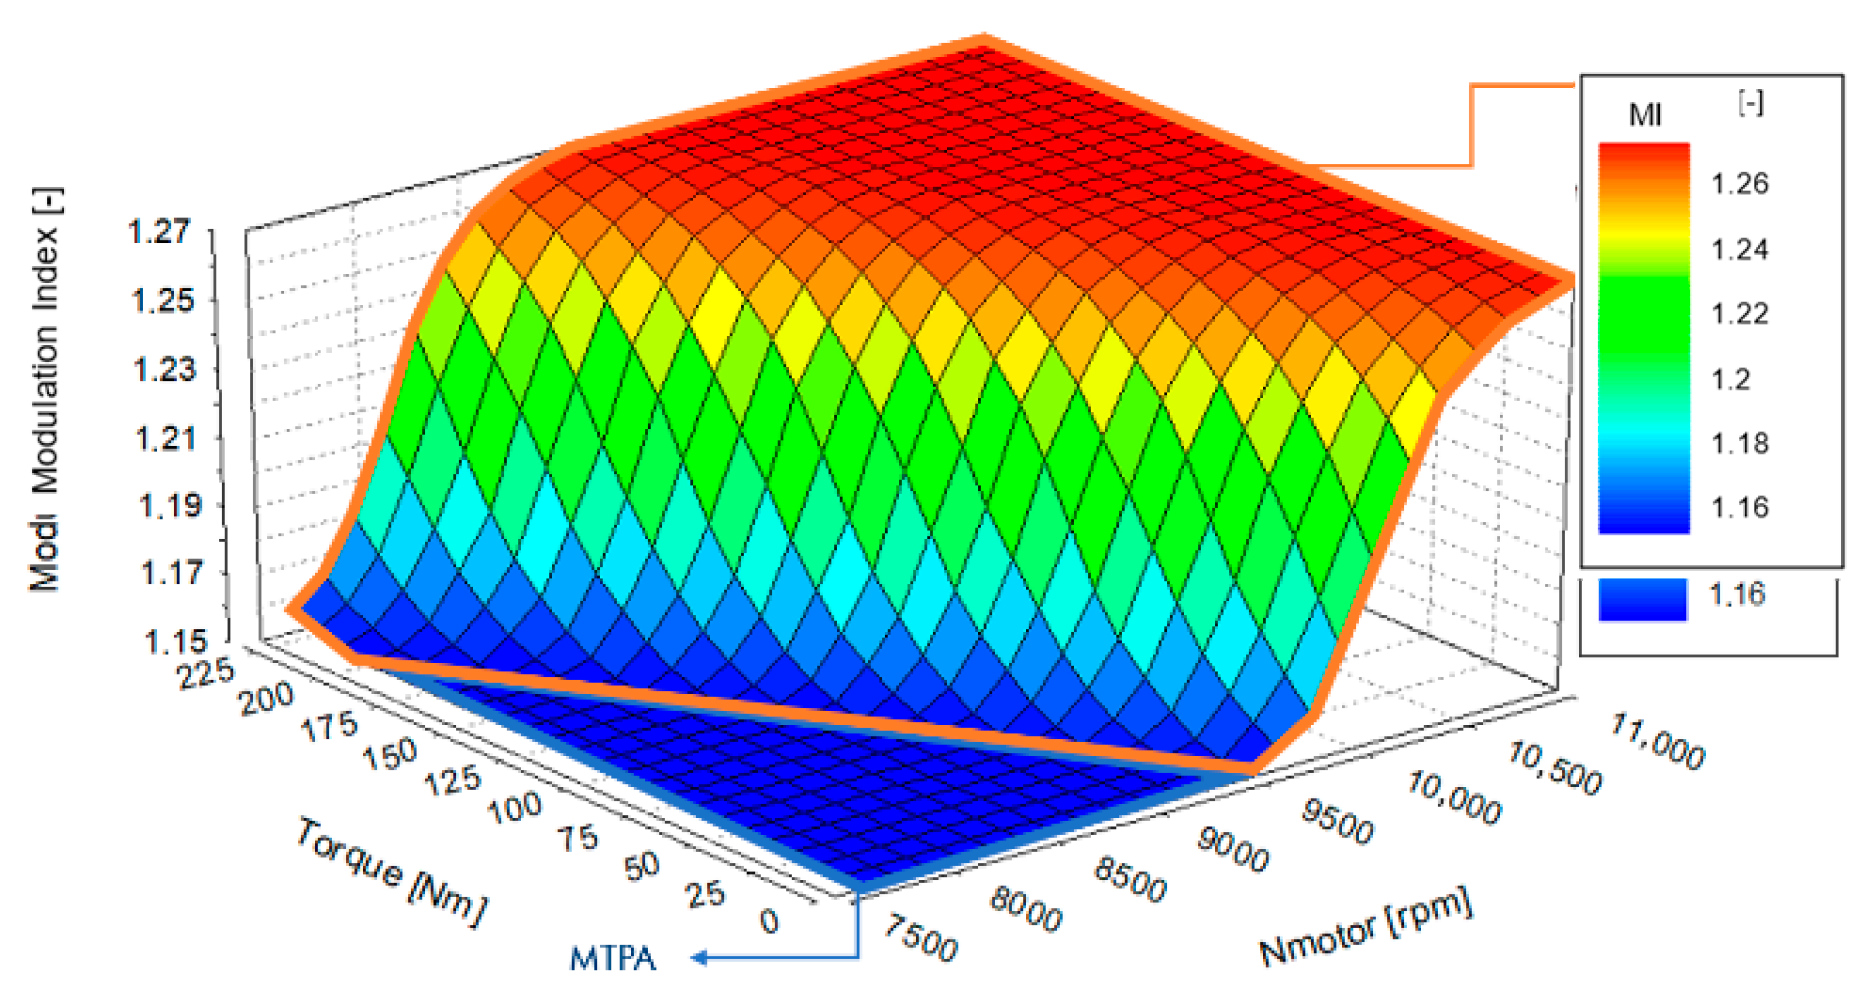
As shown in Figure 7, a low MI value (1.15) is used in the MTPA zone, since the voltage applied is lower than the maximum, and the system is not voltage-limited. In the MTPV zone, the highest possible MI (up to 1.27) is applied in order to expand the voltage limit and maximize the available torque. The most relevant phenomenon occurs in the FW zone, where there is a balance between P c u and P f e . In this range, an optimal MI value is sought that minimizes total losses, ranging between 1.15 and 1.27, as also highlighted by Park et al. [36].

2.2.2. Comparative

The proposed method considers R s f T , magnetic saturation, variable MI and AO, as well as flux linkage vector decomposition and inductance nonlinear variability. The latter two have the most direct influence on the trajectories shown in Figure 6, causing a displacement of the center of the voltage-limit circle and a modification of the torque curves. As a result, more accurate control zones are obtained. The main differences with respect to the baseline controls are as follows, and summarized in Table 1.
  • MTPA: The flux linkage vector decomposition of the permanent magnets introduces an i d 0 , since the constant-torque curves are no longer horizontal. This enables reaching I m a x along a curved trajectory O–A. In contrast, the baseline simplification maintains the vertical O–A′ and does not consider the nonlinear dependencies, not reaching I m a x .
  • FW: In baseline control, the field-weakening zone is assumed as a horizontal trajectory, with constant L and MI, and without considering cross-coupling effects, nor the variation of R s   f T . The proposed control introduces the temperature dependence of R s , variable inductances with current, and a variable MI, which allows the trajectory to properly follow the intersection between the current-limit and the voltage-limit circle, as well as increasing its performance and efficiency.
  • MTPV: In this region, the voltage-limit circle does not maintain a nominal center, since L varies with current. The proposed control adapts to this displacement, keeping the trajectory on the upper side of the effective circle, reaching the maximum torque achievable within the voltage limit. Unlike the baseline vertical trajectory (B’-C’), the proposed method results in a curved trajectory (B-C), as shown in Figure 6.
  • A O : The resolver angle error affects the injection of i d and i q , especially at high speed, provoking a rotation of the reference frame. If not corrected, deviations from the optimal trajectory appear, and performance is degraded. The proposed approach compensates AO, keeping the current vector aligned with the motor’s real axes and improving accuracy across all regions.

Table 1. Comparative baseline control vs. proposed control.
ParameterBaselineProposed
Phase ResistanceConst. f T (Nonlinear; LUT 1D)
InductanceConst. f ( i d , i q )   (Nonlinear; LUT 2D)
Main Flux Linkage Linear f ( i q ) λ p m d ,   λ p m q   with   f ( T , i d ,   i q ,   )
(Nonlinear; LUT 3D)
Saturation AngleNot present f i d , i q (Nonlinear; LUT 2D)
Modulation IndexConst. f ( M e , N m ) (Nonlinear; LUT 2D)
Angle Offset Linear f ( N m ) f ( N m ) (Nonlinear; LUT 1D)

3. Materials and Methods

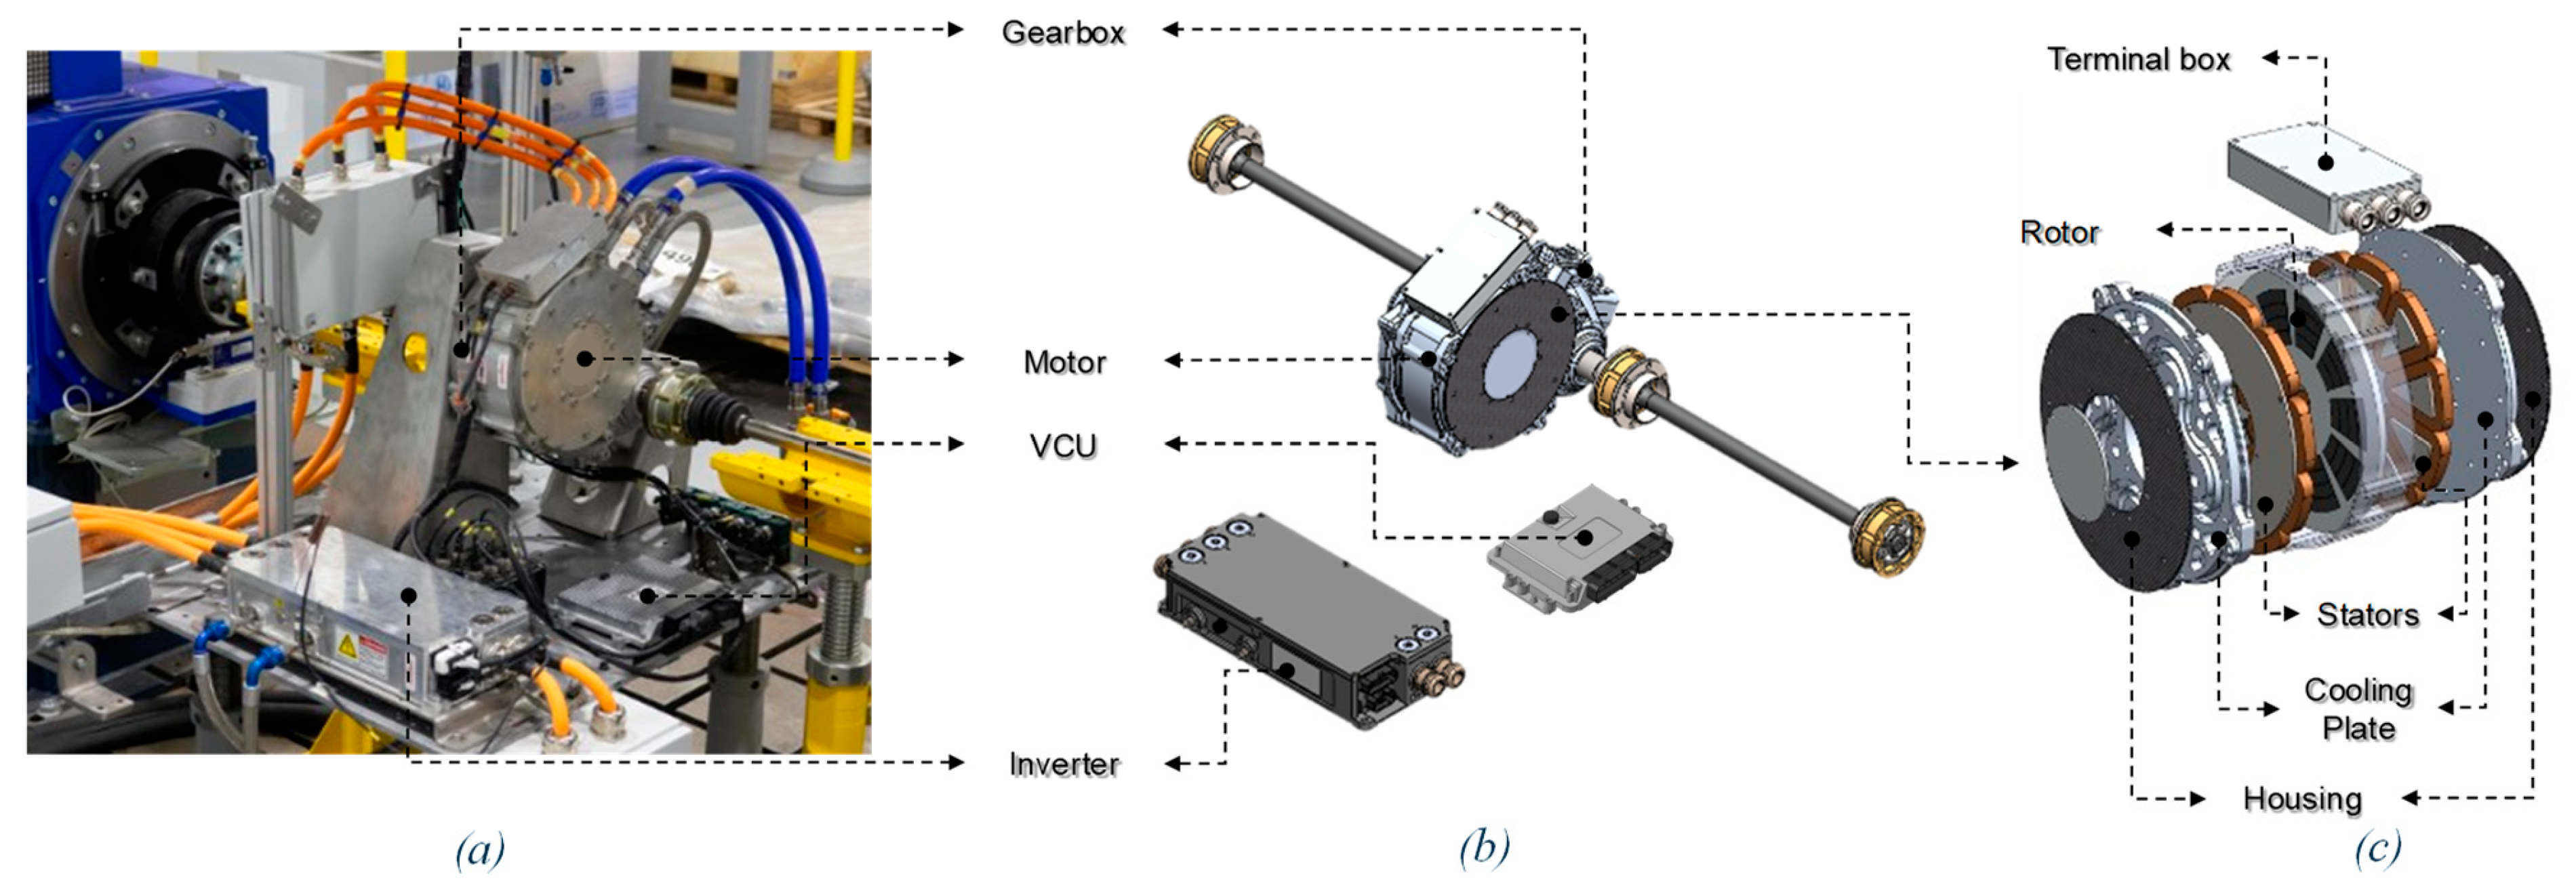
The characteristics of the electric drivetrain system tested here, including the VCU (Ecotron Corp., Torrance, CA, USA) as seen in Figure 8, can be found in Table 2. A versatile inverter (Rinehart Motion Systems LLC, Wilsonville, OR, USA) was used to power a DS-AFSPMSM (Magelec, Shanghai, China), capable of generating up to 147 kW and reaching 12,500 rpm. Power transmission was done via a reduction gear with limited slip differential (LSD) (Sadev, Saint-Prouant, France).
The tests were performed on an AVL e-Axle active test bench (AVL List GmbH, Graz, Austria), which simulates both static and dynamic wheel conditions. This enables work in all four quadrants, which helps reproduce road conditions.

4. Results—Implementation and Performance Evaluation

4.1. Implementation of the Proposed Control

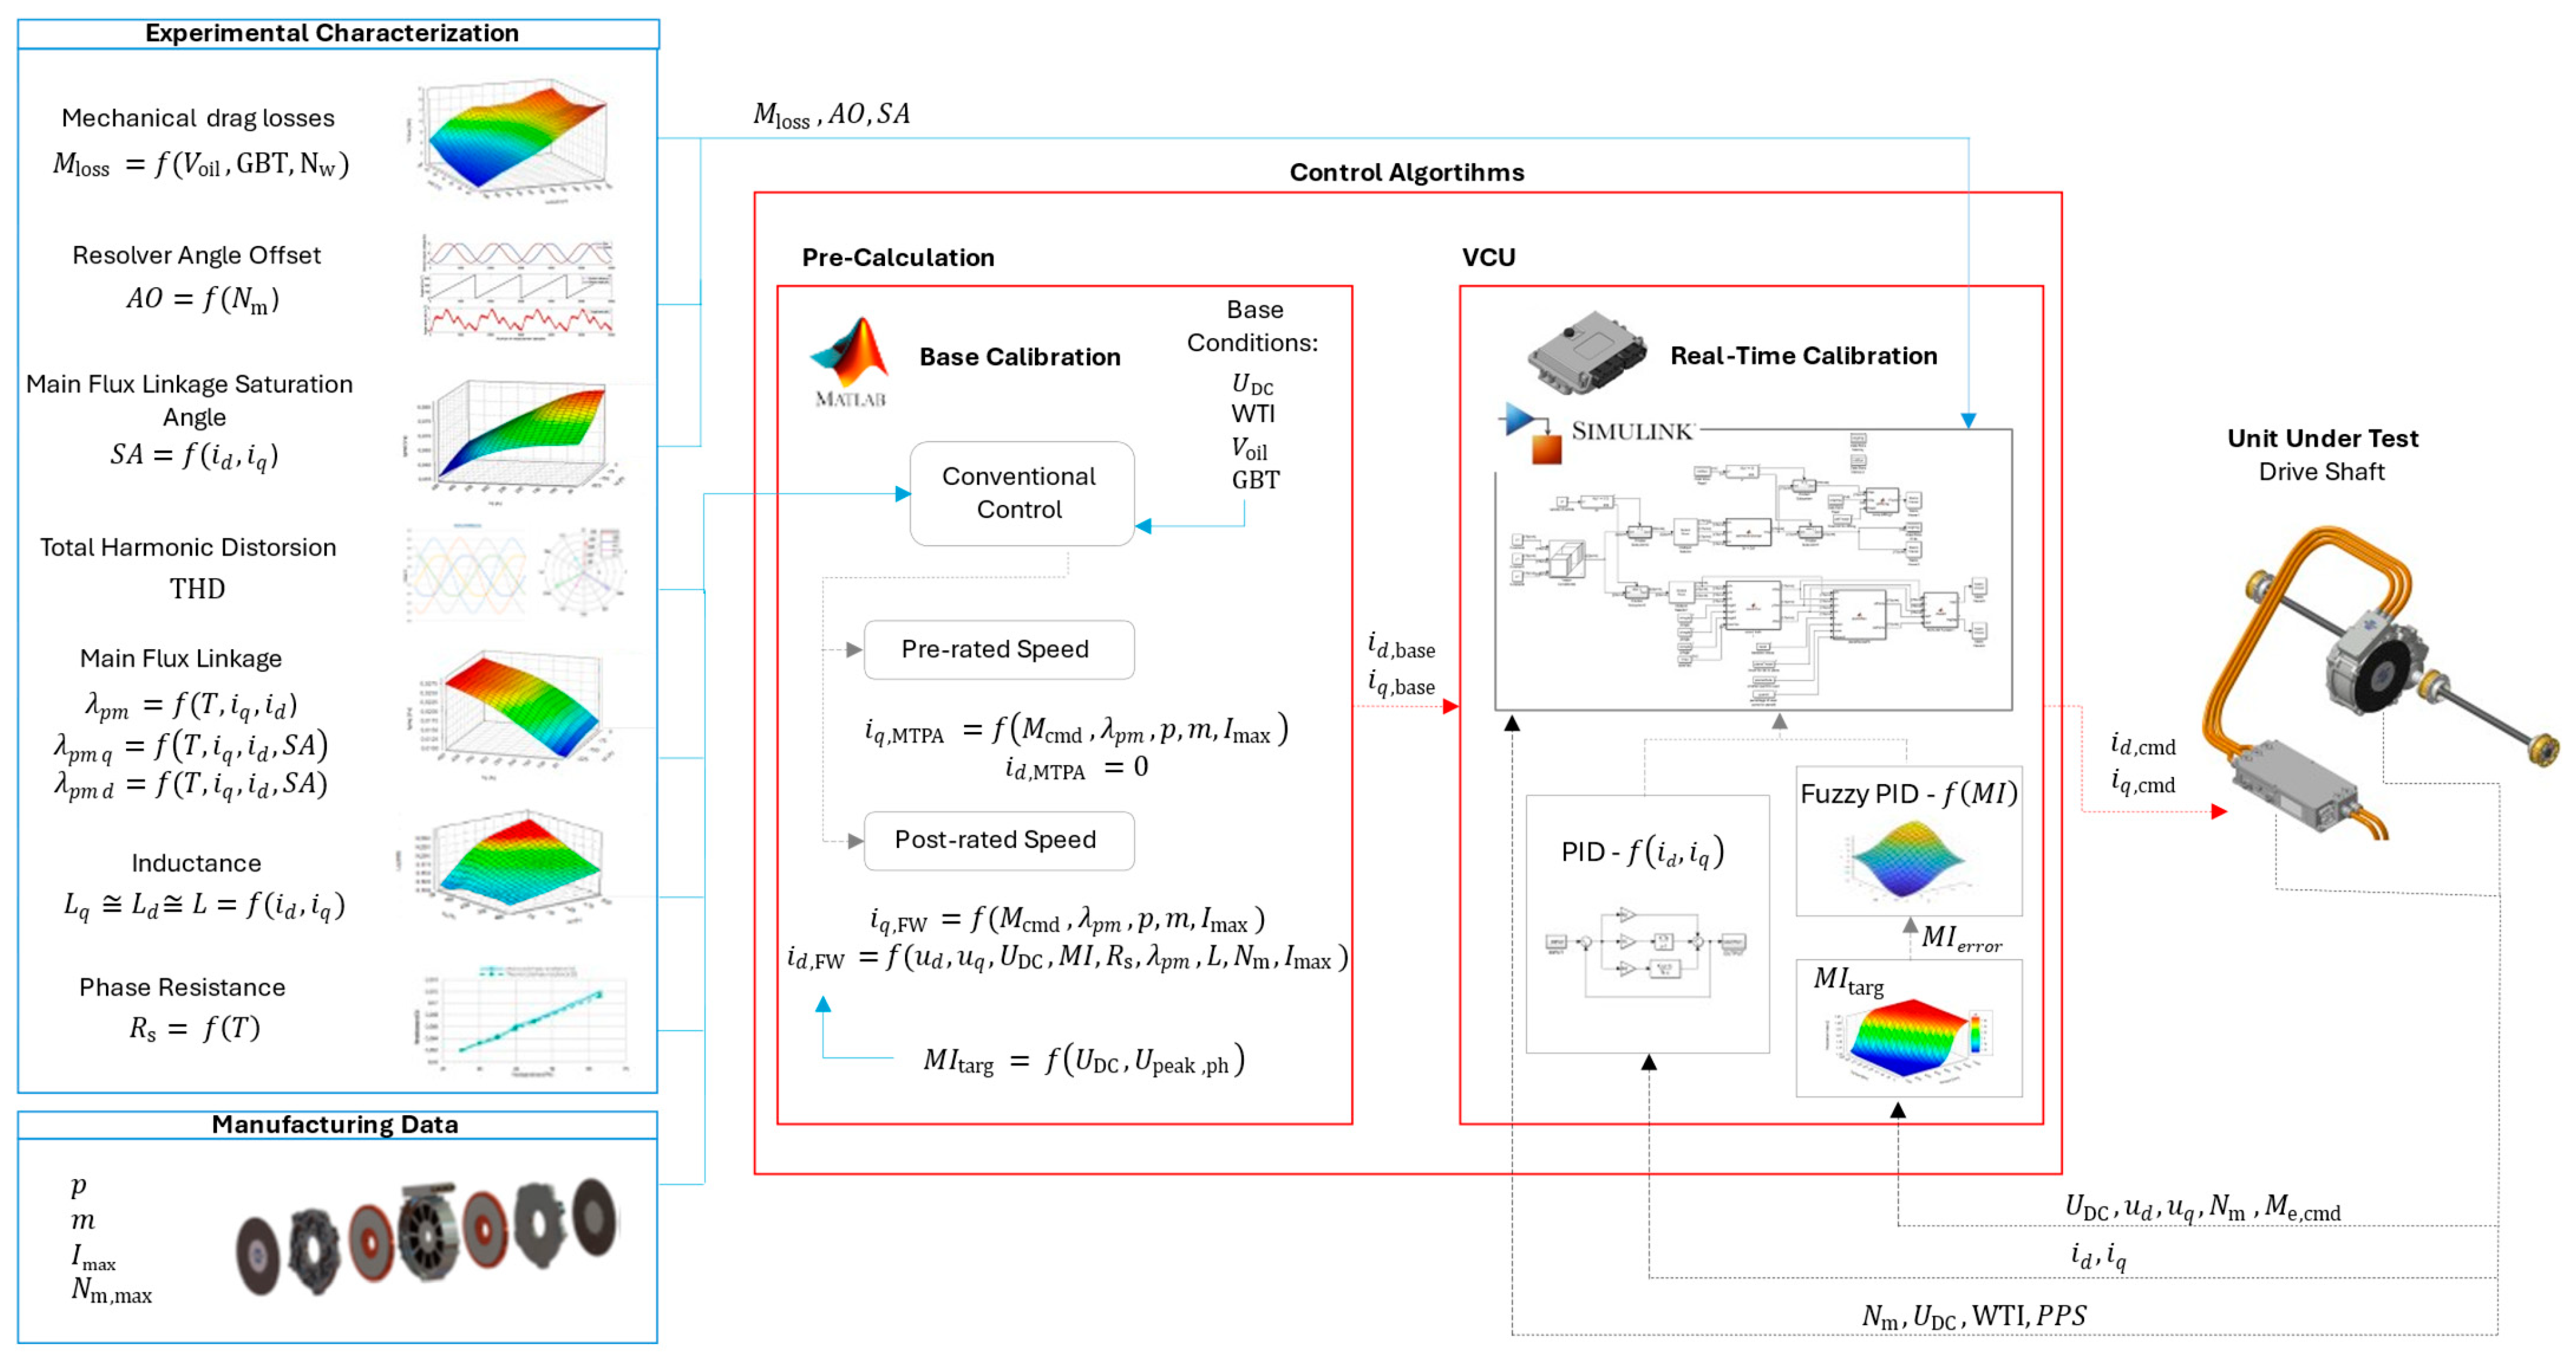
For the implementation of the proposed control, a system was developed based on data obtained from experimental tests, structured in two stages: a pre-calculation phase and an execution phase in the VCU. Conventional controls for SPMSMs prioritize integration between the inverter and the motor, minimizing experimental calibration at the expense of performance. The approach proposed here preserves operational simplicity but requires detailed bench testing to characterize M l o s s , THD, λ p m , L , and R s as functions of their influencing variables. These parameters, and their dependence on temperature, current, and speed, were comprehensively studied in [22] by the authors, whose methodology and results were used as a reference for this work.
Initially, a detailed SPMSM model including flux linkage vector decomposition under core saturation was developed. Its Equations ((28)–(32) and (34)–(49)) must be iteratively solved, which is not suitable for direct VCU implementation. Instead, the results are precomputed to generate multidimensional look-up tables, which are corrected afterwards. This set constitutes the calibration base.
On this basis, the VCU implements a control programmed and compiled in MATLAB/Simulink™ (R2024a), responsible for correcting the resolver angle offset (AO) and saturation angle (SA), adjusting the modulation index (MI) and battery voltage influence through LUTs, and enabling calibration adjustments and PID tuning for torque and speed during commissioning. The validation, performed by comparing the LUT-based control with the full iterative model, showed a maximum difference of 0.08% in the resulting currents and torque, confirming that the proposed approach preserves the accuracy of the full model and the flexibility of calibration, while retaining parameter variability and flux linkage vector decomposition. Figure 9 illustrates the complete implementation workflow, linking experimental characterization, pre-calculation, VCU execution, and integration with the UUT.
The proposed control strategy has been implemented in a vehicle control unit (VCU), demonstrating its applicability in real automotive environments. From a computational perspective, the proposed method shifts complexity to the offline calibration stage, while real-time execution is mainly based on LUT interpolation and simple algebraic operations. This results in a limited computational overhead compared to conventional FOC, enabling its implementation within typical automotive control cycle times on standard VCUs.

4.1.1. Resolver Angle Offset (AO)

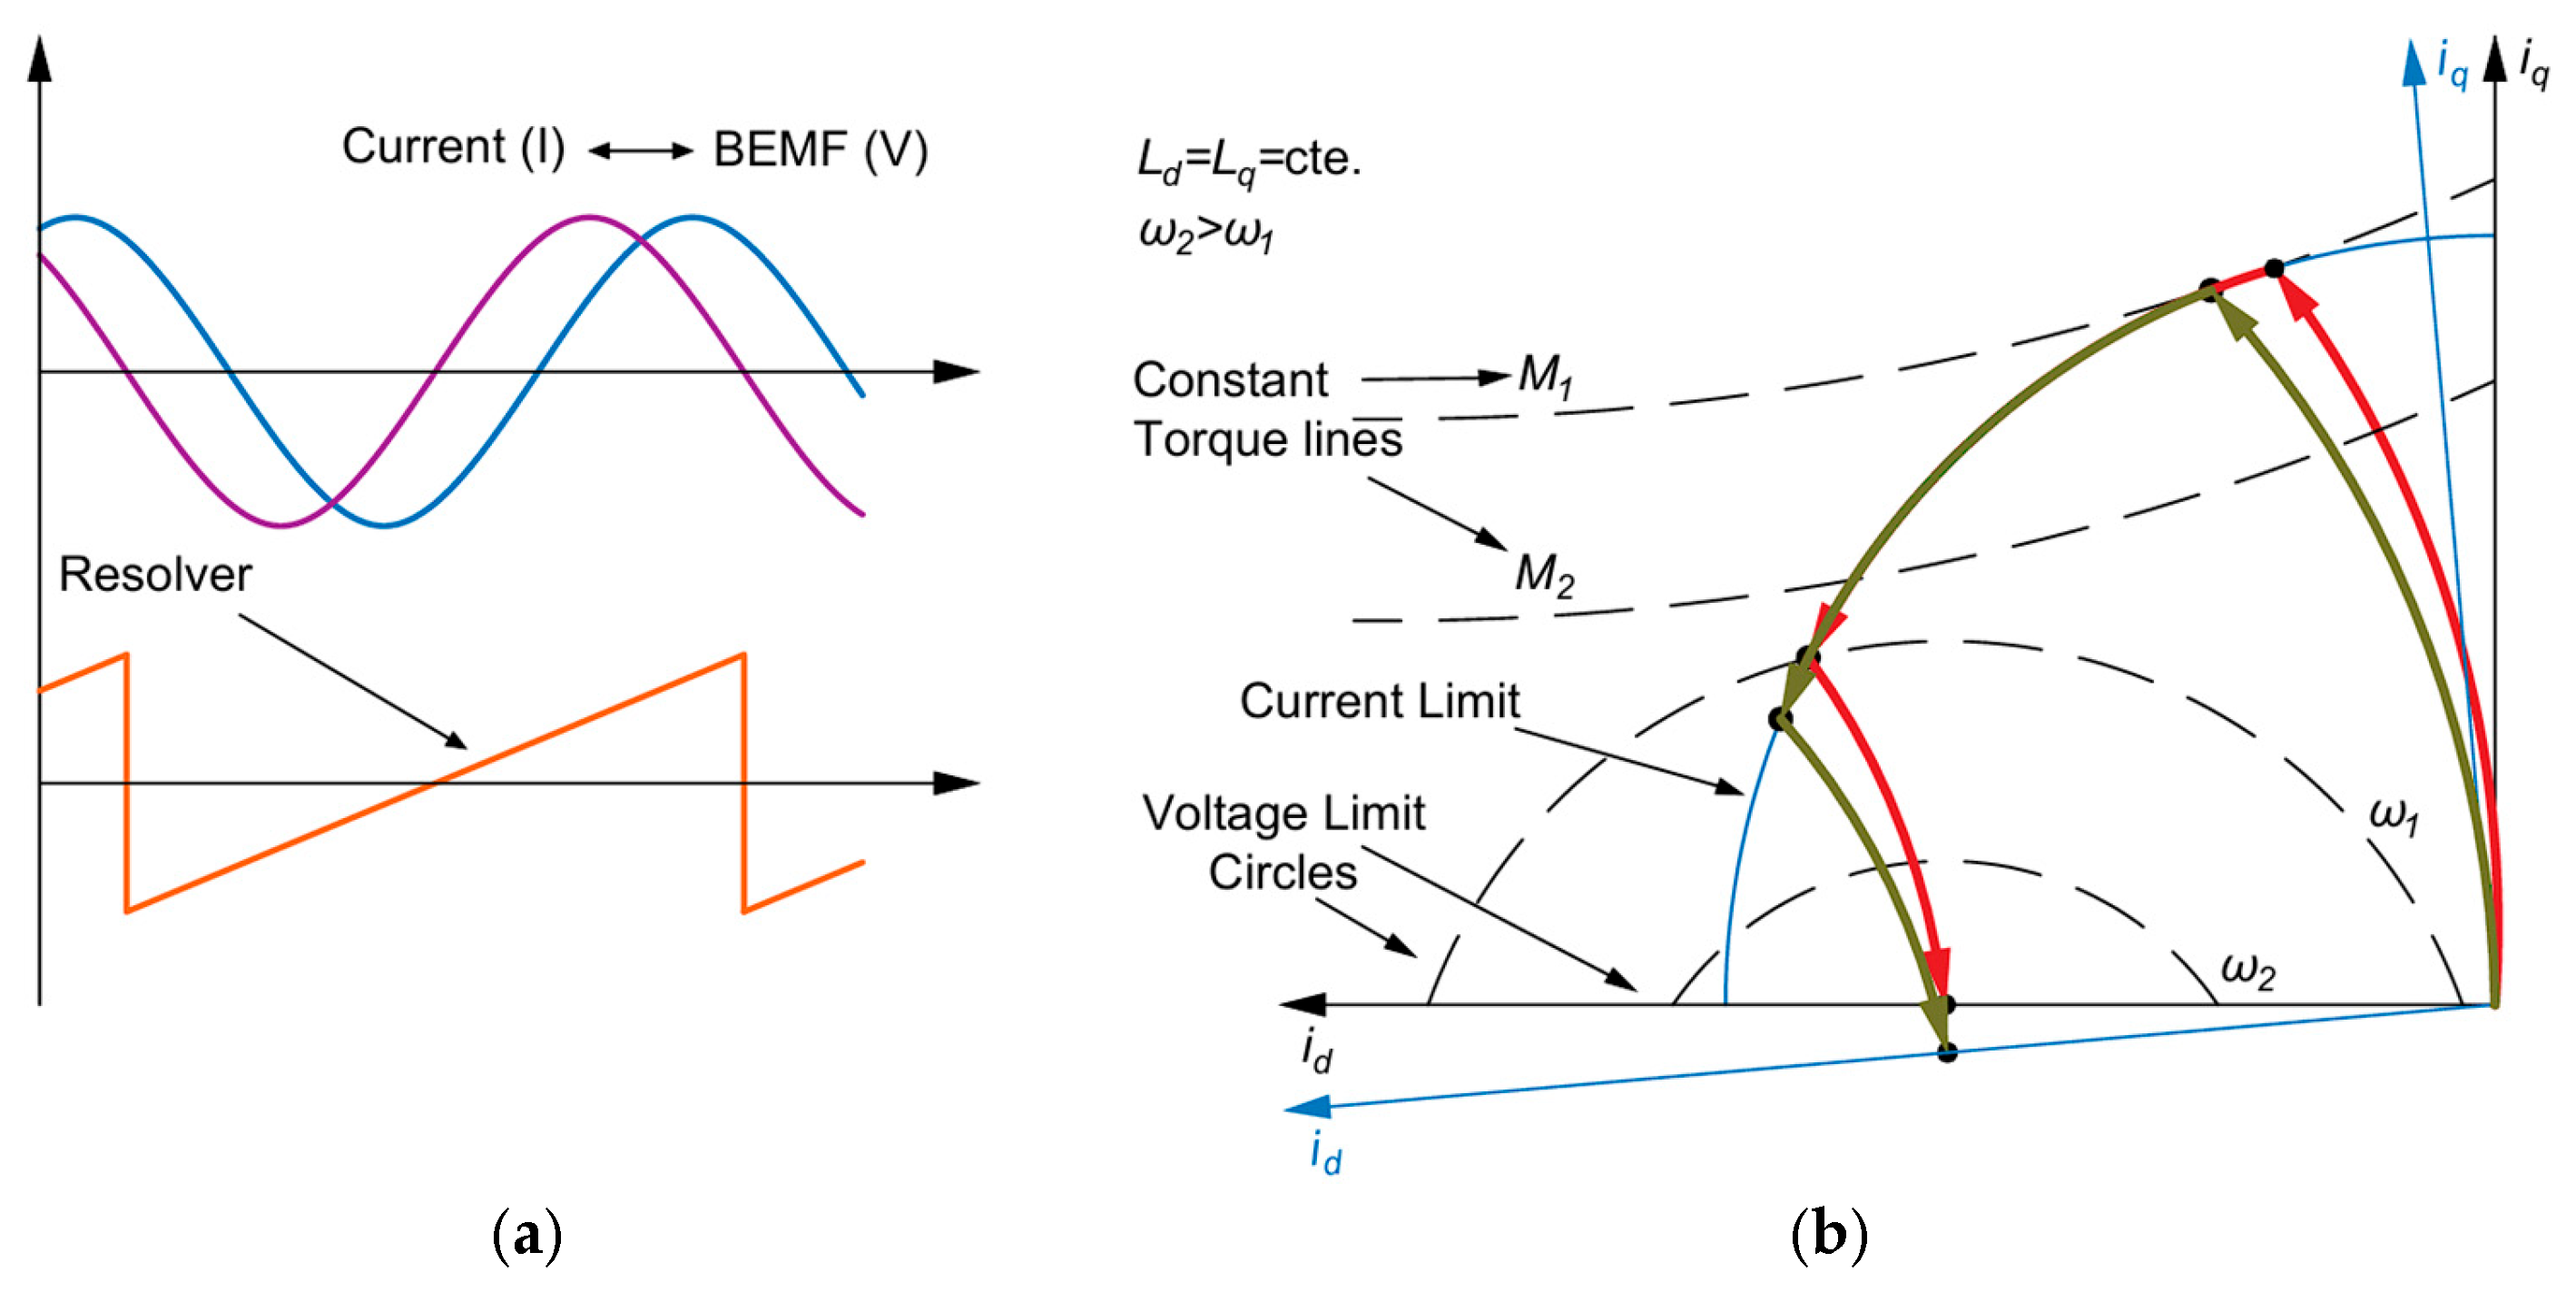
For the motor to operate correctly, the back electromotive force (BEMF) waveforms must be aligned with those of the inverter output current, as shown in Figure 10a, which shows a phase shift relative to the estimated position. This angular phase shift is known as AO. Incorrect reading of the angle causes a i d and i q vector translation, as observed in Figure 10b. This affects accurate reading and command of currents and applying the Park transform. This type of error has been addressed in the literature, such as in Kim et al. [37], who propose to improve angular estimation using observers with coordinate transformation.
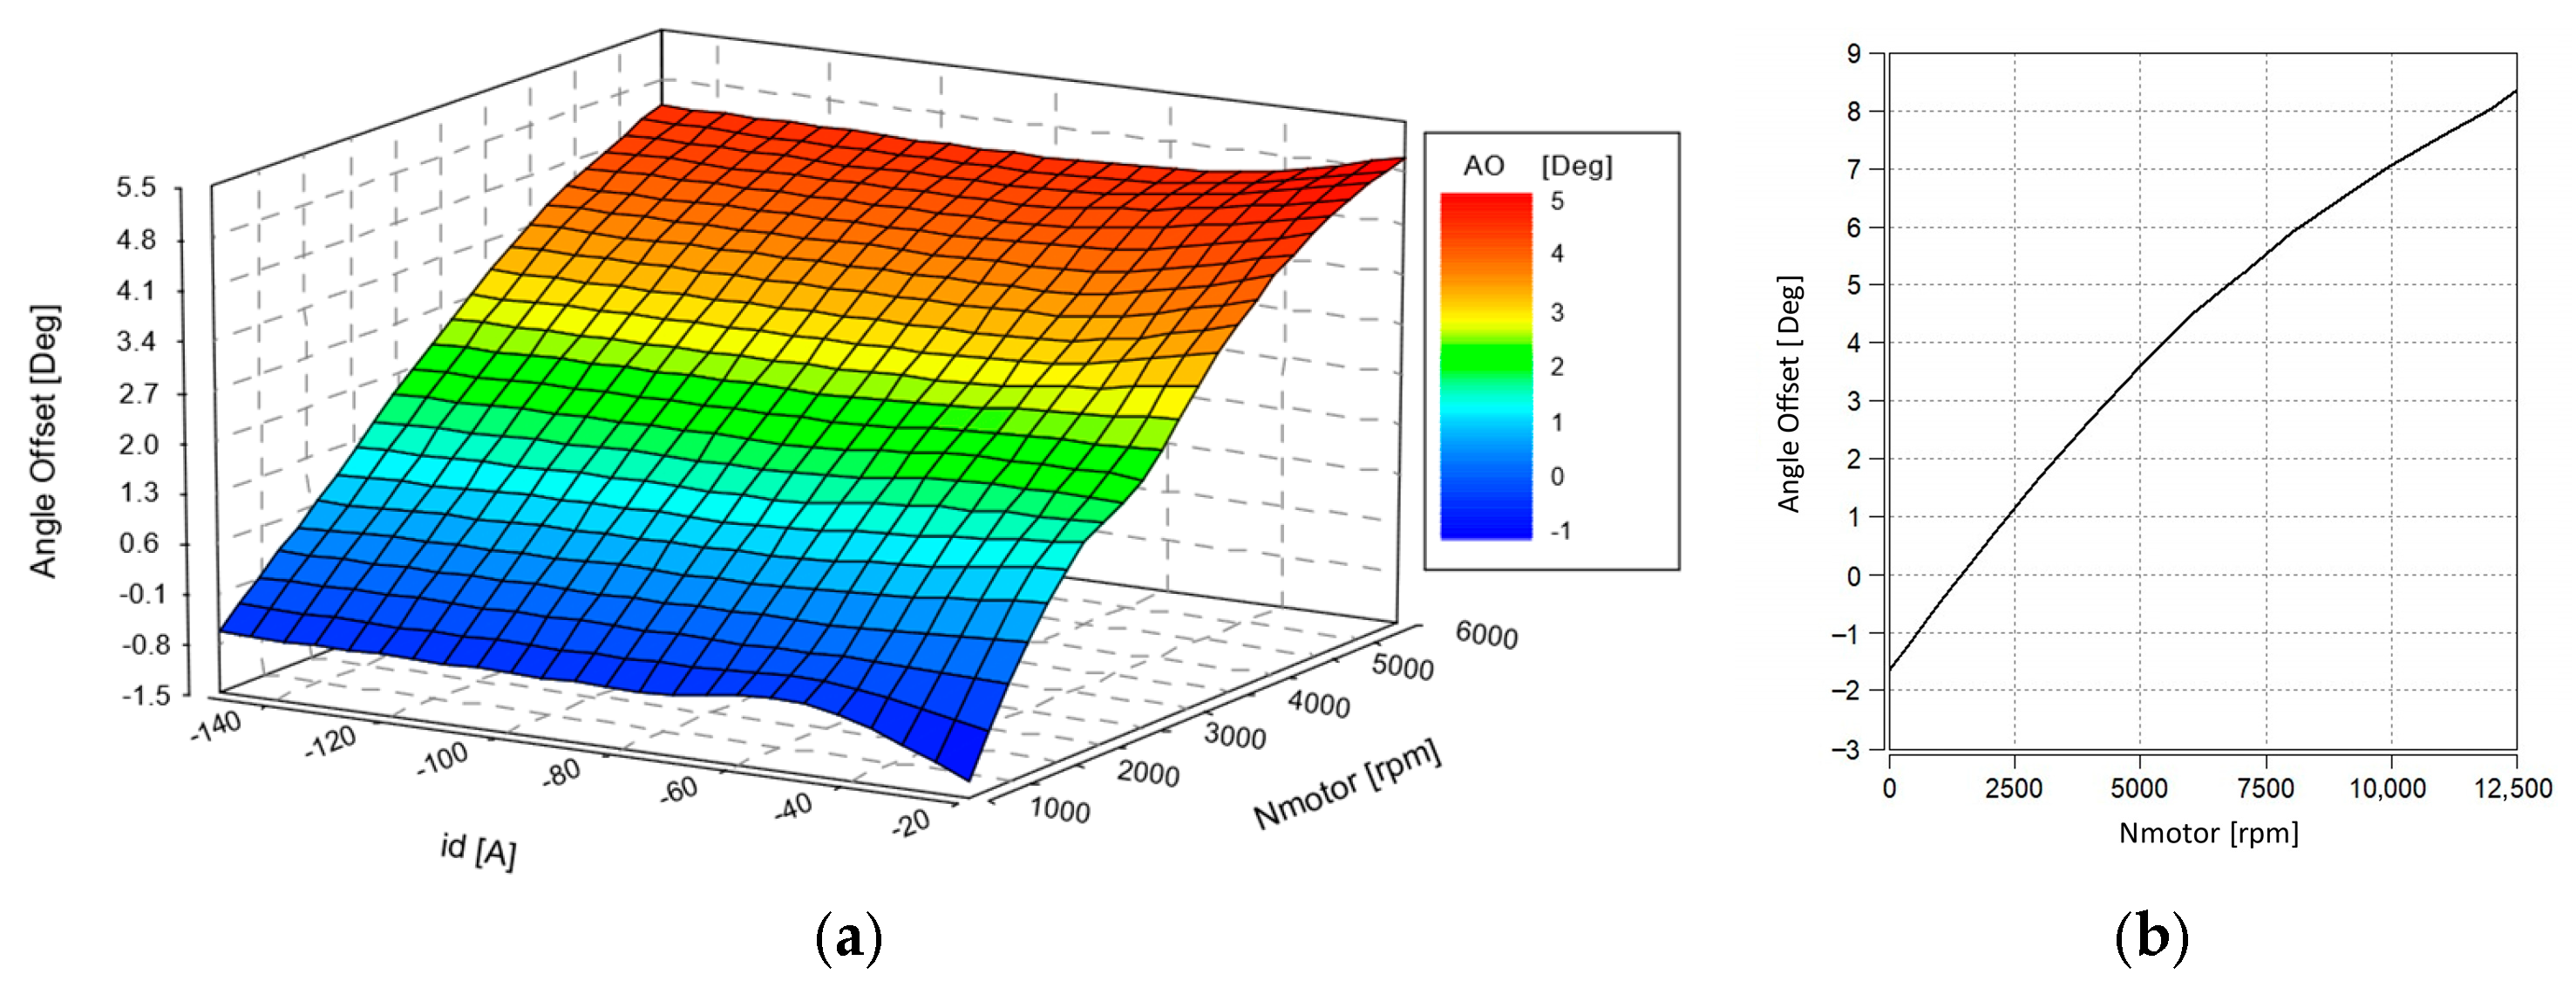
To characterize the angle offset, a bench test was performed by varying the motor speed and injecting current only into the direct axis, maintaining i q = 0 . Then, the advance angle is adjusted until the generated torque matches the drag torque without injection, which is associated with the system’s mechanical losses. The different combinations of speed and current are evaluated, keeping thermal conditions constant.
The analysis shows that the angle offset depends largely on the speed, with little sensitivity to i d except at very low currents, where the error increases. This can be seen when comparing these points with the rest in Figure 11.
A O = f N m
The experimental evaluation is limited to speeds below the rated speed (6000 rpm at 600 V), since a considerable presence of BEMF in the FW zone requires injecting i d , which prevents the application of this methodology beyond that point. Although the application of this method above 6000 rpm could be considered under zero power conditions, this would entail high thermal instability. Therefore, an extrapolation is considered between the rated speed and N m , m a x , as observed in Figure 11b.
The angular phase shift shows a nonlinear dependence on speed, often approximating a logarithmic trend, which reveals the limitations of simple proportional models. This behavior requires real-world testing to accurately capture system dynamics and enable effective angle correction. Figure 11 presents the resulting surface, confirming that the AO can be represented as a two-dimensional function of motor speed.
Figure 11. (a) AO surface according to i q and rotor speed. There is a clear dependence on speed, and a minimal effect of the direct current variation except at low magnitudes. (b) Evolution of AO according to speed from 0 to N m , m a x after extrapolation.
Energies 19 01690 g011

4.1.2. PM Flux Linkage Saturation Angle (SA)

As discussed previously, core saturation induces a rotation of the permanent magnet flux linkage vector, referred to in this work as flux linkage vector decomposition. This rotation leads to the appearance of a non-zero quadrature-axis flux component λ p m q . The saturation angle is therefore defined as:
S A = f i d , i q
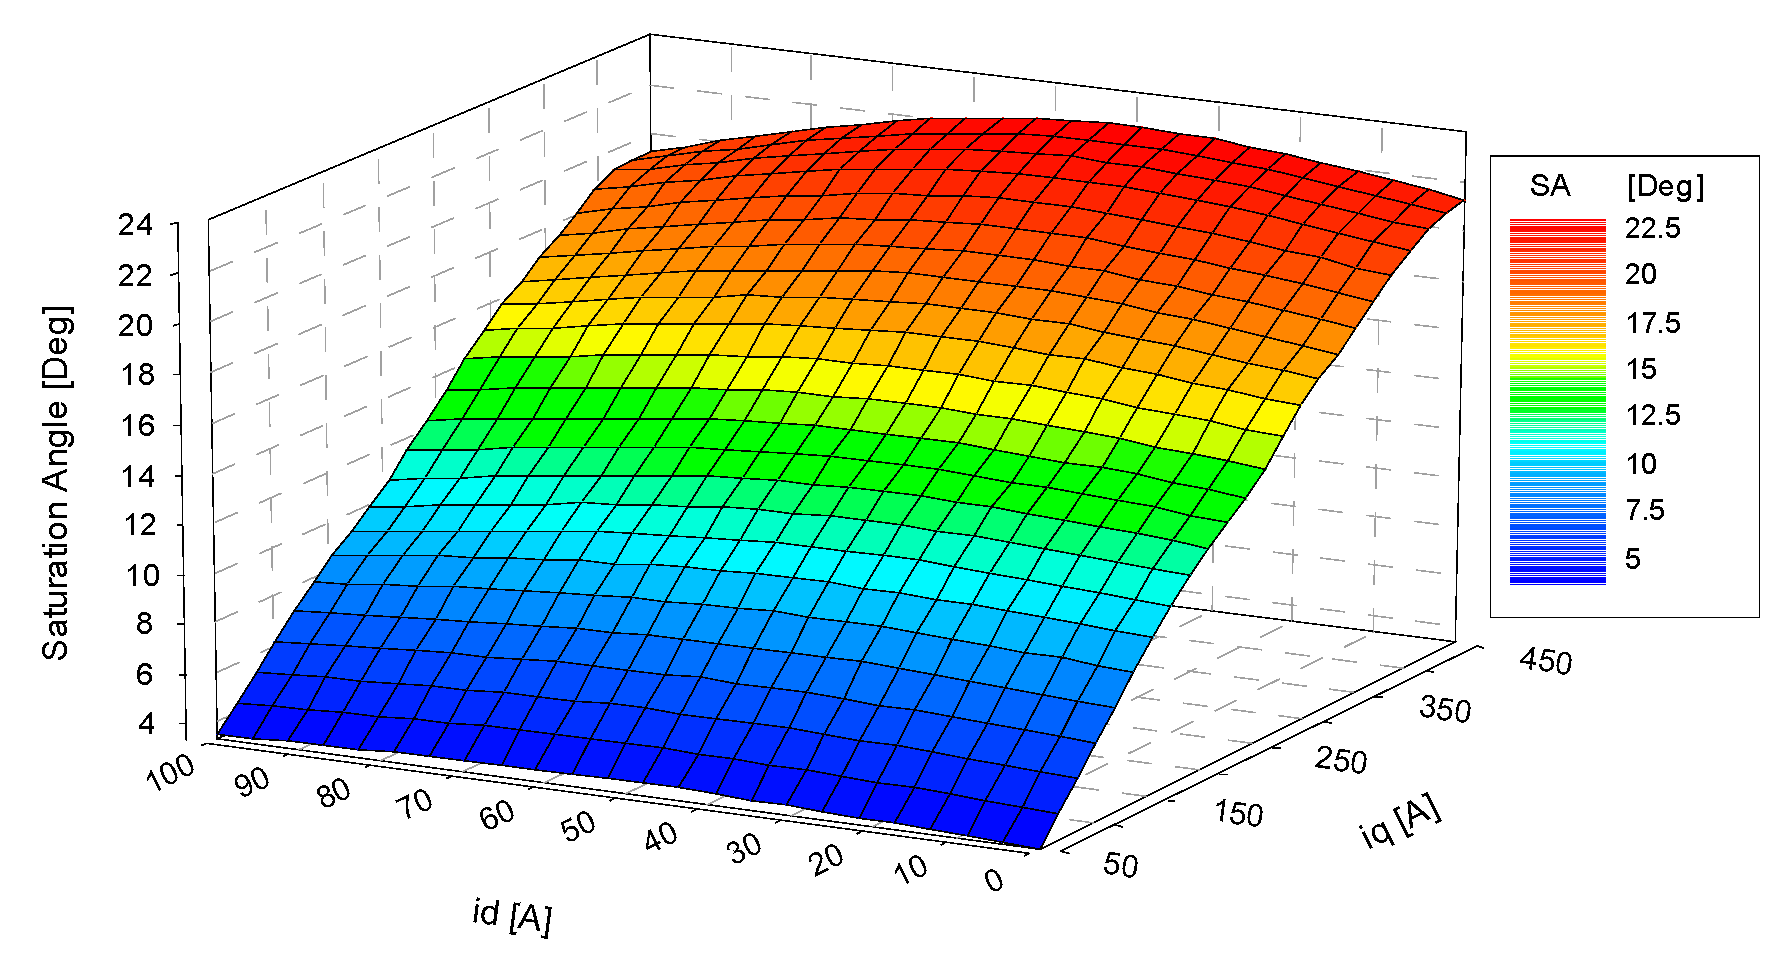
To characterize this rotation, an experimental test was performed by keeping the total injected current magnitude constant while varying the distribution between i d and i q , searching for the operating point that maximized performance. This approach allowed us to analyze the evolution of the saturation angle without altering the overall electromagnetic loading of the system, thereby isolating the effect of current magnitude redistribution on flux rotation.
The results show that SA depends mainly on i q , while i d progressively reduces it. This behavior is consistent with the cross-coupling effects described by Shi et al. [23], who analyze how interaction between axes modifies the flux in PMSMs. The i d action suggests demagnetization of the core, which delays the flux vector orientation. It was also found that the rotor speed does not significantly influence this parameter. Figure 12 shows the experimental surface obtained, where this double dependence on i d and i q can be seen.

4.1.3. Modulation Index (MI)

To determine the optimal value of the MI in FW, both static and dynamic tests were performed. In the first case, we kept the system load constant at different speed levels, while in the second case, speed ramps were applied under maximum load conditions. The optimal MI is defined here as the value that maximizes the overall drive efficiency while maintaining or improving the available output power.
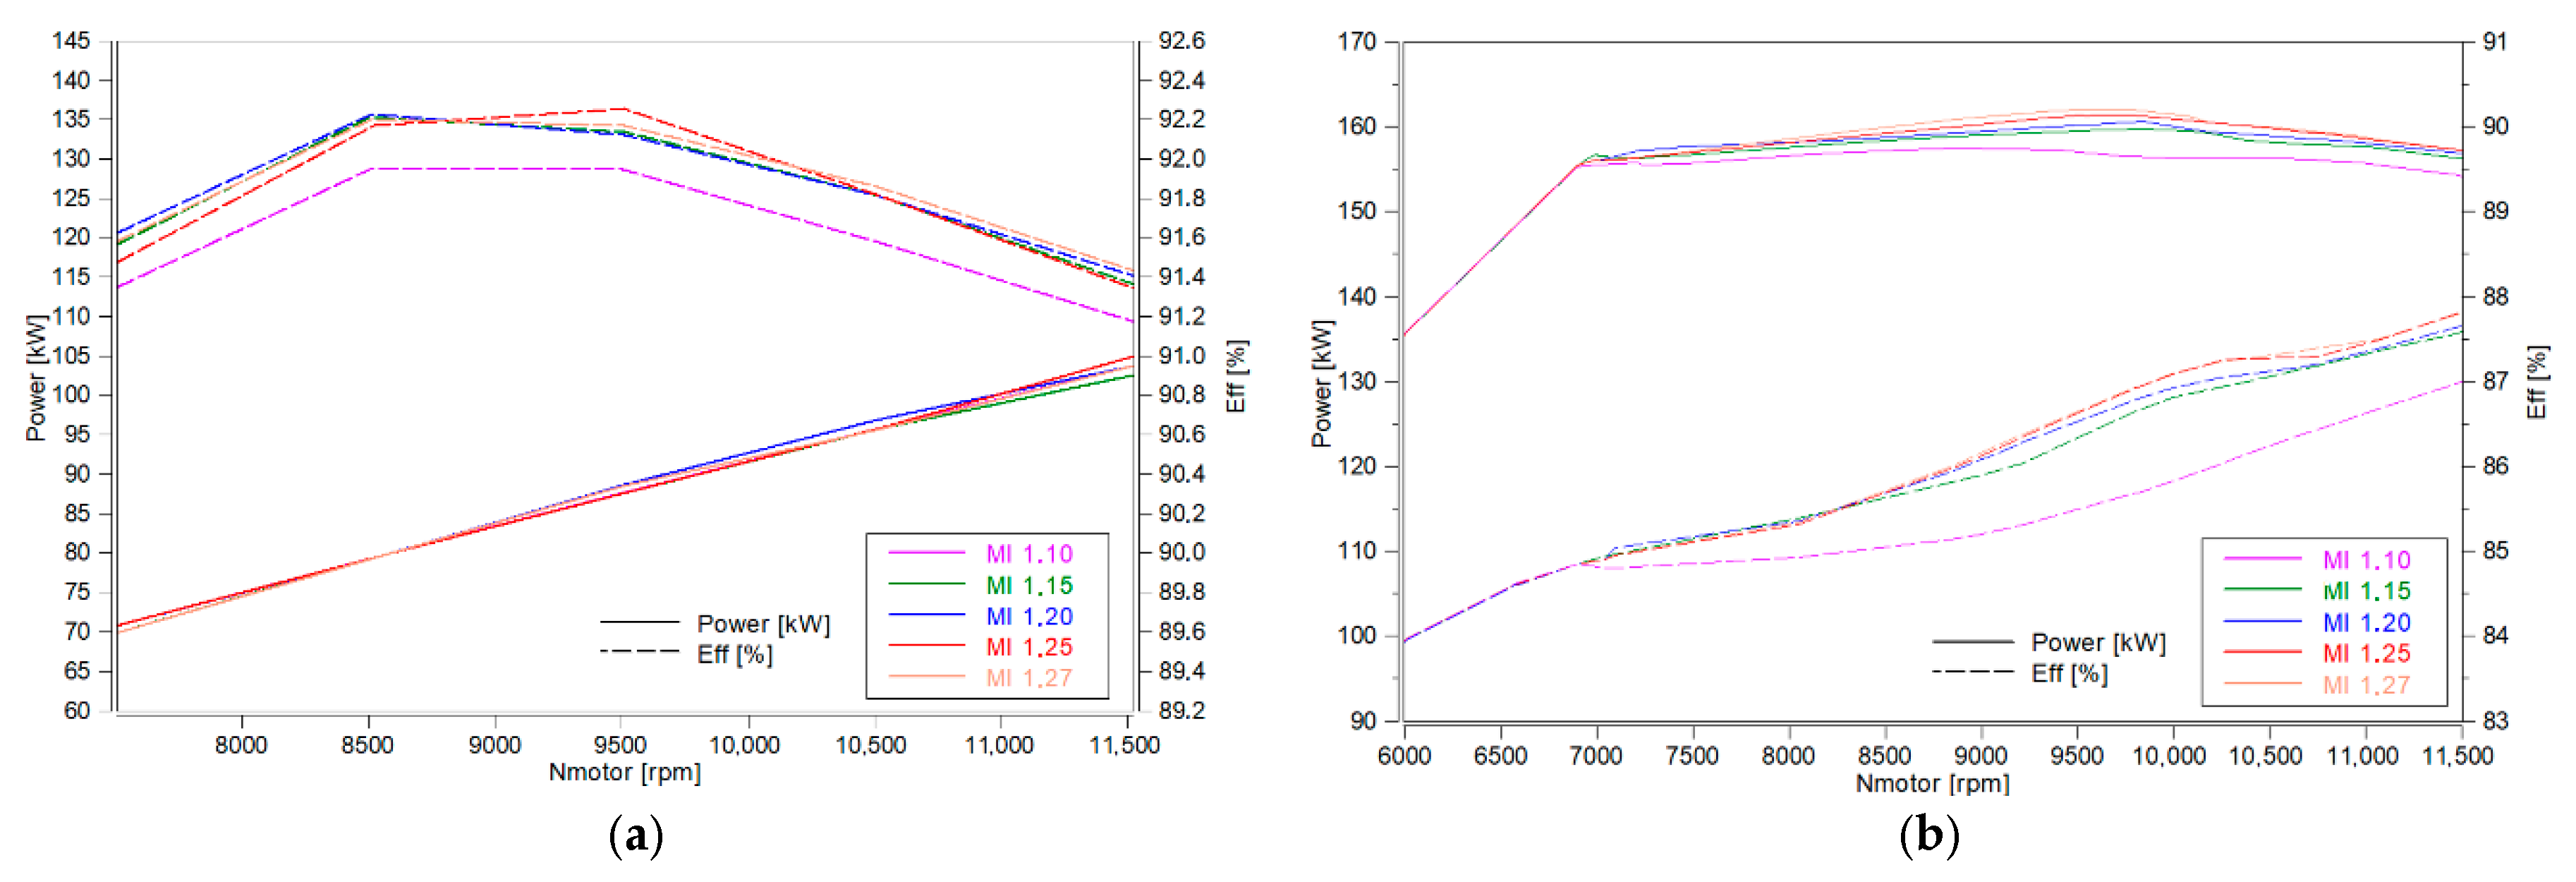
The experimental results show a consistent trend of the optimal MI primarily as a function of motor speed, as illustrated in Figure 13a,b.
From these results, we generated a three-dimensional map of the optimal MI according to motor torque and speed (Figure 14). This map shows that, for the same speed value, the required MI shifts towards higher values when the commanded torque increases, and vice versa. This behavior highlights the need for dynamic and adaptive management of the MI to maximize drive efficiency and power capability across the operating range.

4.1.4. Base Calibration

The i d and i q base maps were generated offline from a conventional SPMSM model, avoiding the need for online iteration. For this to happen, the SA and AO values must be known in advance, which allows the permanent magnet flux to be transferred to a simplified model where it is considered completely aligned with the d axis: λ p m d = λ p m and λ p m q = 0 . In these conditions, i d does not generate torque, and the torque depends only on i q (2). This allows the torque demand to be directly related to the current demand and to obtain a λ p m depending on N m and M e . Thus, the maps are defined as:
i d , b a s e = f M e , N m
i q , b a s e = f M e , N m
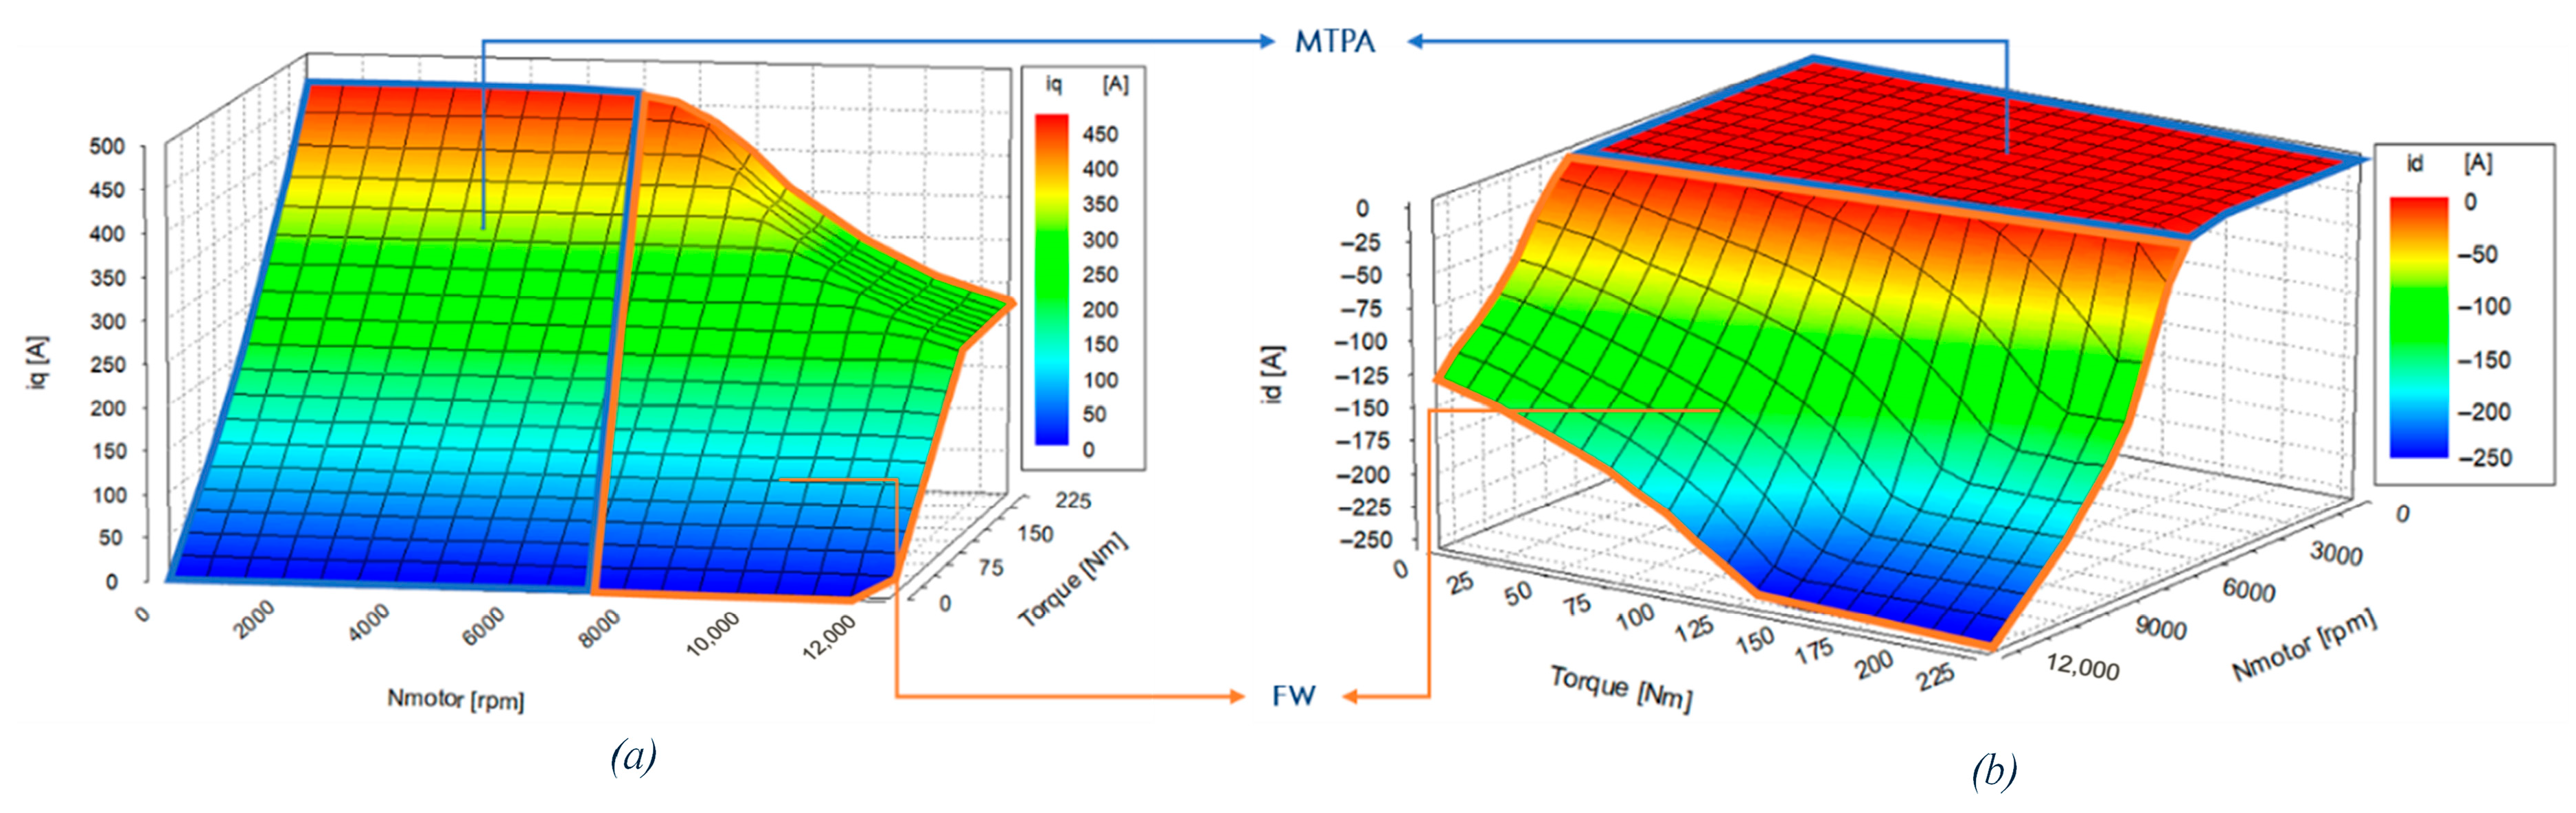
Our calculations were performed under predefined conditions. The minimum operating battery voltage, U D C = 600   V , was selected to allow subsequent application of compensations, while the remaining parameters W T I = 80   ° C ,   R s = 0.0747   Ω ,   I R M S , m a x = 350   A ,   N m , m a x = 12,500   r p m , and M I = 1.15 represent typical operating conditions or system limits. The stator resistance is adjusted according to temperature using a lookup table defined as R s = f W T I . The overall procedure is illustrated in Figure 9, and the resulting maps are presented in Figure 15.
A sweep over speed and torque was performed, with finer steps in regions exhibiting higher current variation. We enforced I m a x and U m a x restrictions, according to the limit of the plane i d - i q (Figure 6b). To build the maps, we started from a LUT of λ p m , obtained for i q = I m a x , and calculated the torque with (2). This LUT allows maps to be generated in MATLAB® (R2024a), sweeping torque demands from zero up to the maximum value.
Depending on the motor operating region, different strategies are employed to compute the optimal current references:
  • MTPA: the torque per unit of total current is maximized according to Equations (13) and (14).
  • FW: CVMT control is used to maximize torque while simultaneously respecting current and voltage limits, maintaining the relationship between u d and u q . Considering (2), (5), (6), and (8), we may derive the following expressions for the calculation of the d- and q-currents in the FW zone under CVMT control strategy:
    o = R s 2 U m a x , p h 2 i q 2 R s 4 i q 2 L 4 ω e 4 λ p m 2 R s 2 ω e 2
    q = L 2 U m a x , p h 2 ω e 2 2 i q 2 L 2 R s 2 ω e 2 2 λ p m i q R s 3 ω e
    r = 2 λ p m i q L 2 R s ω e 3
    i d , F W = o + q r + λ p m L ω e 2 R s 2 + L 2 ω e 2
    i q , F W = M e 3 2 p λ p m
  • MTPV: voltage-limited torque is maximized, with Equations (23) and (24).
This process assumes a maximum linear modulation of 1.15, which is used as input in the base map. This value ensures that the calculated voltages remain within the linear range, and any MI deviation is subsequently corrected in MATLAB/SimulinkTM using offsets.
This approach considers saturation, thermal variation, THD, L ,   p , and N m , m a x . Unlike conventional methods, this uses variable LUTs adapted to each operating point, providing accuracy without the need for online corrections. Everything is calculated under constant conditions for the base map only. These base maps make up the starting point for subsequent online control. It should be noted that in this case, the MTPV zone is not reached, since the value of the injected current does not cross the vertical line that passes through the center of the voltage-limit circumference.

4.1.5. VCU Calibration

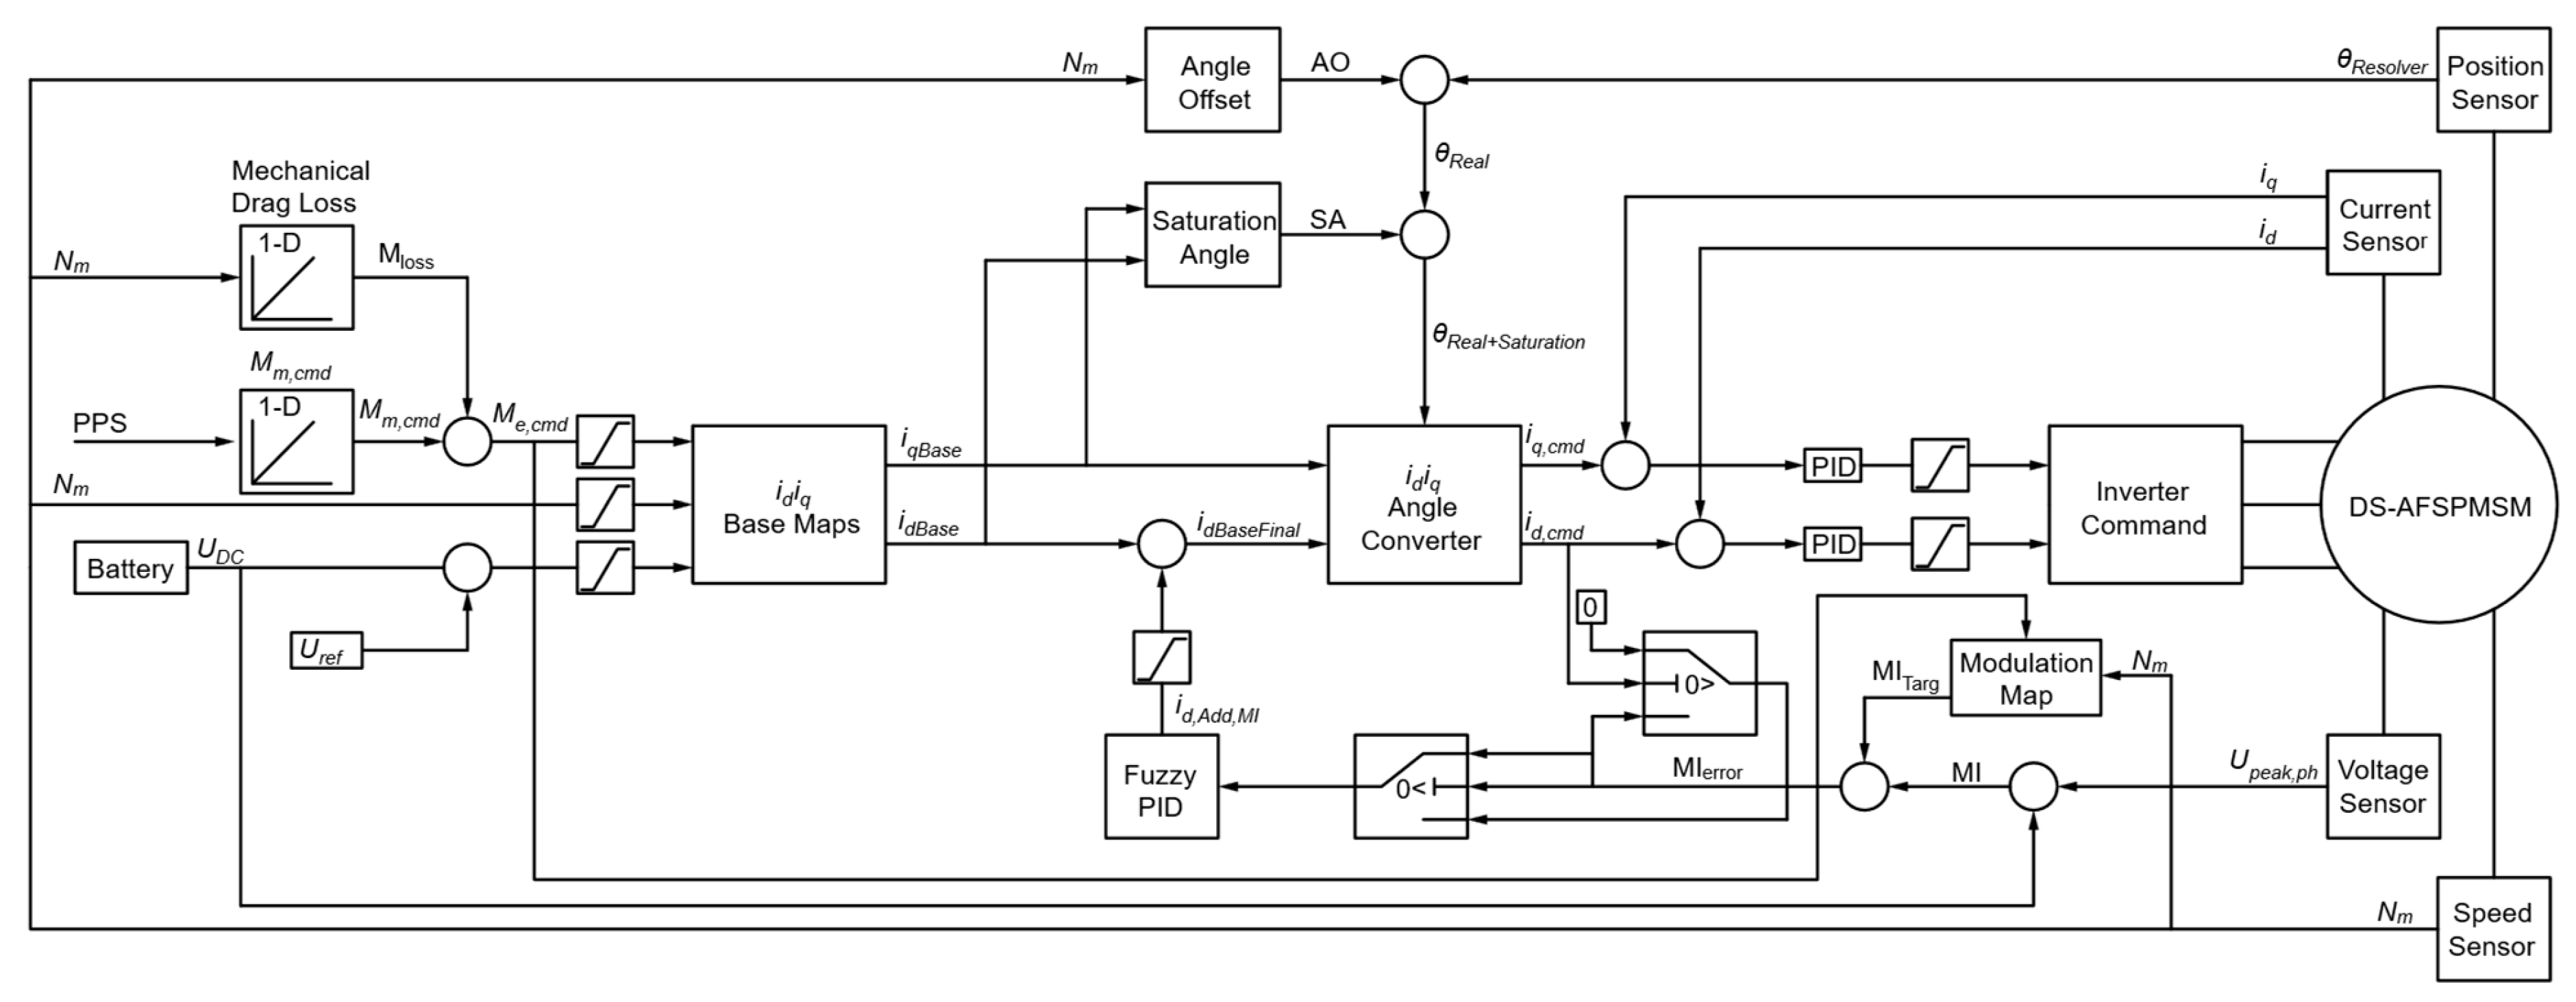
After generating the base maps, the control was implemented in MATLAB/Simulink™ and compiled into the VCU for validation. LUTs remain editable during calibration to improve fit and adaptability. The MI, defined as a target on a 3D surface, is regulated with a Fuzzy-PID. The torque is calculated from the pedal and corrected for mechanical losses. AO, SA, and i d e i q currents are also adjusted using classic PIDs. Figure 16 shows the system diagram.
The diagram shows how the proposed control adapts the commanded currents according to the speed and torque demand. Starting from the base maps, initially defined under constant conditions, we apply the following corrections:
  • Customized torque demand: The pedal sensor value is translated with a LUT that can be adjusted to the driver’s preferences, modulating the system’s response for each percentage of pedal input.
  • Mechanical loss correction (drag): A compensation map ensures that the effective torque on the axis equals the required torque, compensating for internal motor losses.
  • Battery voltage adjustment: A U D C , r e f is used as a basis to compensate for variations in U D C , when BEMF starts to become significant and modifies the rated speed. This dynamically adjusts inputs to the maps, maintaining the transition between zones (MTPA, FW, and MTPV) without misaligning the control.
  • Application of SA and AO: Corrected after the base maps depending on ω e , i d , and i q , which maintains the logical order of the model.
  • MI control: Regulated on the base value with a Fuzzy-PID that optimizes efficiency and anticipates variations. In addition, a feedforward step is included to dynamically pre-adjust the MI according to operating conditions, improving response to quick changes. A M I T a r g is used to adjust the MI LUT.
Finally, PIDs ensure that the actual currents accurately follow the i d and i q references. This architecture enhances both efficiency and robustness under dynamic operating and thermal conditions.

4.2. Experimental Results and Performance Evaluation

The proposed control (PC) validation was performed on a test bench and compared with the implemented baseline control (BC). The BC adopts a simplified strategy that compromises between MTPA and MTPV, following straight horizontal and vertical trajectories (A–B–C in Figure 2b). This simplification neglects flux linkage vector decomposition, parameter nonlinear dependencies, and AO, limiting torque and power exploitation across all speed ranges.
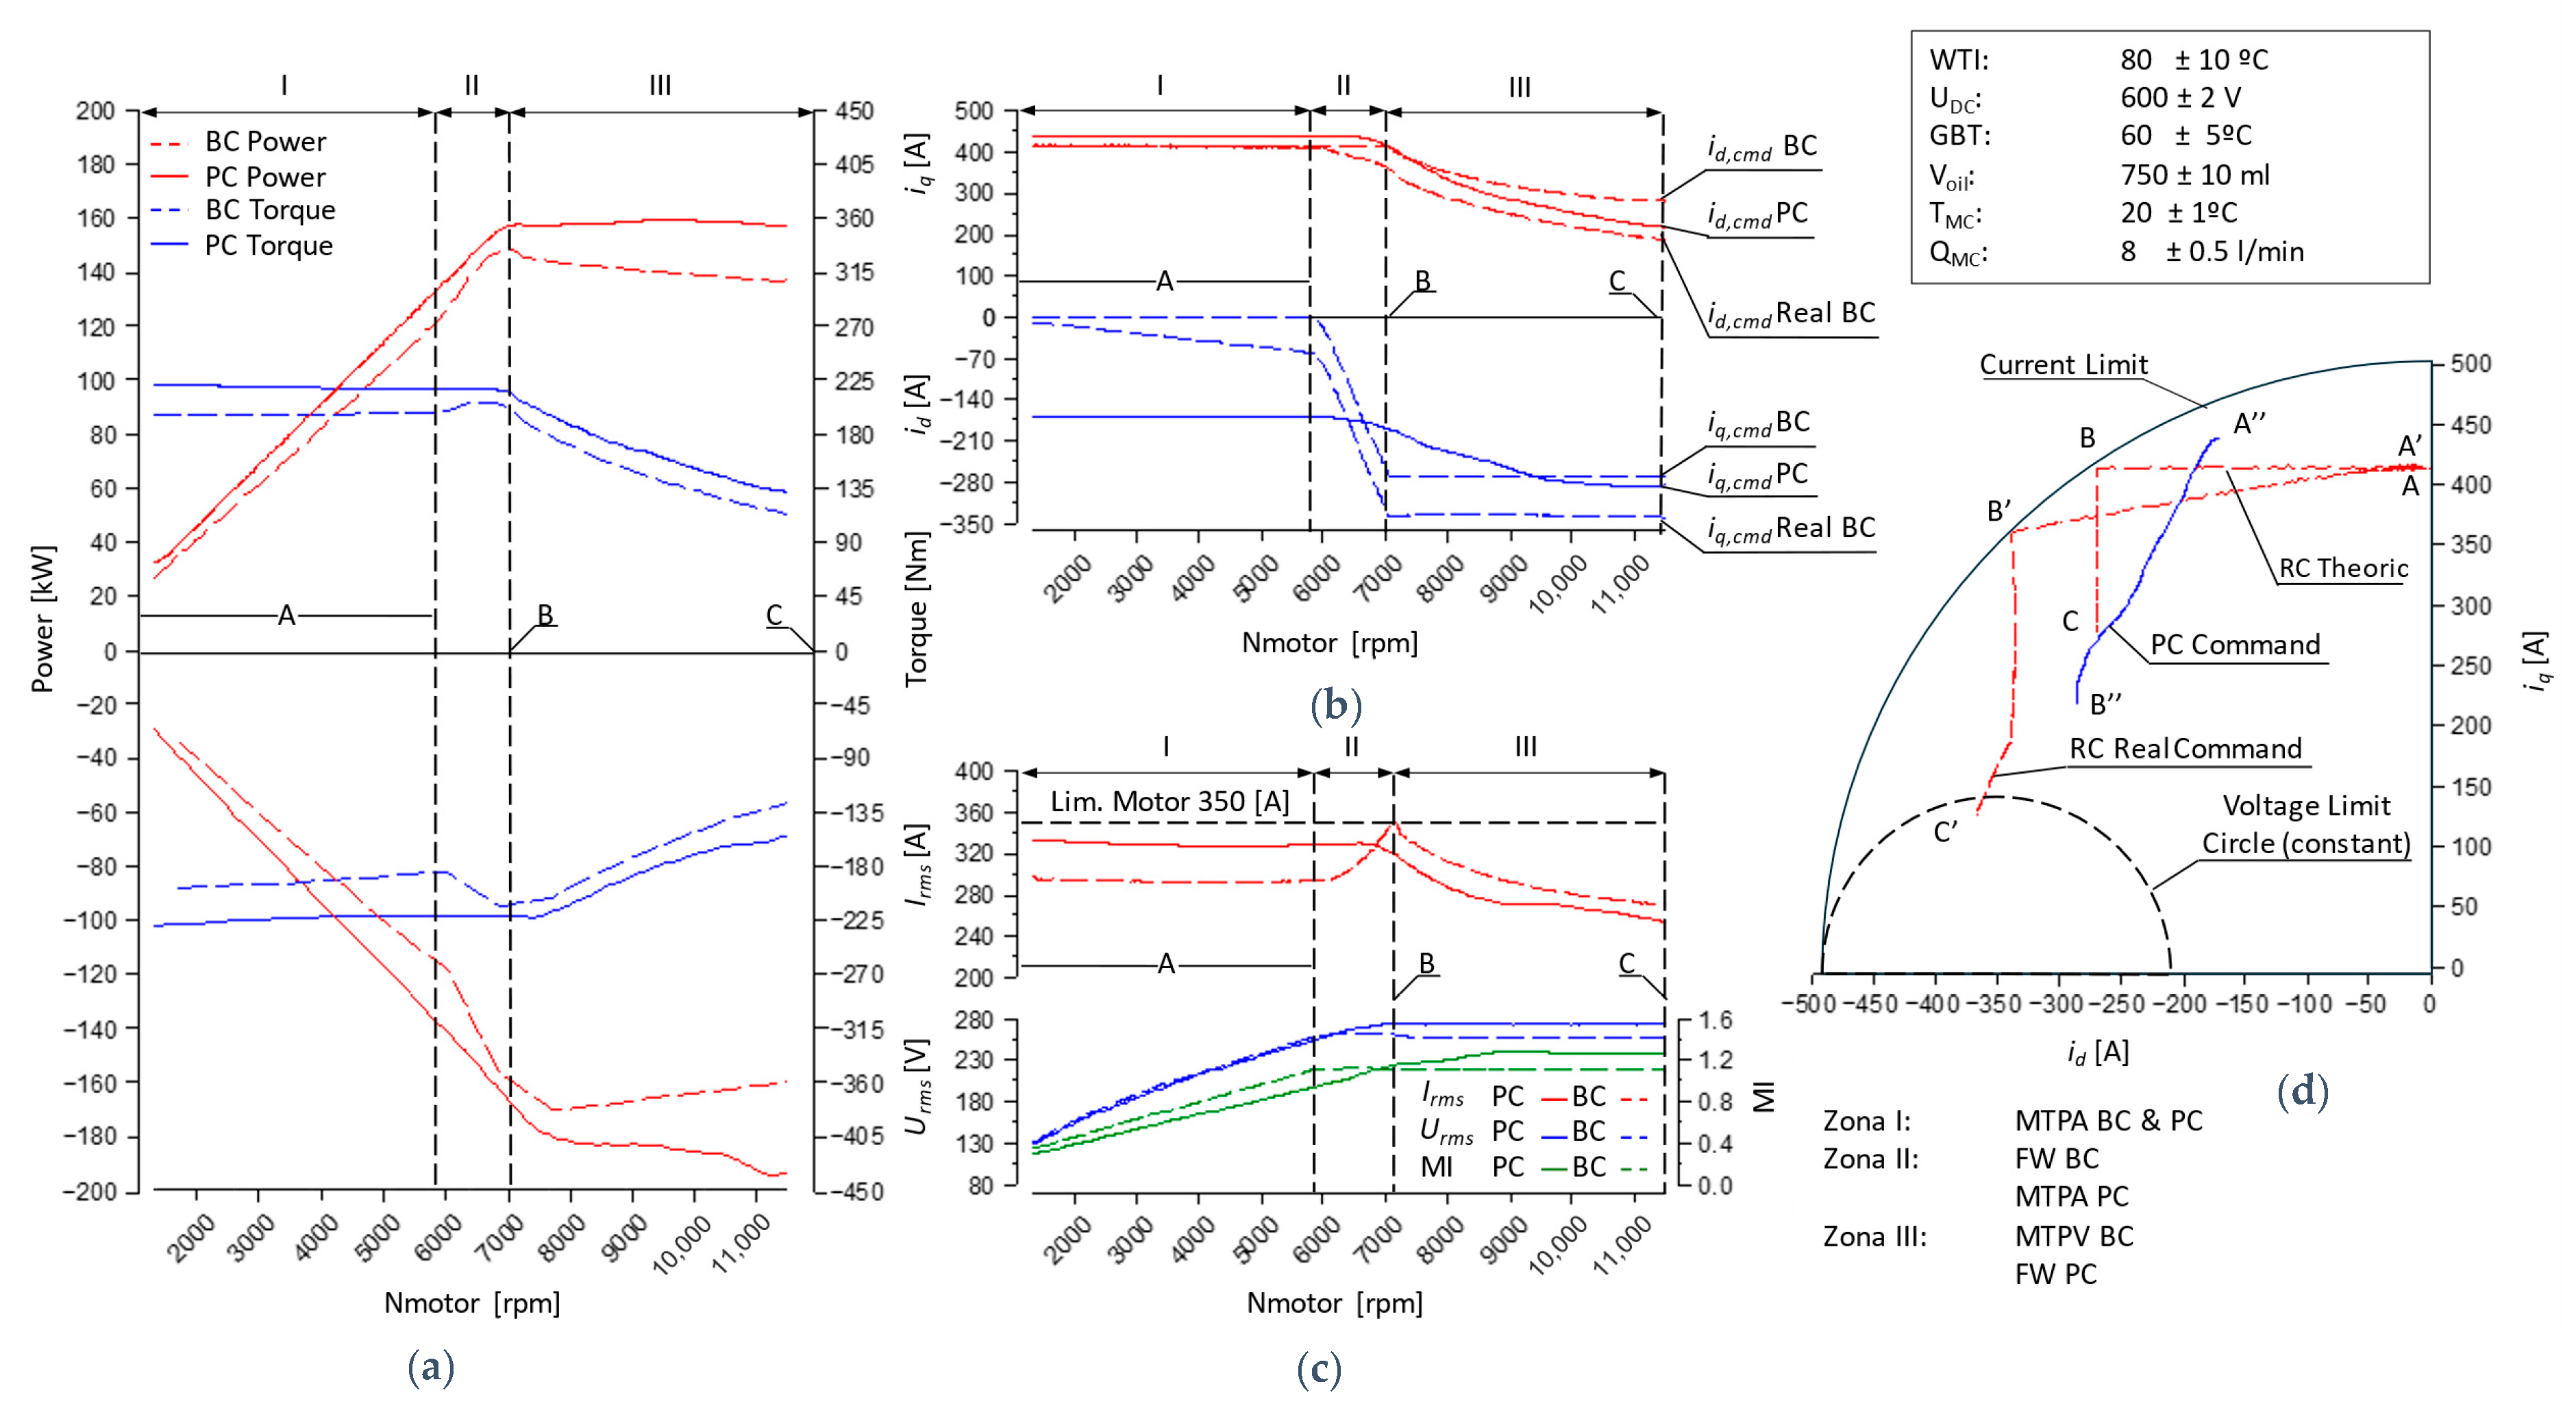
Figure 17 and Figure 18 display the most representative results in traction and regeneration, along with the constant test conditions, shown in the upper right corner of Figure 17. Both BC and PC curves correspond to experimental measurements obtained on the same test unit under identical operating conditions, ensuring a fair comparison. In the BC results, a visible offset appears between commanded and actual torque due to the unresolved AO, while the PC corrects this effect, leading to better alignment between references and measurements.

4.2.1. Behavior at Low Speed

Under low-speed conditions, the PC achieves an increase of up to 13.5% in torque compared to the BC, as shown in Figure 17a, zone I, point A. This improvement is due not only to better use of current, as indicated by the increase in I R M S in Figure 17c, but also to more efficient use. The current approaches the limit, although with a certain margin imposed by the noise present in I p e a k , p h , which is also visible in plane i d - i d , Figure 17d, between point A′′ and the current limit.
Unlike the BC, which in MTPA operates with i d = 0 , the PC distributes the current between i d and i q , as shown in Figure 17b. This is possible because of the consideration of the AO and SA in the implementation. The BC, constrained by horizontal and vertical trajectories, limits the current to 0.84 I m a x in zone I, Figure 17c,d.
The resulting path moves from point A′ (BC) to A′′ (PC), Figure 17d, allowing for greater use of the current limit. The result is an improvement of up to 22.0 Nm in motor mode and 30.0 Nm in generator mode, along with a power increase of 15.4 kW and 21.0 kW, respectively.
In this region, the MI applied by the PC is slightly lower, as shown in Figure 17c, but the effective voltage U R M S remains constant. This indicates better orientation of the voltage vector, since the system is not yet voltage-limited, so the MI does not act as a limiting parameter. In this area, the proposed control (PC) improves the torque up to 13.5% (22.0 Nm) compared to the baseline control (BC). The average improvement is 18.9 Nm, which is an 11.2% increase.

4.2.2. Nominal Zone and Transition to High-Speed Regimes

When approaching the nominal speed, the PC maintains constant torque for longer than the BC, as observed in Figure 17a, in zone II, in transition to point B. This difference is due to dynamic management of the MI, which allows the applied voltage to be increased without altering the current path, as shown in Figure 17c.
In contrast, the BC has already reached the voltage limit and enters FW. Since it does not account for flux linkage vector decomposition and AO, the injection of a nonzero i d produces an additional torque increase, which momentarily pushes the trajectory to the I m a x   circumference, point B′, in Figure 17d. The PC, on the other hand, maintains a margin with respect to I m a x , avoiding unnecessary current increases and ensuring robustness against the noise present in I p e a k , p h .
Thus, the PC continues operating in MTPA, optimizing flux usage without compromising torque. This extension of the MTPA regime delays the rated speed point, allowing maximum torque to be sustained over a wider speed range. As a result, the PC delivers greater operational stability and higher mid-range power.

4.2.3. High Speed

In high-speed mode, the PC maintains constant power of up to 159 kW in motor mode, with an increase of 13.7% compared to BC, as shown in Figure 17a, zone III. This improvement is due to the increase in MI, Figure 17c, and optimized adjustment of the currents i d and i q , Figure 17b. In contrast, the BC i d and i q currents tend to follow vertical trajectories, Figure 17d, instead of adapting to the I m a x   circumference. This simplification reduces the effective operating area and limits the ability to fully exploit the available current margin. Moreover, its performance is restricted by the inverter voltage and by the lack of dynamic compensation such as AO and SA.
This performance is supported not only by the adjustment of the MI, but also by compensation such as SA, AO, and decomposition modeling of λ p m and variability L . Since λ p m is very sensitive to temperature, the optimal MI varies rapidly and must be adjusted accurately. Any change in the MI modifies i d , altering its relationship with i q , and directly affecting the generated torque and voltage. To manage this dynamic, a control with fuzzy logic is used, which is capable of adapting U R M S and maximizing performance without compromising stability.
Only the FW work zone is reached at high speed, since the MTPV zone is not reached. The PC improves power up to 13.7% (19.02 kW) compared to the BC. The average improvement is 12.3 kW, which is an increase of 10.8%.

4.2.4. Regenerative Mode

In the fourth quadrant, the PC maintains symmetry with motor mode, but presents additional advantages inherent to regenerative operation. In this mode, the induced current aligns with the permanent magnet field, reducing the electromagnetic force required and allowing more torque to be generated with less current. Although BEMF is still present, the power flow direction modifies the effective interaction between current and flux, improving energy conversion efficiency. Because of this, the PC achieves higher levels of regeneration than BC, especially at medium and high speeds, as shown in Figure 17a.

4.2.5. Global Efficiency Assessment

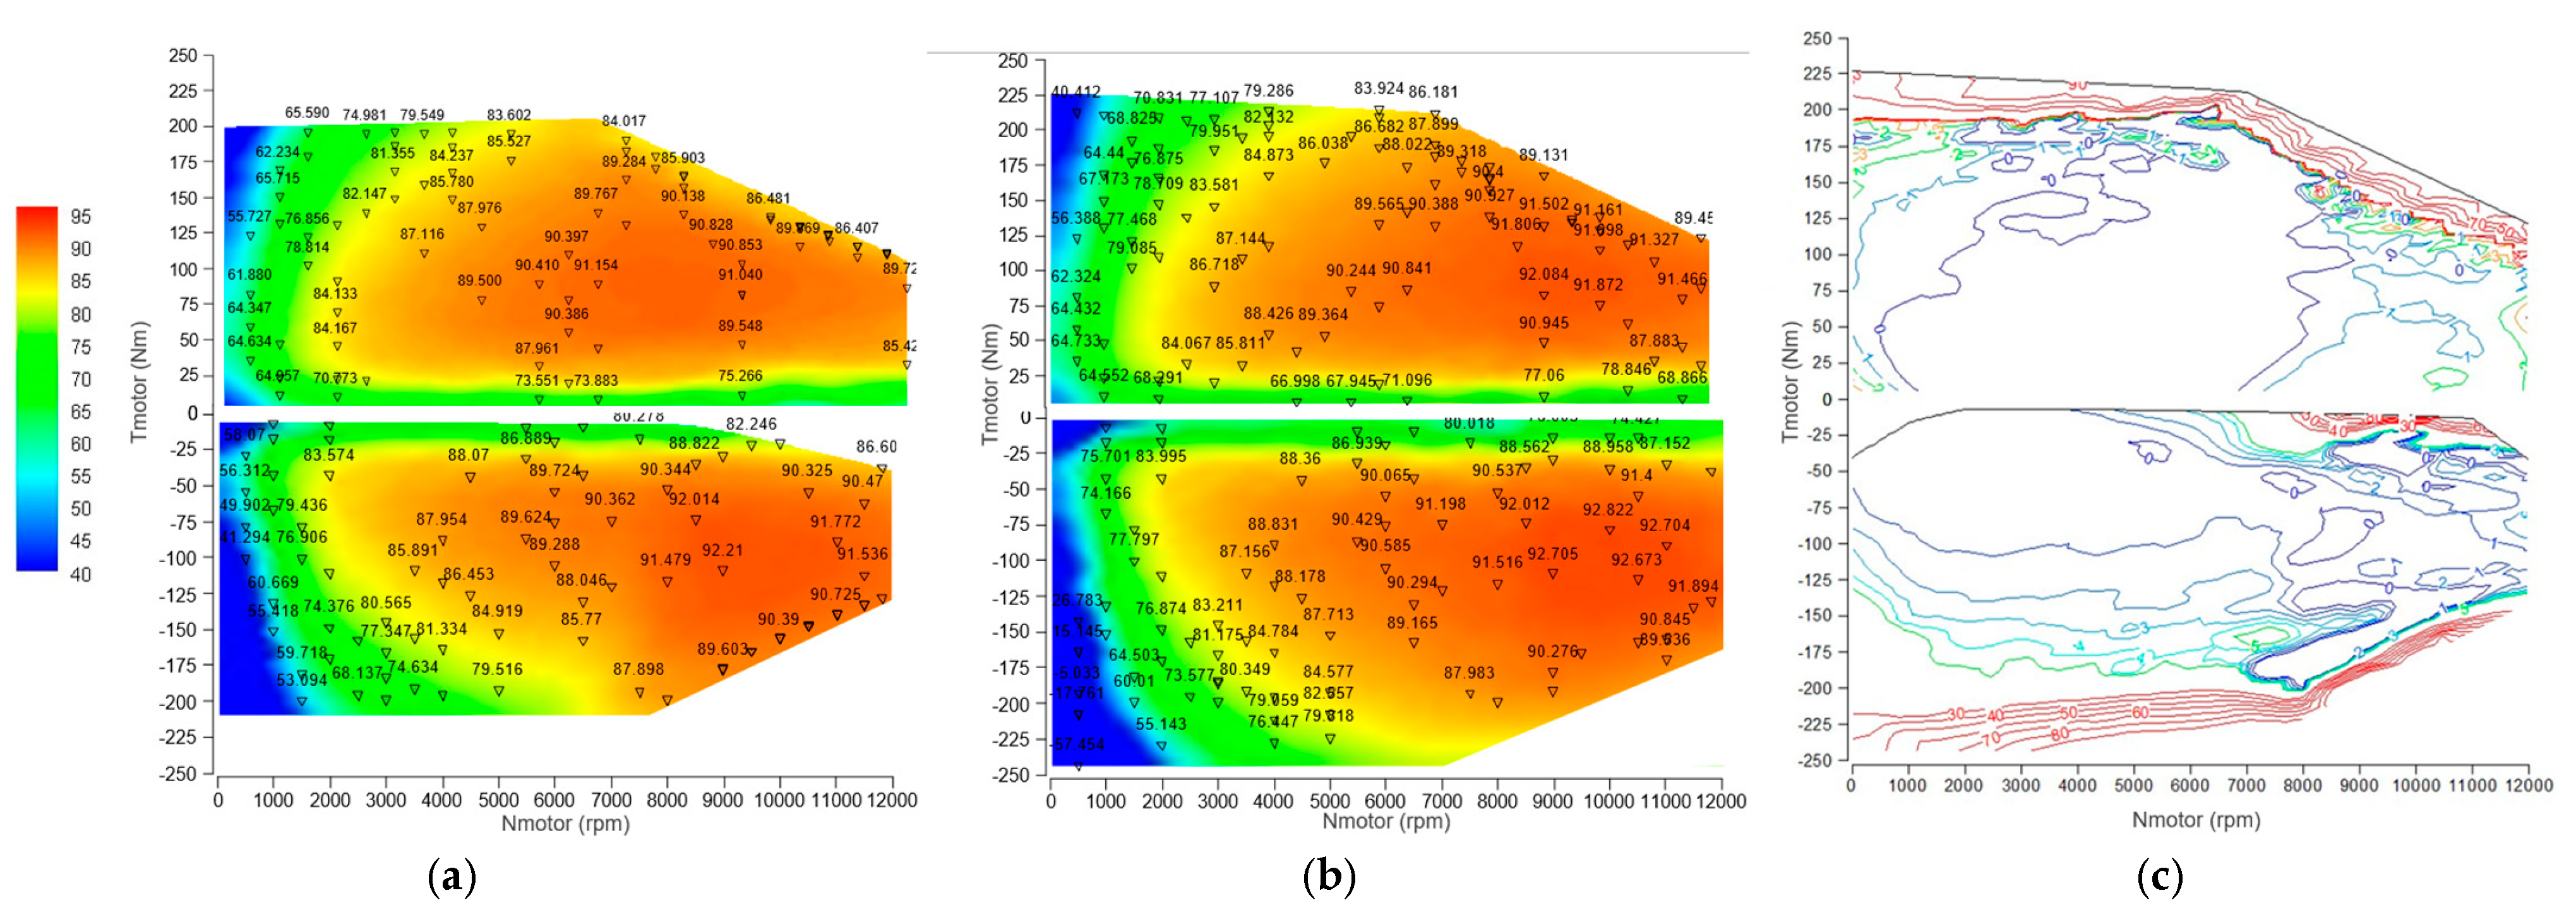
Figure 18 shows the efficiency maps at 600 V for both controls, in motor and generator modes, under the same test conditions as in Figure 17. The PC shows improvements of up to 8.17% efficiency at existing points on the map, especially in high-speed conditions. This gain is due to a reduction in the total injected current, resulting from optimized distribution between i d and i q and using a model that factors in AO, SA, and λ p m and L variables.
Furthermore, the PC enables new operating points previously inaccessible with the BC to be reached by working near the current limit in a stable way, without compromising thermal safety or system stability.

4.2.6. Summary of Results

Table 3 shows maximum improvement, average improvement, and average percentage improvement of torque, power, and efficiency metrics, both in motor and generator modes, at comparable PC points.

4.2.7. Project Limitations

Despite satisfactory results obtained with the proposed control strategy and experimental validation on the test bench, the limitations of this approach should be taken into consideration, as they may affect future developments. The proposed method is particularly relevant in operating regions where magnetic saturation effects are significant, such as medium-to-high load conditions.
The precalculated model used for LUT generation requires detailed characterization of electrical parameters ( λ p m ,   L d ,   L q ,   R s , SA, and AO) under different operating conditions. This process involves a significant investment of time and resources and requires repeating the calibration procedure when applying the method to a different motor.
However, the methodology itself is general and can be applied to other SPMSMs by following the same calibration procedure. The extension to other PMSM topologies is also possible, although additional electromagnetic effects would need to be considered.
Although the control was tested under representative conditions using an active e-Axle test bench with dynamic loads, it has not yet been validated in extended road tests or real-world full-vehicle conditions. This limits the observation of long-term phenomena such as material aging or interactions with other vehicle subsystems.
Under certain conditions, the control cannot be continuously operated at the maximum phase current ( I p e a k , p h ) due to measurement noise and current ripple, which may generate instantaneous current peaks even when the average current remains within limits. This could compromise measurement accuracy and inverter protection margins. Therefore, the current-limit curve cannot be followed up to its theoretical boundary in practical operation.
Furthermore, the thermal model used for the calculation of λ p m is based solely on a fixed inlet temperature (WTI) without considering dynamic thermal evolution or the actual temperature of the magnets, which is the parameter most directly related to the variation of λ p m , as shown in [22]. This thermal simplification may introduce errors under transient or prolonged high-load thermal conditions.

5. Conclusions

This work presents an extended field-oriented control (FOC) strategy for high-performance surface-mounted permanent magnet synchronous motors (SPMSMs), addressing several limitations present in conventional automotive FOC implementations, referred to in this work as baseline control (BC). These approaches typically assume constant inductances, linear permanent magnet flux, temperature-independent resistance, and simplified trajectories in the i d i q plane. The main contribution consists of incorporating the permanent magnet flux linkage vector decomposition under core saturation conditions, together with the consideration of nonlinear dependencies of electrical parameters. This reformulation redefines the i d i q control diagram, generating trajectories that are consistent with the real electromagnetic behavior of the machine. The proposed control (PC) also integrates elements relevant to real applications, such as resolver angle error compensation, thermal variation in stator resistance, and dynamic modulation index management. The proposed approach maintains the structural simplicity of conventional FOC and its feasibility for implementation in automotive control systems. To avoid a significant increase in computational complexity, a hybrid offline–online strategy is adopted, where base maps are generated offline and different nonlinear phenomena are incorporated through experimentally characterized correction terms. The implementation in a vehicle control unit (VCU) enabled the experimental validation of the method in a real electric traction system. The experimental results show significant improvements compared to the baseline control, with torque increases of up to 13.5% at low speeds, an extension of the MTPA operating region, and power increases of up to 13.7% at high speeds. In addition, overall efficiency improvements of approximately 4–8% were observed at different operating points. Overall, these results demonstrate that incorporating flux linkage vector decomposition, together with nonlinear parameter dependencies, allows the classical FOC framework to be extended toward a more realistic representation of the electromagnetic behavior of SPMSMs, improving the utilization of torque, power, and efficiency in electric traction systems. Future research will focus on improving the electromagnetic model characterization, developing more detailed thermal models, and extending the experimental validation under real driving conditions. This includes the analysis of magnetic component aging and the optimization of control performance when operating close to the system current limit.

Author Contributions

Conceptualization, R.R.V., N.B. and J.P.F.; methodology, R.R.V. and N.B.; software, R.R.V. and P.G.R.A.; validation, R.R.V. and P.G.R.A.; formal analysis, R.R.V. and P.G.R.A.; investigation, R.R.V., J.R.V. and P.G.R.A.; resources, N.B. and R.R.V.; data curation, R.R.V. and P.G.R.A.; writing—original draft preparation, R.R.V.; writing—review and editing, R.R.V., P.G.R.A., J.R.V., D.V.T., N.B. and J.P.F.; visualization, R.R.V. and P.G.R.A.; supervision, J.P.F., N.B. and D.V.T.; project administration, J.P.F.; funding acquisition, R.R.V. and J.P.F. All authors have read and agreed to the published version of the manuscript.

Funding

This research was funded by the Galician Innovation Agency (GAIN) under the Industrial PhD Program (IN606D), and was developed in the Automotive Technology Center of Galicia (CTAG) and Universidade de Vigo. AVL Iberica, 28760, Spain, and QEV Technologies, Montmeló (Barcelona), 08160, Spain, have supported this project.

Data Availability Statement

The original contributions presented in the study are included in the article. Further inquiries can be directed to the corresponding authors.

Acknowledgments

The authors wish to express their gratitude to the Galician Innovation Agency (GAIN) for funding and supporting this research work. They would like to sincerely thank the entire CTAG team for their valuable contributions throughout the development of the project, including those colleagues who, although not listed as co-authors, have been instrumental in testing, calibration, and technical support. They also extend their gratitude to the University of Vigo and QEV Technologies for their continued collaboration. Finally, the authors would like to acknowledge the support of Eduardo Elipe and the AVL team, whose experience and technical contributions have had an indirect positive impact on this study.

Conflicts of Interest

Author Nicola Bassan was employed by the company QEV Technologies. The remaining authors declare that the research was conducted in the absence of any commercial or financial relationships that could be construed as a potential conflict of interest.

Nomenclature

A O Angle offset
c f e Iron loss coefficient
E f f Efficiency
f S W Power inverter frequency
G B T Gearbox temperature
G θ Angle gain
i d , i q d and q axis current
i d , A d d , M I i d   added modulation index
i d , b a s e , i q , b a s e d and q axis base current
i d , b a s e F i n a l Final i d base current
i d , c m d , i q , c m d d and q axis commanded current
i d ,   M T P A , i q , M T P A d and q axis current for MTPA zone
i d ,   M T P V , i q , M T P V d and q axis current for MTPV zone
i d , F W , i q , F W d and q axis current for FW zone
i d , c , i q , c d- and q-axis current coordinates of the voltage-limit circle center
i d , l i m Maximum i d current
I m a x Maximum total current
I p e a k , p h Current peak phase
I R M S ,   I R M S , m a x RMS current and maximum RMS
L ,   L d , L q Inductance and inductance of d and q axes, respectively
m Number of phases
M c m d ,   M e , c m d ,   M m , c m d Commanded electromagnetic and mechanical torque
M m , M e , M l o s s ,   M L   Mechanical, electromagnetic, loss and angular momentum torque
M I ,   M I e r r o r ,   M I t a r g Modulation index, error and target
N m ,   N m , m a x , N w Motor speed, maximum motor and tire speed
p Pole pairs
P c u ,   P f e Copper loss and iron loss
P m Mechanical power
P P S Pedal position sensor
Q M C Motor coolant flow
R s Stator resistance
S A Saturation angle
S S a t , M S a t ,   G S a t Saturation slope, torque, and gain
T ,   T M C Temperature and motor coolant temperature
U a ,   U b ,   U c Phase voltage a, b, and c
u d , u q Voltage in d and q axes
U D C , U D C , r e f DC voltage and DC reference
U m a x , p h ,   U p e a k , p h Maximum phase and peak phase voltage
U R M S RMS voltage
U s ,   U s , n e w Phase voltage and new phase voltage
V o i l Oil volume
W T I Winding temperature indicator
β Frequency exponent
θ ,   θ n e w Phase angle and new phase angle
θ R e s o l v e r , θ R e a l Resolver angle and real angle
θ R e s o l v e r + R e a l Real angle plus resolver angle
λ d , λ q Flux linkage in d and q axes
λ p m , λ p m d , λ p m q Total PM flux linkage and PM flux linkage in d and q axes
ω m , ω e , ω e b a s e Mechanical, electrical, and rated speeds

References

  1. Allca-Pekarovic, A.; Kollmeyer, P.; Forsyth, A.; Emadi, A. Experimental Characterization and Modeling of a YASA P40 Axial Flux PM Traction Machine for Electric Vehicles. In Proceedings of the 2022 IEEE/AIAA Transportation Electrification Conference and Electric Aircraft Technologies Symposium (ITEC+EATS), Anaheim, CA, USA, 15–17 June 2022. [Google Scholar] [CrossRef] [Scilit]
  2. Candelo-Zuluaga, C.; Riba, J.; García, A. PMSM Parameter Estimation for Sensorless FOC Based on Differential Power Factor. IEEE Trans. Instrum. Meas. 2021, 70, 11504241. [Google Scholar] [CrossRef] [Scilit]
  3. Rallabandi, V.; Badewa, O.A.; Ozpineci, B.; Ionel, D.M. A Comparison of Outer Rotor Radial and Axial Flux Machines for Application in Electric Vehicles. In Proceedings of the 2023 IEEE International Electric Machines & Drives Conference (IEMDC), San Francisco, CA, USA, 15–18 May 2023. [Google Scholar] [CrossRef] [Scilit]
  4. Wang, T.; Zhu, Z.; Amaral, N.M.; Wu, Z.; Odavic, M.; Foster, M. Multivariable Generalised Predictive Control with Measurement Noise Rejection and Speed Ripple Mitigation for PMSM Drives. IET Power Electron. 2020, 13, 2607–2617. [Google Scholar] [CrossRef] [Scilit]
  5. Wu, J.X.; Wang, K.; Wang, T.; Li, J. Interleaved Generalized Predictive Control for Dual Three-Phase PMSM with Low Computation Burden. In Proceedings of the 2022 25th International Conference on Electrical Machines and Systems (ICEMS), Chiang Mai, Thailand, 21 December 2022. [Google Scholar] [CrossRef] [Scilit]
  6. Zhao, M.; Cao, Y.; Li, C.; Wang, Z.; Shi, T.; Xia, C. Expanded Limit Boundary Explicit Model Predictive Direct Speed Control for PMSMs. IEEE Trans. Power Electron. 2024, 39, 6089–6101. [Google Scholar] [CrossRef] [Scilit]
  7. Li, C.; Zhang, W.; Gao, J.; Huang, S. Permanent Magnet Flux Linkage Analysis and Maximum Torque per Ampere (MTPA) Control of High Saturation IPMSM. Energies 2023, 16, 4717. [Google Scholar] [CrossRef] [Scilit]
  8. Wang, G.; Zhang, G.; Xu, D. Position Sensorless Control Technues for Permanent Magnet Synchronous Machine Drives; Springer: Singapore, 2020; pp. 2–10. [Google Scholar] [CrossRef] [Scilit]
  9. Sul, S.K. Motor Drive and Sensorless Control; 3rd Asian PhD School on Advanced Power Electronics: Chengdu, China, 2021. [Google Scholar]
  10. Lu, Y.; Yao, P.; Wang, B.; Feng, G. Multi-Virtual Signal Injection for Maximum Torque per Ampere Control of Interior PMSM Considering Magnetic Saturation. In Proceedings of the 2022 China Automation Congress (CAC), Xiamen, China, 25–27 November 2022. [Google Scholar] [CrossRef] [Scilit]
  11. Datlinger, C.; Hirz, M. Benchmark of Rotor Position Sensor Technologies for Application in Automotive Electric Drive Trains. Electronics 2020, 9, 1063. [Google Scholar] [CrossRef] [Scilit]
  12. Hu, D.; Xu, L. Characterizing the Torque Lookup Table of an IPM Machine for Automotive Application. In Proceedings of the 2014 IEEE Conference and Expo Transportation Electrification Asia-Pacific (ITEC Asia-Pacific), Beijing, China, 31 August–3 September 2014. [Google Scholar] [CrossRef] [Scilit]
  13. Mansouri, B.; Piaton, J. Magnetic Saturation Aids Flux-Weakening Control: Using Lookup Tables Based on a Static Method of Identification for Nonlinear Permanent-Magnet Synchronous Motors. IEEE Electrific. Mag. 2017, 5, 53–61. [Google Scholar] [CrossRef] [Scilit]
  14. Meesala, R.E.K.; Athikkal, S.; Pradhan, P.; Prasad, S.; Prasad, A. Modified Direct Torque Control of PMSM Drive for Electric Vehicle Application. In Proceedings of the 2021 IEEE Madras Section Conference (MASCON), Chennai, India, 27–28 August 2021. [Google Scholar] [CrossRef] [Scilit]
  15. Wang, T.; Wang, J.; Guan, W.; Liu, C.; Chen, Y.; Chen, Z.; Luo, G. Data-Driven Based Hybrid Predictive Model for the PMSM Drive System. In Proceedings of the 2023 IEEE International Conference on Predictive Control of Electrical Drives and Power Electronics (PRECEDE), Wuhan, China, 16–19 June 2023. [Google Scholar] [CrossRef] [Scilit]
  16. Lu, Y.; Huang, K.; Wang, B.; Lai, C.; Feng, G. Data-Driven Modeling and Compensation Strategy of PMSM Considering Core Loss and Saturation. IEEE J. Emerg. Sel. Top. Power Electron. 2024, 12, 1894–1905. [Google Scholar] [CrossRef] [Scilit]
  17. Bharath Kumar, N.; Vijay Babu, A.R.; Ganesh Babu, V.; Bala Anil Kumar, M.; Sai Kumar, T. Hybrid digital twin-based fault diagnosis framework for PMSMs in electric vehicle applications. Franklin Open 2025, 12, 100328. [Google Scholar] [CrossRef] [Scilit]
  18. Gao, J.; Luo, J.; Yin, S.; Gong, C.; Wang, S.; Zhang, G. Adaptive digital twin framework for PMSM thermal safety monitoring: Integrating Bayesian self-calibration with hierarchical physics-aware network. Machines 2026, 14, 138. [Google Scholar] [CrossRef] [Scilit]
  19. Lukman, G.F.; Lee, C. Towards Digital Twin Modeling and Applications for Permanent Magnet Synchronous Motors. Energies 2025, 18, 956. [Google Scholar] [CrossRef] [Scilit]
  20. Gierczynski, M.; Jakubowski, R.; Kupiec, E.; Niewiara, L.J.; Tarczewski, T.; Grzesiak, L.M. Identification of the Parameters of the Highly Saturated Permanent Magnet Synchronous Motor (PMSM): Selected Problems of Accuracy. Energies 2024, 17, 6096. [Google Scholar] [CrossRef] [Scilit]
  21. Fan, Y.; Ma, H.; Zhu, G.; Luo, J. Improved MTPA and MTPV Optimal Criteria Analysis Based on IPMSM Nonlinear Flux-Linkage Model. Energies 2024, 17, 3494. [Google Scholar] [CrossRef] [Scilit]
  22. Rodríguez, R.; Rivas, J.; Porteiro, J.; Villanueva, D.; Bassan, N. Experimental Characterization and 1D Simulation of an EV Drivetrain System with a Double-Stator Axial Flux SPMSM. IEEE Trans. Veh. Technol. 2025, 74, 3666–3680. [Google Scholar] [CrossRef] [Scilit]
  23. Shi, Y.; Chai, J.; Sun, X.; Mu, S. Detailed Description and Analysis of the Cross-Coupling Magnetic Saturation on Permanent Magnet Synchronous Motor. J. Eng. 2018, 17, 1855–1859. [Google Scholar] [CrossRef] [Scilit]
  24. Akagi, H.; Nabae, A. The p–q Theory in Three-Phase Systems under Non-Sinusoidal Conditions. Eur. Trans. Electr. Power 1993, 3, 27–31. [Google Scholar] [CrossRef] [Scilit]
  25. Pellegrino, G.; Vagati, A.; Boazzo, B. Performance Comparison Between Surface-Mounted and Interior PM Motor Drives for Electric Vehicle Application. IEEE Trans. Ind. Electron. 2012, 59, 803–811. [Google Scholar] [CrossRef] [Scilit]
  26. Chen, P.; Luo, Y.; Zhang, L.; Wang, X.; Chen, Y. PMSM Speed Ripple Suppression Due to Current Measurement Error Using Quasi-Fractional Resonant-Normalized Extended State Observer. IEEE Trans. Control Syst. Technol. 2025, 33, 554–565. [Google Scholar] [CrossRef] [Scilit]
  27. Klinachev, N.V.; Kuleva, N.Y. Control of Synchronous Motors with a Voltage Lower than the Counter-EMF. In Proceedings of the 2018 International Russian Automation Conference (RusAutoCon), Sochi, Russia, 9–16 September 2018. [Google Scholar] [CrossRef] [Scilit]
  28. Dalal, A.; Sreejeth, M. Wide Speed Range Control of PMSM Based on MTPA and Flux-Weakening Control. In Proceedings of the 2023 International Conference on Power, Instrumentation, Control and Computing (PICC), Thrissur, India, 19–21 April 2023. [Google Scholar] [CrossRef] [Scilit]
  29. Sepulchre, L.; Fadel, M.; Pietrzak-David, M.; Porte, G. New High Speed PMSM Flux-Weakening Strategy. In Proceedings of the 2016 19th International Conference on Electrical Machines and Systems (ICEMS), Chiba, Japan, 13–16 November 2016; Available online: https://ut3-toulouseinp.hal.science/hal-03545045v1/document (accessed on 23 March 2026).
  30. Ni, R.; Xu, D.; Wang, G.; Ding, L.; Zhang, G.; Qu, L. Maximum Efficiency Per Ampere Control of Permanent-Magnet Synchronous Machines. IEEE Trans. Ind. Electron. 2015, 62, 2135–2143. [Google Scholar] [CrossRef] [Scilit]
  31. Miguel-Espinar, C.; Heredero-Peris, D.; Gross, G.; Llonch-Masachs, M.; Montesinos-Miracle, D. Maximum Torque per Voltage Flux-Weakening Strategy with Speed Limiter for PMSM Drives. IEEE Trans. Ind. Electron. 2021, 68, 9254–9264. [Google Scholar] [CrossRef] [Scilit]
  32. Zhao, X.; Chang, C.; Phukan, R.; Burgos, R.; Uicich, S.; Asfaux, P.; Dong, D. An Enhanced Modulation Scheme for Multi-Level T-Type Inverter with Loss Balance and Reduction. IEEE Trans. Power Electron. 2023, 38, 14050–14064. [Google Scholar] [CrossRef] [Scilit]
  33. Zanelli, A.; Kullick, J.; Eldeeb, H.; Frison, G.; Hackl, C.; Diehl, M. Continuous Control Set Nonlinear Model Predictive Control of Reluctance Synchronous Machines. IEEE Trans. Control Syst. Technol. 2022, 30, 130–141. [Google Scholar] [CrossRef] [Scilit]
  34. Bolognani, S.M. Novel Digital Continuous Control of SVM. IEEE Trans. Ind. Appl. 1997, 33, 525–530. [Google Scholar] [CrossRef] [Scilit]
  35. Choi, K.; Kim, Y.; Kim, K.; Kim, S. Real-Time Optimal Torque Control of Interior Permanent Magnet Synchronous Motors Based on a Numerical Optimization Technique. IEEE Trans. Control Syst. Technol. 2021, 29, 1815–1822. [Google Scholar] [CrossRef] [Scilit]
  36. Park, J.-H.; Lim, H.-S.; Lee, G.-H.; Lee, H.-H. A Study on the Optimal Control of Voltage Utilization for Improving the Efficiency of PMSM. Electronics 2022, 11, 2095. [Google Scholar] [CrossRef] [Scilit]
  37. Kim, M.-H.; Kim, D.-Y.; Lee, J.Y.J. Accuracy Improvement in Resolver Offset Detection Based on Angle Tracking Observer with Coordinate Transformation. Electronics 2021, 10, 1643. [Google Scholar] [CrossRef] [Scilit]
Figure 1. (a) Representation of torque, power, resulting current, resulting voltage, and flux according to MTPA control, flux weakening, and MTPV paths, relative to speed. (b) Representation of the control paths according to direct and quadrature currents under baseline control with invariable inductance without considering the PM flux linkage vector decomposition.
Energies 19 01690 g001
Figure 2. Baseline FOC SPMSM and its operating region and boundaries. (a) Control path for a given torque different from the maximum. (b) Examples of the simplification applied in the implementation of the baseline FOC, prioritizing MTPA (orange) and MTPV (green).
Energies 19 01690 g002
Figure 3. Effect of modulation index on output voltage. (a) Variation in fundamental components of output voltage according to modulation index. (b) Bolognani overmodulation technique: angular adjustment of output vector to maximize usable voltage within the modulation hexagon.
Energies 19 01690 g003
Figure 4. Conceptual illustration of flux linkage vector behavior in SPMSMs under linear and saturated conditions: (a) linear magnetic conditions (no saturation), and (b) saturated magnetic conditions with armature reaction effects.
Energies 19 01690 g004
Figure 5. Phasor diagram of an SPMSM under flux linkage vector decomposition caused by core saturation. The permanent magnet flux linkage λ p m is decomposed into direct-axis ( λ p m d ) and quadrature-axis ( λ p m q ) components, together with voltage and current phasors in steady-state operation.
Energies 19 01690 g005
Figure 6. Comparison of control trajectories in the i d i q plane for the baseline FOC (a) and the proposed extended FOC (b). The baseline model assumes d-axis aligned permanent magnet flux and constant inductances, which results in horizontal constant-torque curves and a fixed voltage-limit center, as well as vertical and horizontal control trajectories for implementation simplicity. When flux decomposition and nonlinear flux-linkage and inductance variability are considered, curvature appears in the constant-torque curves, and the voltage-limit center shifts. Consequently, the control trajectories adopt nonlinear shapes consistent with the real physical constraints of the machine.
Energies 19 01690 g006
Figure 7. Modulation index selection strategy according to operation zone.
Energies 19 01690 g007
Figure 8. Unit under test (UUT). (a) Assembly on the test bench. (b) Computer-aided design and drafting (CAD). (c) Exploded view of the DS-AFSPMSM’s structure.
Energies 19 01690 g008
Figure 9. Block diagram of the proposed dual-architecture control: experimental characterization, pre-calculation, VCU execution, and integration with the UUT.
Energies 19 01690 g009
Figure 10. Angle offset representation. (a) Comparison between BEMF waveform, inverter output current, and position estimated by the resolver, showing an angular offset. (b) Effect of angle offset on the i d and i q vectors in the reference plane, showing how an incorrect angle reading generates a translation relative to the real axis.
Energies 19 01690 g010
Figure 12. Evolution of the saturation angle according to i d and i q obtained experimentally. The λ p m angle increases with the injection of i q , reflecting a greater transverse saturation, while i d contributes to the demagnetization effect, which helps to reduce the angle.
Energies 19 01690 g012
Figure 13. Power and efficiency as a function of motor speed. (a) Static test at 40% load. (b) Dynamic test at 100% load.
Energies 19 01690 g013
Figure 14. 3D map of the optimal modulation index according to torque and motor speed.
Energies 19 01690 g014
Figure 15. Current base maps: (a) quadrature component i q , and (b) direct component i d , depending on N m and M e .
Energies 19 01690 g015
Figure 16. Simplified diagram of VCU control implemented in MATLAB/SimulinkTM.
Energies 19 01690 g016
Figure 17. Comparative experimental results between the implemented baseline control (BC) and the proposed new control (PC) on a test unit. (a) Demanded and real torque and power in motor and generator mode dependent on motor speed. (b) Direct and quadrature axis current dependent on motor speed. (c) RMS current and voltage, as well as MI, are dependent on motor speed. (d) Control path dependent on i d and i q and operating region with limits.
Energies 19 01690 g017
Figure 18. Efficiency maps at 600 V for both control schemes. (a) Efficiency measured in motor and generator modes with baseline control (BC). (b) Efficiency corresponding to the proposed control (PC), showing greater usage of available current and voltage. (c) Direct comparison between both maps, which shows improvements of up to 8.17% at existing points and new operating zones accessible only with the PC.
Energies 19 01690 g018
Table 2. Characteristics of the electric drivetrain system.
ComponentParameter [Unit]Value
MotorType [-]DS-AFSPMSM
No. of poles [-]5
Voltage [V]600–800
Peak current [Arms]350
Continuous/peak torque (@600 [V]) [Nm]110/230
Continuous/peak power (@600 [V]) [kW]75/147
Peak power time [s]20
Maximum speed [rpm]12,500
InverterPeak power time [s]20
Based speed (@600 [V]) [rpm]6000
Maximum speed [rpm]12,500
Efficiency [%]≥96
Peak power (@600/700/800 [V]) [kW]200/235/270
Vehicle control unitMicro control core32-bit SAK-TC377TP-96F300S AA
Maximum frequency [MHz]300
Flash/SRAM [MB]6/1.1
Analog/digital input14/18
CAN4
Control typeSimulinkTM (R2024a)
GearboxRatio [-]8.6
DifferentialTypePlate LSD
Ramps [º]//FF[-]//Pre-Load [Nm]35/60//4 + 4//50
Table 3. Summary of improvements in the proposed control (PC) relative to baseline control (BC) in motor and generator modes.
ModeMetricMax ImprovementAverage Improvement
MotorTorque+13.51%+11.20% (+18.86 Nm)
Power+13.69%+10.82% (+12.33 kW)
Efficiency+5.10%+1.05%
GeneratorTorque+18.53%+12.50% (+22.83 Nm)
Power+21.15%+12.12% (+15.62 kW)
Efficiency+8.17%+1.76%
Disclaimer/Publisher’s Note: The statements, opinions and data contained in all publications are solely those of the individual author(s) and contributor(s) and not of MDPI and/or the editor(s). MDPI and/or the editor(s) disclaim responsibility for any injury to people or property resulting from any ideas, methods, instructions or products referred to in the content.